The ectodomains determine ligand function in vivo and selectivity of DLL1 and DLL4 toward NOTCH1 and NOTCH2 in vitro
- Medizinische Hochschule Hannover, Germany
- Harvard Medical School, Massachusetts
- Dana Farber Cancer Institute, Massachusetts
Figures
Figure 1 with 3 supplements
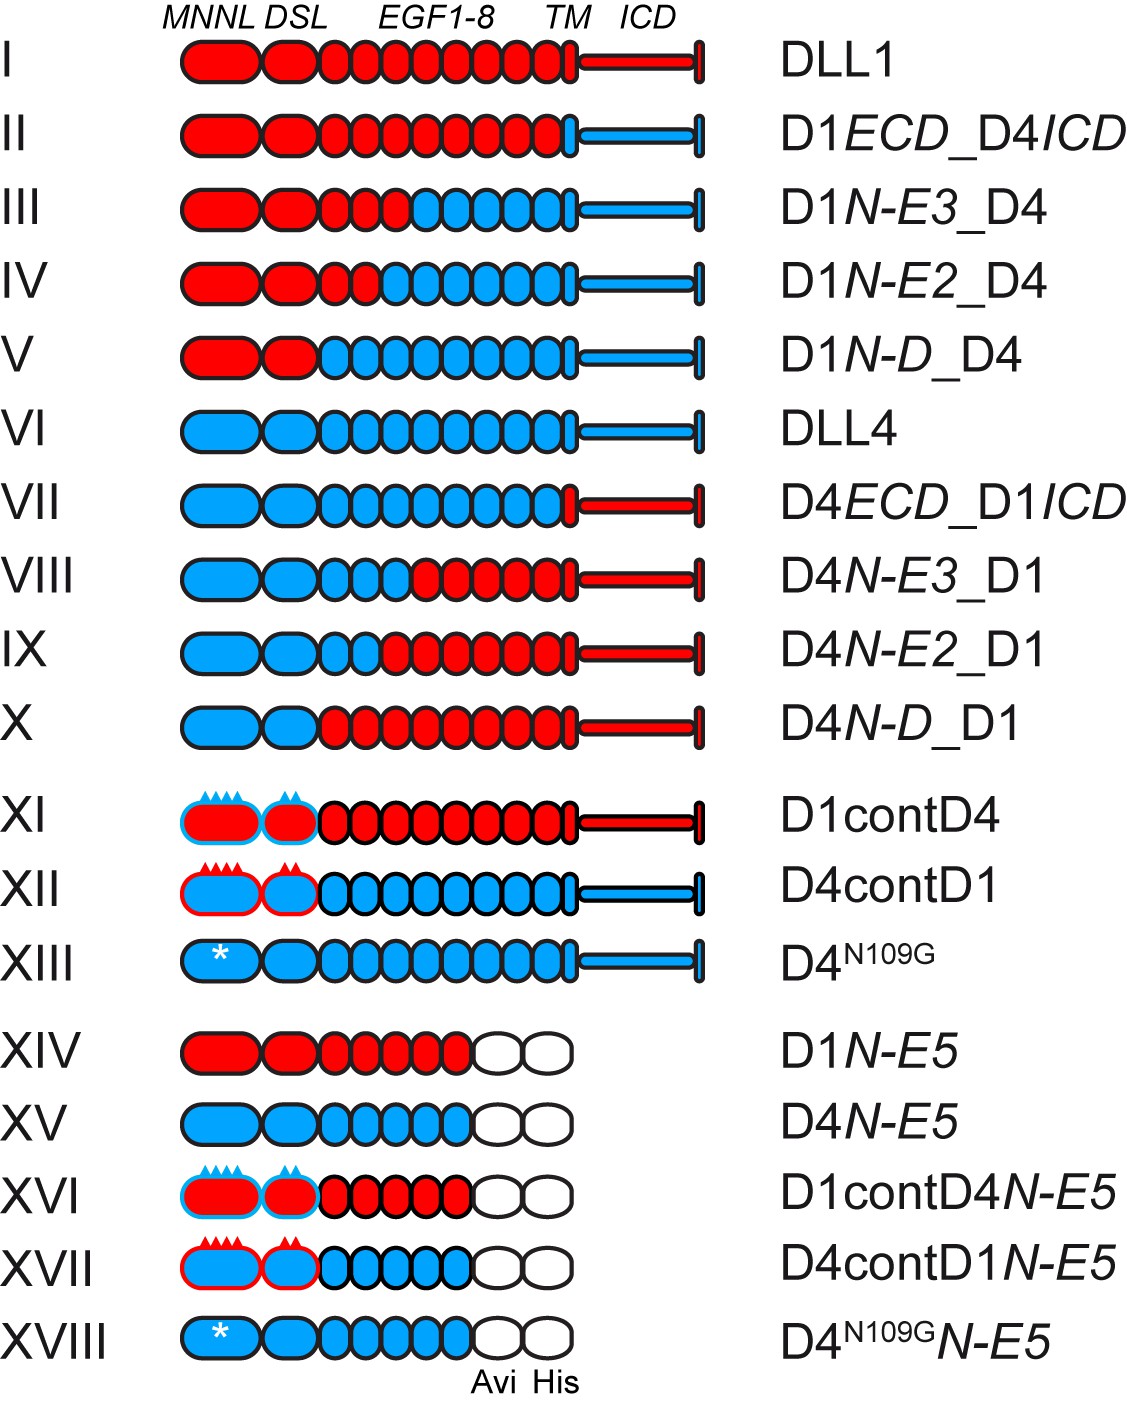
Schematic representation of DLL1 and DLL4 and variant proteins.
I-X, full-length and chimeric ligands generated by domain swaps. XI and XII, ligands with exchanges of the known NOTCH1 contact amino acids in the MNNL and DSL domains. XIII, DLL4 variant with an N109G mutation that eliminates the N-glycosylation site in DLL4. XIV-XVIII, soluble proteins encoding the N-terminal region up to and including EGF5 carrying a C-terminal Avi-His-tag for protein purification. I-XIII were tested in cell-based Notch activation assays, II, III, VII and XI in transgenic mice, XIV-XVIII used for measurements of binding affinities to N1. Proteins analyzed in cell-based assays were C-terminally Flag-tagged, proteins analyzed in mice were untagged. Break points and surrounding amino acid sequences and point substitutions are illustrated in Figure 1—figure supplement 1. Red domains/spikes: DLL1; blue domains/spikes: DLL4; white asterisks: N109G mutation. ECD, extracellular domain; N, N-terminus; D, DSL domain; E, EGF repeat, TM, transmembrane domain; ICD, intracellular domain; D, DLL; cont, N1 contact amino acids.
Figure 1—figure supplement 1
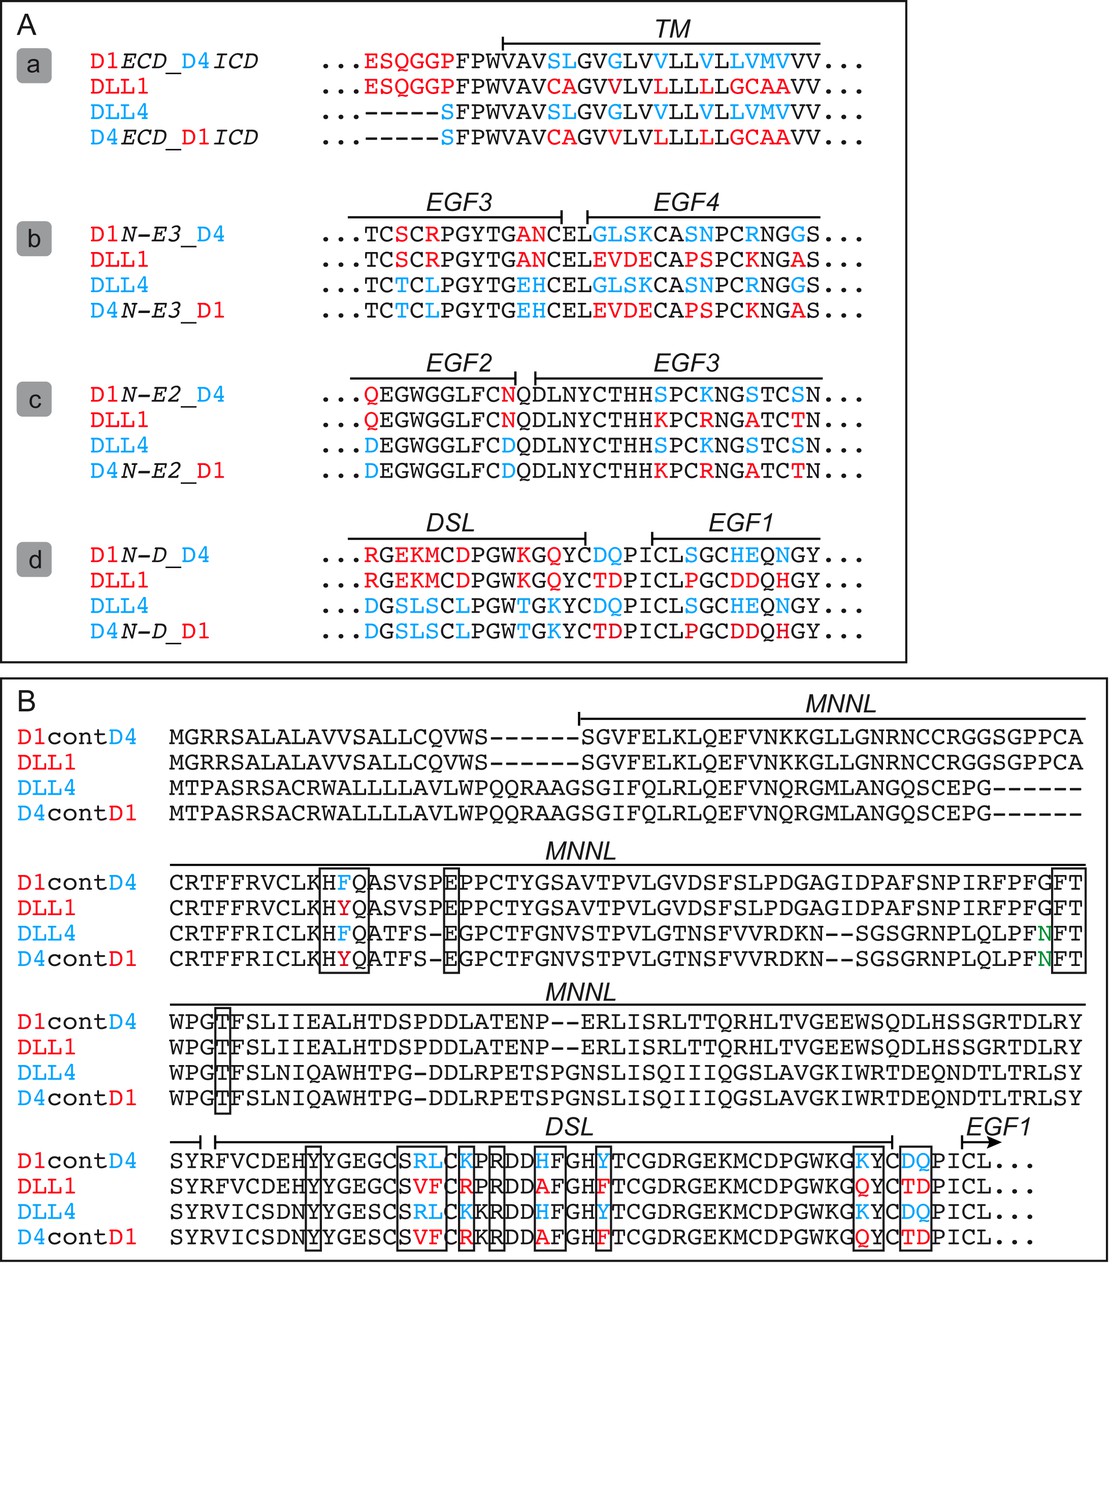
Amino acid exchanges of DLL variant proteins.
(A) Amino acid sequences around the break points of chimeric DLL1 and DLL4 proteins. Amino acids unique to DLL1 and DLL4 are indicated in red and blue, respectively. Break point are just before the transmembrane domain (a), between EGF3 and 4 (b), EGF 2 and 3 (c), and DSL and EGF1 (d). (B) Amino acid sequences of the MNNL and DSL domains of DLL1 and DLL4 and ligand proteins with exchanges of amino acids that contact N1. N1 contact amino acids based on DLL1 and DLL4 structure alignments are depicted in black boxes. Amino acids unique to DLL1 and DLL4 are indicated in red and blue, respectively.
Figure 1—figure supplement 2
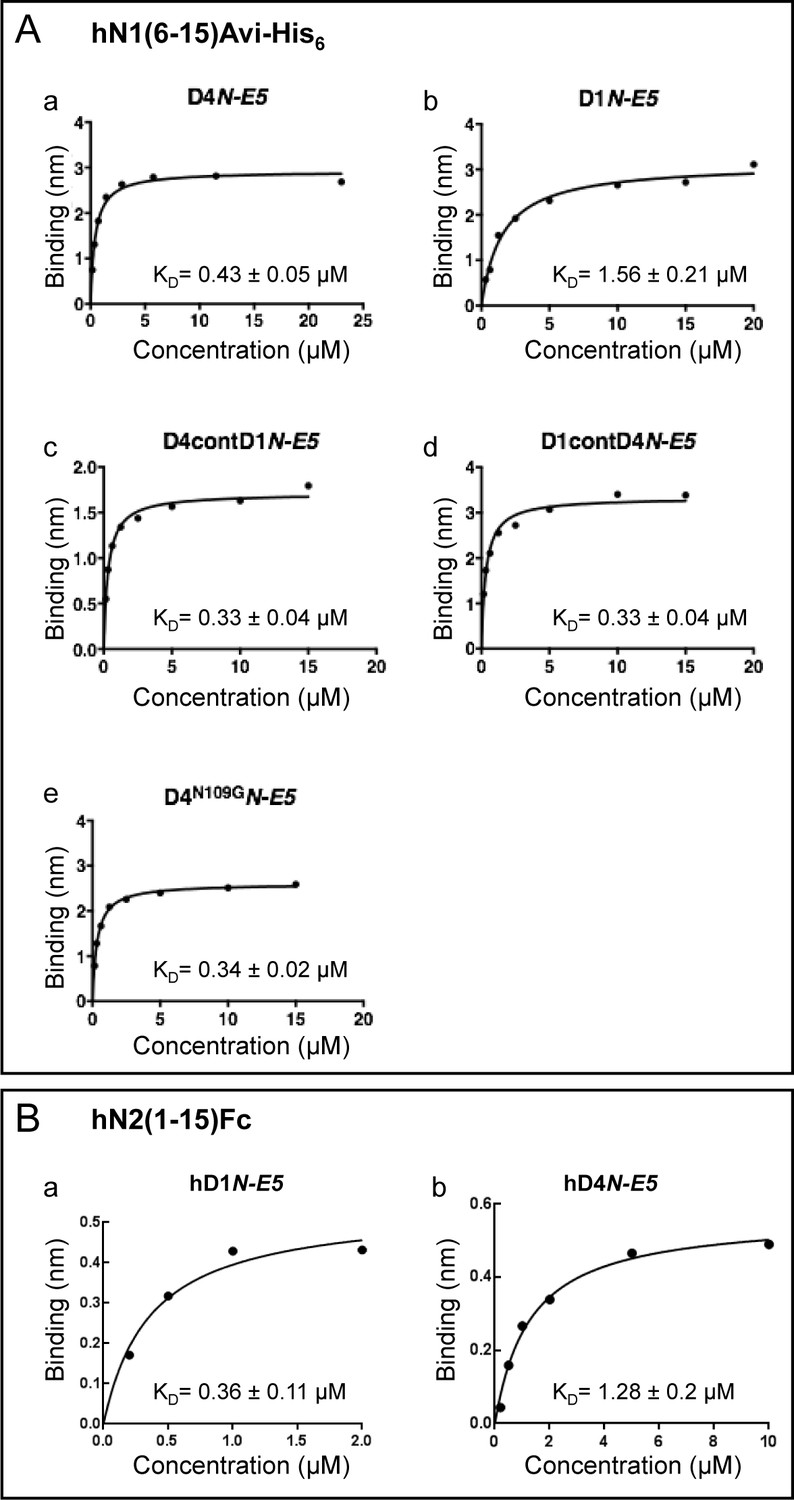
Analysis of ligand receptor binding.
(A) Analysis of the binding of various ligands to a biotinylated human N1 ectodomain fragment containing EGF repeats 6–15 using biolayer interferometry. Binding of DLL4 (from the N-terminus through EGF-repeat 5; (a), DLL1 (from the N-terminus through EGF-repeat 5; b), D4contD1 (c), D1contD4 (d), or D4N109G (e) to the N1 fragment was measured after the N1 fragment was immobilized on a streptavidin sensor tip. The data were analyzed using a single-site binding model using GraphPad Prism software. Calculated KD values and SEM are shown below the graphs. (B) Analysis of DLL1 and DLL4 binding to human N2 using biolayer interferometry. Detection of DLL1 (from the N-terminus through EGF-repeat 5; (a) or DLL4 (from the N-terminus through EGF-repeat 5; (b) binding to N2(1–15)-Fc immobilized on a protein A sensor tip. The data were analyzed using a single-site binding model using GraphPad Prism software. Calculated KD values and SEM are shown below the graphs.
Figure 1—figure supplement 3
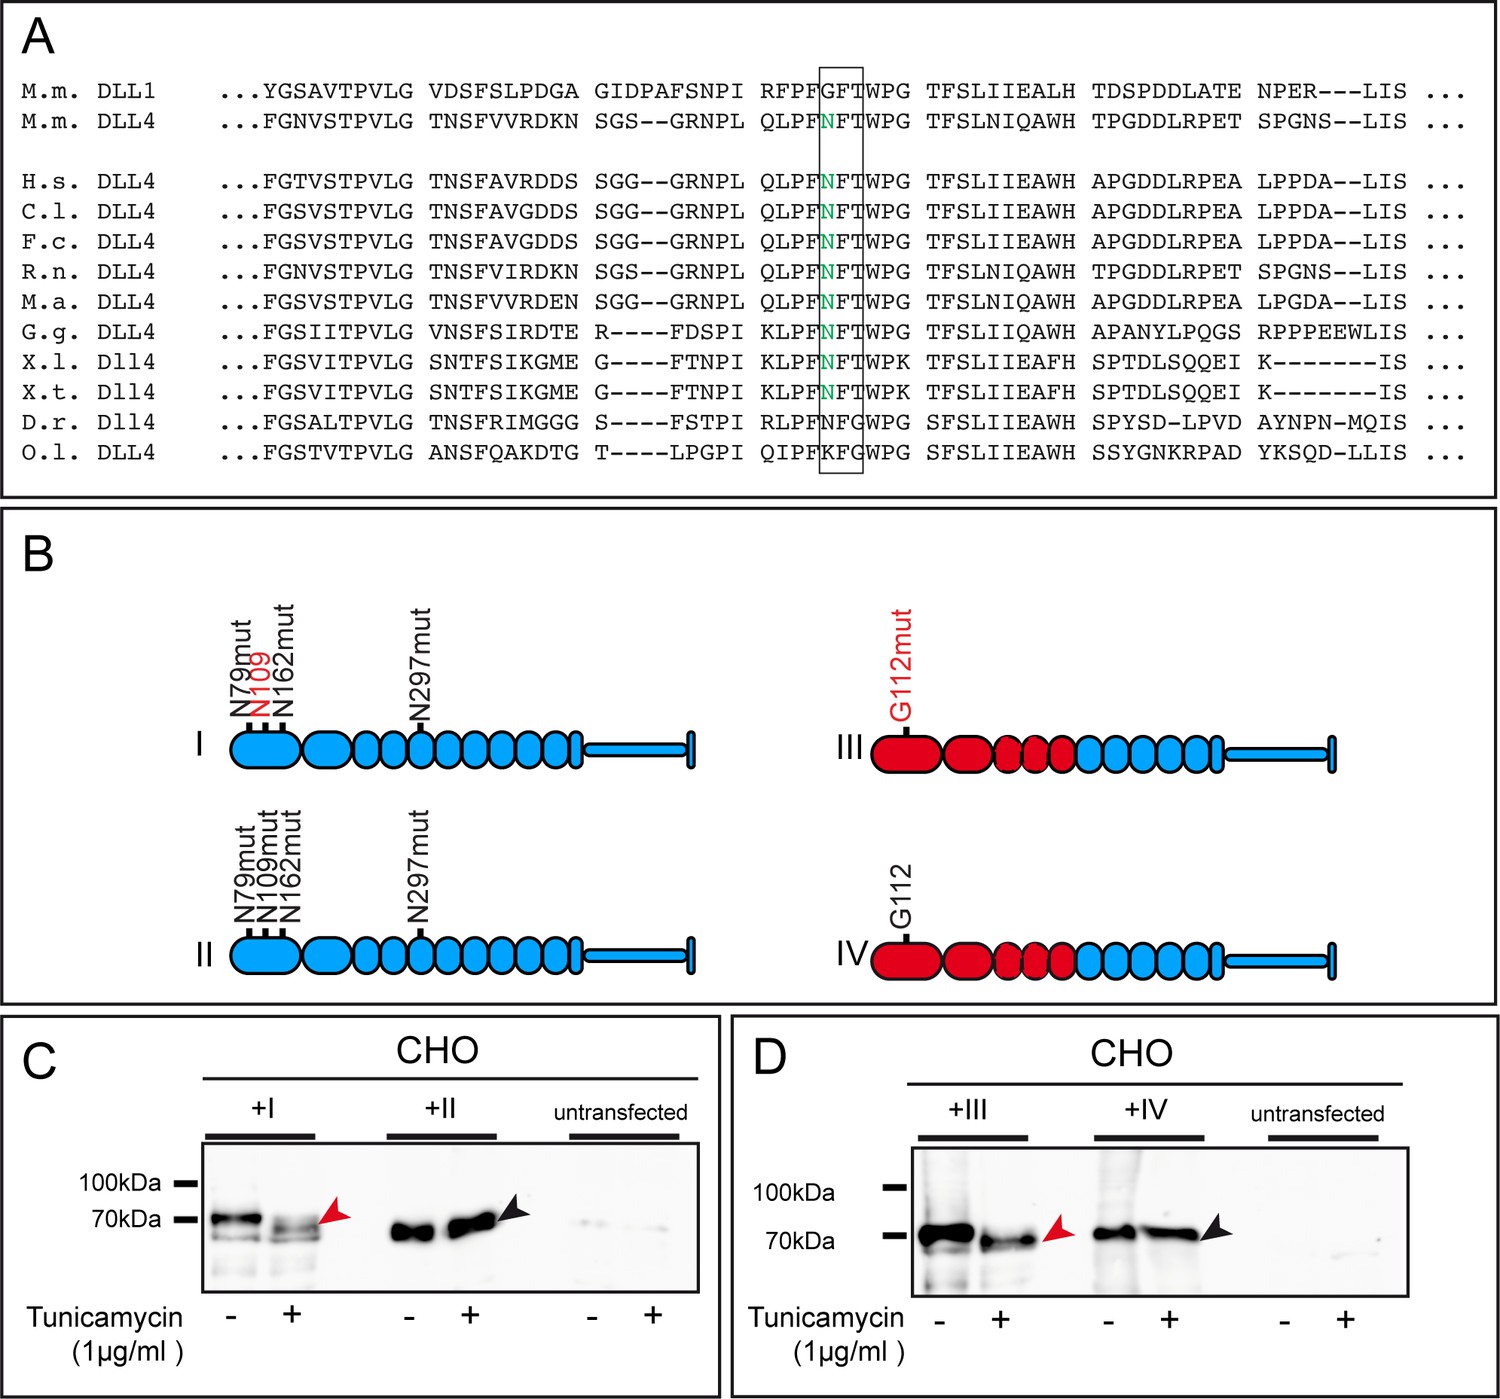
N109 is highly conserved and N-glycosylated in DLL4.
(A) Alignment of murine DLL1 and DLL4 and of mammalian, bird, amphibian, and fish DLL4 showing the conserved N-glycosylation consensus site (green Asp in black box) in DLL4 proteins. M.m., Mus musculus; H.s., Homo sapiens; C.l., Canis lupus (dog); F.c., Felic catus (cat); R.n., Rattus norvegicus; M.a., Mesocricetus auratus (Gold hamster); G.g., Gallus gallus (chicken); X.l., Xenopus leavis; X.t., Xenopus tropicalis (frog); D.r., Danio rerio (zebrafish); O.l., Oryzias latipes (medaka). (B) Constructs used to validate the glycosylation state of N109 in DLL4. (I) DLL4 protein with mutated consensus sites N79, N162 and N297. (II) DLL4 protein with additionally mutated consensus site N109. The region around the N residues was exchanged from NVS to SAV (in case of N79) and from EQNDTL to LHSSGR (in case of N162) reflecting the sequence context in DLL1 lacking these consensus sites. N109 was changed to G. To prevent N-glycosylation of N297, S299 was mutated to A as found in DLL1. (III) represents a chimeric ligand with the N-terminus up to and including EGF3 of DLL1 fused to EGF4 and the C-terminal part of DLL4. Amino acid G112 was mutated to N (G112mut) generating an N-glycosylation consensus sequence like in DLL4. (IV) Chimeric ligand with the N-terminus up to and including EGF3 of DLL1 fused to EGF4 and the C-terminal part of DLL4 lacking all functional N-glycosylation sites. Red domains: DLL1; blue domains: DLL4. (C, D) CHO cells were transfected with constructs (I or II) (C) or (III or IV) (D) and treated with tunicamycin to prevent N-glycosylation. Red arrowhead in (C) points to faster migrating protein species in tunicamycin treated cells indicating N109 glycosylation. In contrast construct II did not show a shift in protein size upon treatment (black arrowhead). (D) Generation of the consensus site in the MNNL domain of DLL1 (III) resulted in N-glycosylation as tunicamycin treatment led to a shift in protein size (red arrowhead) compared to the construct with the wild type DLL1 MNNL domain (IV, black arrowhead).
Figure 2
The extracellular domains of DLL1 and DLL4 determine ligand behavior during somitogenesis.
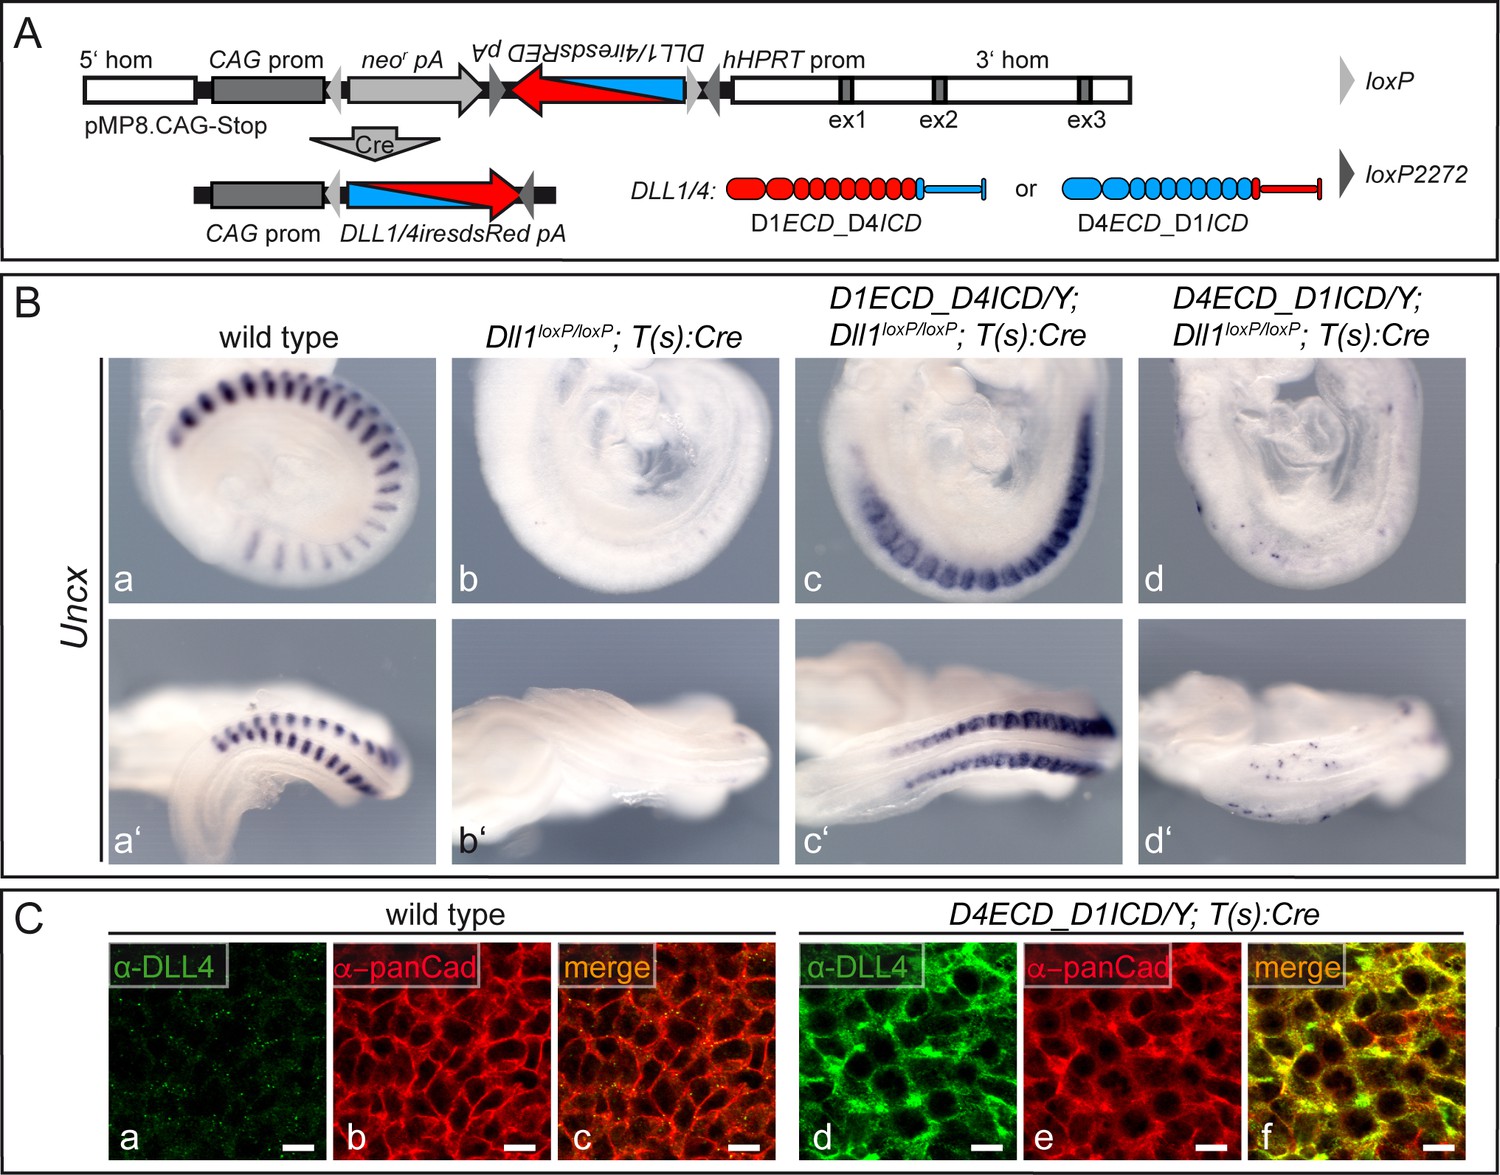
(A) Scheme of the targeting vector pMP8.CAG-Stop used to introduce inducible chimeric ligands into the Hprt locus, and of Cre-mediated activation of transgene (D1ECD_D4ICD or D4ECD_D1ICD) expression driven by the CAG promotor (CAG prom). 5’ hom and 3’ hom, Hprt 5’ and 3’ homology regions; ex1-3 (grey boxes), Hprt exons; neor, neomycin phosphotransferase; pA, polyadenylation signal; hHPRT prom, human Hprt promoter; DLL1/4iresdsRED, chimeric ORF–linked to dsRed tag by an internal ribosomal entry site (IRES). (B) Uncx expression in E9.5 wild type embryos (a, a’; n = 28), embryos lacking DLL1 in the mesoderm (b, b’; n = 12) and male embryos lacking DLL1 in the mesoderm that express either D1ECD_D4ICD (c, c’; n = 9) or D4ECD_D1ICD (d, d’; n = 8) showing that the extracellular domain of DLL1 but not of DLL4 can restore Uncx expression. (C) Whole mount immunofluorescent staining of wild type (a–c) and D4ECD_D1ICD/Y;T(s):Cre (d–f) PSMs using antibodies recognizing the extracellular domain of DLL4 showing co-localization of the exogenous chimeric ligand with pan-Cadherin (panCad) at the cell surface. Additional intracellular staining most likely reflects the presence of the ligand in the ER and trans Golgi as observed previously for DLL1 in cultured cells (Geffers et al., 2007; Müller et al., 2014) and for endogenous DLL1 and transgenic DLL4 in the PSM (Preuße et al., 2015). n = 3 for wild type, n = 4 for D4ECD_D1ICD/Y;T(s):Cre; Scale bar = 10 µm.
Figure 3

D1N-E3_D4 is not able to compensate for DLL1 function during somitogenesis.
(A) "Mini-gene“ targeting strategy to express DLL1 or DLL4 variants from the Dll1 locus (a) and alleles generated in this study (d and e). The Dll1Dll1ki (b) and Dll1Dll4ki (c) control alleles were described previously (Preuße et al., 2015; Schuster-Gossler et al., 2016). Dll1D1N-E3_D4ki (d) encodes a fusion protein between the N-terminal part of DLL1 including EGF3 fused to EGF4 and the remaining C-terminal portion of DLL4 (III in Figure 1 and Figure 1—figure supplement 1Ab). Dll1D1contD4ki (e) encodes a DLL1 variant whose predicted amino acids of the MNNL and DSL domains that contact N1 are replaced by the corresponding amino acids of DLL4 (XI in Figure 1, Figure 5C, and Figure 1—figure supplement 1B). All alleles have an identical structure and intron 9 and 10 sequences of Dll1. (B) External phenotypes of wild type (a; n = 19), homozygous Dll1D1N-E3_D4ki (b; n = 11), Dll1Dll1ki (c; n = 3) and Dll1Dll4ki (d; n = 3) control E15.5 fetuses. Arrow in (b) points to the short tail. Arrowhead in (c) points to edemas present in homozygous Dll1Dll4ki fetuses. (C) Indirect immunofluorescence staining of wild type (a–c, j–l), homozygous Dll1D1N-E3_D4ki (d–f, m–o), and homozygous Dll1Dll4ki (g–i, p–r) E9.5 PSMs using antibodies recognizing the extracellular domain of DLL4 (a, d, g) and DLL1 (j, m, p) and pan-Cadherin (panCad; b, e, h, k, n, q) showing expression of D1N-E3_D4 and co-localization with the cell surface marker pan-Cadherin. Staining of D1N-E3_D4 appears weaker than DLL4 most likely because much of the epitope recognized by the polyclonal anti-DLL4 antibody is missing in this chimeric protein. n ≥ 3; Scale bar = 5 µm. (D) WISH of E9.5 embryos showing that D1N-E3_D4 does not restore normal Uncx expression (e; n = 10) resembling the Dll1Dll4ki phenotype (d; n = 7). (E) Skeletal preparations of wild type (a; n = 11), homozygous Dll1Dll1ki (b; n = 6), heterozygous (c; n = 14/16) and homozygous (d; n = 3) Dll1Dll4ki, and heterozygous (e; n = 14) and homozygous (f; n = 10) Dll1D1N-E3_D4ki E15.5 fetuses. Arrow and arrowheads in (c) point to axial skeleton defects that were not detected in Dll1D1N-E3_D4ki heterozygotes (e). (F) Cross-sections of hind limbs of wild type (a), homozygous Dll1Dll1ki (b), homozygous Dll1Dll4ki (c), and homozygous (d-f; n = 3) Dll1D1N-E3_D4ki E18.5 fetuses stained for expression of Myosin Heavy Chain (MHC) indicating that D1N-E3_D4 rescues the skeletal muscle phenotype in contrast to DLL4. Arrows in (c) point to skeletal muscle remnants.
Figure 4 with 1 supplement
DLL1 and DLL4 differentially activate NOTCH1 and NOTCH2 in cell-based co-culture assays.
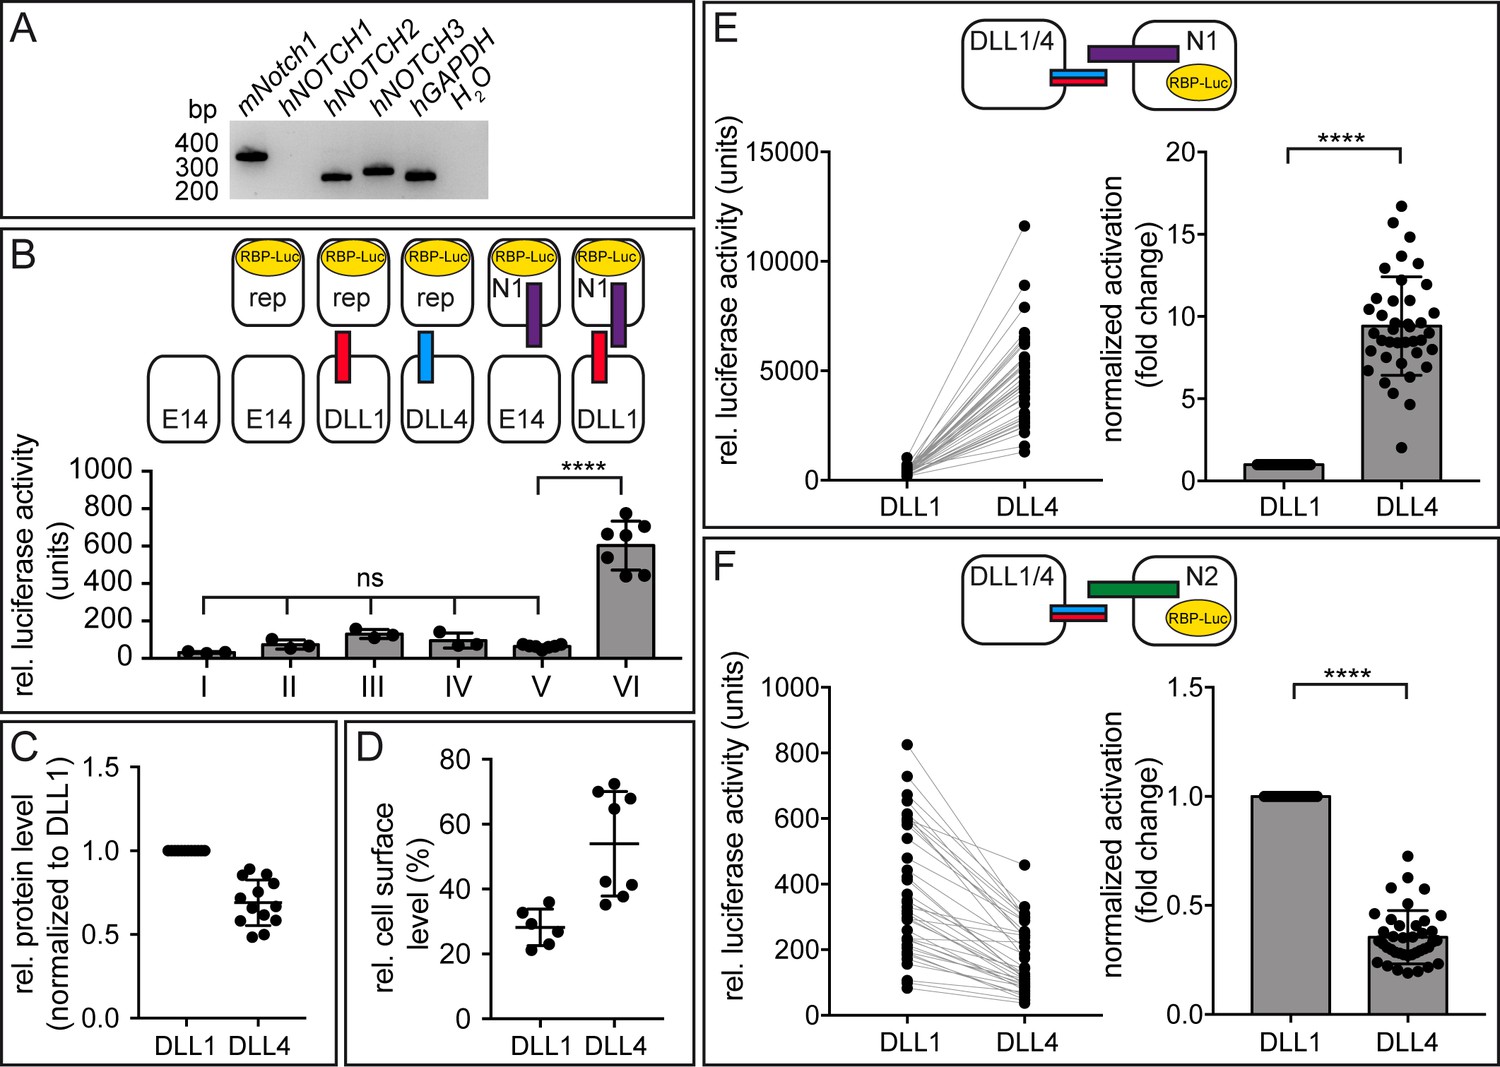
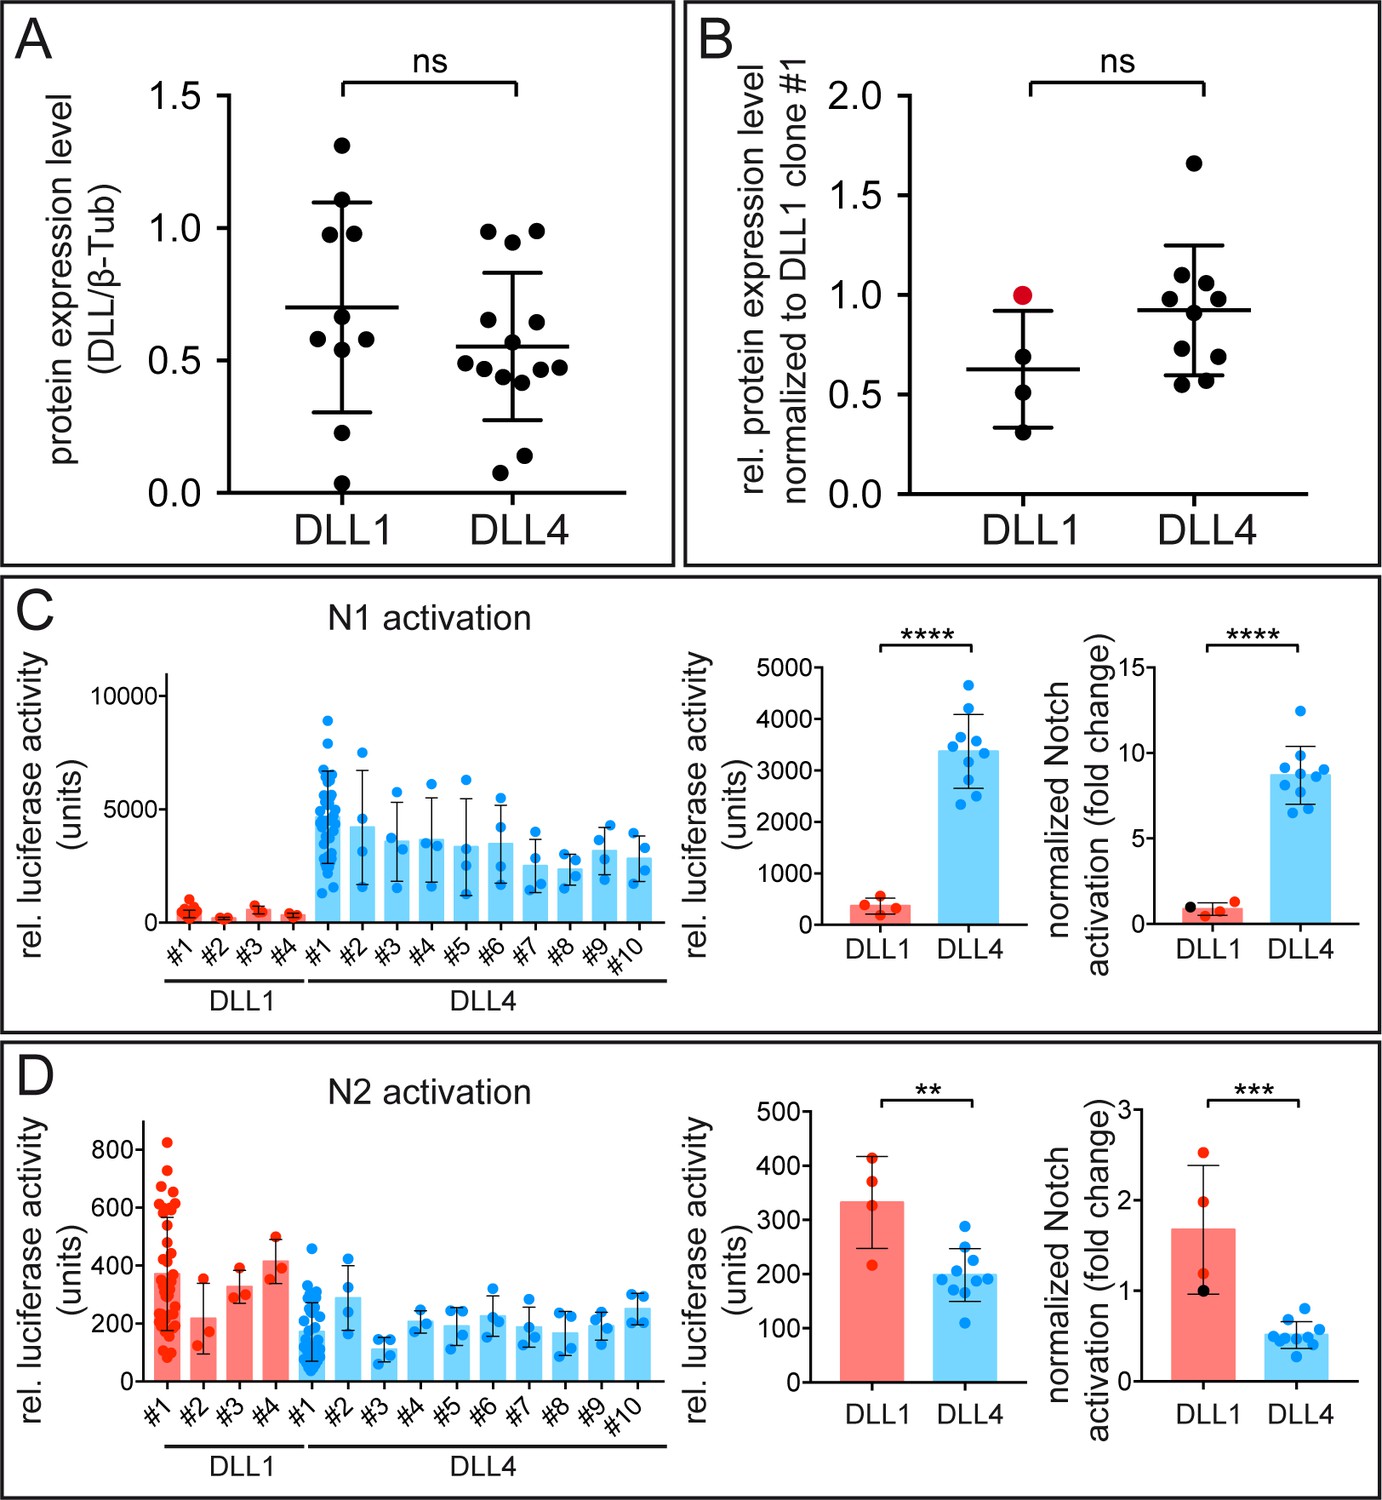
(A) RT-PCR analysis using RNA of HeLaN1 cells shows the expression of endogenous human NOTCH2 and NOTCH3 in addition to the exogenous murine Notch1. (B) ES cell-based trans-activation assays demonstrate that E14TG2a ES cells express negligible amounts of endogenous Notch receptors and ligands. Co-cultivation of ES cells with stable expression of either DLL1 (III) or DLL4 (IV) from the Hprt-locus with ES-cells carrying only the RBP-Luc reporter in the Hprt-locus (E14rep) showed luciferase activity at levels indistinguishable from lysates of only E14 cells (I) and co-cultures of wild type E14 and reporter carrying ES cells (II). Similarly, co-culture of ES cells carrying N1 and the RBP-Luc reporter (N1rep) with E14 cells (V) did not show reporter activation significantly above background levels, whereas co-culture of DLL1 expressing cells with N1rep ES cells showed a 6–10-fold increase in luciferase activity (VI). n ≥ 3 co-cultures with 2–4 replicate measurements per n (Figure 4—source data 1). Mean ± SD, ns = p ≥ 0.05, ****=p < 0.0001, one-way ANOVA followed by Tukey’s multiple comparison test. (C) Protein expression analysis indicating similar expression levels of DLL1 and DLL4 in the ES cell clones used. Each DLL4 value represents a technical replicate, which was referenced to its paired DLL1 value, which was arbitrarily set to one for each measurement. The non-normalized values (DLL/β-Tub ratios) are depicted in a graph in Figure 4—figure supplement 1A (Figure 4—source data 2). (D) Cell-surface biotinylation demonstrating that a slightly higher fraction of DLL4 is present at the cell surface compared to DLL1 (n ≥ 6; Figure 4—source data 3). (E) DLL4 activates N1 about 10-fold more strongly than DLL1 in co-culture assays. Left graph shows non-normalized N1 activation. Lines connect values measured in the same assay. Right graph shows values normalized to DLL1 activation, and corrected for protein expression and cell surface presentation. (F) DLL4 activates N2 about half as strongly as does DLL1. Left graph shows non-normalized N2 activation. Lines connect values measured in the same assay. Right graph shows values normalized to DLL1 activation, and corrected for protein expression and cell surface presentation. Each dot represents a technical replicate. Raw data are shown in Figure 4—source data 4 and Figure 4—source data 5. Co-cultures (n = 39) with two replicate measurements per n. Mean ± SD, ns = p ≥ 0.05, ****=p < 0.0001, Student’s paired t-test.
-
Figure 4—source data 1
Raw data used to generate the graph in Figure 4B.
Relative luciferase activity (units) of different assays are means of ≥2 technical replicates (measurements of the same cell lysate) of each (co-)culture.
- https://doi.org/10.7554/eLife.40045.013
-
Figure 4—source data 2
Data used to generate the graphs in Figure 4C and Figure 4—figure supplement 1A.
DLL1 and DLL4 protein expression level in ES cells determined by quantitative analysis of Western blots (DLL1 or DLL4 expression intensity/𝛽-Tubulin intensity (DLL/𝛽-Tub)). Expression of DLL4 clone #1 was normalized to expression of DLL1 clone #1 analyzed in the same assay. The value obtained in Assay #7 (red) represents an outlier (determined by GraphPad Prism7) and was not included in the calculation of the average.
- https://doi.org/10.7554/eLife.40045.014
-
Figure 4—source data 3
Raw data used to generate the graph in Figure 4D.
Relative cell surface levels of DLL1 (ES clone #1) and DLL4 (ES cell clone #1) proteins determined by cell surface biotinylation and quantitative analysis of Western blots after immunoprecipitation.
- https://doi.org/10.7554/eLife.40045.015
-
Figure 4—source data 4
Numerical values used to generate the graphs in Figure 4E.
Relative luciferase activity (units) for each assay was calculated by subtraction of E14 background values. Normalized activation (fold change) was obtained by normalization to DLL1 activity and correction for protein and cell surface levels based on the values for relative protein expression (Figure 4—source data 2) and cell surface presentation (Figure 4—source data 3). Normalized activation = normalized activation x [prot level DLL1/prot level DLL4] x [rel surface level DLL1/rel surface level DLL4].
- https://doi.org/10.7554/eLife.40045.016
-
Figure 4—source data 5
Numerical values used to generate the graphs in Figure 4F.
Luciferase activity (units) for each assay was calculated by subtraction of the E14 background values. Normalized activation (fold change) was obtained by normalization to DLL1 activity and correction for protein and cell surface levels based on the values for relative protein expression (Figure 4—source data 2) and cell surface presentation (Figure 4—source data 3). Normalized activation = normalized activation x [prot level DLL1/prot level DLL4] x [rel surface level DLL1/rel surface level DLL4].
- https://doi.org/10.7554/eLife.40045.017
Figure 4—figure supplement 1
Consistent N1 and N2 activation by different cell clones expressing DLL4.
(A) Protein expression level in DLL1 clone #1 and DLL4 clone #1 (DLL ligand/β-Tub) determined by quantitative Western blot analysis. Each dot represents a technical replicate (numerical values in Figure 4—source data 2). (B) Relative protein expression level in 4 and 10 independent ES cell clones, respectively, expressing DLL1 or DLL4 from the Hprt locus normalized to DLL1 clone #1 level measured in the same assay. Each dot represents the mean value of n ≥ 3 independent measurements of a single clone. Red dot indicates DLL1 clone #1 that was used for normalization. For numerical values see Figure 4—figure supplement 1—Source Data 1. (C) and (D) N1 and N2 activation by 4 DLL1 and 10 DLL4 expressing independent ES cell clones. Left graphs show rel. luciferase activity measured for each DLL1 and DLL4 expressing clone. Each dot represents a technical replicate of a given cell clone. Central graphs show averaged rel. luciferase activity for DLL1 and DLL4 expressing cell clones. Each dot represents the mean value of n ≥ 3 measurements of a given cell clone. Right graphs show Notch activation normalized to activation by DLL1 clone #1 (n ≥ 3). Black dots indicate DLL1 clone #1. For numerical values see Figure 4—figure supplement 1—Source Data 2. Student’s unpaired t-test; Mean ±SD, ns = not significant; **=p ≤ 0.01; ***=p ≤ 0.001; ****=p ≤ 0.0001.
-
Figure 4—figure supplement 1—source Data 1
Numerical values used to generate the graph in Figure 4—figure supplement 1B.
DLL1 and DLL4 protein levels in different ES cell clones were determined by quantitative analysis of Western blots and the relative protein expression was obtained by normalization to DLL1 clone #1 analyzed in the same assay. The value obtained in assay 13 (red) represents an outlier (determined by ROUT analysis using GraphPad Prism7) and was not included in the calculation of the average.
- https://doi.org/10.7554/eLife.40045.011
-
Figure 4—figure supplement 1—source Data 2
Numerical values used to generate the graphs in Figure 4—figure supplement 1C,D.
N1 and N2 activation by different ES cell clones expressing DLL1 and DLL4.
- https://doi.org/10.7554/eLife.40045.012
Figure 5 with 1 supplement
Contributions of the MNNL-EGF3 portion and contact amino acids to ligand selectivity towards N1 and N2.
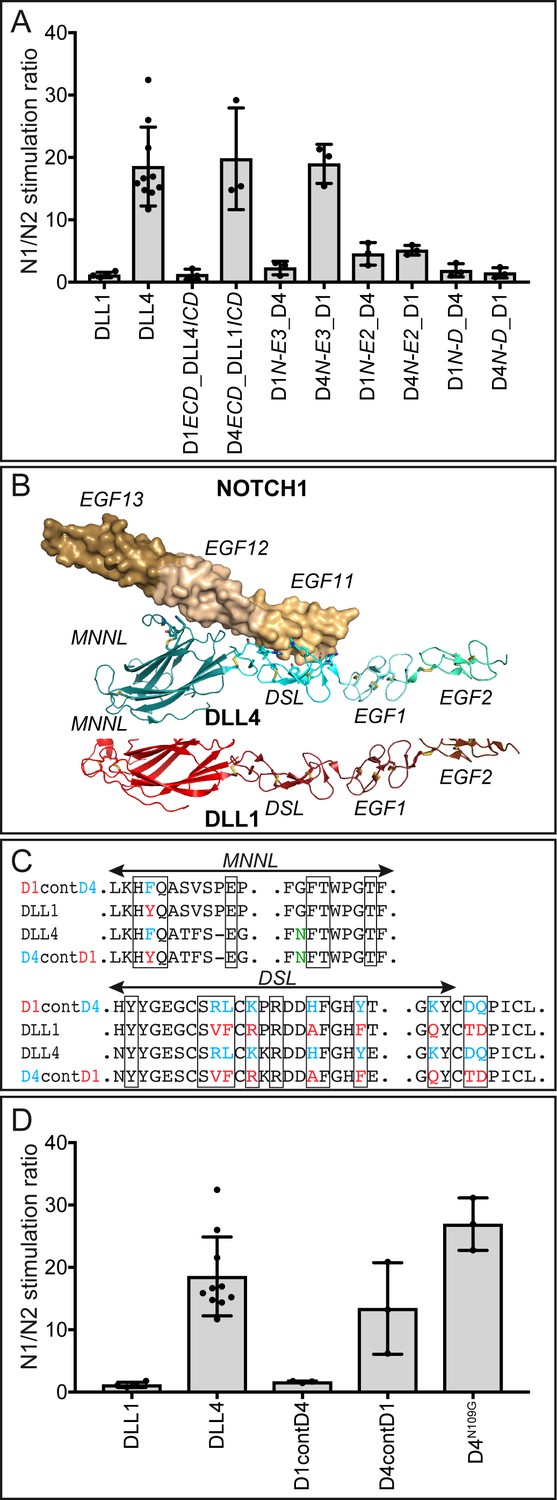
(A) N1/N2 activation ratios by DLL1 and DLL4 chimeric proteins show that receptor selectivity of DLL1 and DLL4 is encoded by the extracellular domain and that EGF3 contributes to N1/N2 selectivity. DLL4, D4ECD_D1ICD, and D4N-E3_D1 show N1/N2 induction ratios of ~20. DLL1, D1ECD_D4ICD, and D1N-E3_D4 exhibit induction ratios of 1–3. Chimeric pairs with domain exchanges between EGF2 and EGF3 or between DSL domain and EGF1 show equivalent stimulation ratios. Each dot represents the mean of N1 (relative luciferase units; Figure 5—source data 1)/N2 (relative luciferase units; Figure 5—source data 2) of n ≥ 3 measurements per clone of a given ligand construct. Bars represent the Mean ± SD of n ≥ 3 clones per construct (Figure 5—source data 3). (B) Structure-based superposition of DLL1 and DLL4 (PDB ID codes 4XBM and 4XLW, respectively; (Kershaw et al., 2015; Luca et al., 2015). Top panel: NOTCH1 is rendered as a molecular surface (wheat), and DLL4 is rendered in ribbon representation (cyan). N1 contact residues on DLL4 were rendered as sticks, and were used to predict N1 contact amino acids of the MNNL and DSL domains of DLL1 (red). Domains are labeled above and below the structures, respectively, and individual domains are identified by different degrees of color shading/intensity. (C) Parts of the MNNL and DSL sequences showing the contact amino acids (boxed), the divergent amino acids of DLL1 (red) and DLL4 (blue), and the sequence of ligands with amino acid exchanges (complete sequences of the changed MNNL and DSL domains are shown in Figure 1—figure supplement 1B). The N-glycosylation site at residue N109 of DLL4 is indicated in green. (D) N1/N2 activation ratios of ligands with exchanged N1 contact amino acids. D1contD4 does not show changes in receptor selectivity compared to DLL1. Replacing the contact residues of DLL4 with those of DLL1 only reduces N1/N2 activation ratio to ~13. Elimination of the N-glycosylation site of DLL4 with the N109G mutation (the corresponding amino acid of DLL1) does not change DLL4 receptor selectivity. Each dot represents the mean of N1 (relative luciferase units; Figure 5—source data 1)/N2 (relative luciferase units; Figure 5—source data 2) of n ≥ 3 measurements per clone of a given ligand construct. Bars represent the Mean ± SD of n ≥ 3 clones per construct (Figure 5—source data 3).
-
Figure 5—source data 1
Raw data (RLUs) of luciferase activity in co-cultures with N1rep cells used to generate the graph in Figure 5—figure supplement 1A.
Values represent relative luciferase activity (units) after subtraction of E14 background RLUs.
- https://doi.org/10.7554/eLife.40045.020
-
Figure 5—source data 2
Raw data (RLUs) of luciferase activity in co-cultures with N1rep cells used to generate the graph in Figure 5—figure supplement 1B.
Values represent relative luciferase activity (units) after subtraction of E14 background RLUs.
- https://doi.org/10.7554/eLife.40045.021
-
Figure 5—source data 3
N1/N2 activation ratios.
Values represent N1/N2 activation ratio. Values were used for generation of graphs in Figure 5A and D. Red values were identified as outliers (determined by ROUT analysis by GraphPad Prism7) and excluded from calculations.
- https://doi.org/10.7554/eLife.40045.022
Figure 5—figure supplement 1
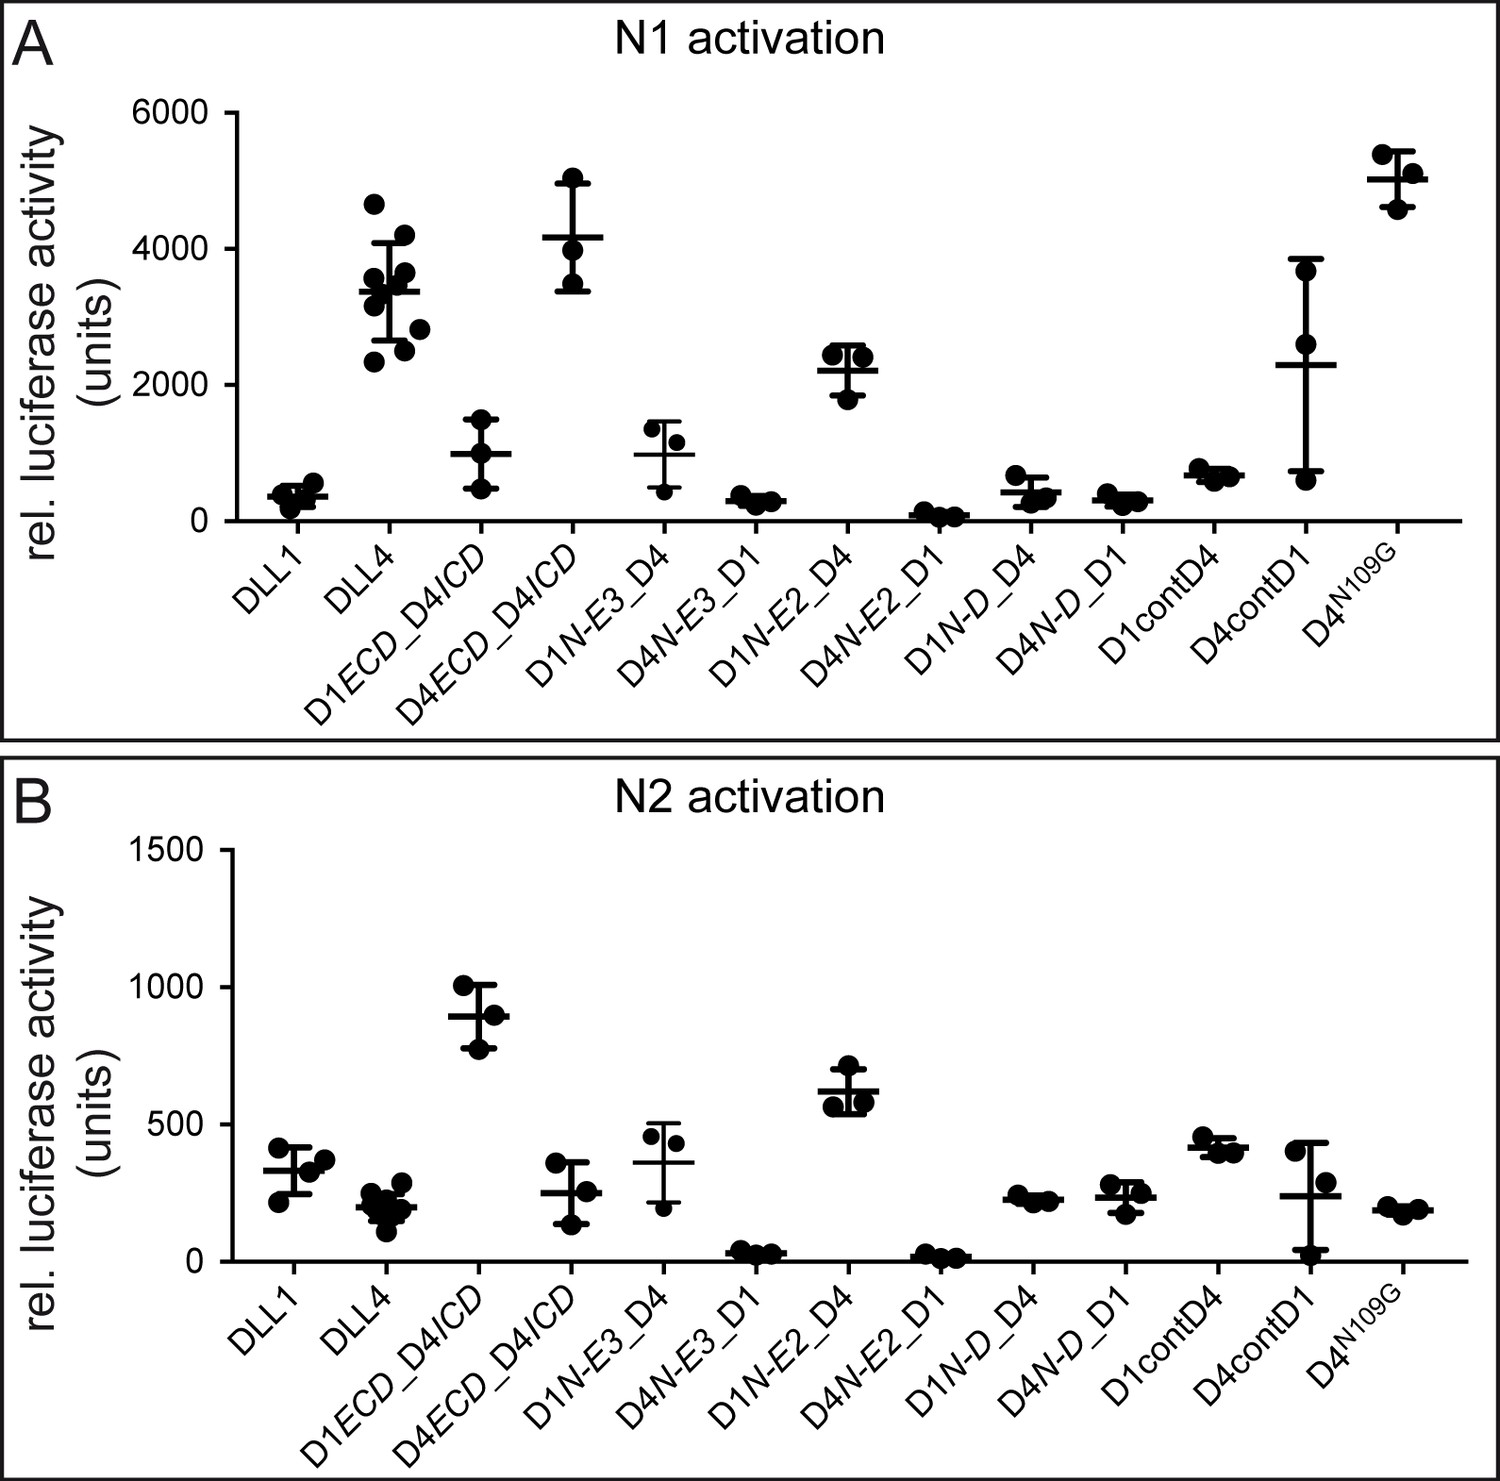
N1 and N2 activation by different ligand proteins.
(A) and (B) Rel. luciferase activity obtained in co-cultures of ES cells expressing wild type ligands, chimeric ligands, and ligands with amino acid substitutions in the direct ligand-receptor binding region. Each dot represents the mean of n ≥ 3 technical replicates of a given cell clone. For numerical values see Figure 5—source datas 1 and 2. Mean ± SD.
Figure 6

DLL1 carrying the DLL4 contact amino acids in the MNNL and DSL domains is a functional DLL1 ligand in vivo.
(A) E15.5 Dll1D1contD4ki/D1contD4ki (c; n = 12) fetuses are indistinguishable from wild type (a; n = 19) and Dll1Dll1ki/Dll1ki (b; n = 3) controls. (B) D1contD4 co-localizes with pan-Cadherin (panCad) at the cell surface of Dll1D1contD4ki/D1contD4ki PSM cells (e-h; n ≥ 3); Scale bars: a, e = 500 µm; b-d, f-h = 5 µm. (C) Whole mount in situ hybridization showing that D1contD4 induces normal Uncx expression during somitogenesis (d,d’; n ≥ 5). (D) Skeletal preparations of Dll1D1contD4ki/D1contD4ki E15.5 fetuses showing minor defects of single vertebrae in the lower thoracic region (c,c’; n = 3/4).
Author response image 1
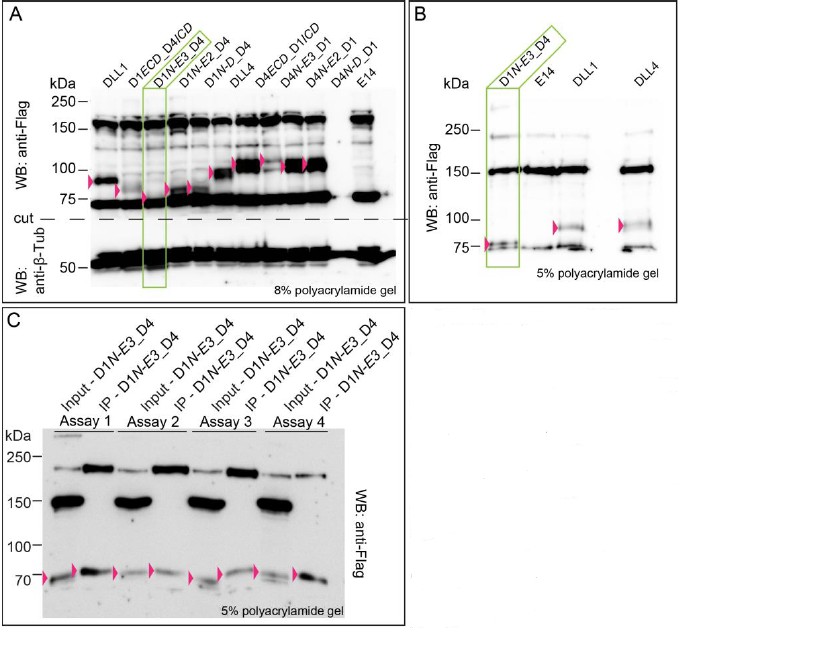
Expression of D1N-E3_D4 cannot be quantified with confidence due to a closely co-migrating background band detected by the anti-Flag antibody.
(A) Expression of wild type DLL1 and DLL4 and of chimeric ligand proteins. Protein migration size varies due to differential post-translational modifications of the extracellular domains of DLL1 and DLL4. Double bands in DLL4, D4ECD_D1/CD, D4N-E3_D1, D4N-E2D1, and D4N-D_D1 lysates represent most likely differential modification states of the DLL4’s ECD. (B) D1N-E3_D4 migrates right at the dye front when using a 5% polyacrylamide gel. (C) Immunoprecipitation of D1N-E3_D4 after cell surface biotinylation in four independent assays. Input samples represents the whole cell lysate, IP samples represents the immunoprecipitated proteins. D1N-E3_D4 is detected in IP samples indicating its presence at the cell surface. The expression, however, cannot be quantified with confidence as the proteins are detected right at the dye front when using a 5% polyacrylamide gel. Pink arrowheads point to the proteins of interest. Green rectangles highlight the D1N-E3_D4 chimera lysate in (A) and (B).
Tables
Key resources table
| Reagent type (species) or resource | Designation | Source or reference | Identifiers | Additional information |
|---|---|---|---|---|
| Gene (Mus musculus) | DLL1 | MGI:104659; NCBI Gene: 13388 | ||
| Gene (Mus musculus) | DLL4 | MGI:1859388; NCBI Gene: 54485 | ||
| Strain, strain background (Mus musculus) | CD1 | Charles River Laboratories | ||
| Strain, strain background (Mus musculus) | 129Sv/CD1 hybrids | own colony | ||
| Genetic reagent (Mus musculus) | Dll1lacZ | PMID: 9109488; DOI: 10.1038/ 386717a0 | RRID:MGI:5780046 | |
| Genetic reagent (Mus musculus) | Dll1loxP | PMID: 15146182; DOI: 10.1038/ ni1075 | RRID:MGI:5431505 | |
| Genetic reagent (Mus musculus) | T(s):Cre | PMID: 18708576; PMCID: PMC2518812; DOI: 10.1101/gad. 480408 | MGI:3811072 | |
| Genetic reagent (Mus musculus) | ZP3:Cre | PMID: 10686600 | MGI:2176187 | |
| Genetic reagent (Mus musculus) | Dll1Dll1ki | PMID: 26801181; PMCID: PMC4788113; DOI: 10.1534/genetics. 115.184515 | MGI:5790945 | |
| Genetic reagent (Mus musculus) | Dll1Dll4ki | PMID: 26114479; PMCID: PMC4482573; DOI: 10.1371/journal. pgen.1005328 | MGI:5779556 | |
| Genetic reagent (Mus musculus) | Dll1D1N-E3_D4ki | this paper | mini gene insertion in the Dll1 locus | |
| Genetic reagent (Mus musculus) | Dll1D1contD4ki | this paper | mini gene insertion in the Dll1 locus | |
| Genetic reagent (Mus musculus) | HprtDll1ECD_Dll4ICD | this paper | inducible insertion into Hprt locus | |
| Genetic reagent (Mus musculus) | HprtDll4ECD_Dll1ICD | this paper | inducible insertion into Hprt locus | |
| Cell line (Mus musculus) | E14TG2a | PMID: 26114479; PMCID: PMC4482573; DOI: 10.1371/journal. pgen.1005328 | ||
| Cell line (Mus musculus) | 129Sv/cast | PMID: 26114479; PMCID: PMC4482573; DOI: 10.1371/journal. pgen.1005328 | ||
| Cell line (Homo sapiens) | HeLaN1 | PMID: 9653148; DOI: 10.1073/pnas. 95.14.8108 | ||
| Cell line (Mus musculus) | pMP8.CAG-DLL1 | PMID: 26801181; PMCID: PMC4788113; DOI: 10.1534/genetics. 115.184515 | ||
| Cell line (Mus musculus) | E14rep | PMID: 26801181; PMCID: PMC4788113; DOI: 10.1534/genetics. 115.184515 | ||
| Cell line (Mus musculus) | N1rep | PMID: 26801181; PMCID: PMC4788113; DOI: 10.1534/genetics. 115.184515 | ||
| Cell line (Mus musculus) | N2rep | PMID: 26801181; PMCID: PMC4788113; DOI: 10.1534/genetics. 115.184515 | ||
| Bacterial strain (E. coli) | SW106 | PMID:15731329 | ||
| Transfected construct (Mus musculus) | pMP8.CAG-DLL4 | this paper | progenitor: pMP8.CAG | |
| Transfected construct (Mus musculus) | pMP8.CAG-D1ECD _D4ICD | this paper | progenitor: pMP8.CAG | |
| Transfected construct (Mus musculus) | pMP8.CAG-D1N- E3_D4 | this paper | progenitor: pMP8.CAG | |
| Transfected construct (Mus musculus) | pMP8.CAG-D1N- E2_D4 | this paper | progenitor: pMP8.CAG | |
| Transfected construct (Mus musculus) | pMP8.CAG- D1N-D_D4 | this paper | progenitor: pMP8.CAG | |
| Transfected construct (Mus musculus) | pMP8.CAG- D4ECD_D1ICD | this paper | progenitor: pMP8.CAG | |
| Transfected construct (Mus musculus) | pMP8.CAG- D4N-E3_D1 | this paper | progenitor: pMP8.CAG | |
| Transfected construct (Mus musculus) | pMP8.CAG- D4N-E2_D1 | this paper | progenitor: pMP8.CAG | |
Transfected construct (Mus musculus) | pMP8.CAG- D4N-D_D1 | this paper | progenitor: pMP8.CAG | |
| Transfected construct (Mus musculus) | pMP8.CAG- D1contD4 | this paper | progenitor: pMP8.CAG | |
| Transfected construct (Mus musculus) | pMP8.CAG- D4contD1 | this paper | progenitor: pMP8.CAG | |
| Transfected construct (Mus musculus) | pMP8.CAG- D4N109G | this paper | progenitor: pMP8.CAG | |
| Transfected construct (Mus musculus) | pMP8.CAG-Stop -D1ECD_D4ICD | this paper | progenitor: pMP8.CAG | |
| Transfected construct (Mus musculus) | pMP8.CAG-Stop- D4ECD_D1ICD | this paper | progenitor: pMP8.CAG | |
| Transfected construct (Mus musculus) | D1N-E3_D4-targeting | this paper | based on Dll1Dll1ki targeting | |
| Transfected construct (Mus musculus) | D1contD4-targeting | this paper | based on Dll1Dll1ki targeting | |
| Transfected construct (Mus musculus) | pLexM-Avi-His | this paper | progenitor: pLexM | |
| Transfected construct (Mus musculus) | pLexM-D1N-E5-Avi-His | this paper | progenitor: pLexM | |
| Transfected construct (Mus musculus) | pLexM-D4N-E5-Avi-His | this paper | progenitor: pLexM | |
| Transfected construct (Mus musculus) | pLexM-D1N-E3_D4-E5-Avi-His | this paper | progenitor: pLexM | |
| Transfected construct (Mus musculus) | pLexM-D4N-E3_D1-E5-Avi-His | this paper | progenitor: pLexM | |
| Transfected construct (Mus musculus) | pLexM-D1contD4-E5-Avi-His | this paper | progenitor: pLexM | |
| Transfected construct (Mus musculus) | pLexM-D4contD1-E5-Avi-His | this paper | progenitor: pLexM | |
| Transfected construct (Mus musculus) | pLexM-D4N109G-E5-Avi-His | this paper | progenitor: pLexM | |
| Antibody | Rat anti-DLL1 | PMID: 17664336; PMCID: PMC2064846; DOI: 10.1083/jcb. 200702009 | (1F9, rat monoclonal) | 1:50 (IF) |
| Antibody | Goat anti-DLL4 | R and D Systems | Cat. #AF1389 RRID:AB_354770 | 1:50 (IF) |
| Antibody | Mouse anti- panCadherin | Sigma-Aldrich | Cat. #C1821 RRID:AB_476826 | 1:250 (IF) |
| Antibody | Donkey anti- mouse Alexa 555 | Invitrogen | Cat. #A-31570 RRID:AB_2536180 | 1:100 (IF) |
| Antibody | Donkey anti-goat Alexa 488 | Invitrogen | Cat. #A-11055 RRID:AB_2534102 | 1:100 (IF) |
| Antibody | Donkey anti-rat Alexa 488 | Invitrogen | Cat. #A-21208 RRID:AB_2535794 | 1:100 (IF) |
| Antibody | Anti-FLAG- Peroxidase (HRP) | Sigma-Aldrich | (M2 mouse, monoclonal purified) Cat. #A8592 RRID:AB_439702 | 1:10 000 (WB) |
| Antibody | Mouse anti-β-Tubulin | Sigma-Aldrich | Cat. #T7816 RRID:AB_261770 | 1:500 000; 1:1 000 000 (WB) |
| Antibody | Anti-mouse HRP | Amersham | Cat. #NA931 RRID:AB_772210 | 1:10 000 (WB) |
| Antibody | MHC (Myosin Heavy Chain) | Sigma-Aldrich | Cat. #M4276 RRID:AB_477190 | 1:250 (IHC) |
| Antibody | Anti-DIG AP fab fragment | Roche | Cat. #1093274 | 1: 5 000 (ISH) |
| Antibody | Anti-mouse biotinylated (BA9200/goat) | Vector Laboratories | Cat. #BA-9200 RRID:AB_2336171 | 1:200 (IHC) |
| Commercial assay or kit | Luciferase Cell Culture Lysis 5X Reagent | Promega | Cat. #E1531 | |
| Commercial assay or kit | Luciferase Assay Reagent | Promega | Cat. #E1483 | |
| Commercial assay or kit | SuperScript IV Reverse Transcriptase | Invitrogen | Cat. #18090050 | |
| Commercial assay or kit | Expand High-Fidelity PCR system | Roche | Cat. #04743733001 | |
| Commercial assay or kit | Tri-Reagent | Sigma-Aldrich | Cat. #T9424 | |
| Chemical compound, drug | Sulfo-NHS-LC-Biotin | Thermo | Cat. #21335 | |
| Chemical compound, drug | Pierce NeutrAvidin Agarose | Thermo | Cat. #29200 | |
| Chemical compound, drug | cOmplete, Mini, EDTA-free Proteinase Inhibitor Cocktail | Roche | Cat. #04693159001 | |
| Chemical compound, drug | BM-Purple AP substrate Roche | Sigma-Aldrich | Cat. #11442074001 | |
| Chemical compound, drug | G418 | Biochrom | Cat. #291–25 | 125 μg/ml |
| Chemical compound, drug | HAT | Gibco | Cat. #31062–037 | 1:300 |
| Chemical compound, drug | HT | Gibco | Cat. #11067030 | 1:100 |
| Chemical compound, drug | Tunicamycin | Sigma-Aldrich | Cat. #T7765 | 1 μg/ml |
| Chemical compound, drug | Alcian blue | Sigma-Aldrich | Cat. #A5268 | 5% working solution |
| Chemical compound, drug | Alizarin red | Sigma-Aldrich | Cat. #A5533 | 5% working solution |
| Other | WesternBright Quantum HRP substrate | Advansta | Cat. #12042-D20 | as recommended by the manufacturer |
| Other | Amersham ECL Detection Reagent | GE Healthcare Life Sciences | Cat. #RPN2106 | as recommended by the manufacturer |
| Sequence-based reagent | DLL1 wt For | other | NA | 5‘-CTGAAGCGACCT GGCCCTGATAGCAC-3’ |
| Sequence-based reagent | DLL1 wt Rev | other | NA | 5‘-GGAGCTCCAGA CCTGCGCGGG-3’ |
| Sequence-based reagent | Dll1lacZ For | other | NA | 5‘-ATCCCTGGGT CTTTGAAGAAG-3’ |
| Sequence-based reagent | Dll1lacZ Rev | other | NA | 5‘-TGTGAGCGAGTA ACAACCCGTCGGATT-3’ |
| Sequence-based reagent | Dll1Dll1ki For | other | NA | 5‘-GGTTTGGGGAT CCATAACTTCG-3’ |
| Sequence-based reagent | Dll1Dll1ki Rev | other | NA | 5‘-GCCAGTCAGTTC CCAGTAAGAAGTC-3’ |
| Sequence-based reagent | Dll1Dll4ki For | other | NA | 5‘-AAGGACAACC TAATCCCTGCCG-3’ |
| Sequence-based reagent | Dll1Dll4ki Rev | other | NA | 5‘-TGCCACATCG CTTCCATCTTAC-3’ |
| Sequence-based reagent | Dll1loxP For | other | NA | 5‘-GCATTTCTCAC ACACCTC-3’ |
| Sequence-based reagent | Dll1loxP Rev | other | NA | 5‘-GAGAGTACTT GATGGAGCAAG-3’ |
| Sequence-based reagent | T(s):Cre For | other | NA | 5‘-AATCTTTGG GCTCCGCAGAG-3’ |
| Sequence-based reagent | T(s):Cre Rev | other | NA | 5‘-ACGTTCACCGGC ATCAACG-3’ |
| Sequence-based reagent | ZP3:Cre For | other | NA | 5‘-GCCTGCATTACC GGTCGATGCAACGA-3’ |
| Sequence-based reagent | ZP3:Cre Rev | other | NA | 5‘-GTGGCAGATGGC GCGGCAACACCATT-3’ |
| Sequence-based reagent | Hprt-CAGD1ECD_ D4ICD + neo For | this paper | NA | 5‘-CCTAGCCCCTGCA AGAACGGAGC-3’ |
| Sequence-based reagent | Hprt-CAGD1ECD_ D4ICD + neo Rev | this paper | NA | 5‘-TTGCCACAATTG GACTTGTC-3’ |
| Sequence-based reagent | Hprt-CAGD4ECD_ D1ICD + neo For | this paper | NA | 5‘-CACTGTGAGCAT AGTACC TTGAC-3’ |
| Sequence-based reagent | Hprt-CAGD4ECD_ D1ICD + neo Rev | this paper | NA | 5‘-CATGGTTTCTGTCT CTCCCCCACAGGG-3’ |
| Sequence-based reagent | HprtD1ECD_D4ICDrec and HprtD4ECD_D1ICDrec For (activated allele) | this paper | NA | 5‘-ACATGGCCGTCATC AAAGAG-3’ |
| Sequence-based reagent | HprtD1ECD_D4ICDrec and HprtD4ECD_D1ICDrec Rev (activated allele) | this paper | NA | 5‘-GGGCAACAGAGA AATATCCTGTCTC-3’ |
| Sequence-based reagent | Dll1D1N-E3_D4ki For | this paper | NA | 5‘-CTGTCTGCCAGG GTGTGATGACCAAC-3’ |
| Sequence-based reagent | Dll1D1N-E3_D4ki Rev | this paper | NA | 5‘-ATCGCTGATG TGCAGTTCACA-3’ |
| Sequence-based reagent | Dll1D1N-E3_D4ki For | this paper | NA | 5‘-TGCAGGAG TTCGTCAACAAG-3’ |
| Sequence-based reagent | Dll1D1N-E3_D4ki Rev | this paper | NA | 5‘-ATAGTGGCC AAAGTGGTCATC CCGAGGCTT-3’ |
| Sequence-based reagent | Y-Chromosome For | other | NA | 5‘-CTGGAGCTCT ACAGTGATGA-3’ |
| Sequence-based reagent | Y-Chromosome Rev | other | NA | 5‘-CAGTTACCAA TCAACACATCAC-3’ |
| Sequence-based reagent | mNotch1 For | other | NA | 5‘-TAGGTGCTC TTGCGTCACTTGG-3’ |
| Sequence-based reagent | mNotch1 Rev | other | NA | 5‘-TCTCCCCACT CGTTCTGATTGTC-3’ |
| Sequence-based reagent | hNOTCH1 For | PMID: 22002304; DOI: 10.1038/onc .2011.467 | NA | 5‘-TCCACCAG TTTGAATGGTCA-3’ |
| Sequence-based reagent | hNOTCH1 Rev | PMID: 22002304; DOI: 10.1038/onc. 2011.467 | NA | 5‘-AGCTCATCA TCTGGGACAGG-3’ |
| Sequence-based reagent | hNOTCH2 For | this paper | NA | 5‘-CAACCGCCA GTGTGTTCAAG-3’ |
| Sequence-based reagent | hNOTCH2 Rev | this paper | NA | 5‘-GAGCCATG CTTACGCTTTCG-3’ |
| Sequence-based reagent | hNOTCH3 For | PMID: 16327489; PMCID: PMC1409885 | NA | 5‘-AGATTCTCA TCCGAAACCGCTCTA-3’ |
| Sequence-based reagent | hNOTCH3 Rev | PMID: 16327489; PMCID: PMC1409885 | NA | 5‘-GGGGTCTC CTCCTTGCTATCCTG-3’ |
| Sequence-based reagent | hGAPDH For | PMID: 22002304; DOI: 10.1038/onc. 2011.467 | NA | 5‘-GAGTCAACG GATTTGGTCGT-3’ |
| Sequence-based reagent | hGAPDH Rev | PMID: 22002304; DOI: 10.1038/onc. 2011.467 | NA | 5‘-TTGATTTTGG AGGGATCTCG-3’ |
| Sequence-based reagent | Forward primer - correct integration into Hprt locus | other | NA | 5’-GGGAACCTGTT AGAAAAAAAGA AACTATGAAGAAC-3’ |
| Sequence-based reagent | Reverse primer - correct integration into Hprt locus | other | NA | 5’-GGCTATGAACTAATG GACCCCG-3’ |
| Sequence-based reagent | Forward primer - correct integration into Dll1 locus | other | NA | 5‘-TGTCACGT CCTGCACGACG-3’ |
| Sequence-based reagent | Reverse primer - correct integration into Dll1 locus | other | NA | 5‘-GGTATCGGA TGCACTCATCGC-3’ |
| Sequence-based reagent | guideA-For | this work, according to http://crispr.mit.edu/ | NA | 5'-GGCAGCGGG CAGCTCCGGAT-3' |
| Sequence-based reagent | guideB-Rev | this work, according to http://crispr.mit.edu/ | NA | 5'-GCTCTCGGG GTCGTCGCTGC-3' |
| Recombinant DNA reagent | Uncx-probe (plasmid) | DOI 10.1007/ s004270050120 | ||
| Recombinant DNA reagent | pLexM (plasmid) | DOI 10.1074/ jbc.M113.454850 | ||
| Recombinant DNA reagent | Cas9 D10A nickase (plasmid) | DOI 10.1126/ science.1231143 | Addgene #42335 | |
| Recombinant DNA reagent | Dll1 5' SB probe | PMID: 26801181; PMCID: PMC4788113; DOI: 10.1534/genetics. 115.184515 | 5’ probe: a 316 bp BamHI/AvaII fragment 3.8 kb upstream of Dll1 exon 1 | |
| Recombinant DNA reagent | Dll1 3' SB probe | PMID: 26801181; PMCID: PMC4788113; DOI: 10.1534/genetics. 115.184515 | 3’ probe: a 528 bp PCR fragment in Dll1 intron five obtained with primers CCTGTGAGACTTTCTA CGTTGCTC/CACAACCATGTCA CCTTCTAGATTC | |
| Software, algorithm | ImageJ; FIJI | RRID:SCR_003070 | ISAC Manager | |
| Software, algorithm | Prism | GraphPad | RRID:SCR_002798 | |
| Software, algorithm | Olympus | Olympus FLUOVI EW FV1000 | RRID:SCR_014215 |
Additional files
-
Supplementary file 1
Relative cell surface expression levels of the ligand proteins used co-culture studies.
Levels of one representative clone for each ligand protein were determined by cell surface biotinylation and quantitative analysis of Western blots after immunoprecipitation. Values for DLL1 and DLL4 see Figure 4—source data 3. ND: due to closely co-migrating background band protein levels could not be quantified. Surface expression validated by biotinylation of ES cells and antibody staining of PSMs.
- https://doi.org/10.7554/eLife.40045.024
-
Supplementary file 2
Relative ligand protein expression level in ES cell clones.
The protein level of three independent clones used for co-culture studies was determined by quantitative analysis of Western blots and normalized to DLL1 clone #1 protein level measured in the same assay. Values for DLL1 and DLL4 see Figure 4—source data 2. ND: due to closely co-migrating background band protein levels could not be quantified.
- https://doi.org/10.7554/eLife.40045.025
-
Transparent reporting form
- https://doi.org/10.7554/eLife.40045.026
Download links
A two-part list of links to download the article, or parts of the article, in various formats.
Downloads (link to download the article as PDF)
Open citations (links to open the citations from this article in various online reference manager services)
Cite this article (links to download the citations from this article in formats compatible with various reference manager tools)
The ectodomains determine ligand function in vivo and selectivity of DLL1 and DLL4 toward NOTCH1 and NOTCH2 in vitro
eLife 7:e40045.
https://doi.org/10.7554/eLife.40045


