JNK-dependent cell cycle stalling in G2 promotes survival and senescence-like phenotypes in tissue stress
- University of Freiburg, Germany
- Ludwig-Maximilians-University Munich, Germany
- University of Cologne, Germany
Figures
Figure 1 with 1 supplement
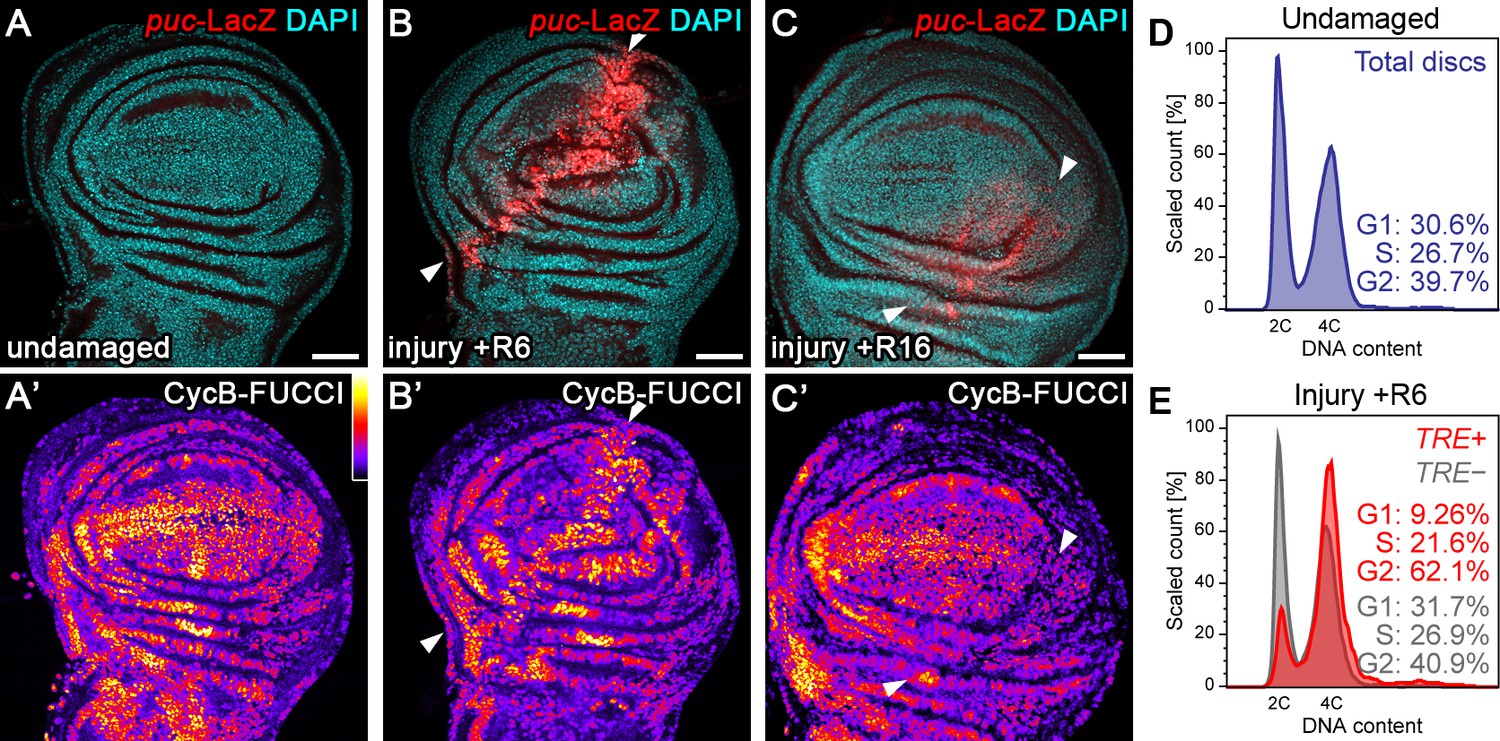
Tissue injury induces a transient G2-shift.
(A–C’) Undamaged control wing disc (A), a wing disc with surgical damage 6 hr (B) or 16 hr (C) into the recovery (R) period. Wing discs were counterstained with DAPI (cyan in A-C) and express the JNK-reporter puc-LacZ (red in A-C) as well as the G2-specific FUCCI reporter ubi-mRFP-NLS-CycB1-266 (see Figure 1—figure supplement 1B,C) visualized using a thermal LUT (A’–C’). Arrows indicate injury axis (B,C). A quantification of JNK reporter (TRE-RFP) activity over time is presented in Figure 5M. (D–E) Flow cytometry analysis of DNA content in undamaged control wing discs (D) and wing discs with surgical damage 6 hr into the recovery period (E). JNK-signaling cells in damaged discs were detected by activation of TRE-RFP. TRE-RFP positive cells in undamaged control discs represent only a 2.5% of the total cell population and are thus not separately visualized. Detected events were plotted as counts scaled to mode against fluorescence intensity of the DNA stain Hoechst. Scale bars: 50 µm.
Figure 1—figure supplement 1
Tissue injury induces a transient G2-shift.
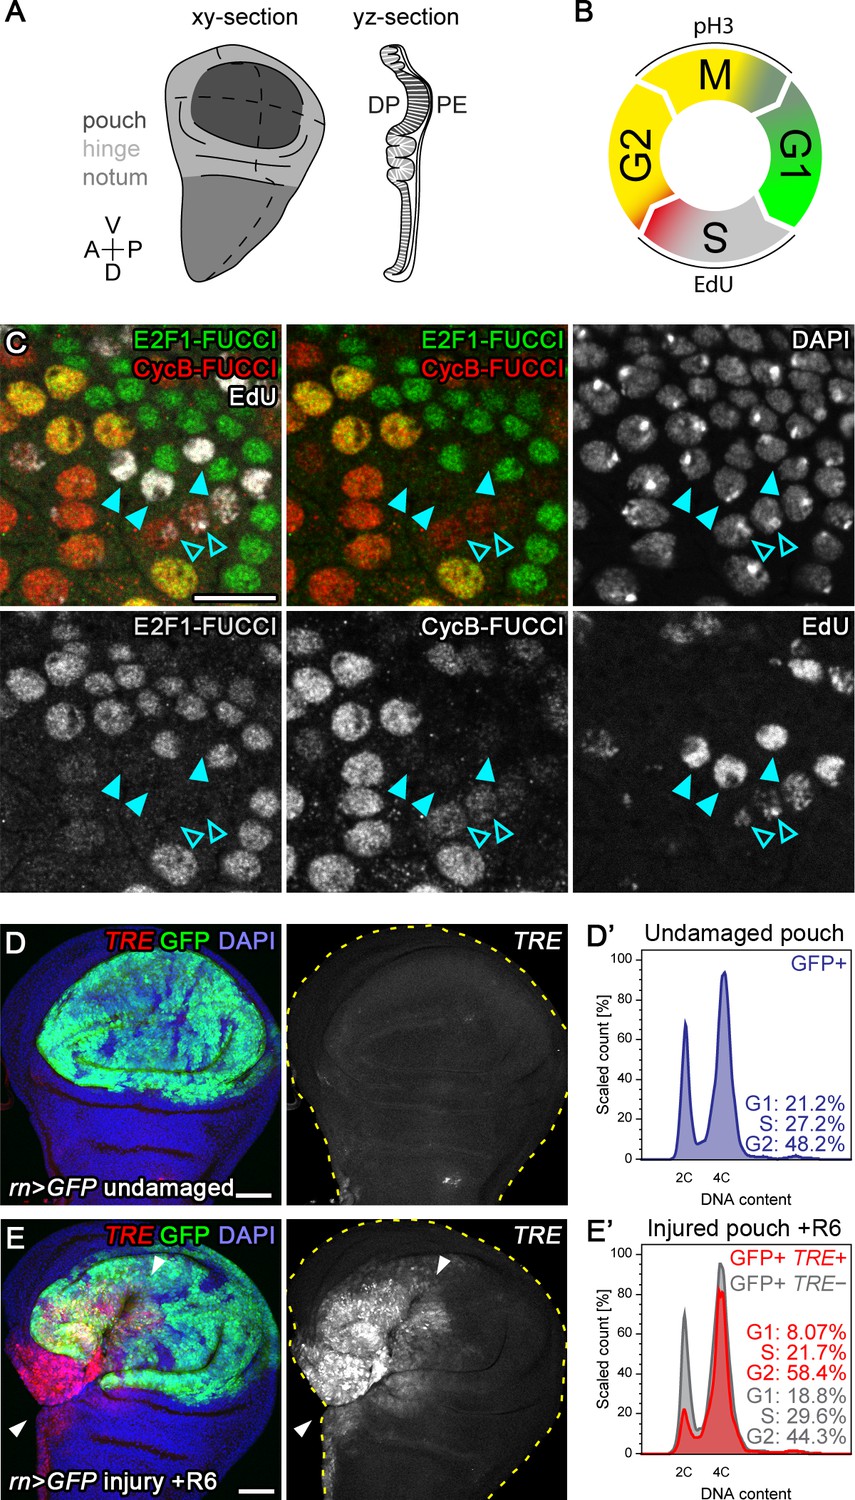
(A) Scheme of a xy-section and yz-section through a wing imaginal disc. Gray shading in xy-view defines the disc subregions of pouch, hinge and notum. Broken lines represent the Anterior-Posterior and Dorsal-Ventral compartment boundaries. The yz-section scheme visualizes the 2 layers of the imaginal disc ‘sac’. The columnar cells making up the pouch belong to the ‘Disc Proper’ whereas the overlying squamous cells belong to the ‘Peripodial Epithelium’. Most images in this study represent xy-sections of the pouch and include domains of the hinge, unless noted otherwise. (B) Schematic representation of cell cycle phase identification using a combination of FUCCI reporters, EdU incorporation and mitotic markers, such as phospho-Histone 3 (pH3). (C) FUCCI reporter and EdU incorporation assays in the peripodium of a wild type wing disc. Identical results are observed in the densely packed epithelium of the disc proper. Wide-spread euchromatic incorporation of EdU (early S-phase) correlates with absence of fluorescence of both mRFP-NLS-CycB1-266 (red) and GFP-E2f11-230 (green) FUCCI reporter (filled arrowheads). Heterochromatic incorporation of EdU (late S-phase) correlates with mild elevation of the G2-specific FUCCI reporter mRFP-NLS-CycB1-266 (red) (open arrowheads). Cells with elevated levels of both FUCCI reporters (yellow) are in late G2 (Zielke et al., 2014) after which the FUCCI reporter mRFP-NLS-CycB1-266 (red) is targeted for proteasomal degradation by APC/C during mitosis. The FUCCI reporter GFP-E2f11-230 (green) progressively accumulates in G1 until the onset of S-phase (Zielke et al., 2014). (D–E’) Flow cytometry analysis of DNA content (D’,E’) from undamaged control wing discs (D,D’) and wing discs with surgical injury 6 hr into the recovery (R6) period (E,E’). The pouch of the wing disc was labeled by rnGAL4-driven expression of UAS-GFP (green in D,E). TRE-RFP (red in D,E) expression is almost undetectable in the pouch of undamaged control discs. JNK-signaling cells in damaged discs were detected by activation of TRE-RFP (E,E’). Arrowheads indicate axis of injury in (E). Only GFP-positive flow cytometry events were plotted in (D’,E’). TRE-RFP positive cells in the undamaged pouch represent <0.1% of the total cell population and are thus not visualized. These plots are derived from the same dataset shown in Figure 1. Maximum projections of multiple confocal sections are shown in D,E. Scale bars: 10 µm (C) and 50 µm (D,E).
Figure 2 with 1 supplement
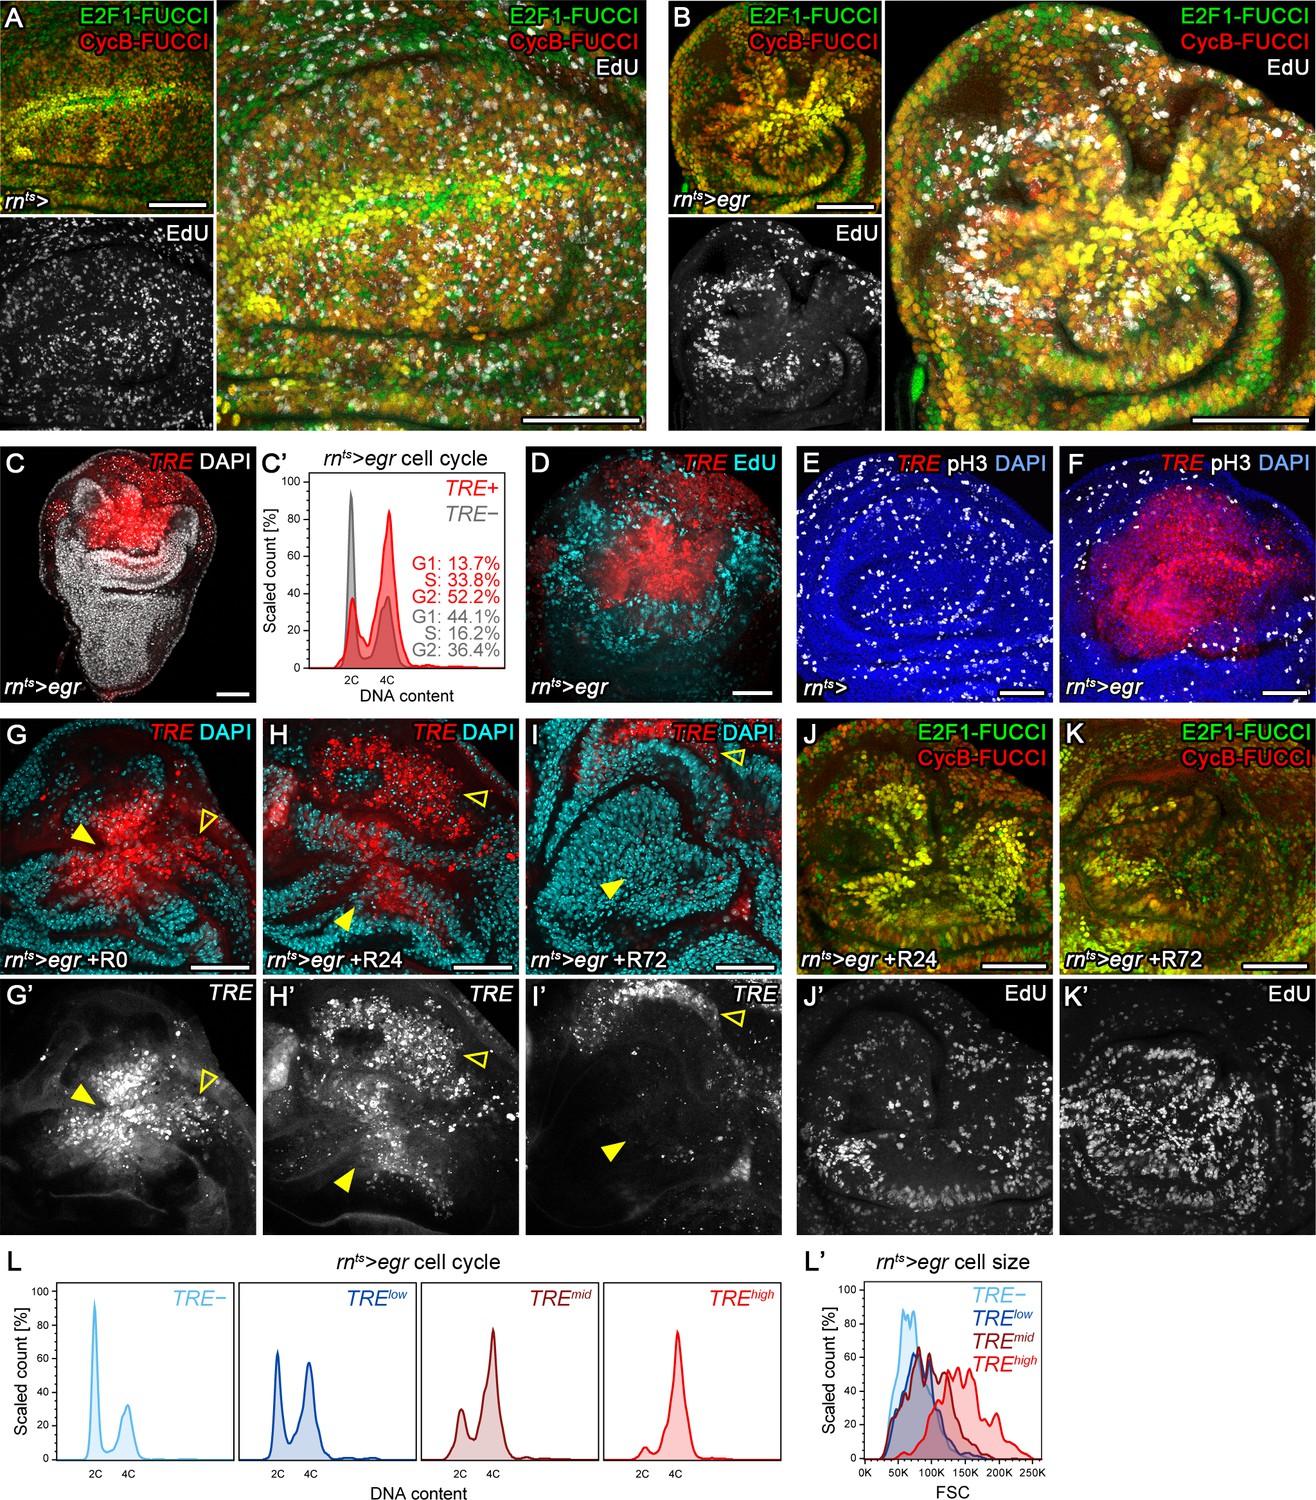
Stress-induced JNK activity correlates with G2-stalling.
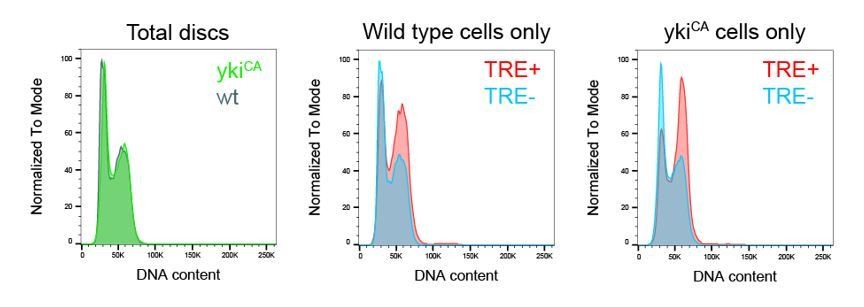
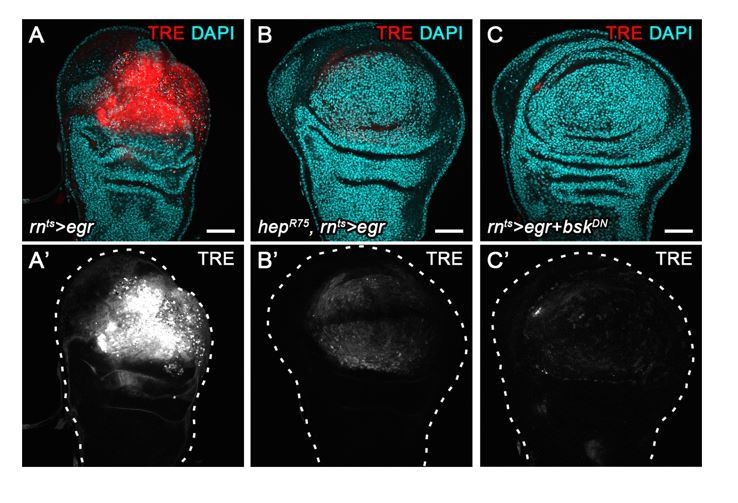
(A,B) Control wing disc (A) and a wing disc at 0 hr into the recovery period, after 24 hr of egr-expression in the pouch domain (B) (see Figure 2—figure supplement 1A). Discs also express the complete FUCCI reporter system consisting of ubi-mRFP-NLS-CycB1-266 (red) and ubi-GFP-E2f11-230 (green) and were analyzed for EdU incorporation (grey) to reveal DNA replication activity. The field of view includes the pouch and hinge domain of the disc. The horizontal G1 and G2 pattern in control discs (A) represents normal developmental pattern at the dorsal-ventral compartment boundary. Note the intensely labeled G2-cells lacking EdU incorporation activity at the center of the folded pouch tissue in the egr-expressing disc (B). (C) JNK-signaling cells in egr-expressing discs were detected by activation of TRE-RFP (red). Discs were counterstained with DAPI (gray). (C’) Flow cytometry analysis of DNA content in TRE-positive (red) and TRE-negative (gray) cells from egr-expressing discs. Detected events were plotted as counts scaled to mode against fluorescence intensity of the DNA stain Hoechst. (D–F) Control wing disc (E) and egr-expressing discs at 0 hr into the recovery period (D,F) expressing the JNK-reporter TRE-RFP (red). Discs were assessed for cell cycle activity by EdU incorporation to reveal DNA replication (cyan in D) and by staining for phospho-H3 to reveal mitotic cells (pH3) (gray in E,F). Note pronounced lack of either in JNK-signaling domains. (G–K’) Formerly egr-expressing discs at 0 hr (R0), 24 hr (R24) and at 72 hr (R72) into the recovery period. Discs were counterstained with DAPI (cyan in G-I) and either express the JNK-reporter TRE-RFP (G’-I’, red in G-I) or the FUCCI reporters (J,K). FUCCI-reporters expressing discs were assayed for EdU incorporation to reveal DNA replication (J’,K’). Compare J-K’ to B. A quantification of TRE reporter activity over time is presented in Figure 5N. Filled arrows point to the pouch domain where formerly egr-expressing cells and the regenerating tissue is located. Open arrows point to apoptotic debris. (L,L’) Flow cytometry analysis of TRE-RFP reporter activity, DNA content (Hoechst) and cell size (forward scatter, FSC). TRE reporter activity was divided into bins of RFP fluorescence intensity. Cells from four bins (negative, low, medium and high RFP intensity) were represented by different shades and plotted for their DNA content and cell size. Note that cells in the high TRE bin are almost exclusively in G2 and are the largest in size. Maximum projections of multiple confocal sections are shown in A,B,D-F,J-K’. Scale bars: 50 µm.
Figure 2—figure supplement 1
Stress-induced JNK activity correlates with G2-stalling.
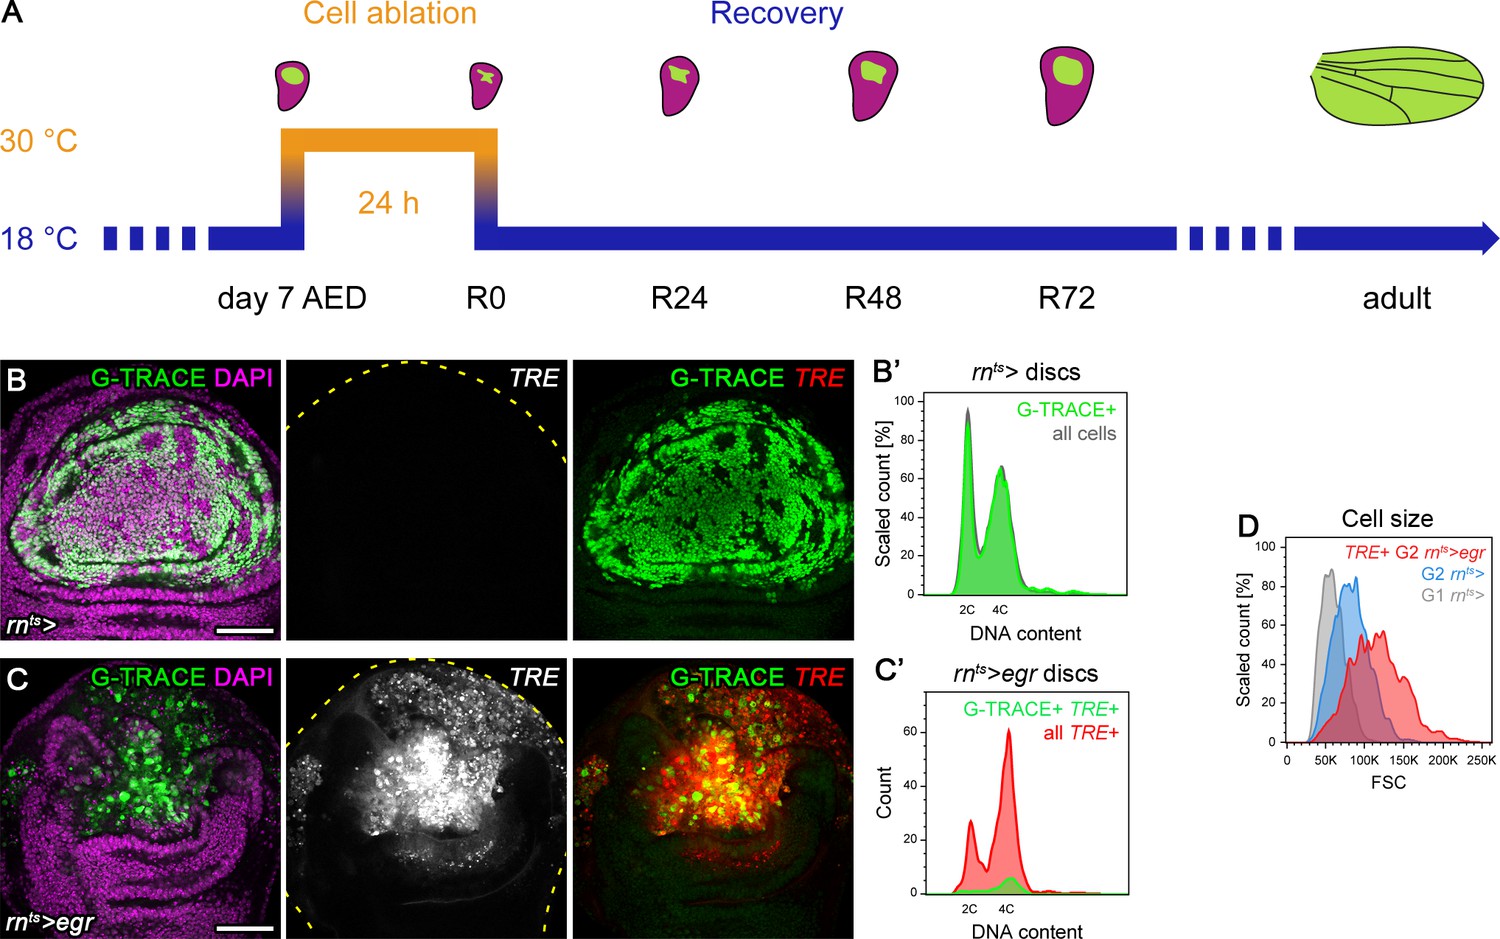
(A) Time line of development and induction of cell ablation by expression of pro-apoptotic transgenes as a function of rearing temperature. Larvae were raised at 18°C (blue) and transferred to 30°C (orange) for 24 hr to induce expression of pro-apoptotic transgenes in wing imaginal discs at day seven after egg deposition (AED). The wing pouch region (green) in third instar wild type disc (magenta) gives rise to future adult wings. Expression of pro-apoptotic transgenes under the control of rnGAL4 in the pouch causes cell ablation and reduction in the size of the pouch. After expression of pro-apoptotic transgenes ceases by reducing the raising temperature to 18°C, the surviving pouch tissue increases in size between 0 hr to 72 hr of the recovery period (R0, R24, R48, R72). Analysis of adult wing sizes allows conclusion about the extent of the original injury and the success of the regenerative response. Most experiments utilizing expression of pro-apoptotic transgenes like eiger (egr) or head involution defective (hid) were visualized at R0, unless noted otherwise. Wing discs and adult wing depictions are not drawn at the same scale. (B–C’) Control (B,B’) and egr-expressing wing discs (C,C’) at 0 hr into the recovery period. Cells of the rnGAL4-lineage were permanently labeled by expression of GFP (green in B,C) using the G-TRACE lineage labeling system (Evans et al., 2009). Discs were counterstained for DAPI (magenta in B,C) and express the JNK-reporter TRE-RFP (red in B,C). Note broad activation of TRE-RFP autonomous and non-autonomous to surviving egr-expressing cells (C). Flow cytometry events were plotted as counts scaled to mode (B’) or absolute counts (C’) against fluorescence intensity of the live DNA stain Hoechst for all cells (gray in B’), for cells of the rnGAL4 G-TRACE labeled lineage (green in B’), for cells from egr-expressing discs positive for TRE-RFP (red in C’), and for the subpopulation of cells surviving egr expression in the rnGAL4 lineage labeled by G-TRACE (green in C’). These plots are derived from the same dataset shown in Figure 2. TRE-RFP positive cells in undamaged control discs represent only a 2.5% of the total cell population and are thus not visualized separately. Please note that GFP-negative cells activating TRE-RFP non-autonomously to the rnGAL4 lineage also experience a pronounced cell cycle shift if compared to non-ablated control wing discs. (D) Flow cytometry analysis of cell size in G1-phase (gray) and G2-phase (blue) populations of cells from rnts> control wing discs and in a G2-phase (red) population of TRE-RFP positive cells from rnts>egr discs. Note that TRE-positive G2-phase cells are larger than normally cycling cells in G2. Scale bars: 50 µm.
Figure 3 with 2 supplements
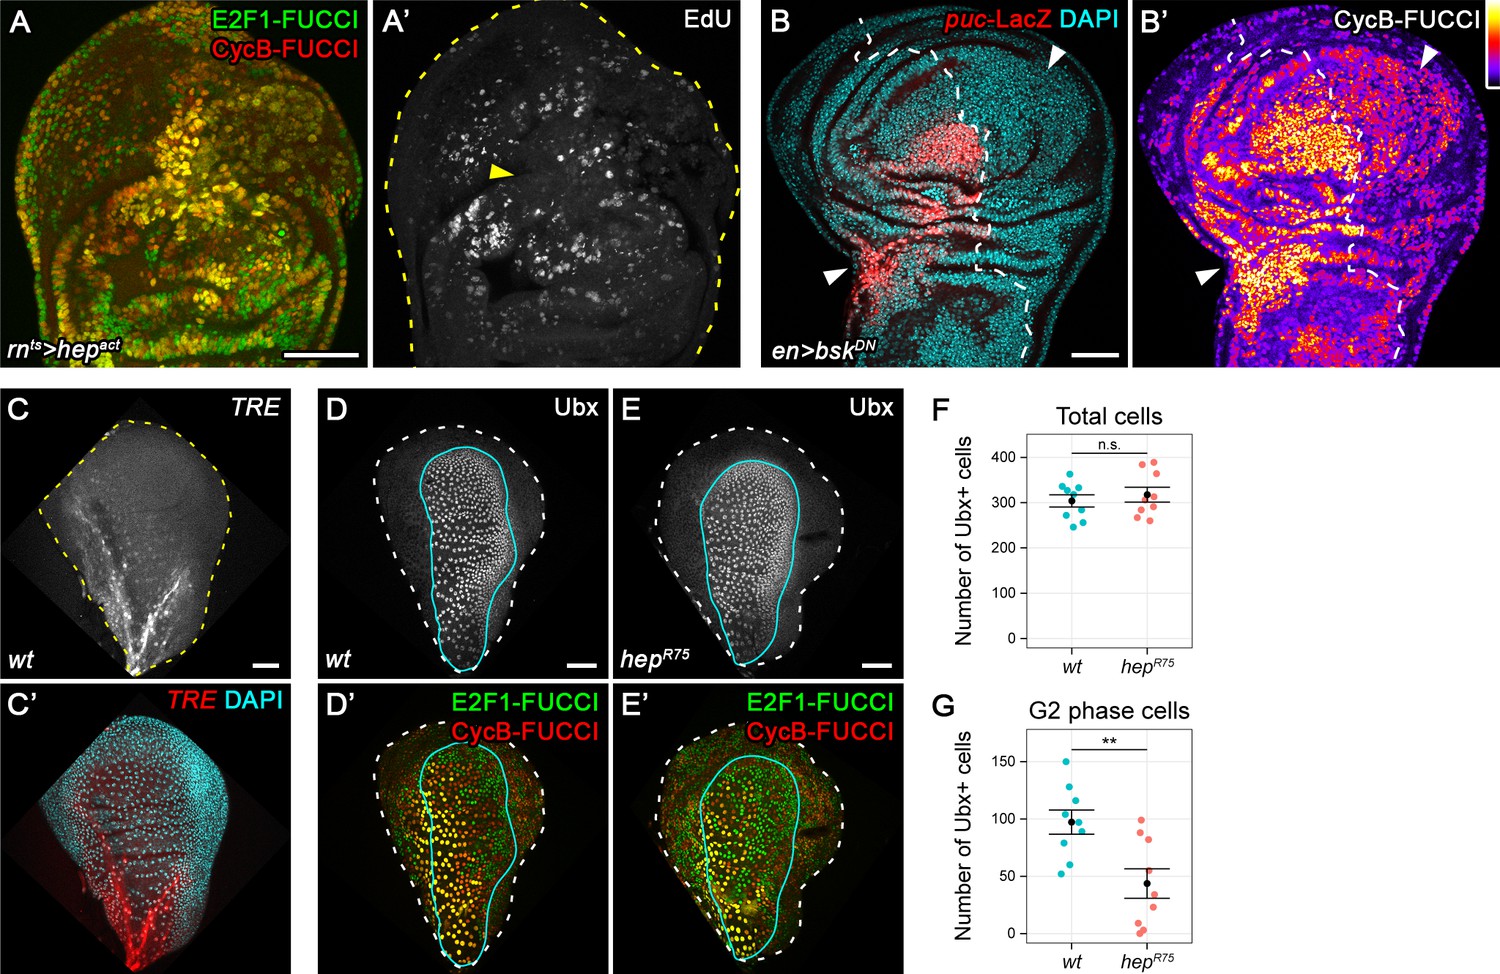
JNK activity is necessary and sufficient for G2-stalling.
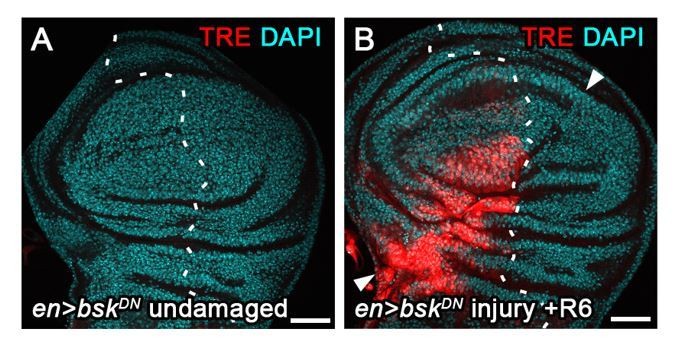
(A,A’) A wing disc expressing a constitutively active JNKK hepACT in the pouch, assayed by FUCCI reporters (A) and EdU incorporation (A’) for cycling cells. At the center of the pouch, a G2-shifted cell population lacks EdU incorporation (arrow in A’). (B,B’) A wing disc with surgical damage 6 hr into the recovery period and expressing bskDN in the posterior compartment (on the right-hand side of the dotted line) under control of engrailed(en)GAL4. Wing discs were counterstained with DAPI (cyan) and express the JNK-reporter puc-LacZ (red) as well as the G2-specific FUCCI reporter mRFP-NLS-CycB1-266 (thermal LUT). Arrows indicate axis of surgical injury verified by tissue deformation in basal sections. (C,C’) The peripodium of a wild type disc counterstained with DAPI (cyan in C’) and expressing the JNK-reporter TRE-RFP (C, red in C’). JNK signaling in the wing peripodium is required for wing eversion at the larval-pupal transition (Pastor-Pareja et al., 2004). (D–E’) The peripodium of size-matched wild type (D,D’) and hepR75 hemizygous mutant discs (E,E’) stained for Ubx (gray in D,E, outlined in cyan) and expressing both FUCCI reporters (D’,E’). (F–G) Quantifications of the total number of Ubx-positive cells (F) and of the Ubx-positive cells in G2 (G) in wild type and hepR75 hemizygous mutant discs. Graphs display mean ± SEM for wt, n = 9 and hepR75, n = 9 discs. U-tests were performed to test for statistical significance, n.s. = non significant, **p=0.011. Maximum projections of multiple peripodial confocal sections are shown in C-E’. Scale bars: 50 µm.
Figure 3—figure supplement 1
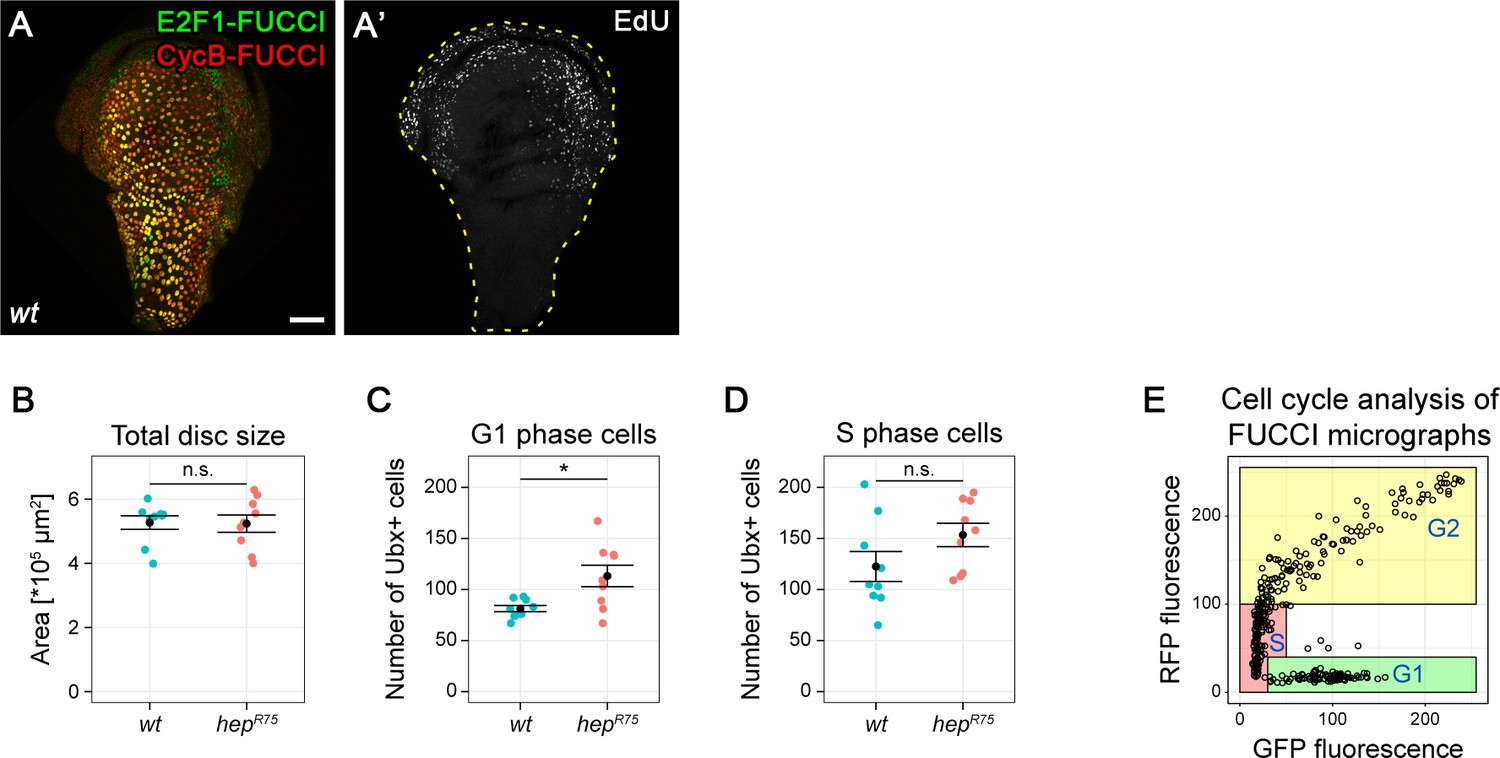
JNK activity is necessary and sufficient for G2-stalling.
(A,A’) The peripodium of a wild type disc expressing the FUCCI reporters (A) and assessed for cycling activity by EdU incorporation to reveal DNA replication activity (A’). (B–D) Quantification of the total disc area size (B), and the number of Ubx-positive cells in G1 phase (C) and S-phase (D) in wild type (blue) and hemizygous hepR75 (red) discs. These quantifications refer to the same dataset presented in Figure 3. Graphs display mean ± SEM for wt, n = 9 and hepR75, n = 9 discs. U-tests were performed to test for statistical significance, n.s. = not significant, *p < 0.05. (E) Cell cycle analysis in a wing disc peripodium based on automated quantification of FUCCI fluorescence intensity in microscopy images (see Materials and methods). Each point represents one Ubx-positive cell and is classified as G1, S or G2 phase according to GFP and RFP fluorescence intensities of the FUCCI reporters. Maximum projections of multiple peripodial confocal sections are shown. Scale bar: 50 µm.
Figure 3—figure supplement 2
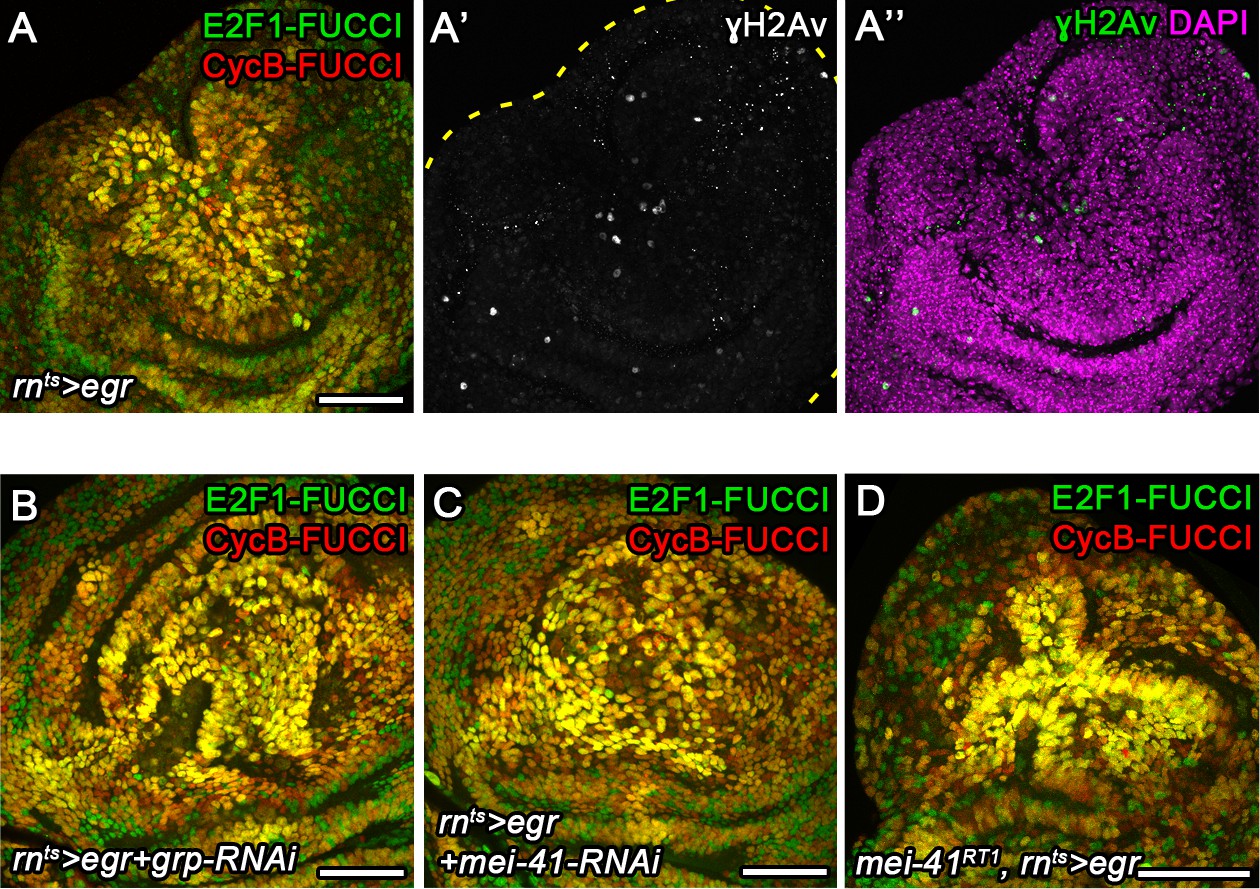
DNA damage is not rate-limiting for G2 stalling.
(A–A’’) egr-expressing disc at 0 hr into the recovery period expressing the FUCCI reporters (A) to visualize G2-stalled cells (yellow) was stained for phosphorylated H2Av (γH2Av, A’, green in A’’) a marker of dsDNA breaks (Khurana and Oberdoerffer, 2015). The disc was counterstained for DAPI (magenta in F’’). Note lack of correlation between γH2Av and FUCCI patterns. (B–D) egr-expressing discs at 0 hr into the recovery period expressing the FUCCI reporters and also expressing RNAi transgenes targeting grp (Drosophila Chk1) (B) or mei-41 (Drosophila ATR) (C) under the control of rnGAL4, or being hemizygous for an allele of mei-41 (D). Compare FUCCI profiles in (B–D) to (A). Maximum projections of multiple confocal sections are shown. Scale bars: 50 µm.
Figure 4 with 1 supplement
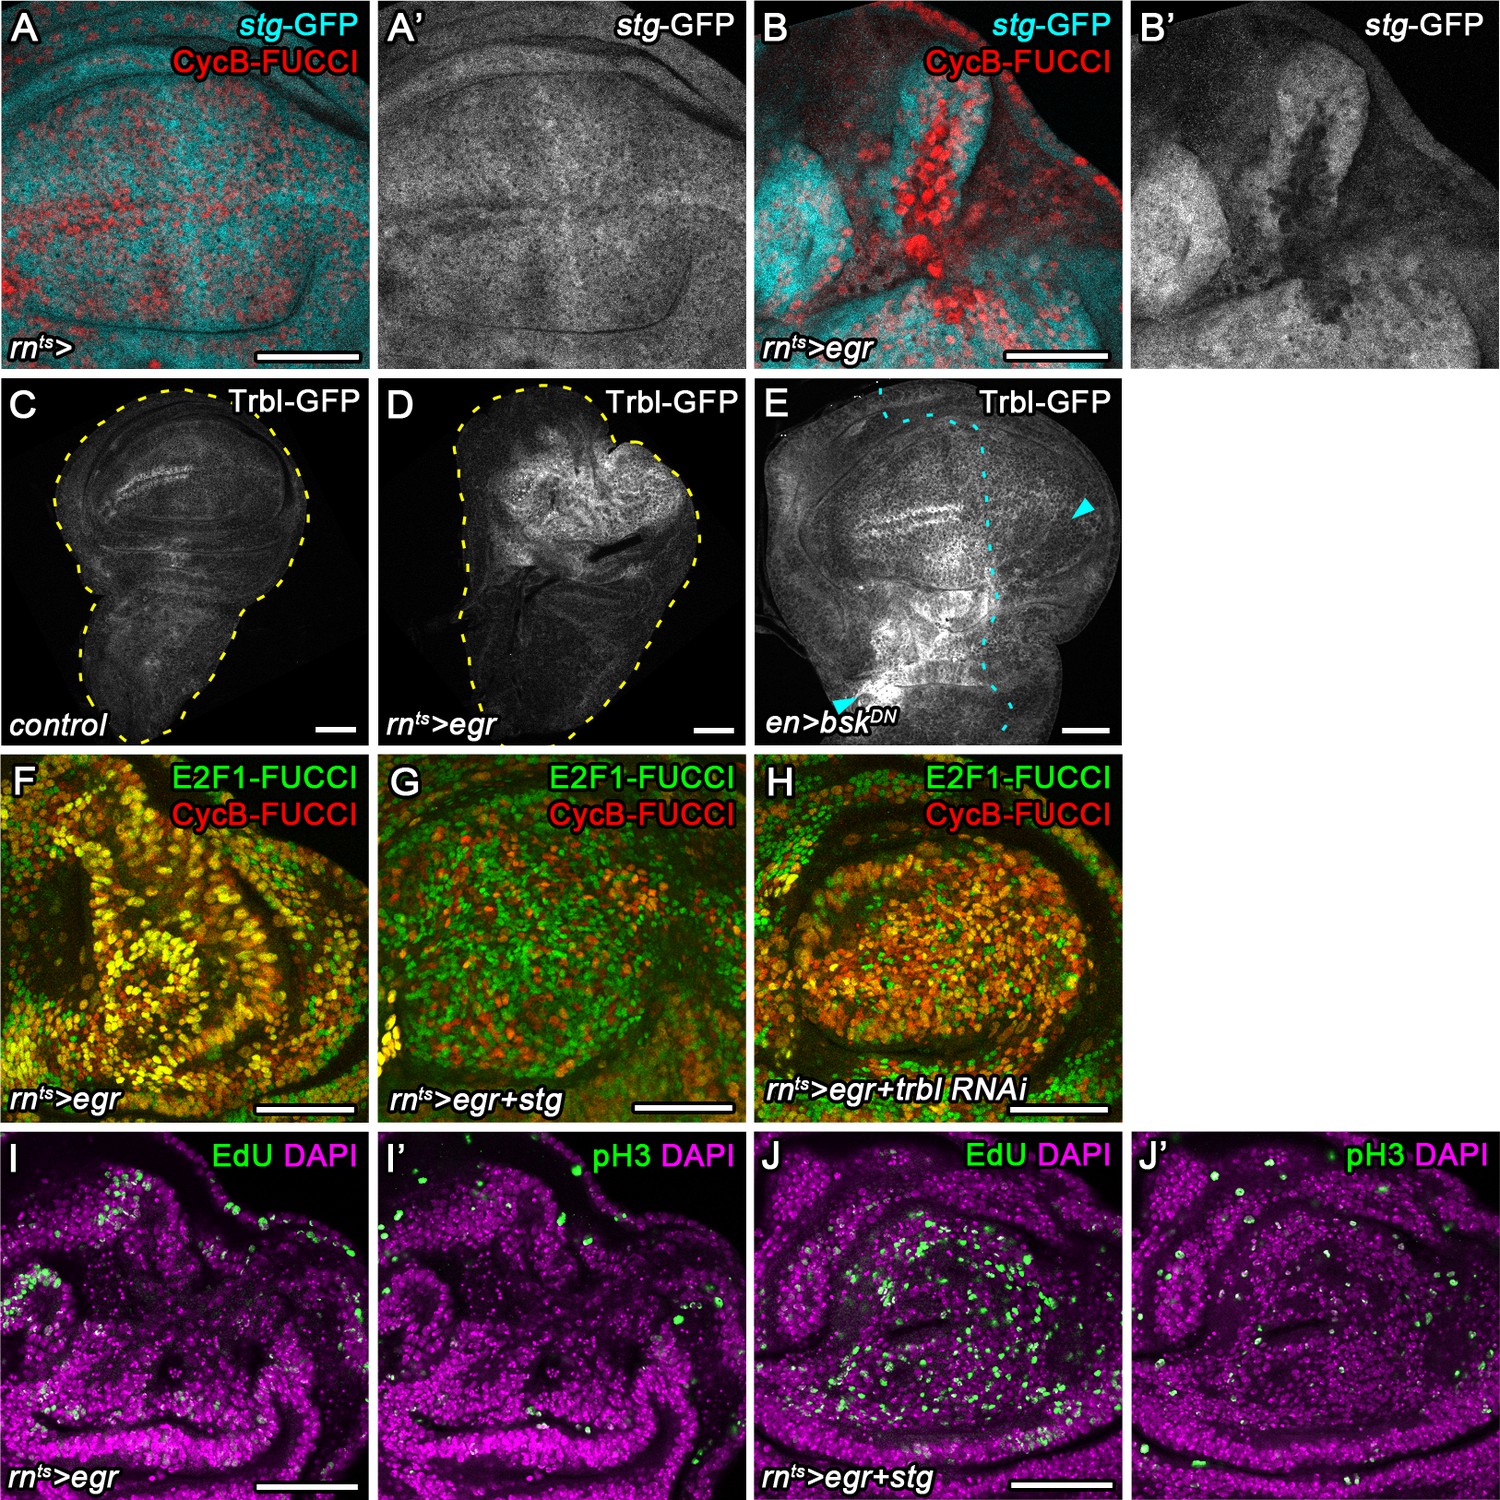
Cdc25/String and Tribbles regulate G2 stalling.
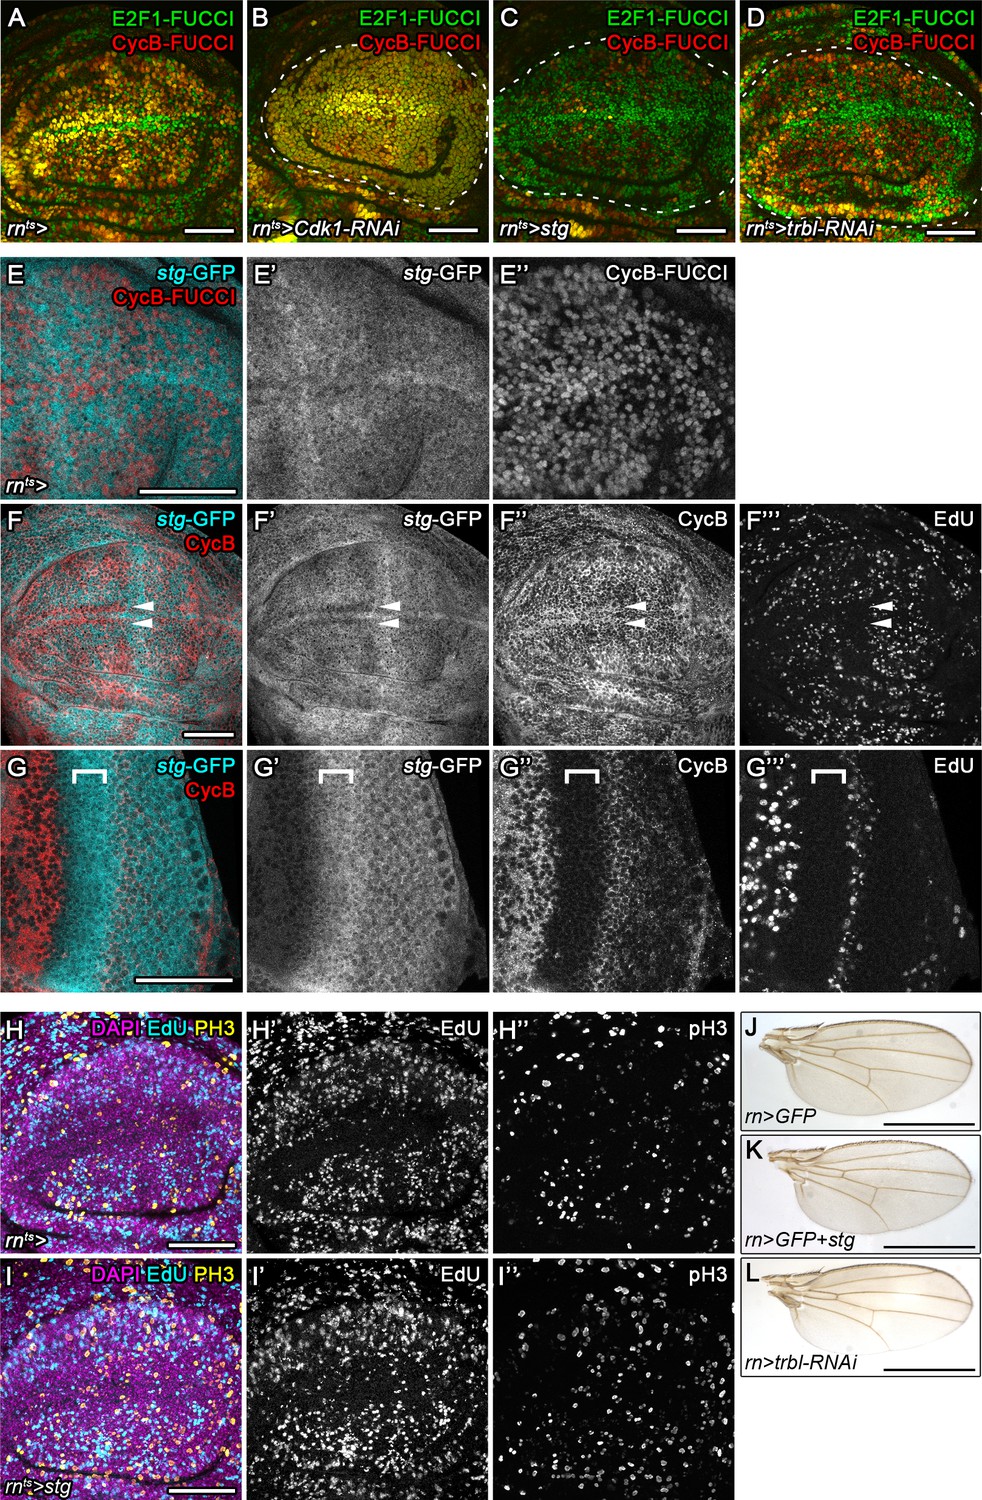
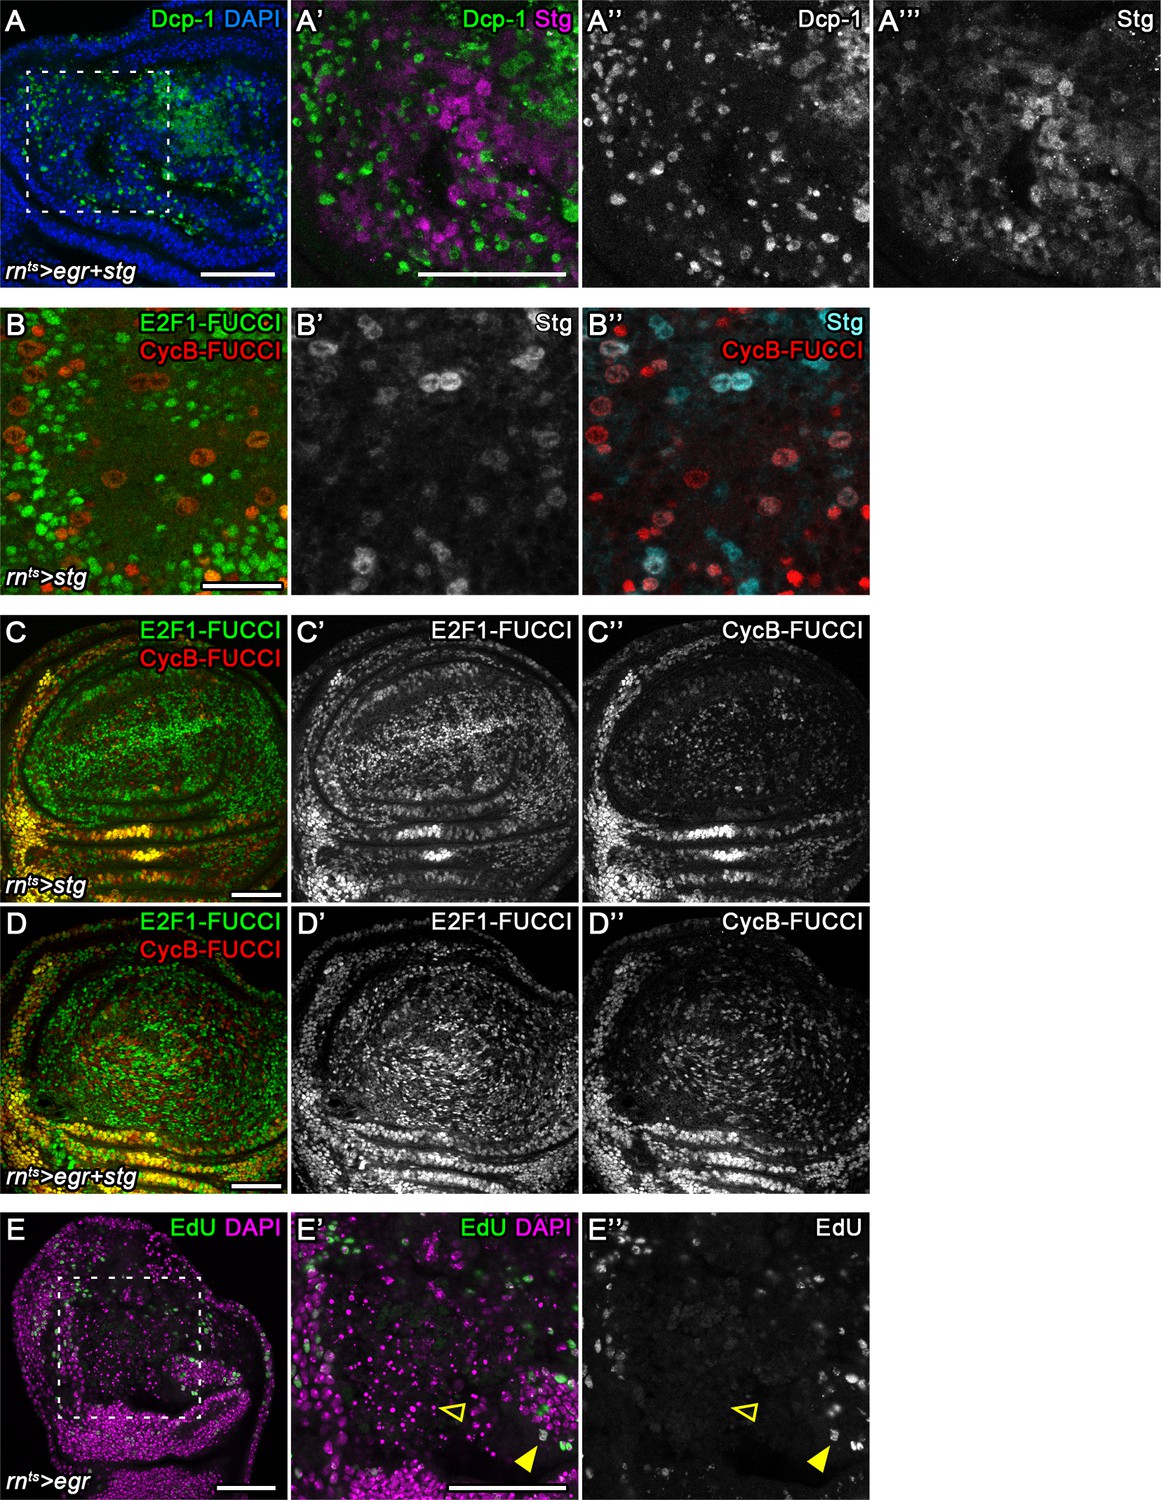
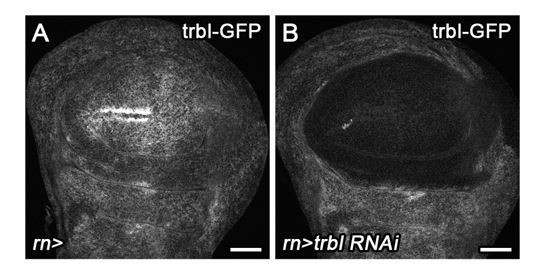
(A–B’) Control wing disc (A,A’) and egr-expressing disc at 0 hr into the recovery period (B,B’) expressing a GFP trap element in the stg locus (A’,B’, cyan in A,B) and the G2-specific FUCCI reporter mRFP-NLS-CycB1-266 (red in A,B). Note pronounced reduction of GFP expression in G2-arrested cells at the center of the pouch (B,B’). (C–E) Control wing disc (C), an egr-expressing disc at 0 hr into the recovery period (D), and a surgically damaged wing disc 6 hr into the recovery period expressing bskDN in the posterior compartment (on the right-hand side of the dotted line) under control of enGAL4 (E). All discs also express a GFP-tagged Trbl protein expressed from the native locus (Nagarkar-Jaiswal et al., 2015). Arrows indicate axis of surgical injury verified by tissue deformation in basal sections. (F–H) An egr-expressing disc (F), an egr,stg-co-expressing disc (G) and an egr,trbl RNAi-co-expressing disc at 0 hr into the recovery period expressing the FUCCI reporters. Note increase in the frequency of G1 cells in (G,H). (I–J’) An egr-expressing disc (I,I’) and an egr,stg-co-expressing disc (J,J’) analyzed by EdU incorporation to reveal DNA replication activity (green in I,J) and by staining for phospho-Histone3 to reveal mitotic cells (pH3) (green in I’,J’). Discs were counterstained with DAPI (magenta). Note increase in the frequency of S- and M-phase cells upon egr,stg co-expression. Maximum projections of multiple confocal sections are shown in F-H. Scale bars: 50 µm.
Figure 4—figure supplement 1
Cdc25/String and Tribbles regulate G2 stalling.
(A–D) A wild type control disc (A) or wing discs expressing an RNAi transgene targeting cdk1 (B), overexpressing stg (C) or expressing an RNAi transgene targeting trbl (D) under the control of rnGAL4. All discs express the FUCCI reporters. Note the shift towards G2-phase (B) or G1-phase (C,D) in the wing pouch (encircled by broken line) if compared to a wild type control disc. (E–E’’) A wing disc expressing a GFP trap element in the stg locus (E’, cyan in E) and the G2-specific FUCCI reporter mRFP-NLS-CycB1-266 (E’’, red in E). Note invariant GFP levels despite heterogeneous cell cycle profile of the tissue. Stg protein levels are expected to predominantly track with mRFP-NLS-CycB1-266. (F–G’’’) A wing disc (F–F’’’) and an eye disc (G–G’’’) expressing a GFP trap element in the stg locus and labeled for EdU incorporation to detect DNA replication activity and stained for Cyclin B. Note reduction of GFP expression at the anterior D/V boundary in the wing (arrows in F) and elevated GFP expression in the posterior eye disc and morphogenetic furrow (bracket in G) as previously reported for stg (Johnston and Edgar, 1998; Thomas et al., 1994). (H–I’’) Control wing disc (H–H’’) and an stg-overexpressing disc (I–I’’) under the control of rnGAL4. Discs were stained for DAPI (magenta in H,I) and assessed for cell cycle activity by EdU incorporation to reveal DNA replication (H’,I’, cyan in H,I) and by staining for phospho-Histone3 to reveal mitotic cells (pH3) (H’’,I’’, yellow in H,I). (J–L) Representative adult wings arising from of wild type control discs overexpressing GFP (J) or from wing discs overexpressing stg (K) or an RNAi construct targeting trbl (L) under the control of rnGAL4. Maximum projections of multiple confocal sections are shown in H-I. Scale bars: 50 µm (A–I), 1.0 mm (J–L).
Figure 5 with 1 supplement
Chronic stalling in G2 interferes with proliferative capacity.
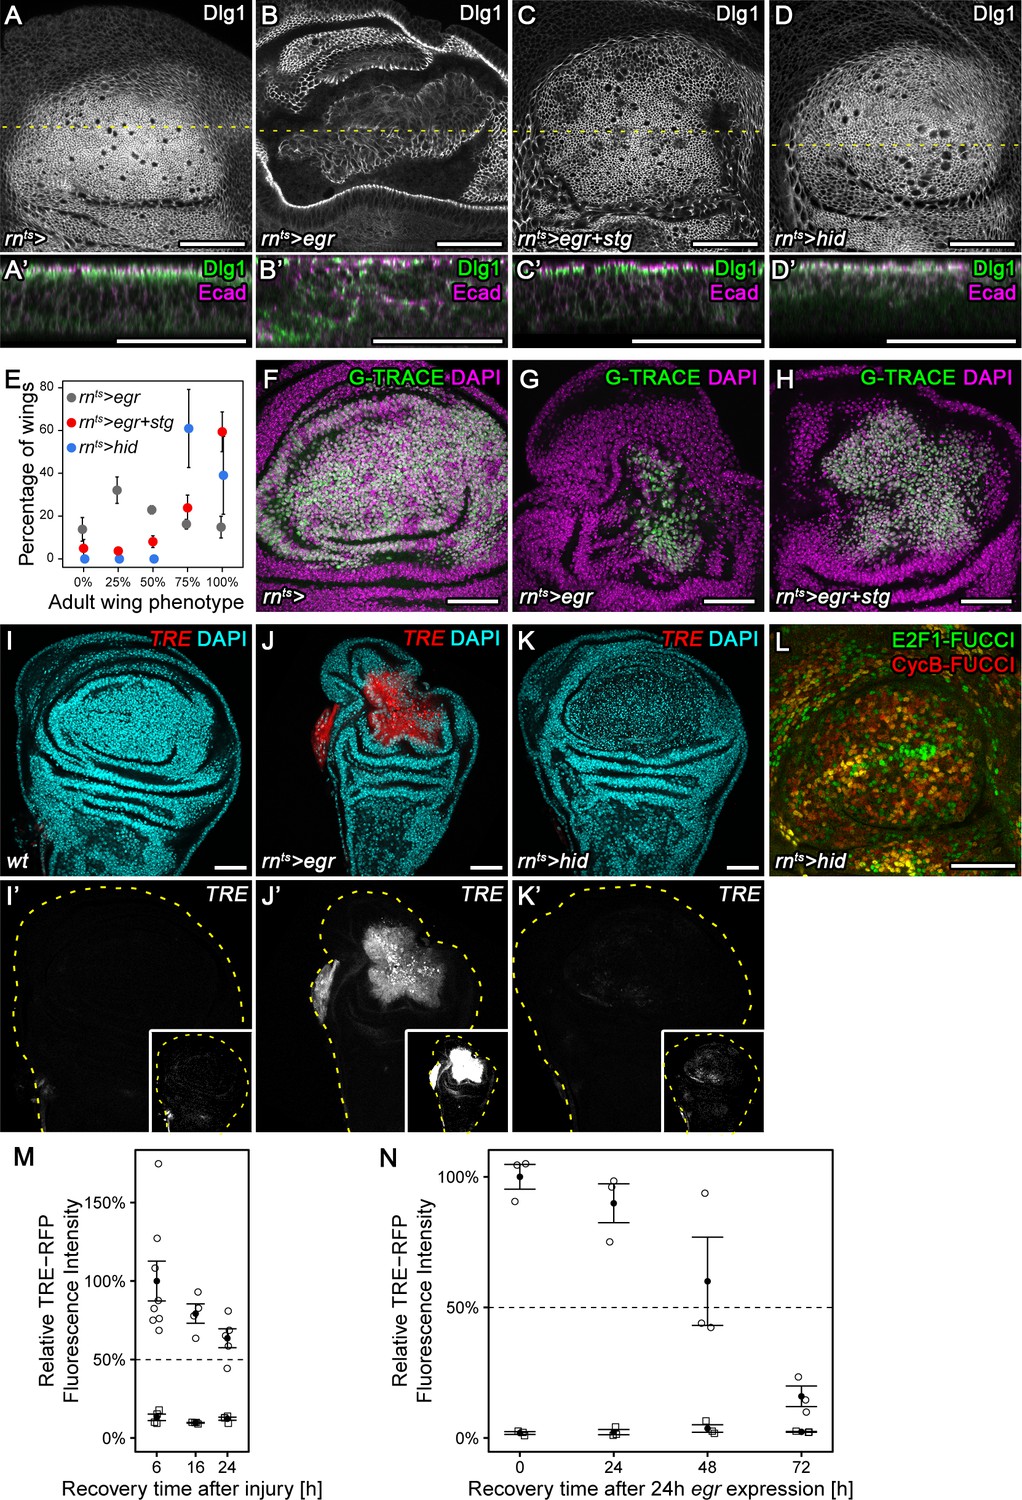
(A–D’) X-Y view of a control wing disc (A), an egr-expressing (B), egr,stg-co-expressing (C) or hid-expressing disc (D) at 0 hr into the recovery period. Cross-sections through the tissue (A’–D’) were visualized along dotted yellow lines. Discs were stained for Discs large 1 (Dlg1, A-D, green in A’-D’) and E-cadherin (Ecad, magenta in A’-D’) to visualize cell outlines and cell polarity. (E) Adult wings developing from egr-expressing, egr,stg-co-expressing or hid-expressing discs were classified according to wing size and morphology (see Materials and methods, Figure 5—figure supplement 1A-C). Graphs display mean ± SEM of ≥3 independent experiments. Note the significantly improved wing regeneration of rnts>egr+stg (p<0.0001, n = 676 wings) and rnts>hid (p<0.0001, n = 514 wings) when compared to rnts>egr (n = 718 wings) by chi-squared tests. (F–H) Control wing disc (F), an egr-expressing (G) and egr,stg-co-expressing (H) disc at 0 hr into the recovery period where the surviving rnGAL4-lineage has been labeled by G-TRACE (green) (Evans et al., 2009). Discs were counterstained with DAPI (magenta). (I–K’) Control wing disc (I), an egr-expressing (J) or hid-expressing (K) disc at 0 hr into the recovery period. Discs express the JNK-reporter TRE-RFP (I’-K’, red in I-K) and were counterstained with DAPI (cyan in I-K). TRE-reporter activity was imaged at settings optimized to subsaturation in egr-expressing discs. Small insets in (I’–K’) show the same images adjusted to the dynamic range in hid-expressing discs. Note that distinct DAPI dense particles seen in the pouch of hid-expressing discs represent remnants of apoptotic cells. (L) A hid-expressing disc at 0 hr into the recovery period expressing FUCCI reporters (compare to Figure 2B). (M,N) Quantifications of TRE-RFP fluorescence intensity at the wound site in surgically injured wing discs at 6 hr, 16 hr, and 24 hr after tissue damage (M, circles) and in egr-expressing discs at 0 hr, 24 hr, 48 hr and 72 hr into the recovery period (N, circles). Larvae with surgically injured wing discs pupariate at 24 hr so later time points could not be quantified. Note that TRE-RFP reporter activity declines faster in surgically injured discs. Fluorescence intensity in non-wound regions (squares) serves as baseline reference. Graphs display mean ± SEM for n = 8 (6 h), n = 4 (16 h), n = 5 (24 h) injured discs (M) or n = 3 (0 h), n = 3 (24 h), n = 3 (48 h), n = 3 (72 h) egr-expressing discs (N). Maximum projections of multiple confocal sections are shown in A-D, F-H. Scale bars: 50 µm.
Figure 5—figure supplement 1
Chronic stalling in G2 interferes with proliferative capacity.
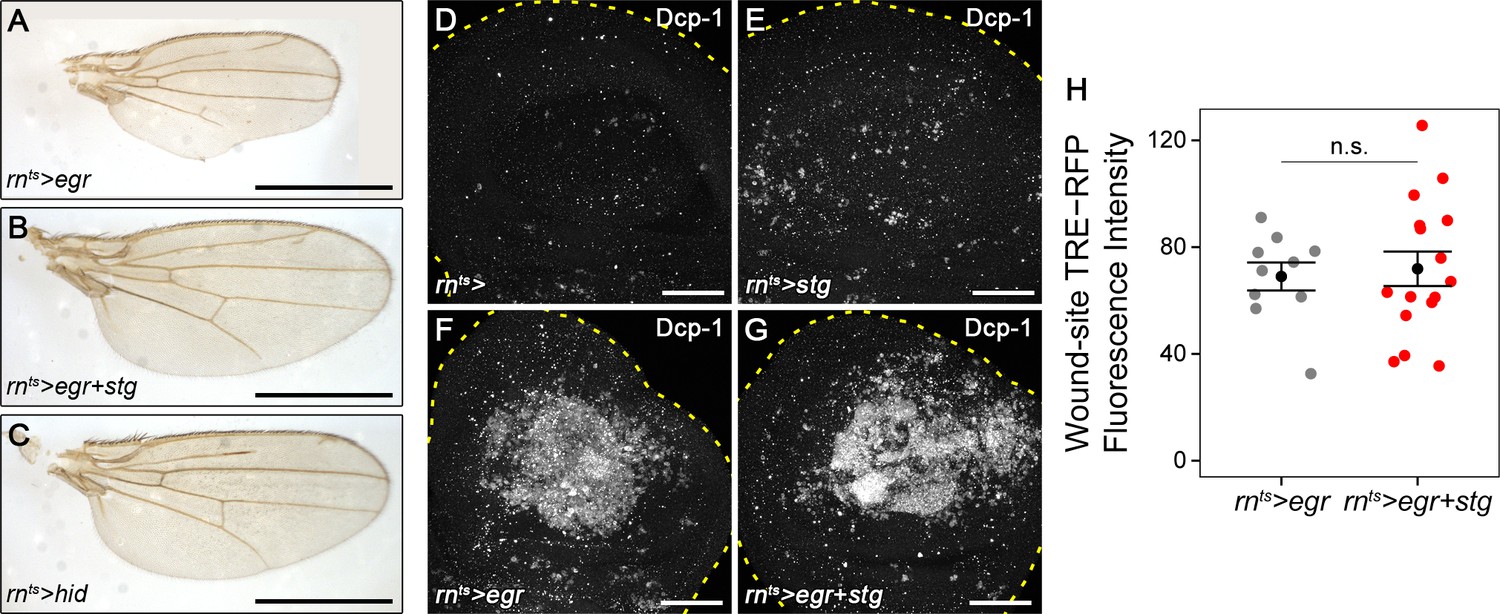
(A–C) Representative adult wings arising from of egr-expressing (A), egr,stg-co-expressing (B) and hid-expressing discs (C) under the control of rnGAL4. (D–G) A control wing disc (D), a stg-expressing (E), an egr-expressing (F) and an egr,stg-co-expressing disc (G) at 0 hr into the recovery period. Discs were stained for the apoptotic marker Dcp-1. Dotted lines trace the outline of the wing disc. (H) Quantification of TRE-RFP fluorescence intensity in the central pouch domain of egr-expressing (gray) and egr,stg-co-expressing (red) at 0 hr into the recovery period. Graphs display mean ± SEM for egr-expressing, n = 10 and egr,stg-co-expressing, n = 16 discs. U-tests were performed to test for statistical significance, n.s. = non significant. Maximum projections of multiple confocal sections are shown. Scale bars: 1.0 mm (A–C), 50 µm (D–G).
Figure 6 with 1 supplement
Transient stalling in G2 promotes survival by protecting cells from JNK-induced apoptosis.
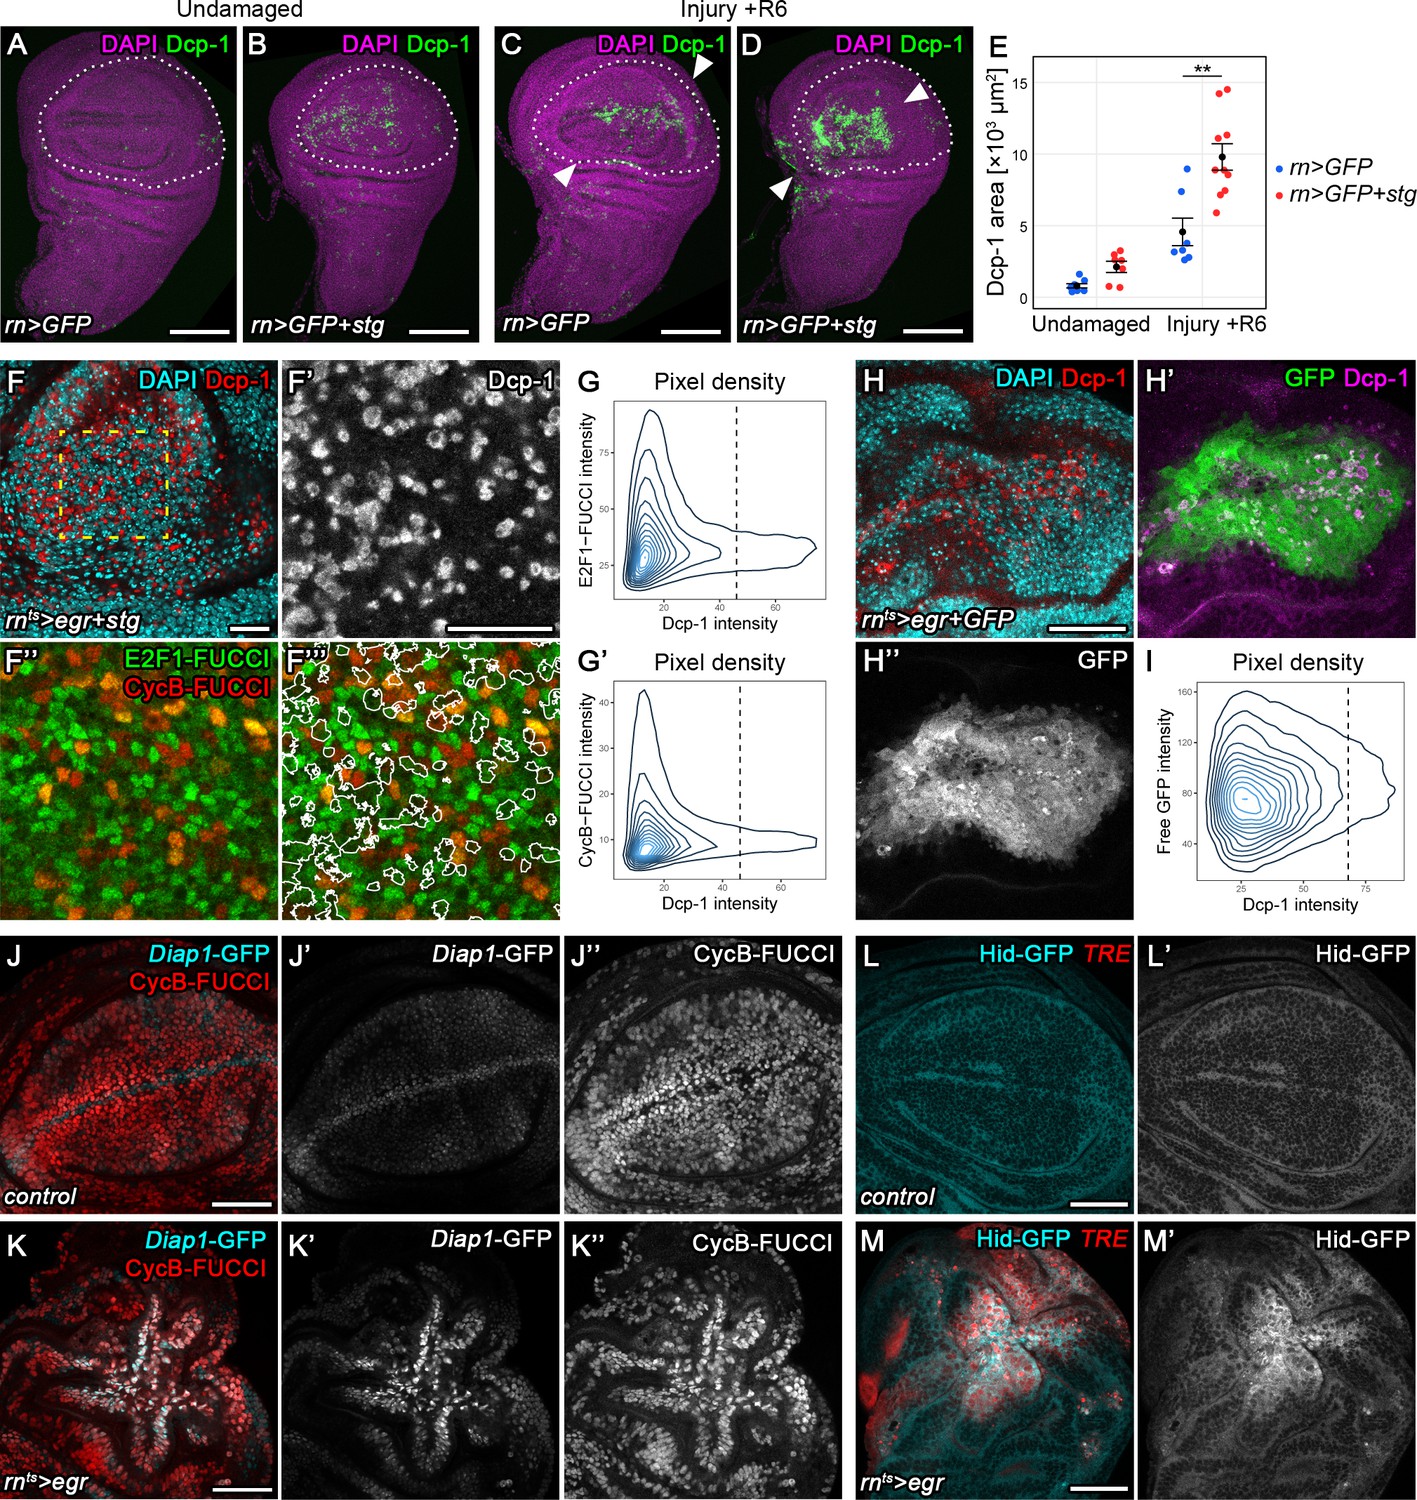
(A–E) Undamaged control (A) and an undamaged disc expressing stg under the control of rnGAL4 (B). An injured control disc (C) and an injured stg-expressing disc (D), 6 hr into the recovery period. Dotted lines indicate the rnGAL4 domain, arrows indicate injury axis. Wing discs were stained for the apoptotic marker Dcp-1 (green) and counterstained with DAPI (magenta). The area occupied by Dcp-1 in a maximum projection is quantified in (E). Graphs display mean ± SEM for undamaged rn>GFP, n = 8; undamaged rn>GFP+stg, n = 7; injured rn>GFP, n = 7; injured rn>GFP+stg, n = 10 discs. U-tests were performed to test for statistical significance, **p<0.01. (F–F’’’) An egr,stg-expressing disc analyzed for FUCCI activity (F’’,F’’’) and the apoptotic marker Dcp-1 (F’, red in F) or DAPI (cyan in F) at 0 hr into the recovery period. F’-F’’’ represent the area framed by broken line in F. White lines in F’’’ represent the Dcp-1 outline mask of F’. Note that masked cells generally express low levels of either FUCCI reporter. (G–G’) The fluorescence intensities of Dcp-1 and the GFP-E2f11-230 (G) or mRFP-NLS-CycB1-266 (G’) FUCCI reporters for each pixel are plotted as 2D density graphs (see Materials and methods). The broken line represents a visually chosen Dcp-1 threshold defining apoptotic cells. Note that the surviving population expresses the entire range of FUCCI reporter intensities (left), in contrast to apoptotic cells (right). (H–I) An egr,GFP-expressing disc stained for the apoptotic marker Dcp-1 (red in H, magenta in H’) and DAPI (cyan in H) at 0 hr into the recovery period. Graph (I) plots the 2D density of pixel fluorescence intensities for Dcp-1 and free GFP. The broken line represents a visually chosen Dcp-1 threshold defining apoptotic cells. Note that the surviving and apoptotic population use the GFP fluorescence spectrum symmetrically. (J–K’’) Control (J–J’’) and an egr-expressing (K–K’’) disc at 0 hr into the recovery period expressing the Diap1-GFP.3.5 reporter (J’,K’, cyan in J,K) and the G2-specific FUCCI reporter mRFP-NLS-CycB1-266 (J’’,K’’, red in J,K). Note the anti-correlation between Diap1 promoter activity and G2-phase in control discs, in contrast to egr-expressing discs. (L–M’) Control (L,L’) and egr-expressing (M,M’) discs at 0 hr into the recovery period expressing a Hid-GFP fusion protein under endogenous control (L’,M’, cyan in L,M). JNK-signaling cells were detected by activation of TRE-RFP (red in L,M). Maximum projections of multiple confocal sections are shown in A-D. Scale bars: 100 µm (A–D), 20 µm (F,F’’’), 50 µm (H–M).
Figure 6—figure supplement 1
Stalling in G2 promotes survival by protecting cells from JNK-induced apoptosis.
(A–A’’’) A stg-expressing disc at 0 hr into the recovery period stained for the apoptotic marker Dcp-1 (A’’, green in A,A’) and for the HA-tag to visualize overexpressed Stg-HA (A’’’, magenta in A’). Discs were stained for DAPI (blue in A). Note mutually exclusive detection of Dcp-1 and Stg-HA. (B–B’’) A FUCCI-expressing disc also expressing stg-HA under the control of rntsGAL4. The disc was stained for the HA-tag to visualize Stg-HA (B’, cyan in B’’). The apical section reveals high expression of Stg-HA in large mitotic cells also positive for mRFP-NLS-CycB1-266 (red). (C–D’’) A stg-expressing and an egr,stg-co-expressing disc also carrying the GFP-E2f11-230 (C’, D’, green in C,D) and the mRFP-NLS-CycB1-266 (C’’,D’’, red in C,D) FUCCI reporters. Despite extensive cell death in the tissue upon egr co-expression, the distribution of stg-induced cell cycle profile does not extensively change, supporting the conclusion that low FUCCI reporter expression is not consequence of apoptotic cell death. (E–E’’) A single confocal section through basal domains of an egr-expressing disc (closed arrowhead) to visualize apoptotic cell debris (open arrowhead). The disc has been allowed to incorporate EdU for 1 hr to visualize a more historic footprint of DNA replication activity (E’’, green in E,E’). The disc was stained for DAPI (magenta in E,E’). The broken line in E frames the region shown in E’,E’’. While the viable tissue has undergone EdU incorporation (closed arrowhead), none of the pyknotic nuclei show evidence of recent DNA replication activity (open arrowhead). Scale bars: 50 µm (A–A’’’, C–E’’), 20 µm (B).
Figure 7 with 2 supplements
Chronic stalling in G2 promotes non-autonomous overgrowth.
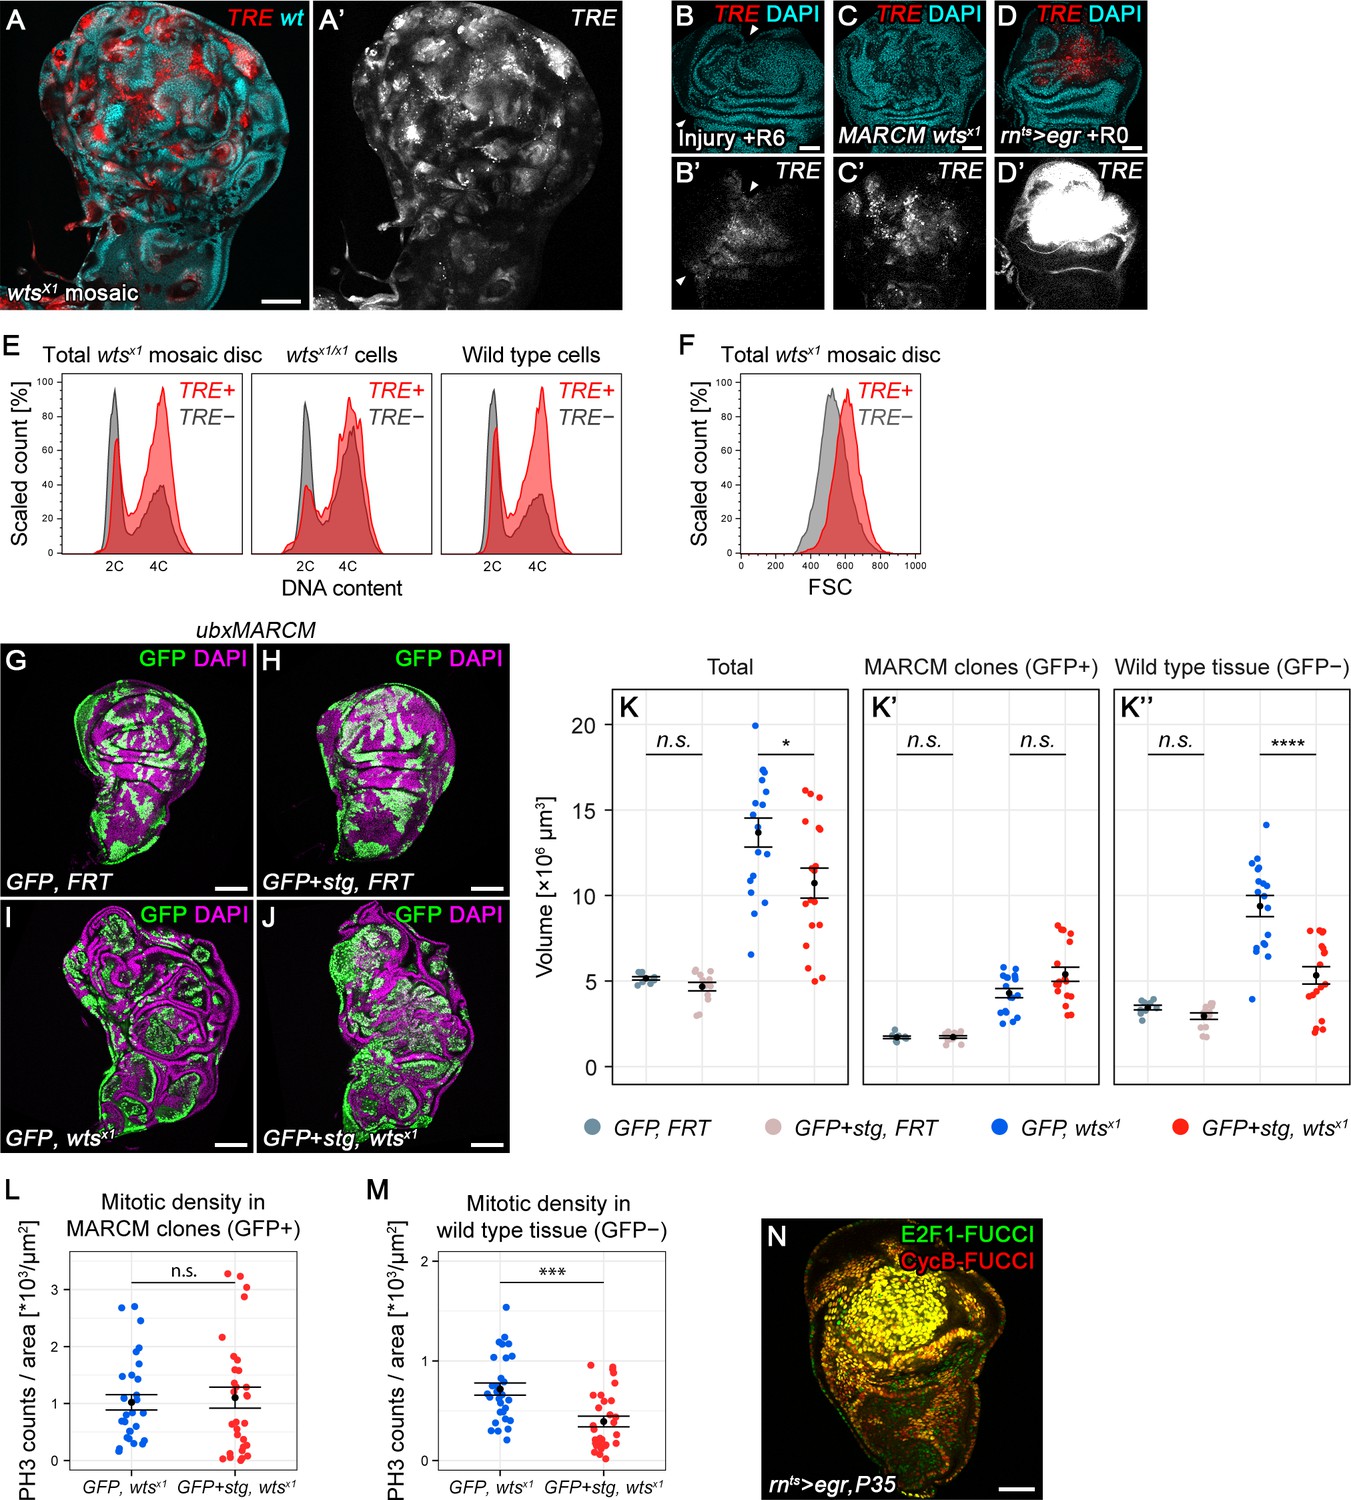
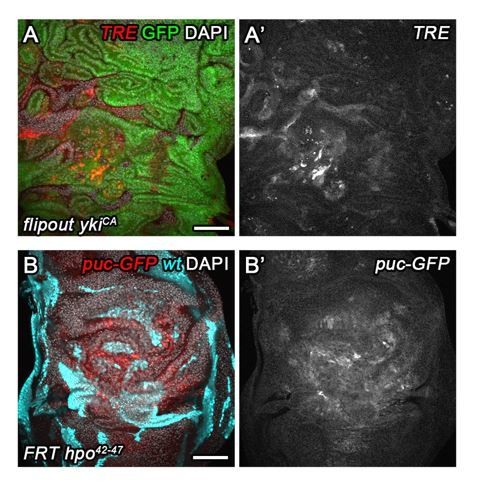
(A,A’) A wing disc expressing TRE-RFP and carrying mosaic wtsx1/x1 clones marked by the absence of GFP (cyan in A). (B–D’) A surgically damaged wing disc 6 hr into the recovery period (B,B’), a wing disc carrying wtsx1/x1 MARCM clones (C,C’) and an egr-expressing disc at 0 hr into the recovery period (D,D’). Discs express the JNK-reporter TRE-RFP (B’-D’, red in B-D) and were counterstained with DAPI (cyan in B-D). TRE-reporter activity was imaged at settings optimized to subsaturation in egr-expressing discs. Panels (B’–D’) show the TRE-RFP fluorescence adjusted to the dynamic range of surgically injured discs. (E–F) Mosaic wtsx1/x1 wing discs were analyzed for DNA content (E) and cell size (F) by flow cytometry. The total cell population of discs was plotted as TRE-positive or TRE-negative events (E,F). The same analysis was also applied separately to wtsx1/x1 cells and wild type cells sub-populations (E only). Of note, previous cell cycle studies of Hippo-pathway mutant have not reported any alterations (Harvey et al., 2003; Huang et al., 2005; Tapon et al., 2002). Therefore, the mild cell cycle shift in TRE-negative wtsx1/x1 cells appears to be specific to the wtsx1 allele. (G–J) Wing imaginal discs carrying GFP-labeled MARCM clones (green) that are either wild type (G), stg-overexpressing (H), mutant for wtsx1 (I) or stg-overexpressing and mutant for wtsx1 (J). Discs were counterstained with DAPI (magenta). (K–K’’) Volumes occupied by the total disc (K), the GFP-labeled fraction representing MARCM clones (K’) and the non-GFP-labeled fraction representing the surrounding wild type tissue (K’’). Graphs display mean ± SEM for tub>GFP, FRT, n = 9; tub>GFP+stg, FRT, n = 13; tub>GFP, FRT wtsx1, n = 18; tub>GFP+stg, FRT wtsx1, n = 18 discs. U-tests were performed to test for statistical significance (n.s. not significant, *p<0.05, ****p<0.0001). (L,M) Quantification of phospho-Histone3 events identifying mitotic cells, normalized to the relevant tissue area. Mitotic cells were counted in GFP-positive MARCM clones that are either mutant for wtsx1 (blue) or mutant for wtsx1 and overexpressing stg (red) (L), and in the non-GFP-labeled fraction representing the wild type tissue surrounding clones mutant for wtsx1 (blue) or mutant for wtsx1 and overexpressing stg (red) (M). Graphs display mean ± SEM, n = 30 confocal sections from six discs per sample. U-tests were performed to test for statistical significance (n.s. not significant, ***p<0.001). (N) An egr,p35-co-expressing disc at 0 hr into the recovery period expressing both FUCCI reporters. Scale bars: 50 µm (B–D,N), 100 µm (A, G–J).
Figure 7—figure supplement 1
Chronic stalling in G2 promotes non-autonomous overgrowth.
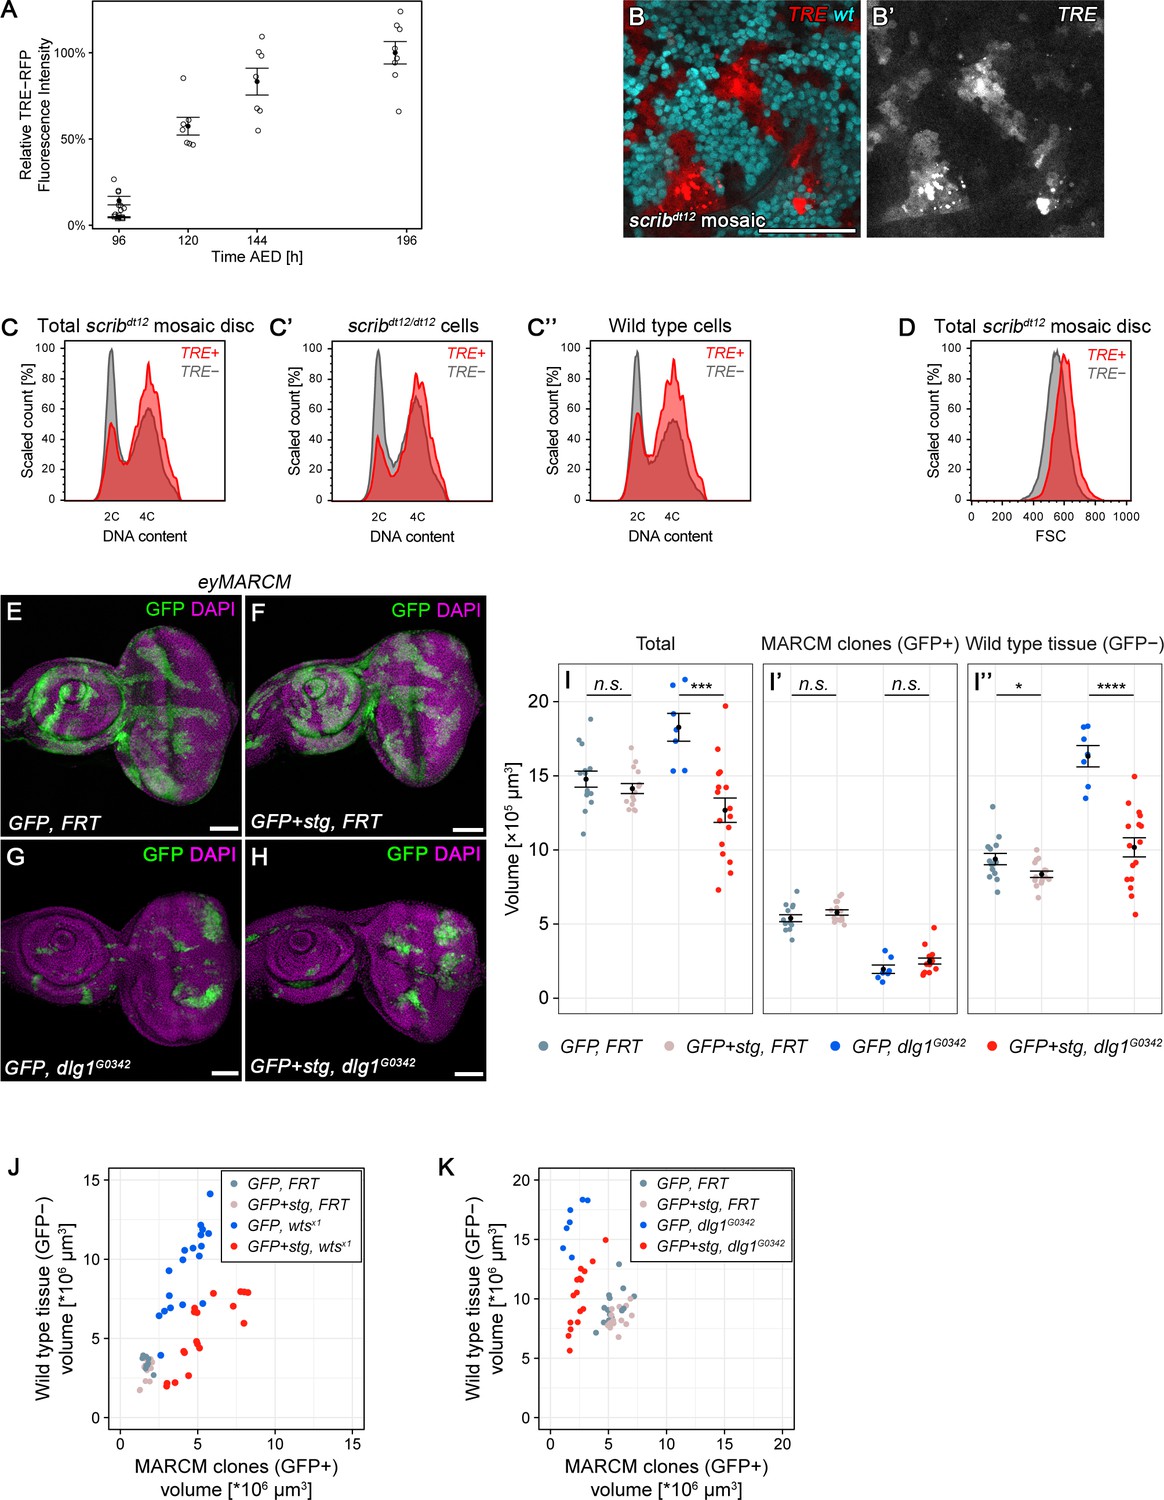
(A) Quantification of relative TRE-RFP fluorescence intensity in mosaic wing discs carrying wtsX1 clones at 96 hr to 196 hr after egg deposition (AED) at 25°C (circles). Note that wild type larvae normally pupariate around 120 hr AED. Squares represent discs carrying wild type MARCM clones. Graphs display mean ± SEM for n = 8 (96 h), n = 7 (120 h), n = 7 (144 h), n = 8 (192 h), n = 6 (control) discs. (B–D’’) Wing discs expressing TRE-RFP (red) and carrying scribdt12/dt12 clones marked by the absence of GFP (cyan in B), were analyzed for DNA content (C–C’’) cell size (D) and by flow cytometry. The total cell population of discs was plotted as TRE-positive or TRE-negative events (C,D). The same analysis was also applied separately to GFP-negative (scribdt12/dt12 cells, C’) and GFP-positive (wild type cells, C’’) sub-populations. Detected events were plotted as counts scaled to mode against fluorescence intensity of the live DNA stain Hoechst. (E–H) Wing imaginal discs carrying GFP-labeled MARCM clones (green) that are either wild type (E), stg-overexpressing (F), mutant for dlg1G0342 (G) or stg-overexpressing and mutant for dlg1G0342 (H). Discs were counterstained with DAPI (magenta). (I–I’’) Volumes occupied by the total disc (I), the GFP-labeled fraction representing MARCM clones (I’) and the non-GFP-labeled fraction representing the surrounding wild type tissue (I’’). Graphs display mean ± SEM for tub>GFP, FRT, n = 14; tub>GFP+stg, FRT, n = 15; tub>GFP, FRT dlg1G0342, n = 7; tub>GFP+stg, FRT dlg1G0342, n = 16 discs. U-tests were performed to test for statistical significance (n.s. not significant, *p<0.05, ***p<0.001, ****p<0.0001). (J,K) Dot plots representing each of the discs analyzed in Figure 7K (J) and Figure 7—figure supplement 1I (K), pairing the data for the GFP-negative wild type tissue volume and the GFP-positive tissue volume they surround, which is either wild type (grey), stg-overexpressing (pink), mutant for dlg1G0342 or wtsX1 (blue in J or K) or stg-overexpressing and mutant for dlg1G0342 or wtsX1 (red in J or K).
Figure 7—figure supplement 2
Chronic stalling in G2 promotes mitogenic signaling.
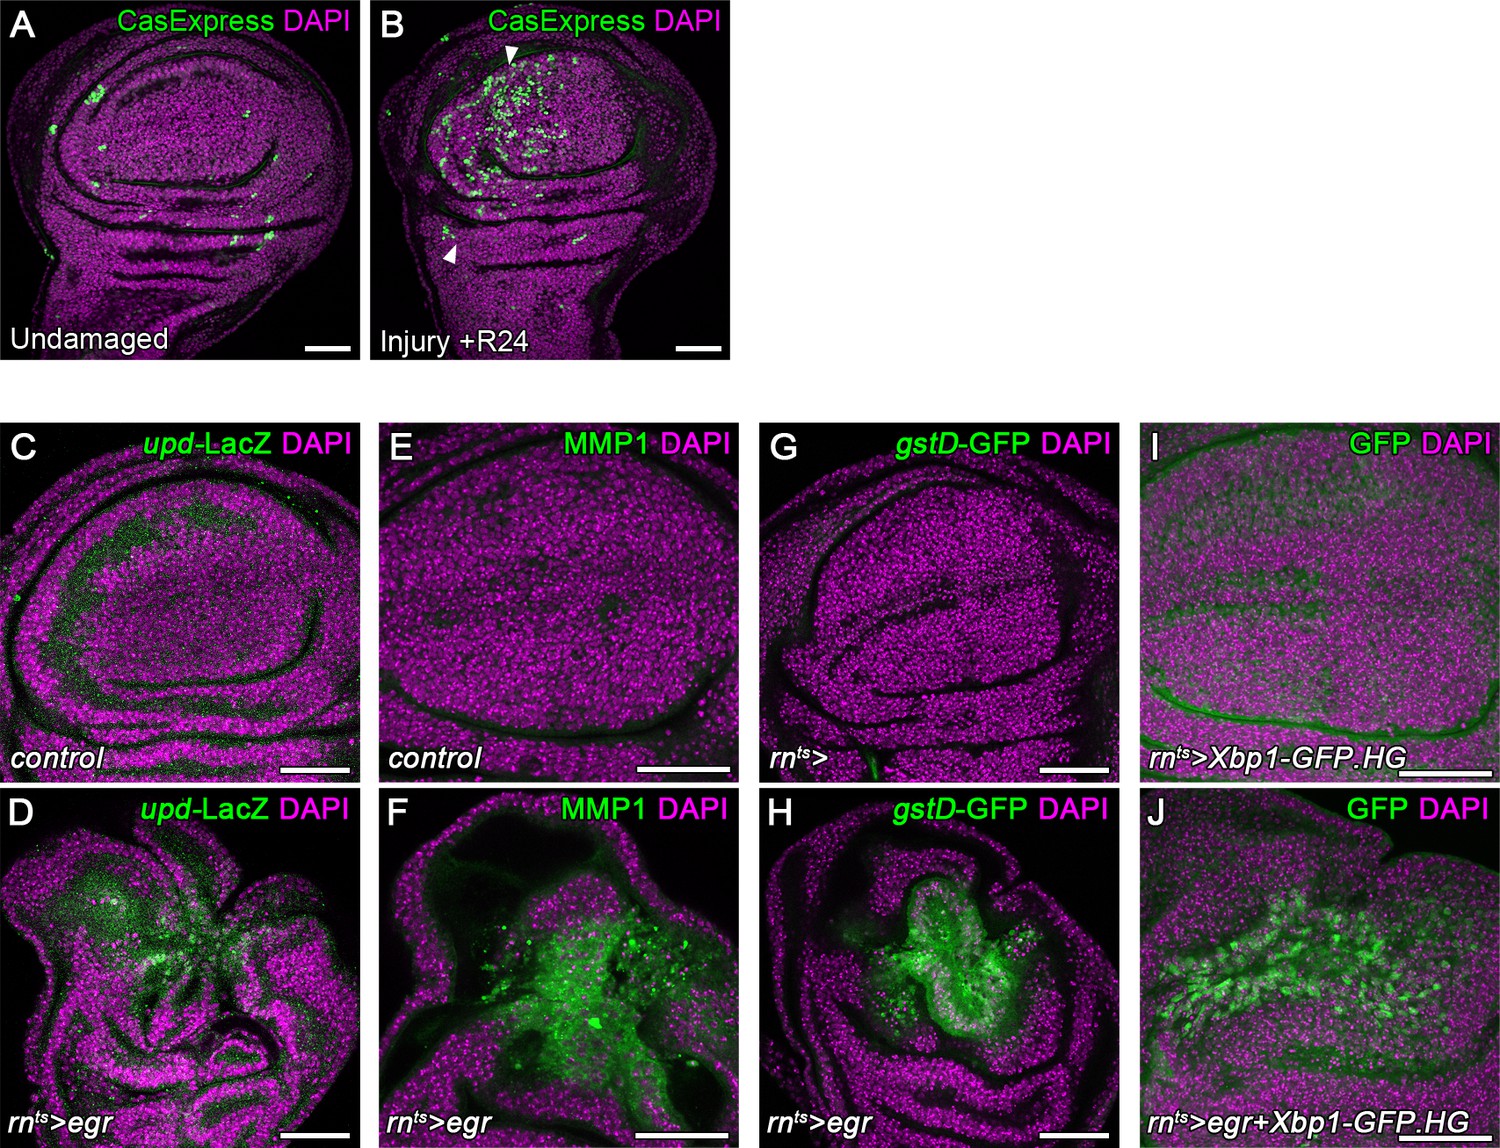
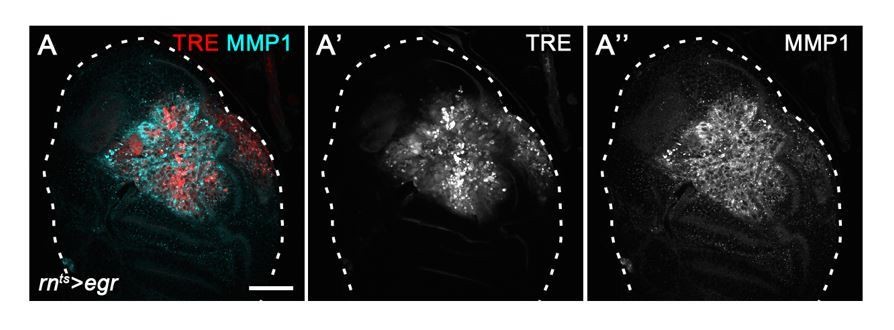
(A,B) A control wing disc (A) and a surgically injured disc 24 hr after injury (B). Both discs use the CasExpress and G-TRACE reporter system to drive expression of GFP in cells that had experienced Caspase activity previously but survive. (C–J) Control wing discs (C,E,G,I) and egr-expressing discs (D,F,H,J) at 0 hr into the recovery period also analyzed for expression of upd-LacZ (C,D), MMP-1 (E,F), GstD-GFP (G,H) and spliced Xbp1 (I,J) (green in C-J). Discs were counterstained with DAPI (magenta). Maximum projections of multiple confocal sections are shown in I,J. Scale bars: 50 µm.
Figure 8
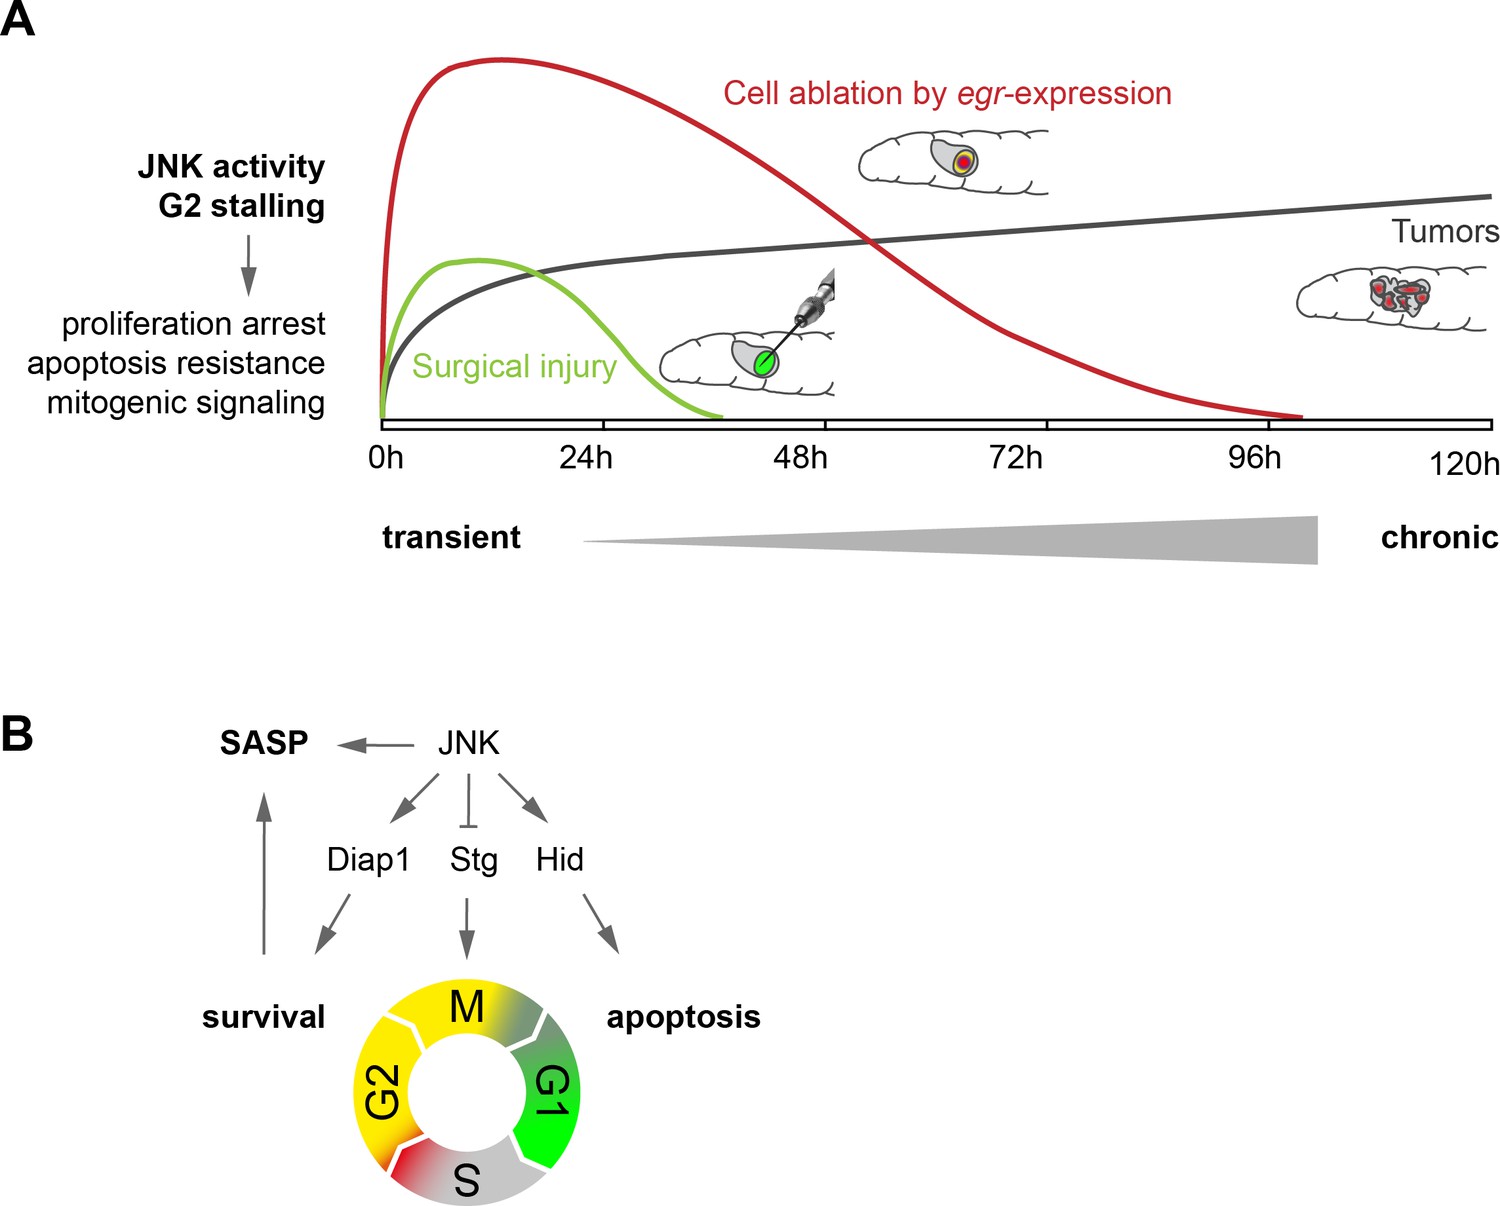
Model.
(A) Transient (surgical injury), prolonged (egr-expression) and chronic (mosaic tumors) disruption of tissue homeostasis induces transient, prolonged and chronic JNK activity, thereby driving G2-stalling and senescence-like properties in a dose- and time-dependent manner. (B) JNK regulates SASP, Diap1, Stg and Hid. The transition between G2 and G1 acts as switch that prevents survival and SASP. The decision to arrest in G2 is JNK-dependent, which can integrate information about damage and has cell-protective functions. The decision to die in G1 may depend on additional information about the extent of cell and tissue damage.
Author response image 1
Author response image 2
Author response image 3
Author response image 4
Author response image 5
Author response image 6
Tables
Key resources table
| Reagent type (species) or resource | Designation | Source or reference | Identifiers | Additional information |
|---|---|---|---|---|
| Genetic reagent (Drosophila melanogaster) | Diap-1-GFP.3.5 | PMID: 18258485 | ||
| Genetic reagent (D. melanogaster) | enGAL4, UAS-GFP | D.Bilder, UC Berekely | ||
| Genetic reagent (D. melanogaster) | ‘eyMARCM19A’; ‘ey-FLP, FRT19A tub-GAL80; act5c>y[+]>GAL4, UAS-GFP[S56T]’ | PMID: 29494583 | ||
| Genetic reagent (D. melanogaster) | ‘ubxMARCM82B’; ‘Ubx-FLP, tubP-GAL4, UAS-GFP; FRT82B tubP-GAL80’ | Bloomington Drosophila Stock Center | BDSC: 42734 | |
| Genetic reagent (D. melanogaster) | FRT19A dlg[G0342] | Kyoto Stock Center | DGGR: 111872 | |
| Genetic reagent (D. melanogaster) | FRT82B wts[x1] | Bloomington Drosophila Stock Center | BDSC: 44251 | |
| Genetic reagent (D. melanogaster) | ‘G-TRACE’; ‘UAS-FLP.Exel, Ubi-p63E(FRT.STOP)Stinger’ | Bloomington Drosophila Stock Center | BDSC: 28282 | |
| Genetic reagent (D. melanogaster) | gstD-GFP | PMID: 18194654 | ||
| Genetic reagent (D. melanogaster) | hep[R75] | Bloomington Drosophila Stock Center | BDSC: 6761 | |
| Genetic reagent (D. melanogaster) | ‘hid-GFP’; ‘hid[MI06452-GFSTF.1]’ | Bloomington Drosophila Stock Center | BDSC: 65331 | |
| Genetic reagent (D. melanogaster) | mei-41[RT1] | Bloomington Drosophila Stock Center | BDSC: 4169 | |
| Genetic reagent (D. melanogaster) | ‘puc-LacZ’; ‘puc[A251.1F3]’ | Bloomington Drosophila Stock Center | BDSC: 11173 | |
| Genetic reagent (D. melanogaster) | ‘rnGAL4’; ‘rn[GAL4-DeltaS]’ | Bloomington Drosophila Stock Center | BDSC: 8142 | |
| Genetic reagent (D. melanogaster) | ‘rn(ts)>‘; ‘rn[GAL4-DeltaS], tubGAL80[ts]’ | Bloomington Drosophila Stock Center | BDSC: 8142; BDSC: 7018 | recombinant |
| Genetic reagent (D. melanogaster) | ‘rn(ts)>egr’; ‘rn[GAL4-5], UAS-egr, tubP-GAL80[ts]’ | Bloomington Drosophila Stock Center | ||
| Genetic reagent (D. melanogaster) | ‘stg-GFP’; ‘stg[YD0685]’ | Bloomington Drosophila Stock Center | BDSC: 50879 | |
| Genetic reagent (D. melanogaster) | ‘Trbl-GFP’; ‘trbl[MI01025-GFSTF.2]’ | Bloomington Drosophila Stock Center | BDSC: 61654 | |
| Genetic reagent (D. melanogaster) | TRE-RFP | PMID: 22509270 | ||
| Genetic reagent (D. melanogaster) | UAS-bsk[DN] | Bloomington Drosophila Stock Center | BDSC: 6409 | |
| Genetic reagent (D. melanogaster) | UAS-Cdk1 RNAi [TRiP.HMS01531] | Bloomington Drosophila Stock Center | BDSC: 36117 | |
| Genetic reagent (D. melanogaster) | UAS-GFP S56T | BDSC: 1521 | ||
| Genetic reagent (D. melanogaster) | UAS-grp RNAi [TRiP.HMC05162] | Bloomington Drosophila Stock Center | BDSC: 62155 | |
| Genetic reagent (D. melanogaster) | UAS-hep[act] | Bloomington Drosophila Stock Center | BDSC: 9306 | |
| Genetic reagent (D. melanogaster) | UAS-hid | G. Morata, CBSMO Spain | ||
| Genetic reagent (D. melanogaster) | UAS-mei-41 RNAi [TRiP.GL00284] | Bloomington Drosophila Stock Center | BDSC: 35371 | |
| Genetic reagent (D. melanogaster) | UAS-stg | Bloomington Drosophila Stock Center | BDSC: 4777 | |
| Genetic reagent (D. melanogaster) | UAS-stg.HA | Bloomington Drosophila Stock Center | BDSC: 56562 | |
| Genetic reagent (D. melanogaster) | UAS-Xbp1-GFP.HG | Bloomington Drosophila Stock Center | BDSC: 60731 | |
| Genetic reagent (D. melanogaster) | ‘E2F1-FUCCI, CycB-FUCCI’; ‘Ubi-GFP.E2f1.1–230, Ubi-mRFP1.NLS.CycB.1–266’ | Bloomington Drosophila Stock Center | BDSC: 55123 | |
| Genetic reagent (D. melanogaster) | ‘CycB-FUCCI’; ‘Ubi-mRFP1.NLS.CycB.1–266’ | PMID: 24726363 | ||
| Genetic reagent (D. melanogaster) | ‘ubx-flp;; FRT82B ubi-GFP’ | I. Hariharan, UC Berkeley | ||
| Genetic reagent (D. melanogaster) | upd-lacZ (PD) | PMID: 8582614 | ||
| Genetic reagent (D. melanogaster) | UAS-trbl RNAi [TRiP.HMJ02089] | Bloomington Drosophila Stock Center | BDSC: 42523 | |
| Genetic reagent (D. melanogaster) | UAS-P35 | Bloomington Drosophila Stock Center | BDSC: 5072 | |
| Genetic reagent (D. melanogaster) | GH146-QF, QUAS-mtdTomato-3xHA | Bloomington Drosophila Stock Center | BDSC: 30037 | |
| Genetic reagent (D. melanogaster) | Ubi-CasExpress | Bloomington Drosophila Stock Center | BDSC: 65419 | |
| Antibody | Rabbit anti-cleaved Dcp-1 | Cell Signaling | Cat. #: 9578 | (1:200) |
| Antibody | Mouse monoclonal anti-CycB | Developmental Studies Hybridoma Bank | Cat. #: F2F4 | (1:20) |
| Antibody | Rat monoclonal anti-DE-cadherin | Developmental Studies Hybridoma Bank | Cat. #: DCAD2 | (1:100) |
| Antibody | Mouse monoclonal anti-discs large | Developmental Studies Hybridoma Bank | Cat. #: 4F3 | (1:100) |
| Antibody | Mouse anti-β-Galactosidase | Promega | Cat. #: Z3782 | (1:1000) |
| Antibody | Chicken anti-GFP | Abcam | Cat. #: ab13970 | (1:1000) |
| Antibody | Rabbit monoclonal anti-GFP | Invitrogen | Cat. #: G10362 | (1:200) |
| Antibody | Rabbit anti-H2Av-pS137 | Rockland | Cat. #: 600-401-914 | (1:500) |
| Antibody | Mouse anti-H3-pS10 | Abcam | Cat. #: ab14955 | (1:2000) |
| Antibody | Rat monoclonal anti-HA | Monoclonal Antibody Core Facillity at the Helmholtz Zentrum München | Clone #: 3F10 | (1:20) |
| Antibody | Mouse monoclonal anti-MMP1 | Developmental Studies Hybridoma Bank | Cat. #: 3A6B4 | (1:30) |
| Antibody | Mouse monoclonal anti-MMP1 | Developmental Studies Hybridoma Bank | Cat. #: 3B8D12 | (1:30) |
| Antibody | Mouse monoclonal anti-MMP1 | Developmental Studies Hybridoma Bank | Cat. #: 5H7B11 | (1:30) |
| Antibody | Mouse monoclonal anti-RFP | Abcam | Cat. #: ab65856 | (1:100) |
| Antibody | Rat monoclonal anti-RFP | Monoclonal Antibody Core Facillity at the Helmholtz Zentrum München | Clone #: 5F8 | (1:20) |
| Antibody | Mouse monoclonal anti-Ultrabithorax | Developmental Studies Hybridoma Bank | Cat. #: Ubx FP3.38 | (1:10) |
| Commercial assay or kit | Click-iT Plus EdU Alexa Fluor 647 Imaging Kit | Invitrogen | Cat. #: C10640 |
Additional files
-
Supplementary file 1
Genotypes and experimental conditions.
This table lists detailed genotypes and temperature conditions used to generate the data for each of the main and supplementary figures in this study.
- https://doi.org/10.7554/eLife.41036.019
-
Transparent reporting form
- https://doi.org/10.7554/eLife.41036.020
Download links
A two-part list of links to download the article, or parts of the article, in various formats.
Downloads (link to download the article as PDF)
Open citations (links to open the citations from this article in various online reference manager services)
Cite this article (links to download the citations from this article in formats compatible with various reference manager tools)
JNK-dependent cell cycle stalling in G2 promotes survival and senescence-like phenotypes in tissue stress
eLife 8:e41036.
https://doi.org/10.7554/eLife.41036


