Molecular mechanisms of gating in the calcium-activated chloride channel bestrophin
- Memorial Sloan Kettering Cancer Center, United States
Figures
Figure 1 with 5 supplements

Open and closed conformations.
(a–b) Cryo-EM maps of the Ca2+-bound closed (green; non-conductive) and Ca2+-bound open (pink) conformations of BEST1345, depicted from the side (left panels) and as slices of the neck region viewed from the extracellular side (right panels). (c–d) Cutaway views of the Ca2+-bound closed and Ca2+-bound open conformations of BEST1345. The pore (grey surface) is depicted as minimal radial distance from its center to the nearest van der Waals protein contact. Two subunits are drawn as ribbons; three are omitted for clarity. Amino acids in the neck and aperture regions are drawn as gray sticks; Ca2+ ions are cyan spheres. Approximate boundaries of the lipid membrane are indicated by horizontal bars. (e) Pore dimensions in the open and closed conformations. Dashed lines indicate the diameters of a dehydrated (black) and hydrated (cyan) Cl- ion. (f) Superposition of individual subunits from the closed and open conformations with α-helices depicted as cylinders. The boxed area shows a close-up of the neck region, with α-helices depicted as cartoons and side chains as sticks.
Figure 1—figure supplement 1
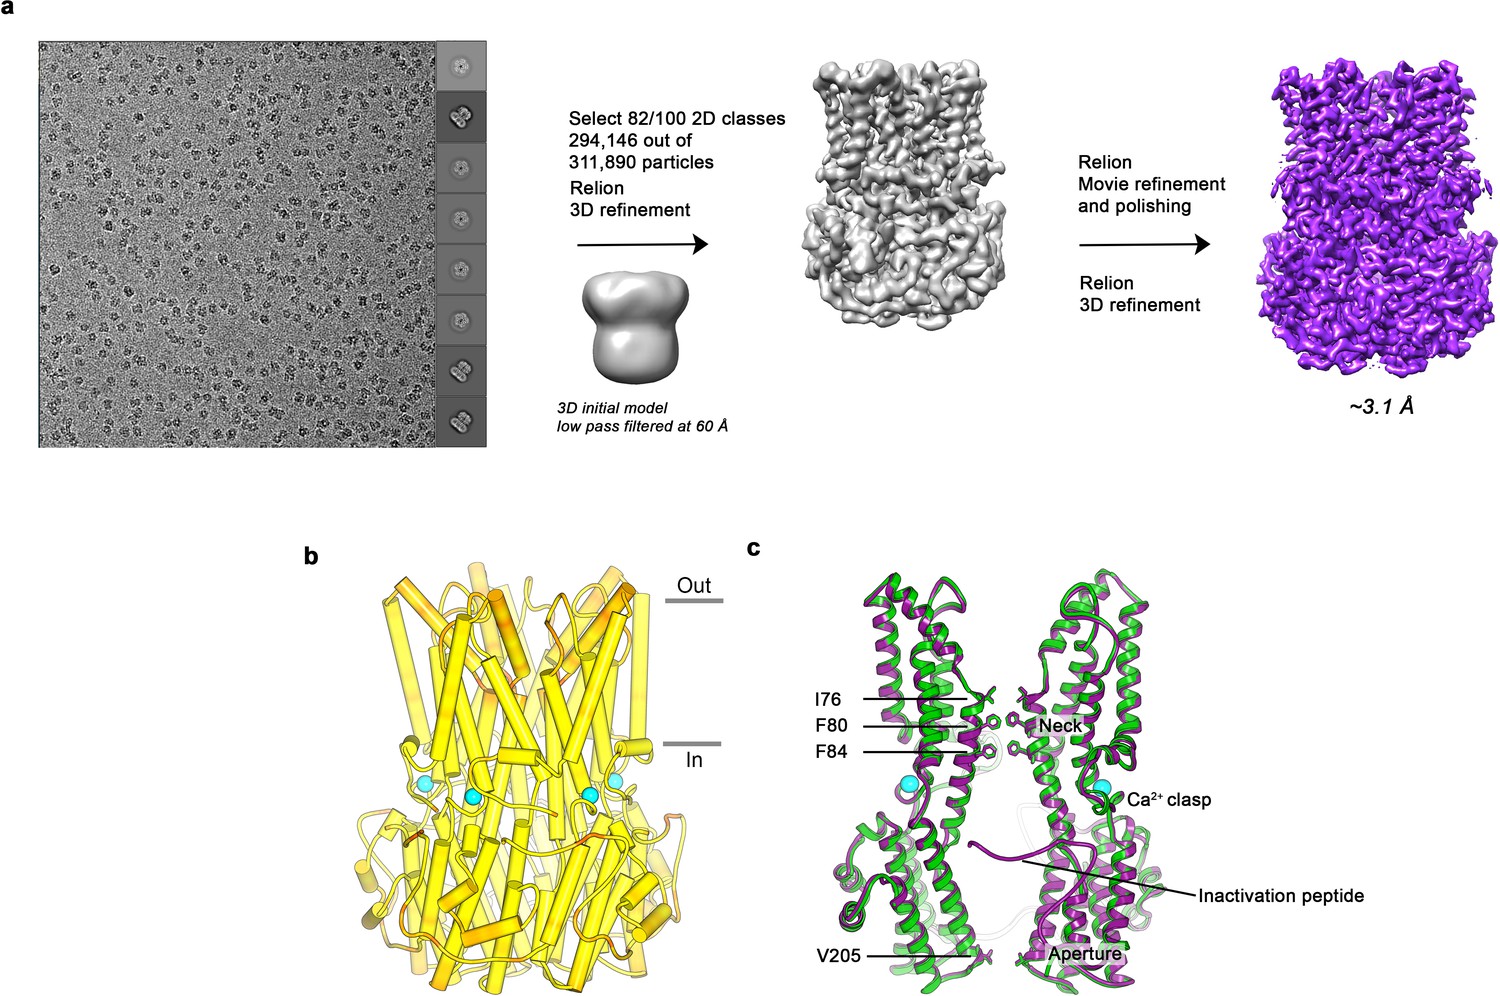
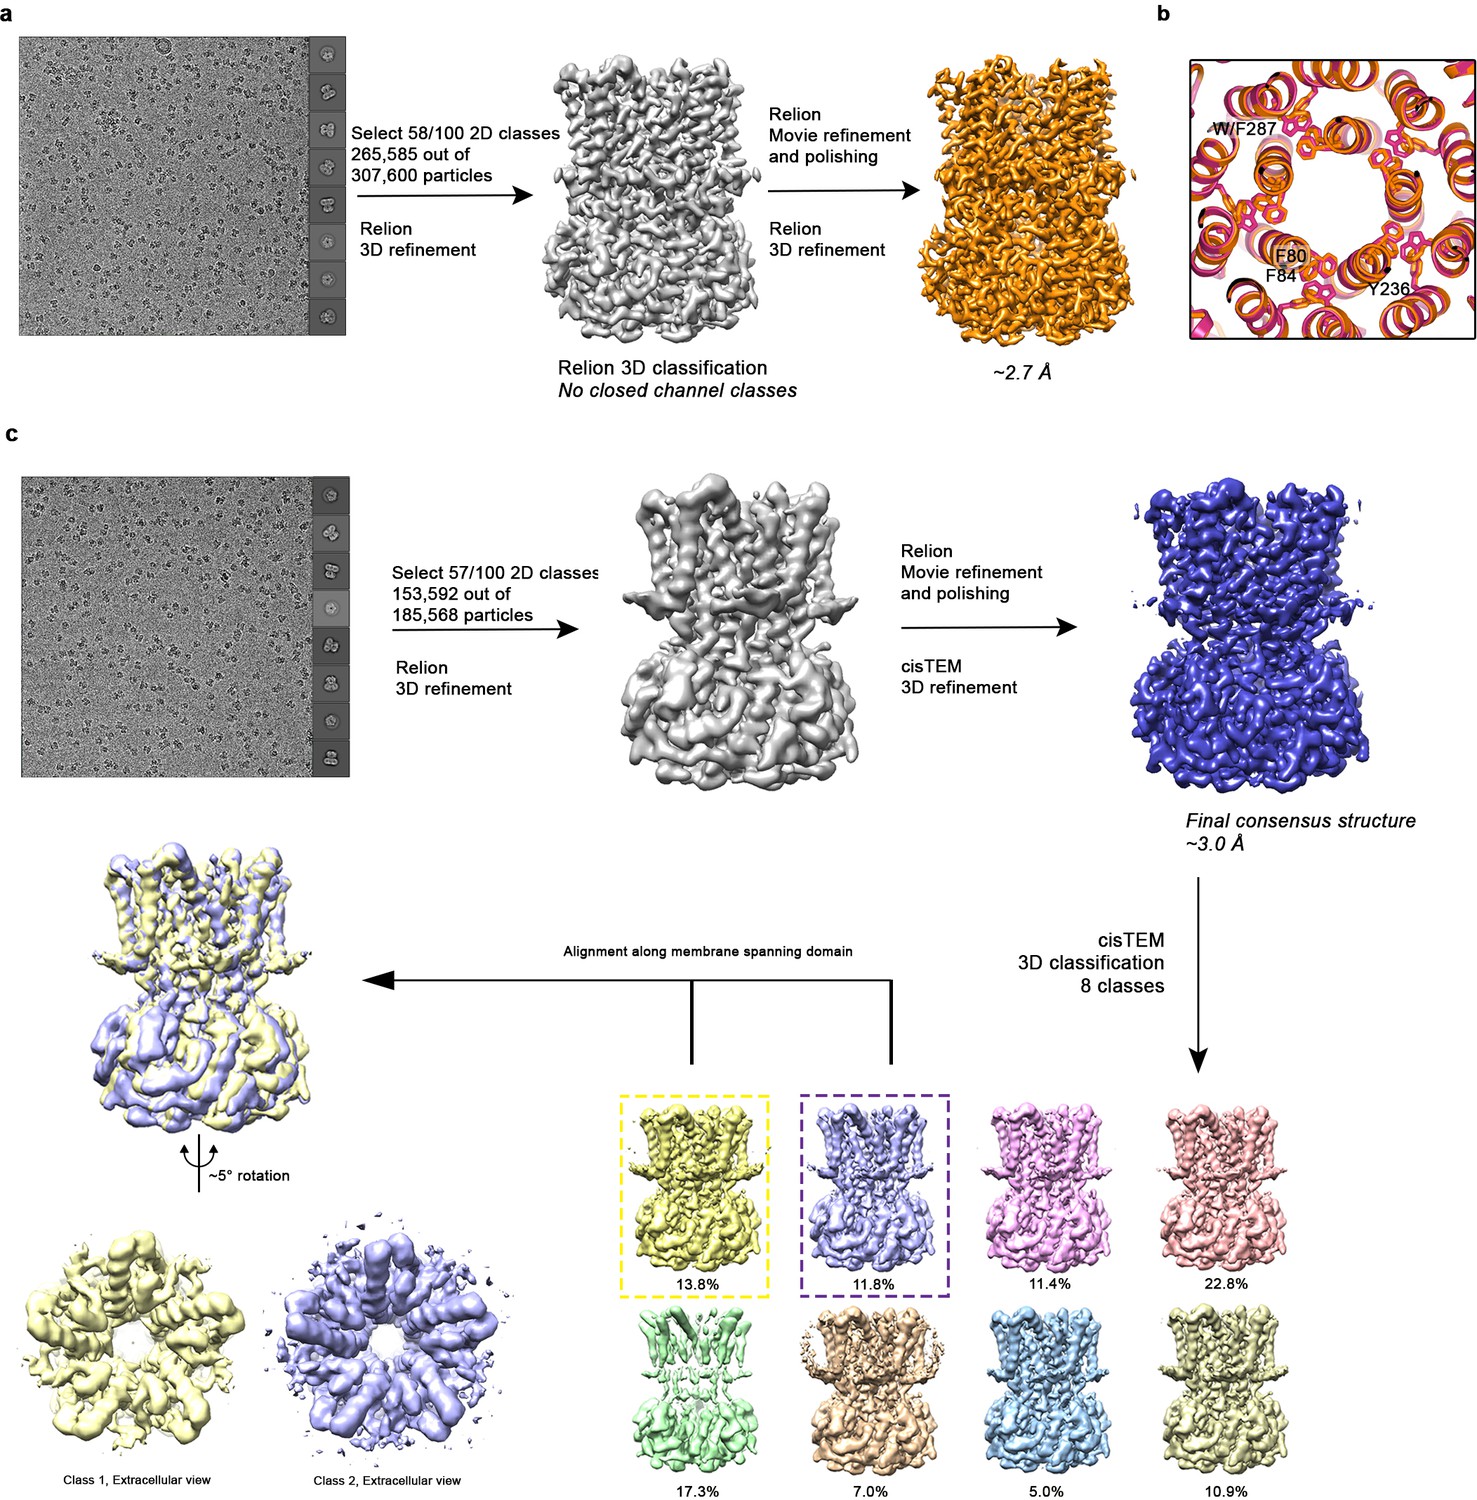
Cryo-EM workflow for the BEST1405 Ca2+-bound dataset and comparison of EM and X-ray structures.
(a) Cryo-EM workflow for the Ca2+-bound BEST1405 dataset (inactivated conformation). A detailed description can be found in the Methods. (b) The X-ray and EM structures of BEST1405 are essentially indistinguishable. The structure of BEST1405 is drawn with α-helices depicted as cylinders and is colored on a yellow-to-red spectrum according to the displacement of Cα atoms between the BEST1405 cryo-EM structure and the X-ray structure (PDB ID: 4RDQ). Yellow represents displacements less than 0.5 Å and red represents displacements greater than 2 Å. Ca2+ ions are depicted as cyan spheres and the approximate boundaries of a lipid membrane are indicated. (c) A superposition shows that the Ca2+-bound closed conformation of BEST1345 (green) has the same overall conformation as BEST1405 (purple). Two subunits in ribbon representation are shown from the side. Ca2+ ions are drawn as cyan spheres, and the labeled residues are shown as sticks.
Figure 1—figure supplement 2
Structure determination of: Ca2+-bound BEST1405 (inactivated), Ca2+-bound open BEST1345, and Ca2+-bound closed BEST1345.
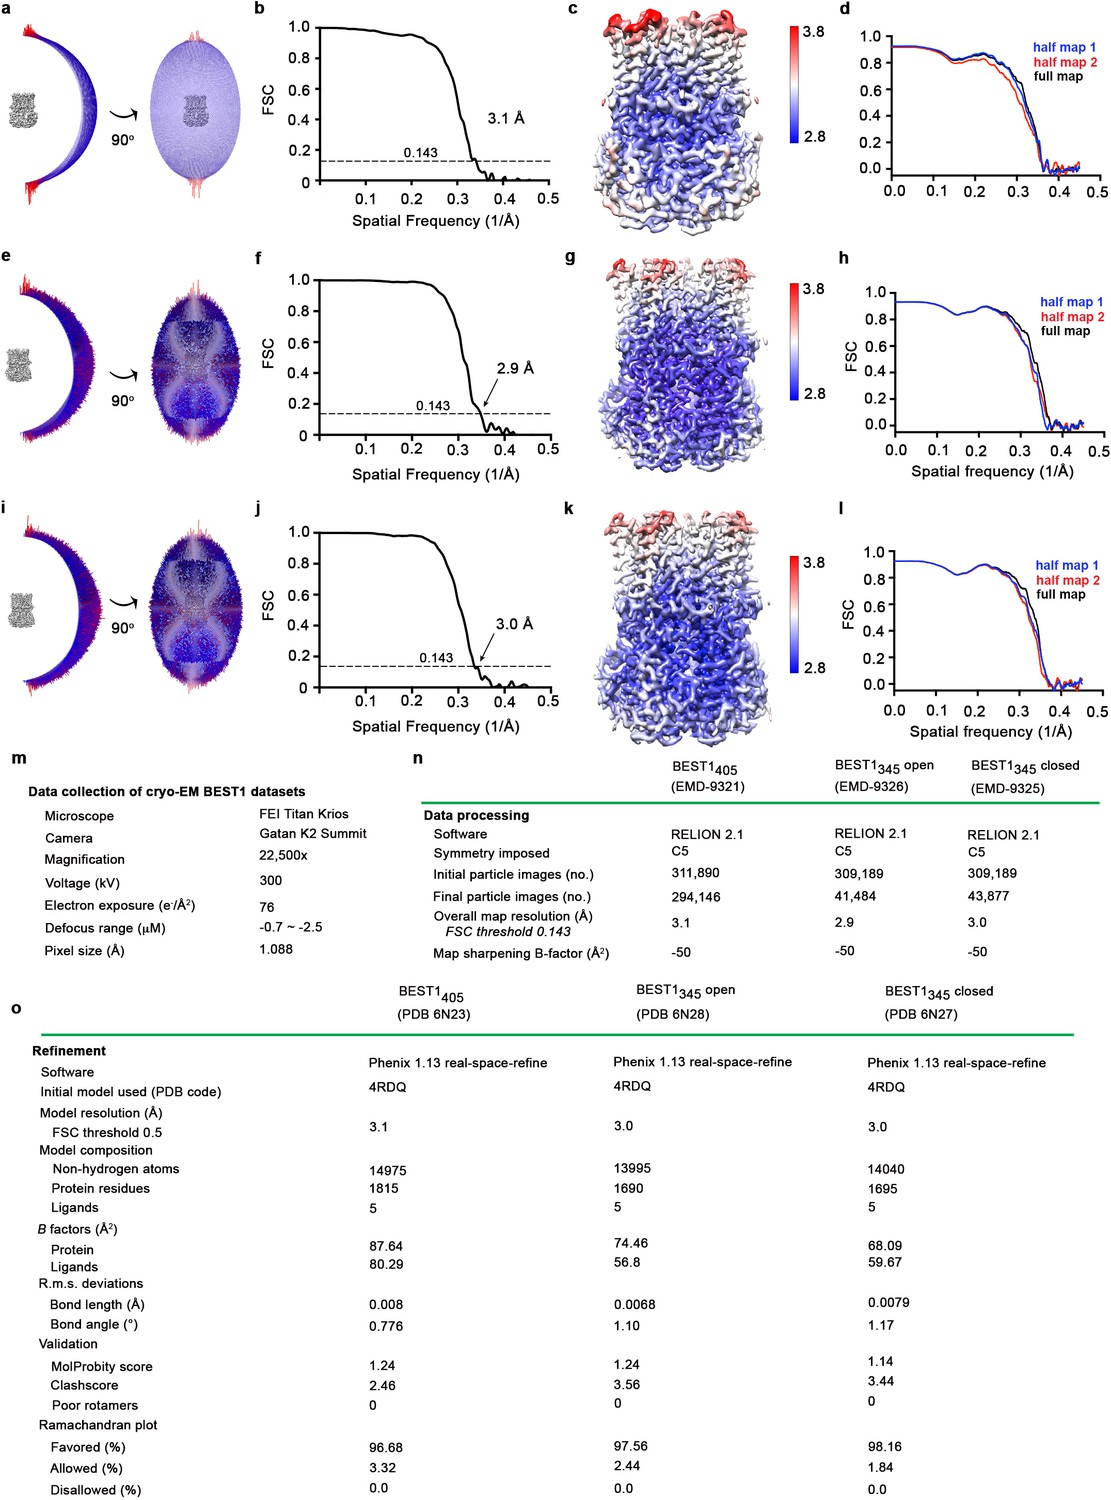
(a–d) Structural determination of BEST1405. (a) Angular orientation distribution of particles used in final reconstruction. The particle distribution is indicated by color shading, with blue to red representing low and high numbers of particles. (b) Gold-standard Fourier shell correlation (FSC) curve of the final 3D reconstruction. The resolution is 3.1 Å at the FSC cutoff of 0.143 (dotted line). (c) Local resolution of the map was estimated using Relion1 and is colored as indicated. (d) Model validation. Comparison of the FSC curves between the model and half map 1 (work), model and half map 2 (free) and model and full map. (e–h) Structural determination of the Ca2+-bound open BEST1345 structure (e) Angular orientation distribution of particles used in final reconstruction, similar to (a). (f) Gold-standard Fourier shell correlation (FSC) curve of the final 3D reconstruction. The resolution is 2.9 Å at the FSC cutoff of 0.143 (dotted line). (g) Local resolution of the map, as for (c). (h) Model validation, as for (d). (i–l) Structural determination of the Ca2+-bound closed BEST1 structure. (i) Angular orientation distribution of particles used in final reconstruction, similar to (a). (j) Gold-standard Fourier shell correlation (FSC) curve of the final 3D reconstruction. The resolution is 3.0 Å at the FSC cutoff of 0.143. (k) Local resolution of the map, as in (c). (l) Model validation, as in (d). (m–o) Table of data collection and model statistics for the Ca2+-bound BEST1405 (inactivated), Ca2+-bound open BEST1345, and Ca2+-bound closed BEST1345 structures.
Figure 1—figure supplement 3
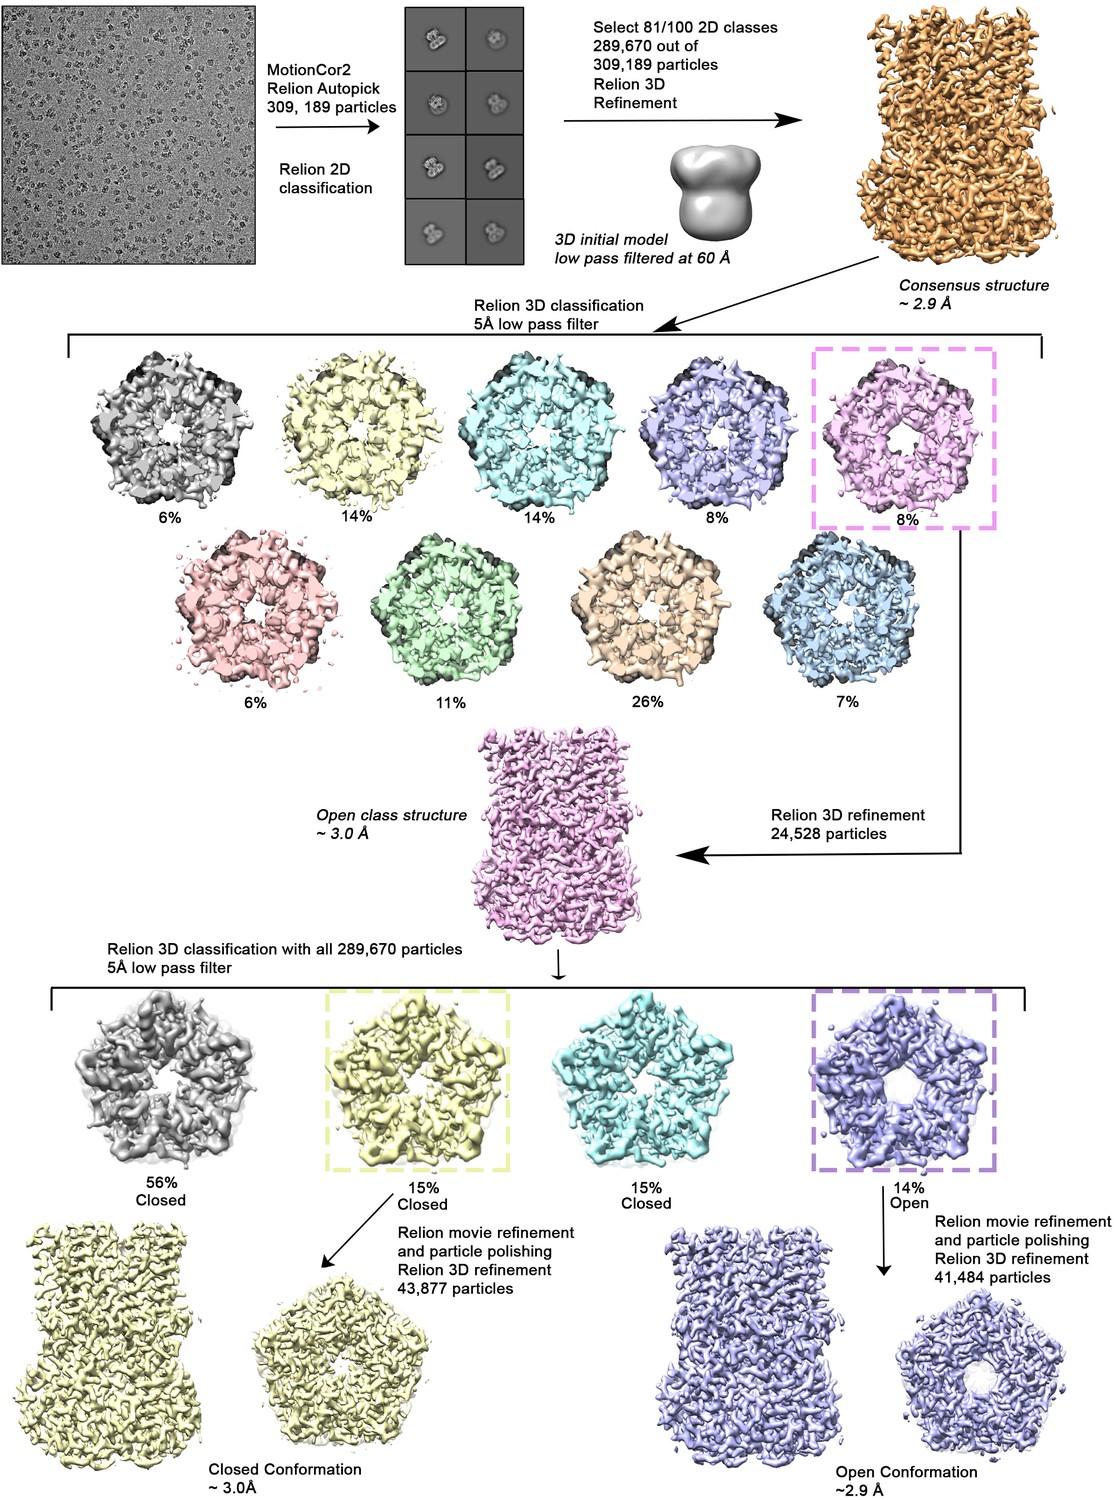
Cryo-EM workflow for the BEST1345 Ca2+-bound dataset.
A detailed description can be found in Methods.
Figure 1—figure supplement 4
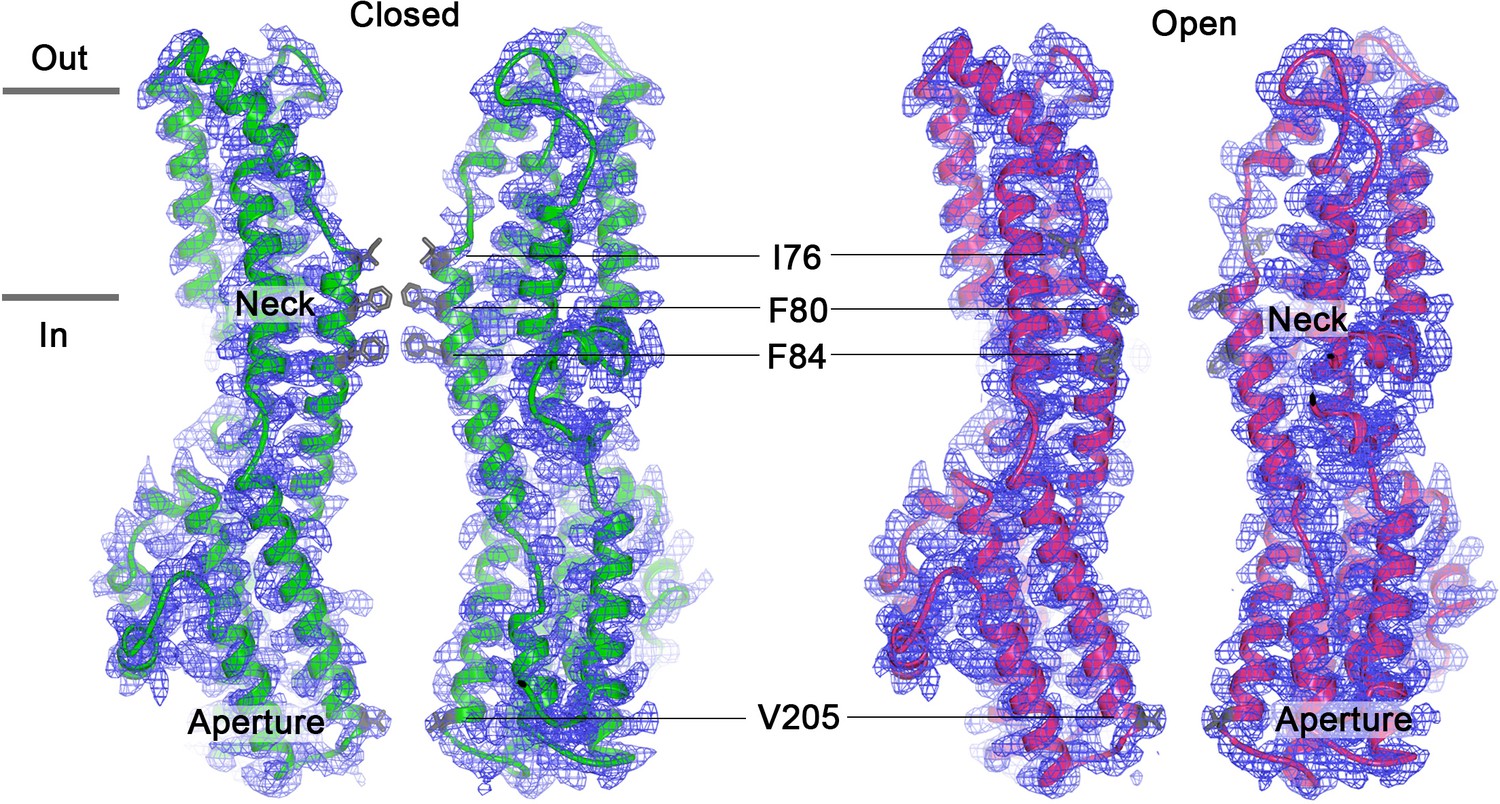
Cutaway views of the Ca2+-bound closed (left) and Ca2+-bound open (right) conformations of BEST1345.
Two subunits are drawn as ribbons with the corresponding cryo-EM density shown; three subunits are omitted for clarity. Amino acids in the neck and aperture regions are drawn as sticks. Approximate boundaries of the lipid membrane are indicated by horizontal bars.
Figure 1—figure supplement 5
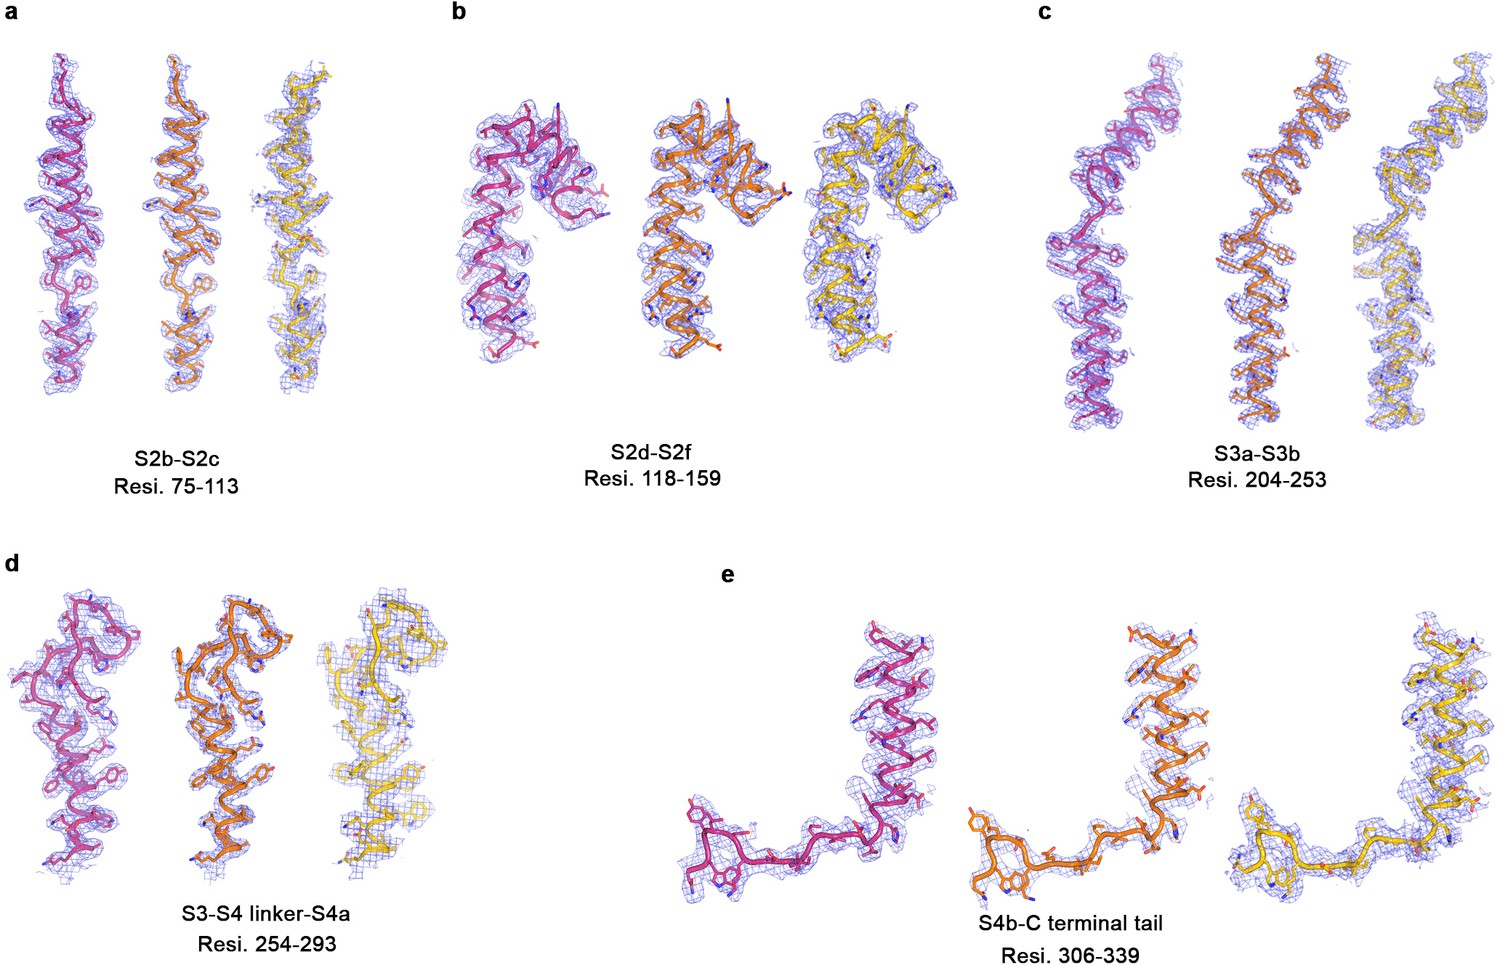
Representative cryo-EM density for three BEST1 cryo-EM structures.
(a–e) Representative map density (blue mesh, 5σ) highlighting different regions of channel in the Ca2+-bound open BEST1345 (pink), Ca2+-bound closed BEST1345 (green) and Ca2+-free BEST1345 (yellow).
Figure 2 with 2 supplements
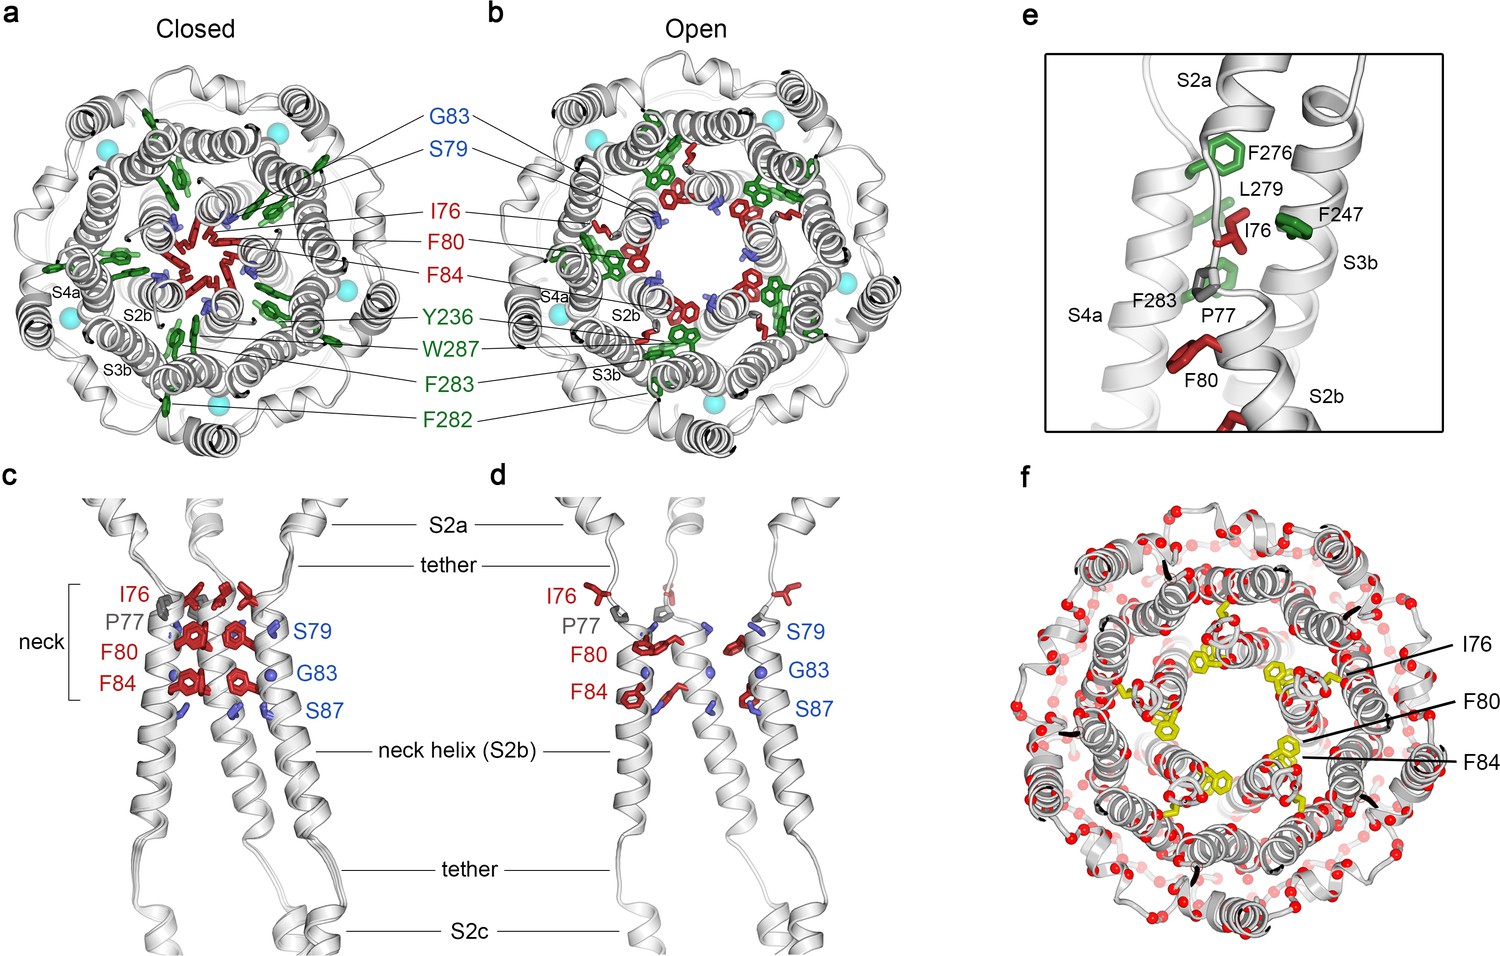
Opening transitions.
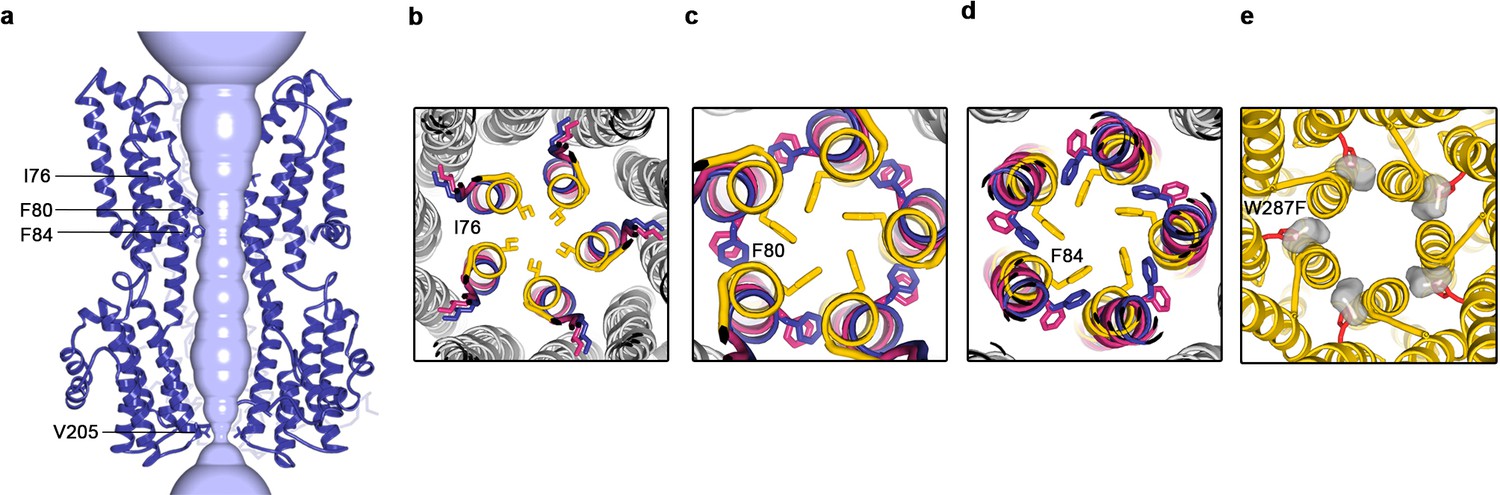
(a–b) Cutaway views of the neck region for the closed (a) and open (b) conformations, viewed from the extracellular side and shown as ribbons. Residues that form the hydrophobic seal in the closed conformation (I76, F80, F84) are colored red in both conformations. Surrounding aromatic residues that move to accommodate opening are colored green. Residues that become exposed to the pore in the open conformation (S79, sticks, and G83, sphere) are blue. Cyan spheres represent Ca2+ ions. A supplementary video shows the transition. (c–d) Side view of the conformational changes in the neck; closed (c) and open (d). In (c), a superposition of the structures of BEST1405 in the Ca2+-bound inactivated conformation, BEST1345 in the Ca2+-bound closed conformation, and BEST1345 in the Ca2+-free closed conformation shows that the neck adopts an indistinguishable (closed) conformation in each. The S2a,b, and c helices from three subunits are shown. Residues are depicted and colored as in a-b; P77 is gray; S87 is shown for reference. (e) A close-up view showing the hydrophobic packing of I76 in the open conformation. Neck residues are highlighted in red, neighboring hydrophobic residues that interact with I76 are shown in green, and P77 is depicted in gray. (f) Location of missense mutations associated with retinal diseases (Johnson et al., 2017; Xiao et al., 2010) at amino acid positions near the neck (red spheres indicate the Cα positions of the mutations).
Figure 2—figure supplement 1
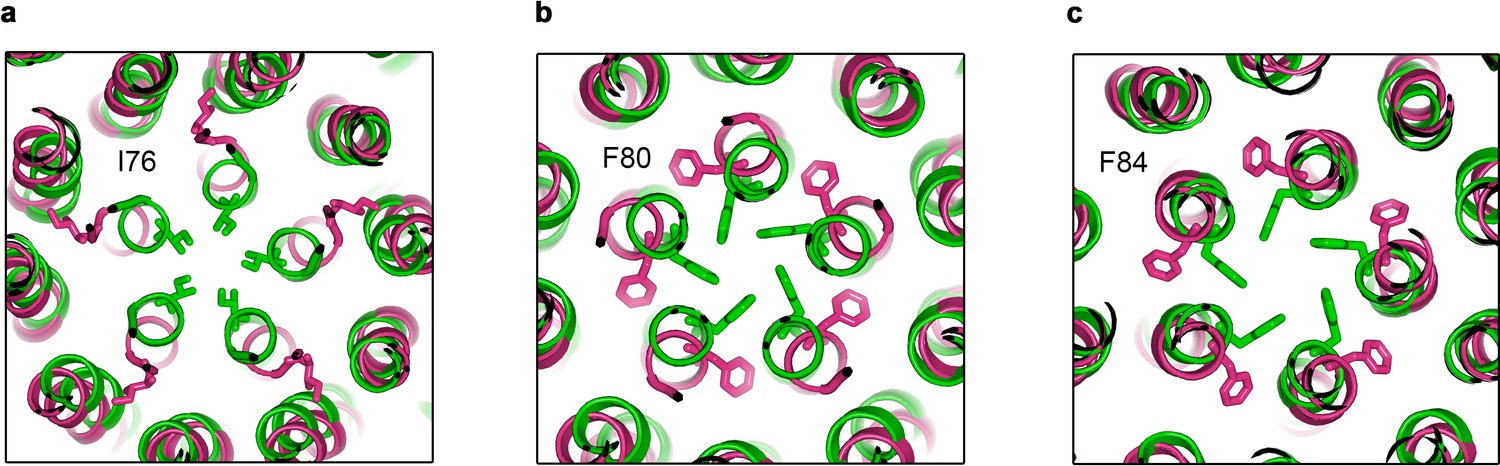
Sidechain movements at the neck.
(a–c) Comparison of neck-lining residues I76, F80 and F84 between the Ca2+-bound open (pink) and Ca2+-bound closed (green) structures. Side chains of labeled residues are depicted in each panel, viewed as a cutaway from the extracellular space.
Figure 2–video 1
Video showing opening transitions of the neck.
This movie shows a morph between the closed and open conformations. Depictions are as described in Figure 2A,B.
Figure 3 with 3 supplements
Structure of Ca2+-free BEST1345.
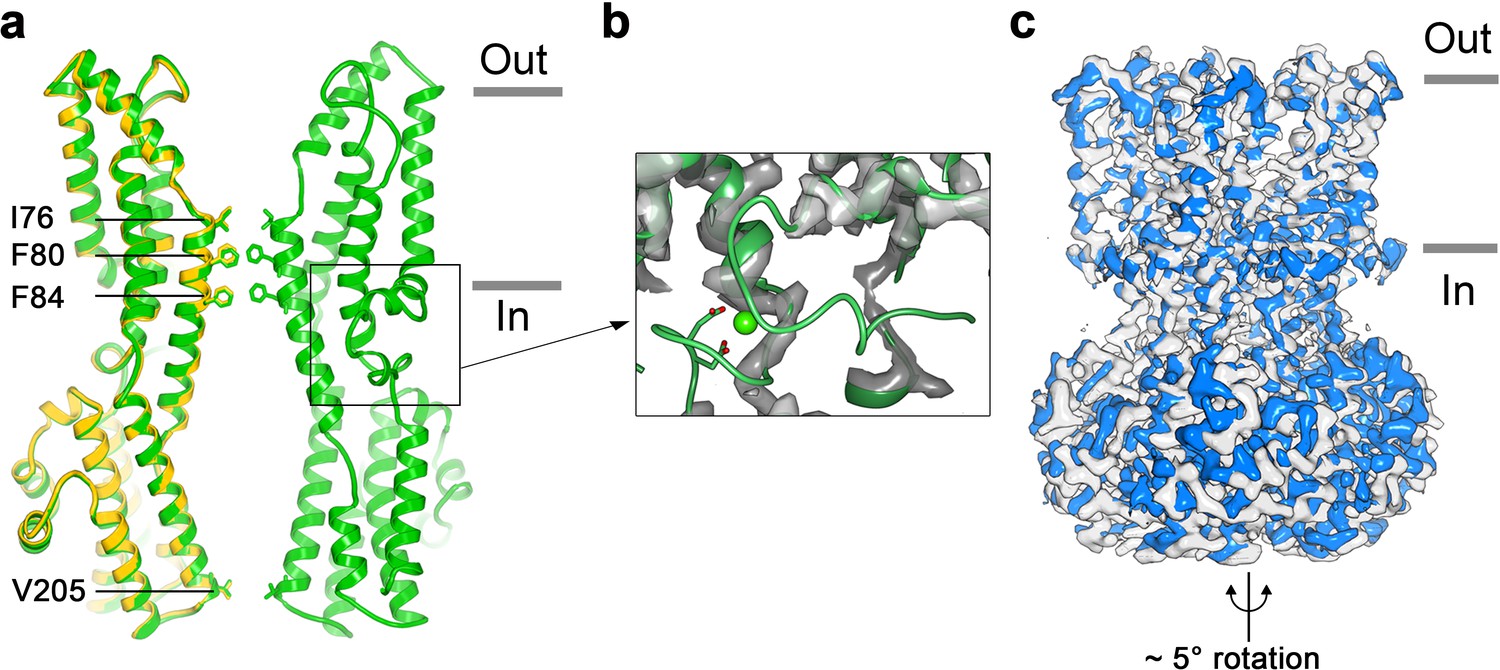
(a) Overlay comparison of the Ca2+-free conformation of BEST1345 (yellow) with the Ca2+-bound closed conformation of BEST1345 (green). One (Ca2+-free) or two (Ca2+-bound) channel subunits in ribbon are shown from the side with the approximate boundaries of the bilayer indicated. The side chains of labeled residues are shown. The boxed area highlights the location of the Ca2+-clasp. (b) Density for the Ca2+-clasp is missing in the absence of Ca2+. The structure of the Ca2+-clasp region from the Ca2+-bound closed conformation (green) is shown in comparison with the cryo-EM density in this region in the Ca2+-free map, showing that the density for the Ca2+ ion and surrounding protein residues are missing in the absence of Ca2+. Ca2+ is depicted as a green sphere and two aspartate residues that coordinate Ca2+ as part of the Ca2+ clasp are shown as sticks. (c) Refined cryo-EM maps of two conformations (blue, gray) of Ca2+-free BEST1345 that were identified using 3D classification. The maps are aligned according to their membrane-spanning regions, with the relative rotation between the cytosolic regions indicated.
Figure 3—figure supplement 1

Cryo-EM workflow for the BEST1345 Ca2+-free dataset.
A detailed description can be found in Methods.
Figure 3—figure supplement 2
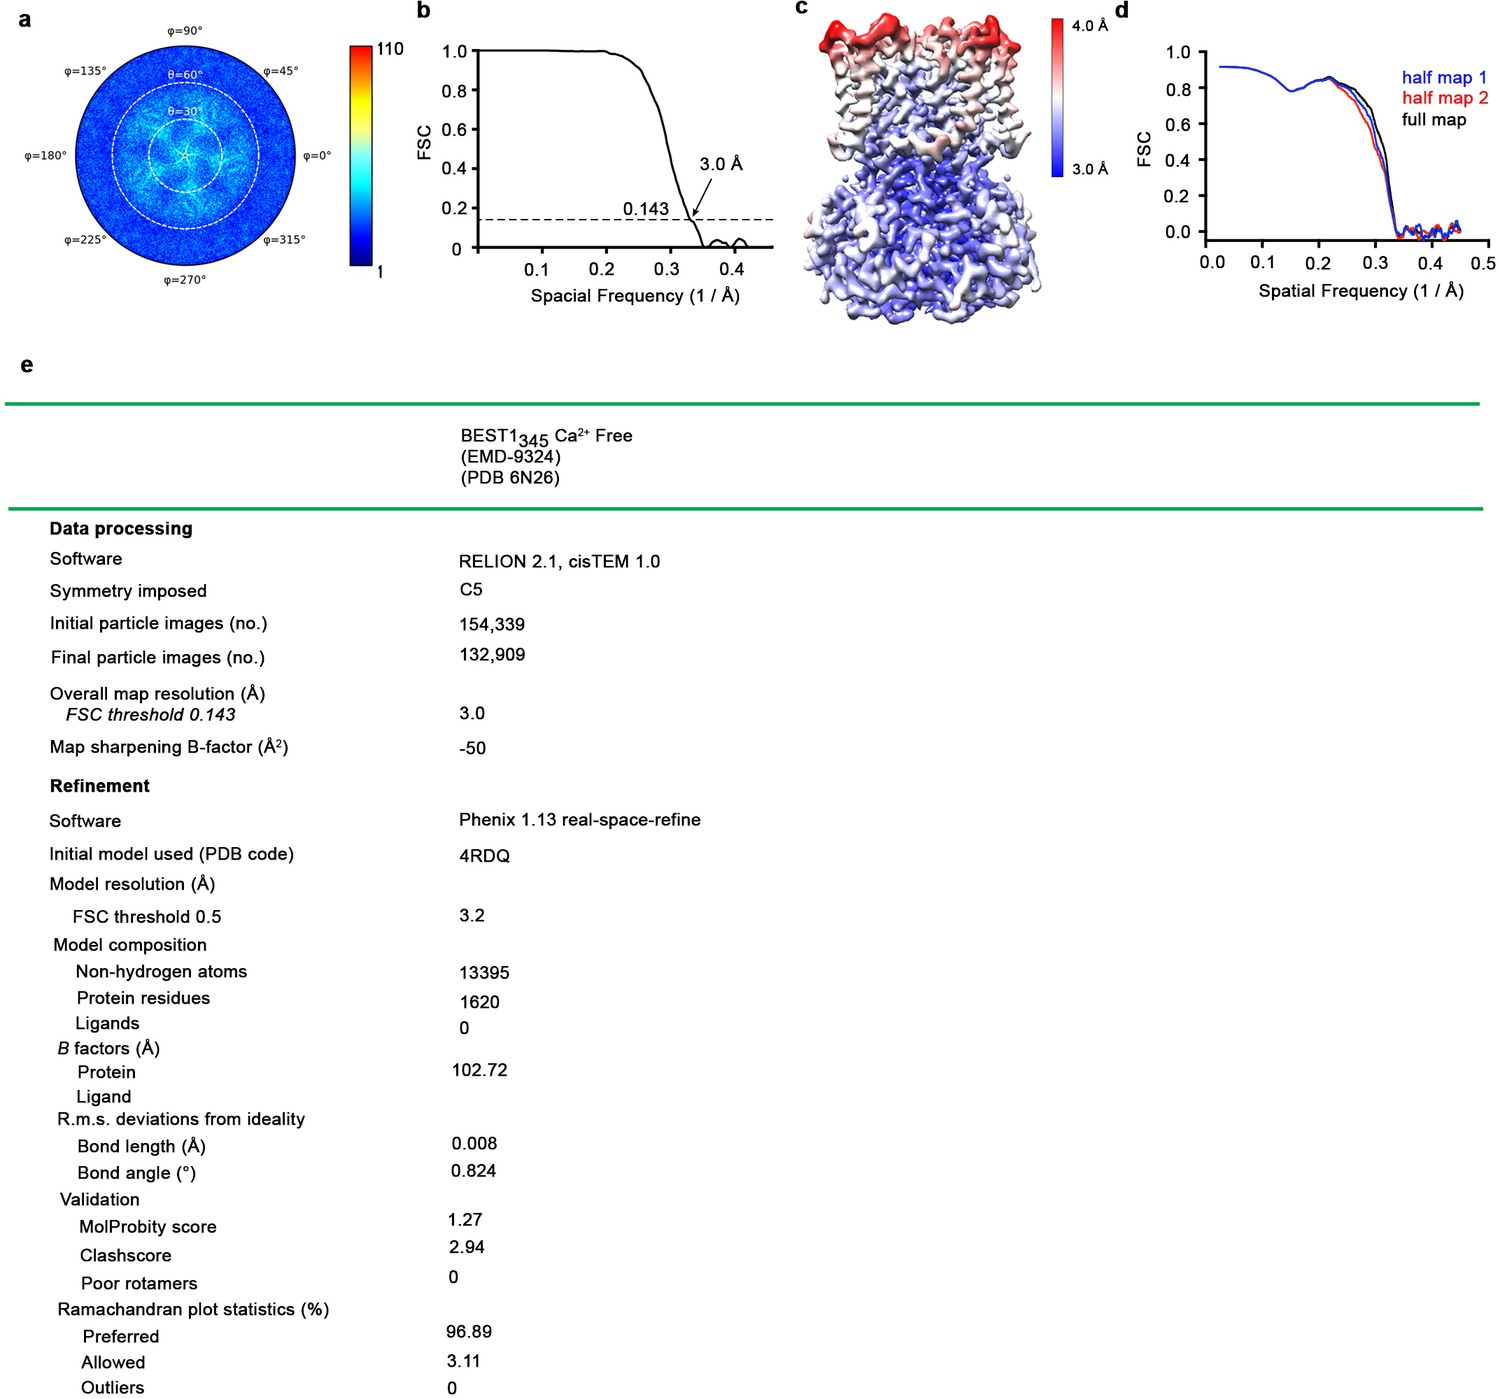
Cryo-EM structure determination of: Ca2+-free BEST1345.
(a–d) Structure determination of the consensus Ca2+-free BEST1345 conformation. (a) Angular orientation distribution of particles used in the final reconstruction. The particle distribution is indicated by color shading, with blue to red representing low and high numbers of particles. (b) Gold-standard Fourier shell correlation (FSC) curve of the final 3D reconstruction. The resolution is 3.0 Å at the FSC cutoff of 0.143 (dotted line). A thin vertical line indicates that only special frequencies to 1/ (5 Å) were used to determine particle alignment parameters during refinement. (c) Local resolution of the map estimated using Relion and colored as indicated. (d) Model validation. Comparison of the FSC curves between the model and half map 1 (work), model and half map 2 (free) and model and full map are plotted. (e) Table of data processing and model statistics.
Figure 3—figure supplement 3

Map of Ca2+-free BEST1405.
Density for the Ca2+-clasp and the inactivation peptide is missing in the absence of Ca2+ for BEST1405. The X-ray structure of Ca2+-bound BEST1405 (Kane Dickson et al., 2014) is shown as purple ribbons for comparison with the cryo-EM density of Ca2+-free BEST1405. Ca2+ is depicted as a green sphere and a Ca2+ clasp and an inactivation peptide are annotated.
Figure 4 with 3 supplements
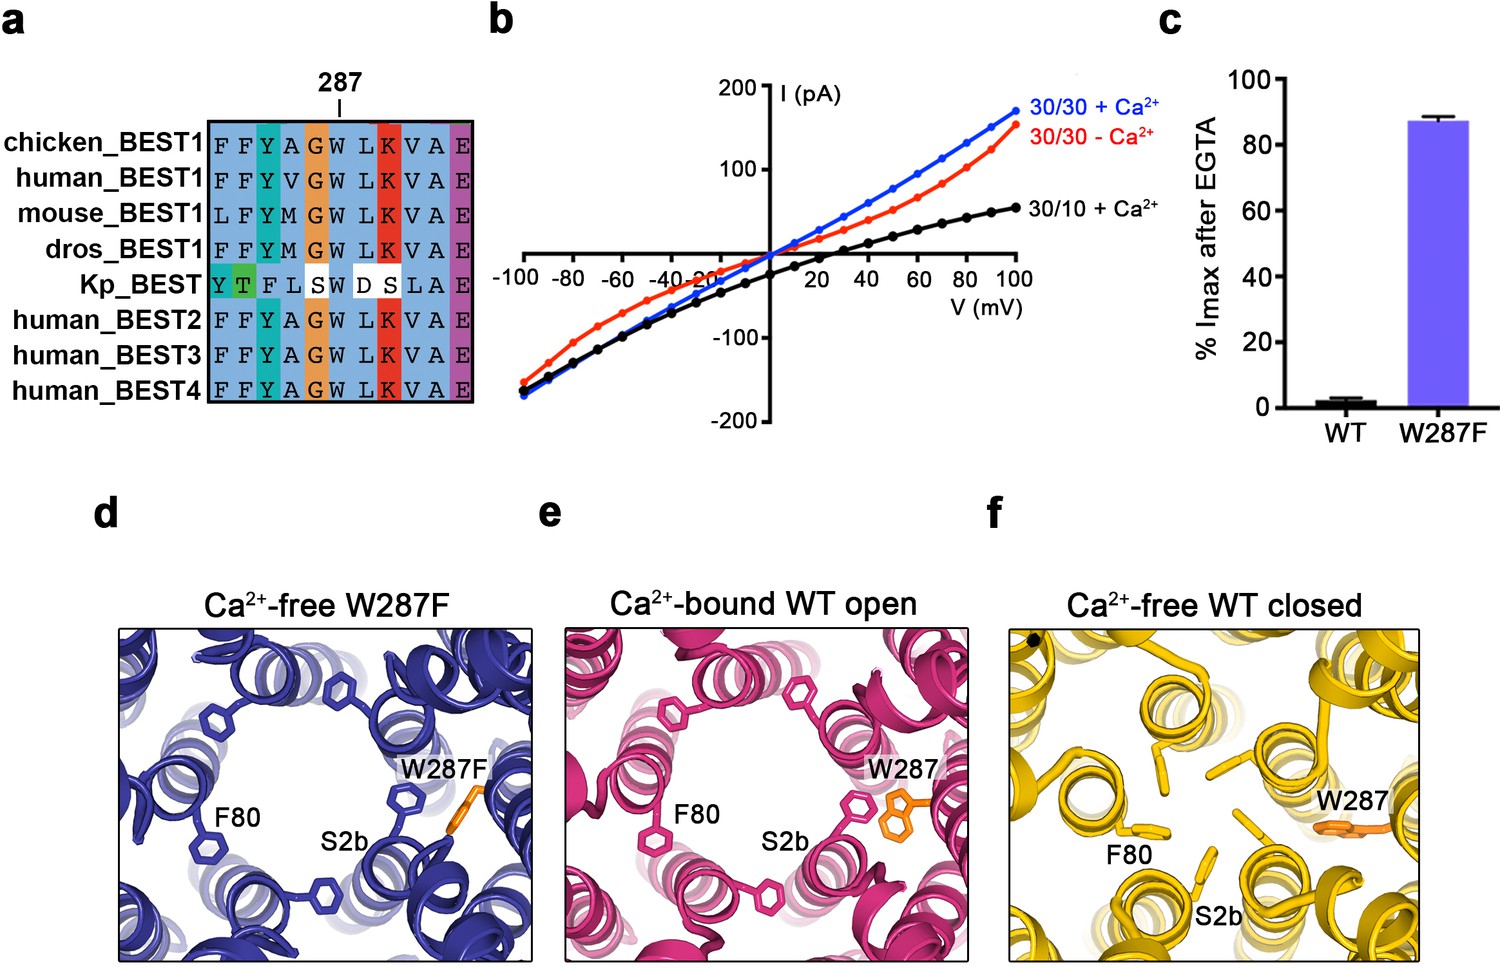
The W287F mutant decouples the Ca2+ ligand from the activation gate.
(a) Sequence alignment at and around residue 287 for chicken, human, mouse, Drosophila melanogaster (dros) and Klebsiella pneumoniae (Kp) bestrophin homologs and paralogs. (b–c) Dramatically reduced Ca2+-dependence but normal Cl- versus K+ selectivity of the W287F mutant. I-V relationships (b) are shown for voltages stepped from −100 to +100 mV for the indicated conditions [cis/trans KCl concentration in mM, and ~300 nM [Ca2+]free (+Ca2+) or 10 mM EGTA (-Ca2+)]. The reversal potential (Erev) measured using asymmetric KCl (30/10 mM) indicates normal Cl- versus K+ selectivity: Erev = 24.8 ± 0.8 mV for BEST1345 W287F in comparison to 23.4 ± 0.3 mV for wild type BEST1345 (Vaisey and Long, 2018). (c) Bar graph showing the percentage of current remaining after addition of 10 mM EGTA for BEST1345 (WT) and the W287F mutant. Imax indicates the current measured at +100 mV in the presence of 300 nM [Ca2+]free. Error bars denote the SEM calculated from four (WT) or six (W287F) separate experiments. (d–f) The W287F mutant locks the neck open, even in the absence of Ca2+. (d) Structure of the W287F mutant in the absence of Ca2+, showing the open conformation of the neck region (ribbons; cutaway view from an extracellular orientation). The W287F mutation (orange sticks) is shown for one subunit. F80 residues are drawn as sticks. Ca2+-bound open (e) and Ca2+-free closed (f) conformations of BEST1345 are depicted in the same manner.
Figure 4—figure supplement 1
Cryo-EM workflow for Ca2+-bound and Ca2+-free BEST1345 W287F datasets.
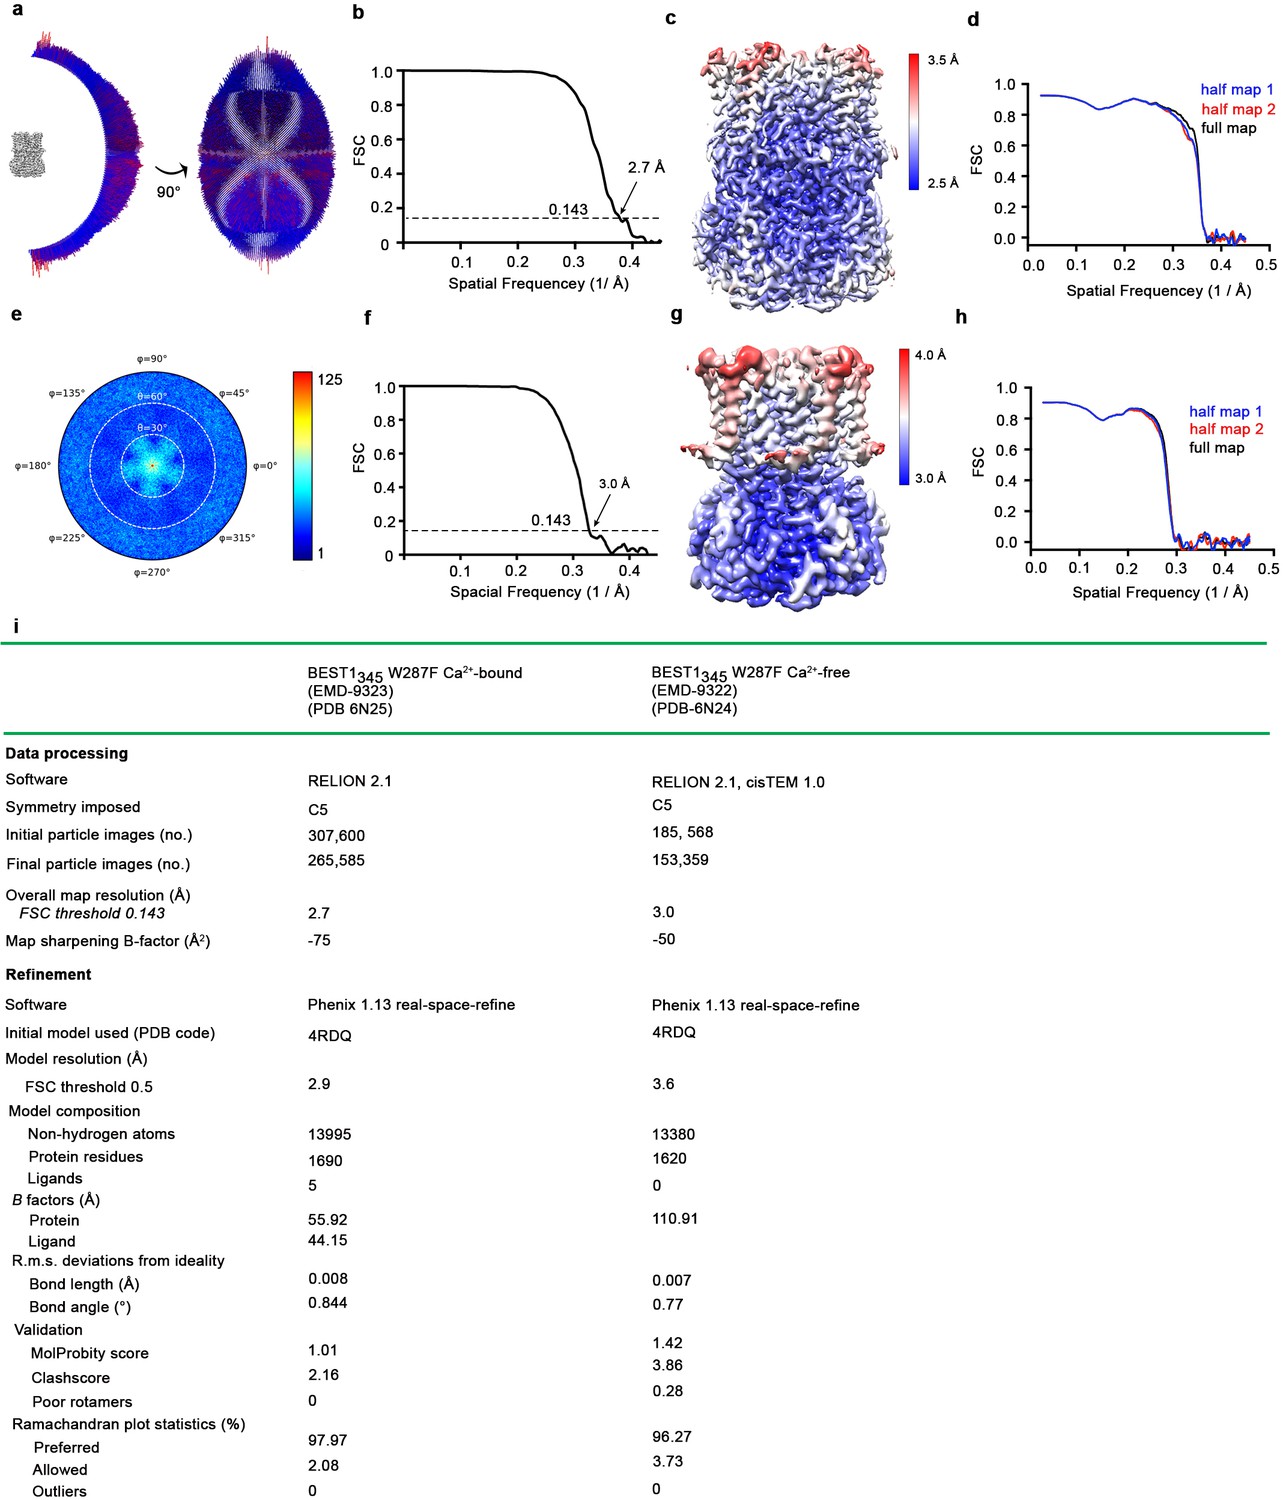
(a) Cryo-EM workflow for Ca2+-bound BEST1345 W287F. A detailed description can be found in Methods. (b) Comparison of F80, F84, W287 (or the W287F mutation), and Y236 between the open (pink; BEST1345) and the Ca2+-bound W287F mutant (orange; BEST1345 W287F) structures. A cutaway view is shown from the extracellular perspective. (c) Cryo-EM workflow for Ca2+-free BEST1345 W287F. A detailed description can be found in Methods.
Figure 4—figure supplement 2
Cryo-EM structure determination of Ca2+-bound BEST1345 W287F and Ca2+-free BEST1345 W287F.
(a–d) Structure determination of Ca2+-bound BEST1345 W287F. (a) Angular orientation distribution of particles used in the final reconstruction. The particle distribution is indicated by color shading, with blue to red representing low and high numbers of particles. (b) Gold-standard Fourier shell correlation (FSC) curve of the final 3D reconstruction. The resolution is 3.0 Å at the FSC cutoff of 0.143 (dotted line). A thin vertical line indicates that only special frequencies to 1/ (5 Å) were used to determine particle alignment parameters during refinement. (c) Local resolution of the map estimated using Relion and colored as indicated. (d) Model validation. Comparison of the FSC curves between the model and half map 1 (work), model and half map 2 (free) and model and full map are plotted. (e–h) Structure determination of the Ca2+-free BEST1345 W287F structure as in a-d. (i) Table of data processing and model statistics.
Figure 4—figure supplement 3
Structure of Ca2+-free BEST1345 W287F.
(a) Even in the absence of Ca2+, the neck of BEST1345 W287F is open. Depictions of the pore and protein are as indicated in Figure 1C,D. (b–d), Comparison of neck-lining residues I76 (b), F80 (c) and F84 (d) between Ca2+-free BEST1345 (yellow), Ca2+-free BEST1345 W287F (blue), and the open conformation of Ca2+-bound BEST1345 (pink). The view is a cutaway from the extracellular space; side chains of labeled residues are depicted. Helices are drawn as ribbons and those not lining the pore are colored in gray. (e) Modeling of a phenylalanine residue (red sticks) in place of W287 in the closed structure of BEST1345 (yellow ribbons) introduces a void (gray surface) behind the neck. The void was identified and displayed using Pymol (pymol.org).
Figure 5 with 1 supplement
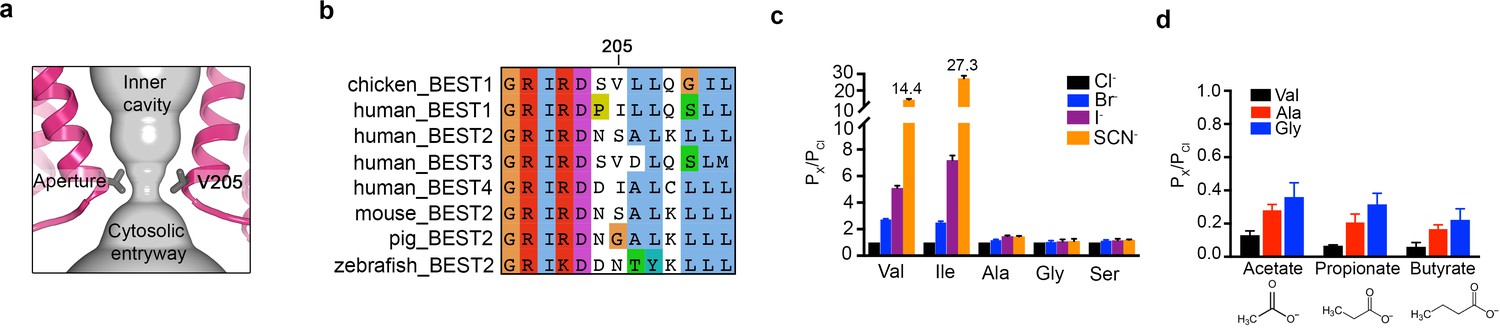
The aperture.
(a) Close up of the aperture. (b) Sequence alignment around the aperture. (c–d) Mutation of V205 affects ion permeability. (c) Comparison of the permeabilities of Br-, I-, and SCN- relative to Cl- (PX/PCl) for wild type (Val) and the indicated amino acid substitutions of V205. PX/PCl values were calculated from reversal potentials recorded in 30 mM KCl (cis) and 30 mM KX (trans) where X is Br, I, or SCN. The y-axis scale is discontinuous, as indicated, and the mean value of PSCN/PCl is indicated for the wild-type and the V205I mutant channels. IV traces are shown in Figure 5—figure supplement 1. (d) Permeabilities of larger anions. Comparison of the permeabilities of acetate, propionate and butyrate relative to Cl- for wild type (Val) and the indicated mutants of V205 (calculated as in c). For (c–d), error bars denote the SEM from three experiments.
Figure 5—figure supplement 1
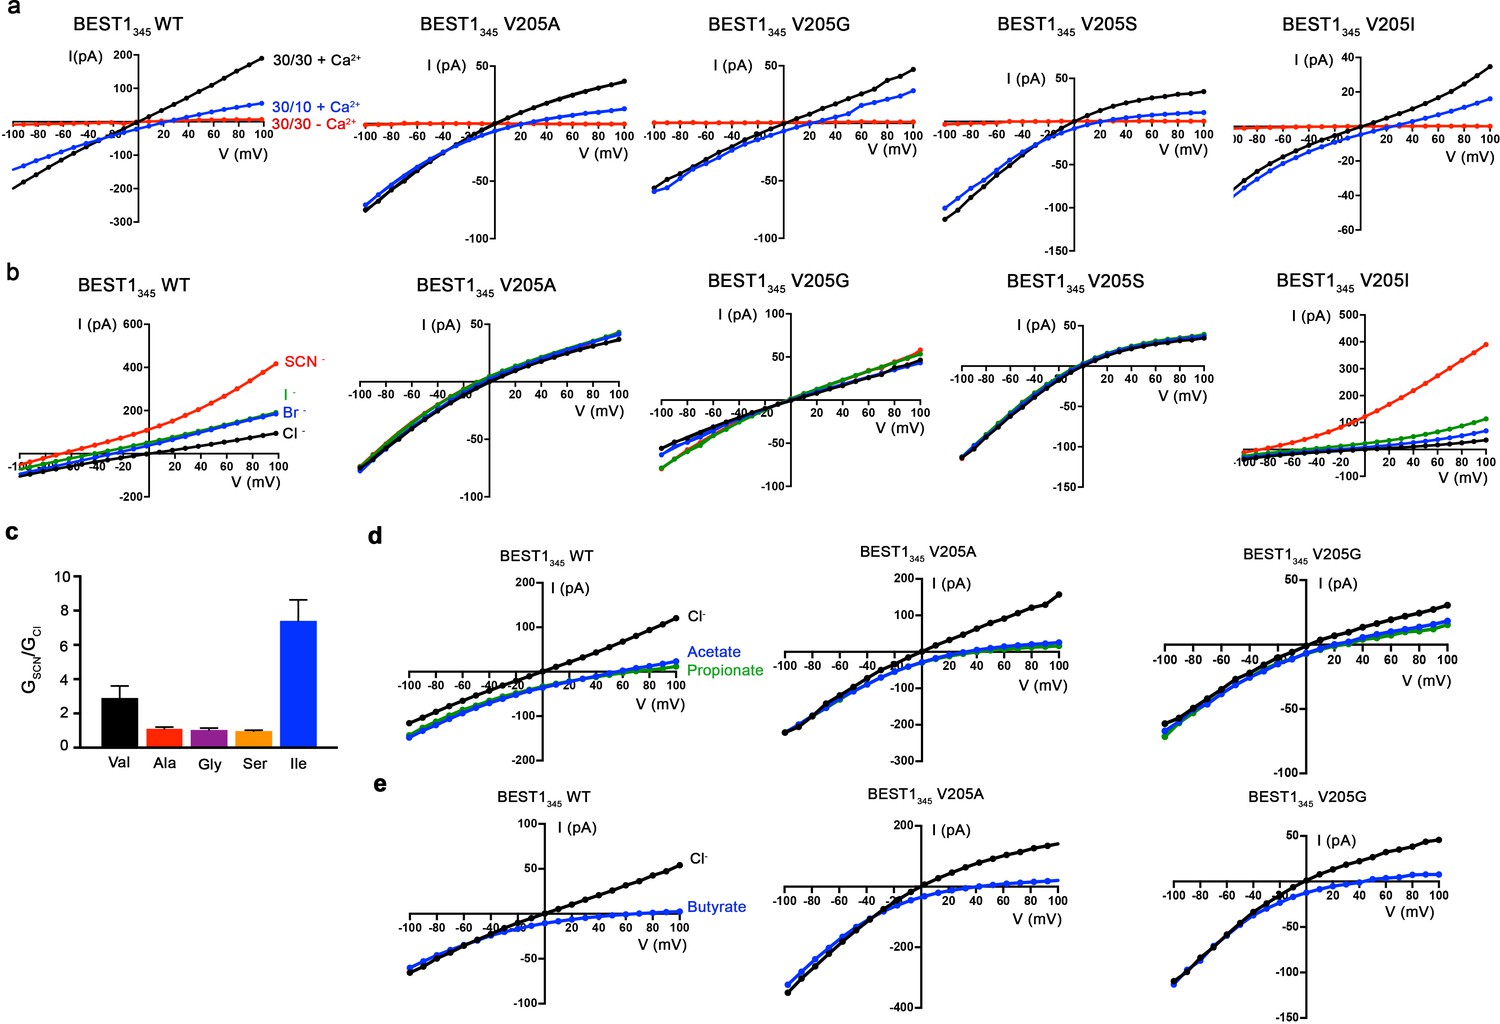
Current-voltage relationships of aperture mutants.
(a) All aperture mutants exhibit indistinguishable relative permeabilities of Cl- versus K+ in comparison wild-type BEST1 and are Ca2+-dependent. Representative I-V relationships are shown for voltages stepped from −100 to +100 mV for the indicated standard conditions [cis/trans KCl concentration in mM, and ~300 nM [Ca2+]free (+Ca2+) or 10 mM EGTA (-Ca2+)]. (b) I-V relationships of BEST1345 WT (wild type) and BEST1345 V205 mutants that were used to determine permeabilities of Br-, I-, and SCN- relative to Cl-. After first recording using symmetric 30 mM KCl (black I–V trace), the solution on the trans side was replaced (by perfusion) with solutions containing 30 mM KBr (blue), 30 mM KI (green), or 30 mM KSCN (red). (c) Relative conductance ratios (GSCN/GCl) of SCN- and Cl- for wild-type and aperture mutant BEST1 channels. Changes to relative ion conductance by aperture mutation are consistent with changes to relative permeability ratios. Ratios of conductance with SCN- or Cl- in the trans side of the bilayer chamber were obtained from the measurement of the slope of the current-voltage relationship, as shown in B, between the reversal potential and +100 mV. Error bars denote the SEM from three separate experiments. (d) Representative I-V relationships that were used to determine the permeabilities of acetate and propionate relative to Cl-. Experiments were performed as in (b) except that the solution on the trans side was replaced with a solution containing 30 mM KCH3COO (blue) or KC2H5COO (green). (e) Representative I-V relationships that were used to determine permeabilities of butyrate relative to Cl- for the indicated constructs. Experiments were performed analogously to those described in (b) but used sodium salts: after recording in symmetric 30 mM NaCl (black I-V trace) the solution on the trans side was replaced with solution containing 30 mM NaC3H7COO (blue).
Figure 6
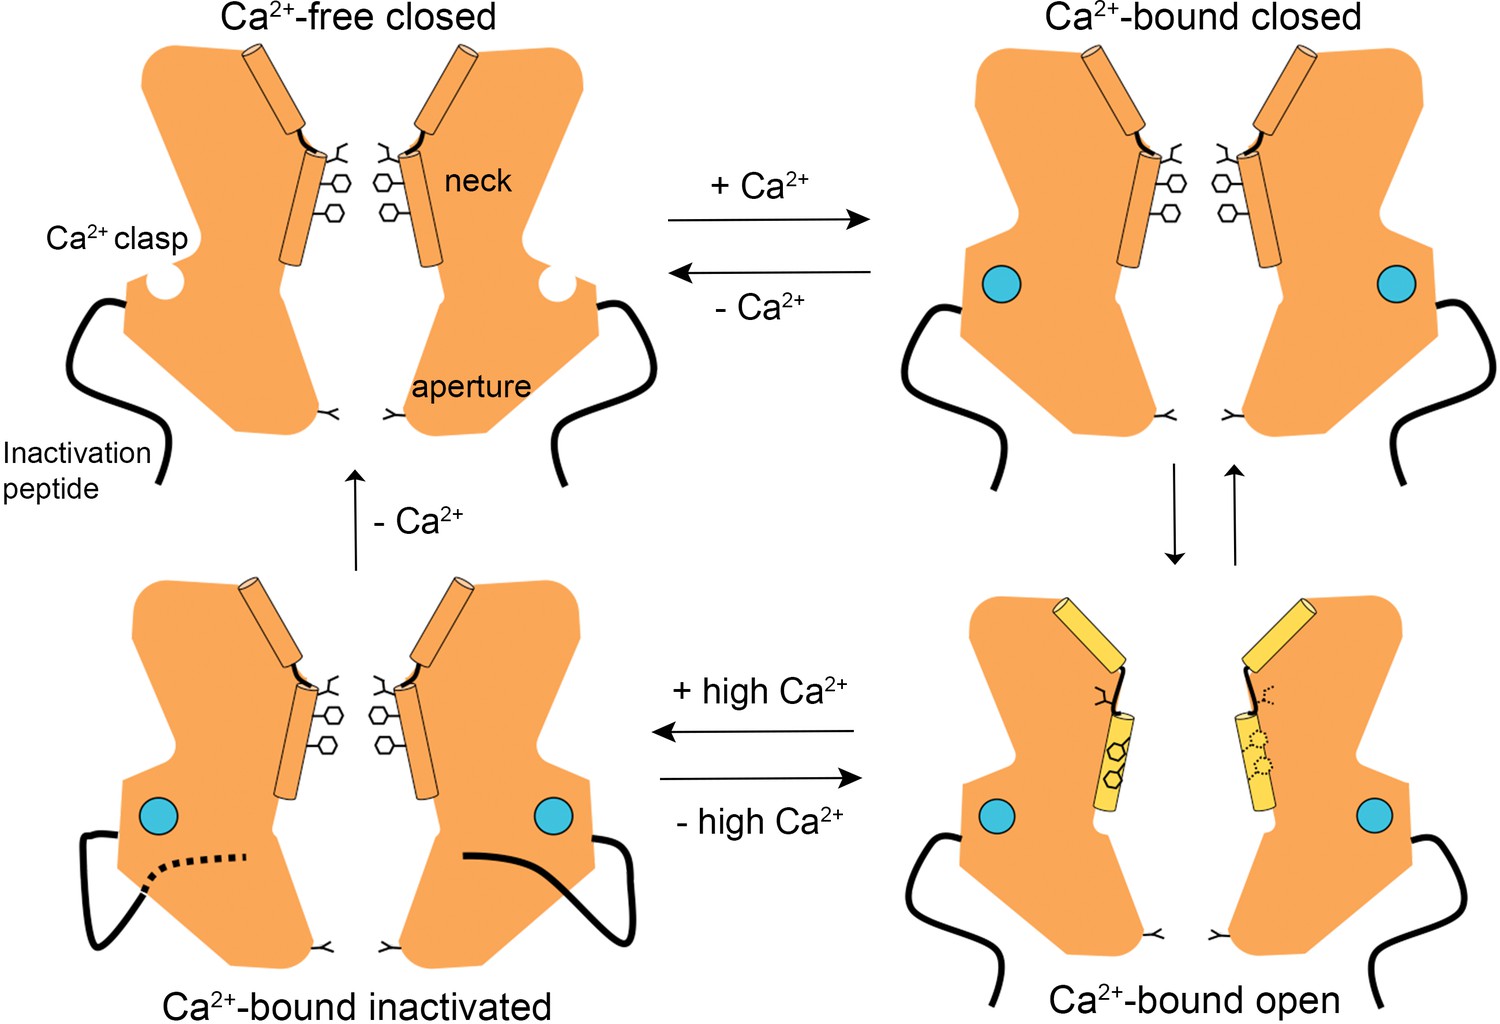
A Gating model.
In the absence of Ca2+, hydrophobic block at the neck prevents ion flow (Ca2+-free closed). When the Ca2+ clasps are occupied by Ca2+, the channel is in equilibrium between Ca2+-bound closed and Ca2+-bound open conformations. The dramatic widening of the opened neck enables hydrated ions to flow through it. Binding of the inactivation peptide to its cytosolic receptor, which is stimulated by higher concentrations (>500 nM) of Ca2+, induces the Ca2+-bound inactivated conformation in which the neck is closed. The aperture, which remains fixed throughout the gating cycle, acts as a size-selective filter that requires permeating ions to become at least partially dehydrated as they pass though it, and this engenders the channel’s lyotropic permeability sequence.
Additional files
-
Transparent reporting form
- https://doi.org/10.7554/eLife.43231.022
Download links
A two-part list of links to download the article, or parts of the article, in various formats.
Downloads (link to download the article as PDF)
Open citations (links to open the citations from this article in various online reference manager services)
Cite this article (links to download the citations from this article in formats compatible with various reference manager tools)
Molecular mechanisms of gating in the calcium-activated chloride channel bestrophin
eLife 8:e43231.
https://doi.org/10.7554/eLife.43231


