Structural insights into SETD3-mediated histidine methylation on β-actin
- Shanhui Liao

- Sebastian Kwiatkowski
- Weronika Tomaka
- Huijuan Yu
- Gao Wu
- Xiaoming Tu
- Jinrong Min
- Jakub Drozak
- Chao Xu
- University of Science and Technology of China, China
- University of Warsaw, Poland
- University of Toronto, Canada
Figures
Figure 1 with 8 supplements
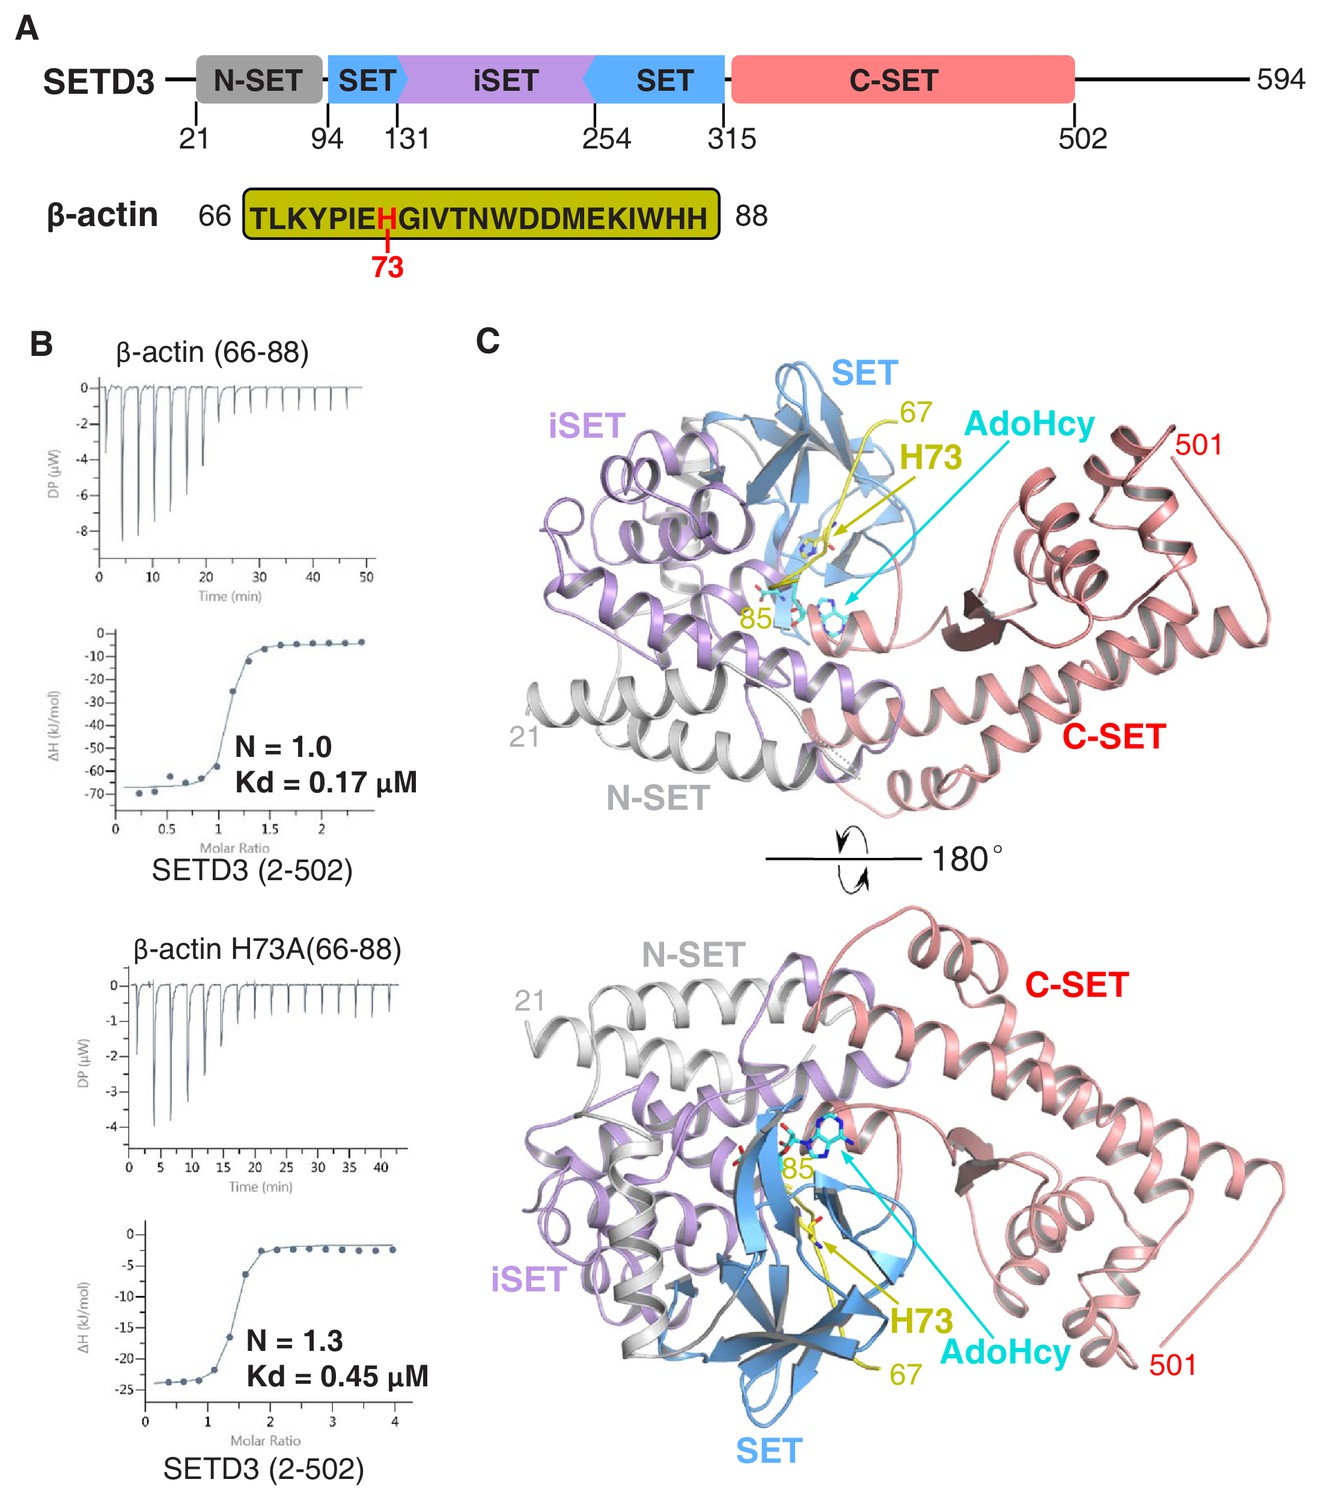
The SETD3 core region specifically recognizes a fragment of β-actin containing His73.
(A) Domain architecture of full-length human SETD3 (aa 1–594) and the sequence of the β-actin peptide (66–88), with His73 of β-actin highlighted. (B) Representative ITC binding curves for the binding of SETD3 (aa 2–502) to β-actin peptides of different lengths. The molecular ratios, derived Kds and respective standard deviations are also indicated. (C) The overall structure of AdoHcy-bound SETD3 with unmodified β-actin peptide. The SETD3 domains are colored in the same way as in Figure 1A, with the N-SET, SET, iSET and C-SET regions of SETD3 colored in gray, blue, purple and pink, respectively. The peptide is shown in yellow cartoon, while His73 and AdoHcy are shown in yellow and cyan sticks, respectively. His73 of actin and the AdoHcy are labeled.
Figure 1—figure supplement 1
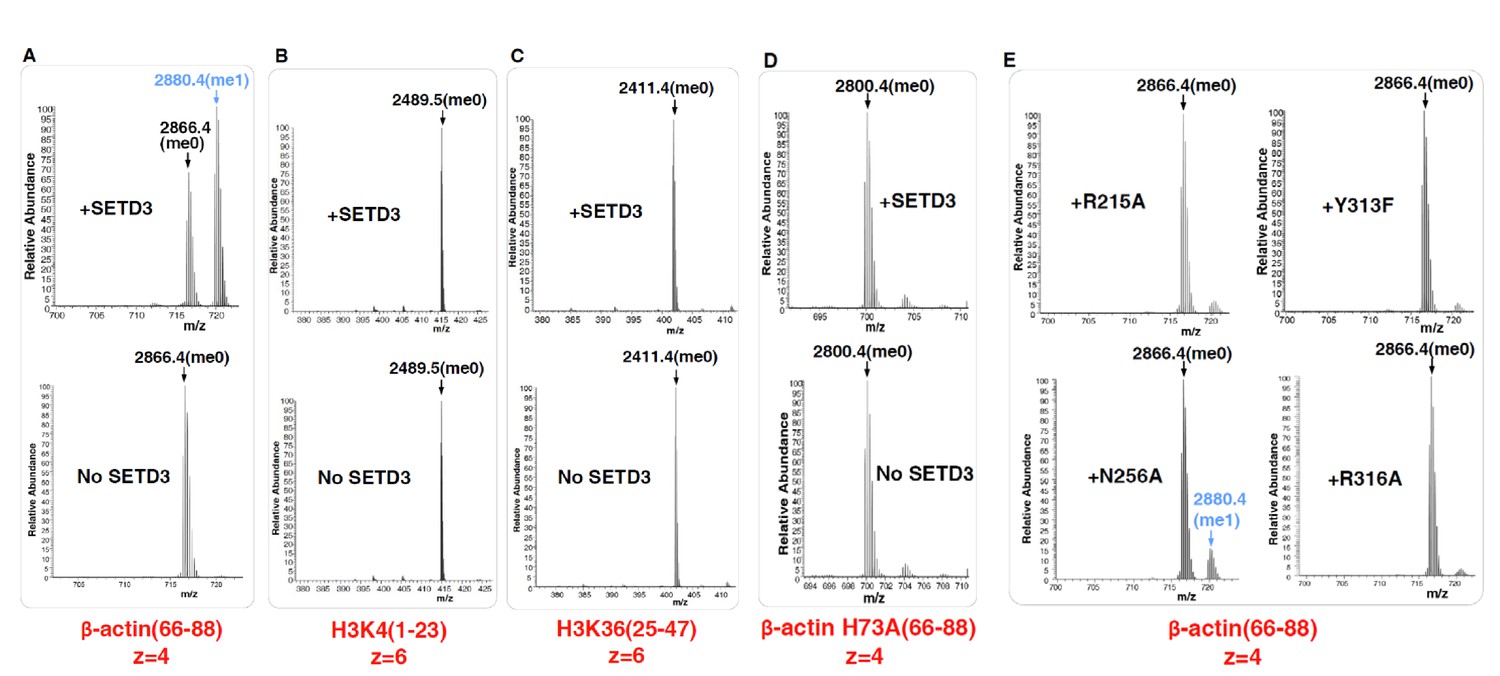
Mass Spectrometry data showing the activity of SETD3 toward different peptides.
The core region of SETD3 (aa 2–502) methylates (A) the β-actin peptide (aa 66–88), but not (B) H3K4 (aa 1–23), (C) H3K36 (aa 25–47), or (D) β-actin H73A (aa 66–88). (E) The activity of SETD3 mutants on the β-actin peptide (aa 66–88).
Figure 1—figure supplement 2
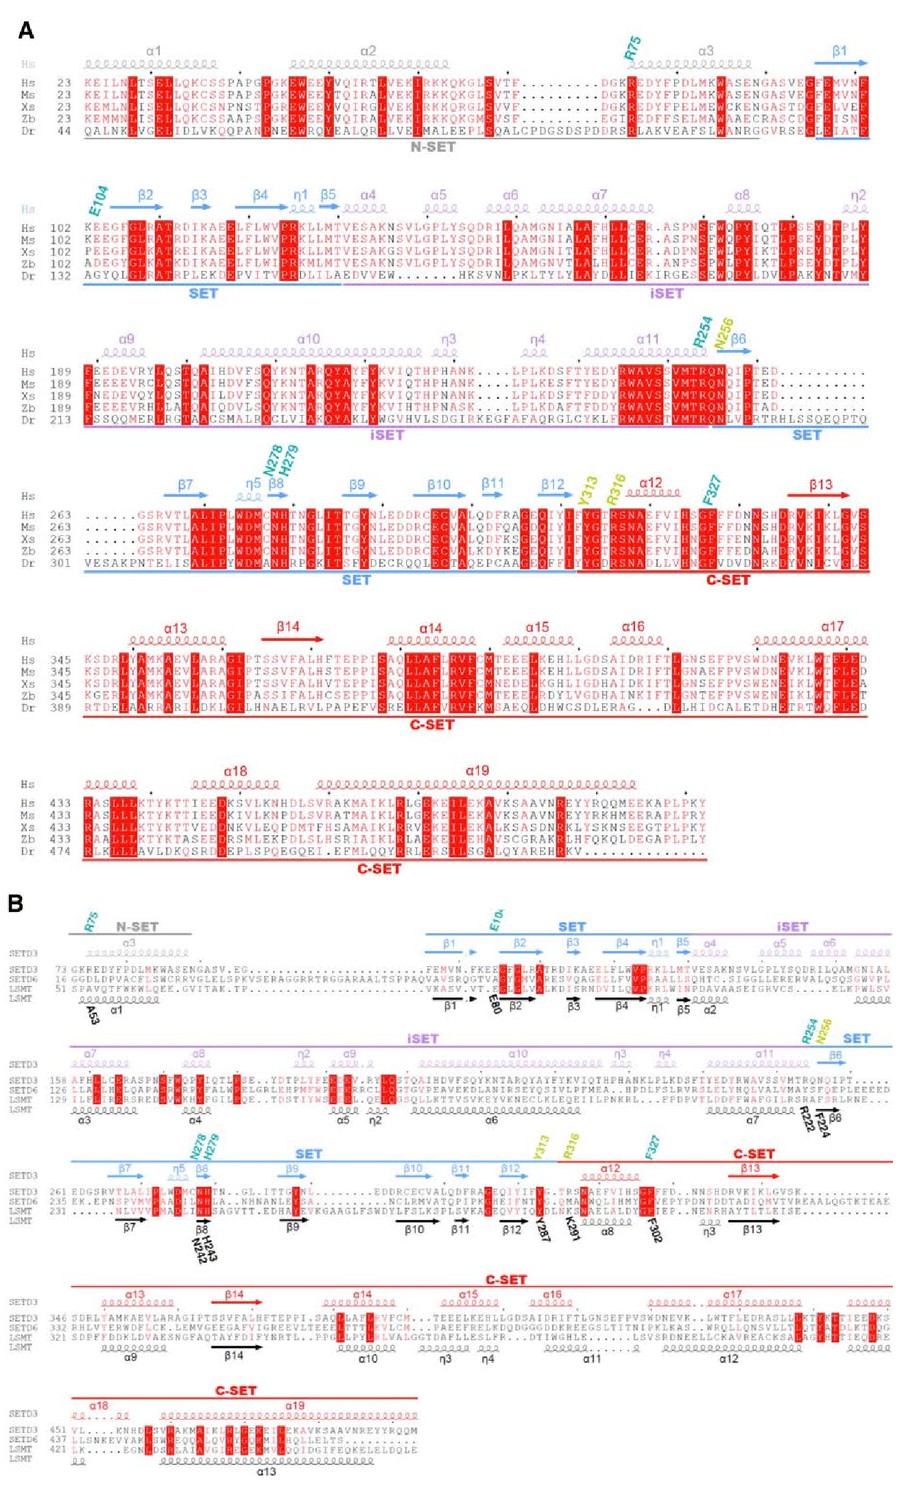
Sequence alignment of human SETD3 with its orthologs or other SET domain proteins (SETD6 and LSMT).
(A) Sequence alignment of human SETD3 (Hs, NP_115609.2), mouse SETD3 (Ms, NP_082538.2), Xenopus SETD3 (Xs, NP_001016577), zebrafish SETD3 (Zb, NP_956348.1) and Drosophila SETD3 (Dr, XP_017048262.1). The secondary structures of human SETD3 are colored in the same way as in Figure 1A. The residues involved in binding to AdoHcy and His73 are labeled in cyan and yellow, respectively. (B) Sequence alignment of human SETD3, human SETD6 (NP_001153777.1) and Pisum sativum LSMT (AAA69903.1). The secondary structures, AdoHcy binding residues, and His73 binding residues are labeled as in Figure 1—figure supplement 2A.
Figure 1—figure supplement 3
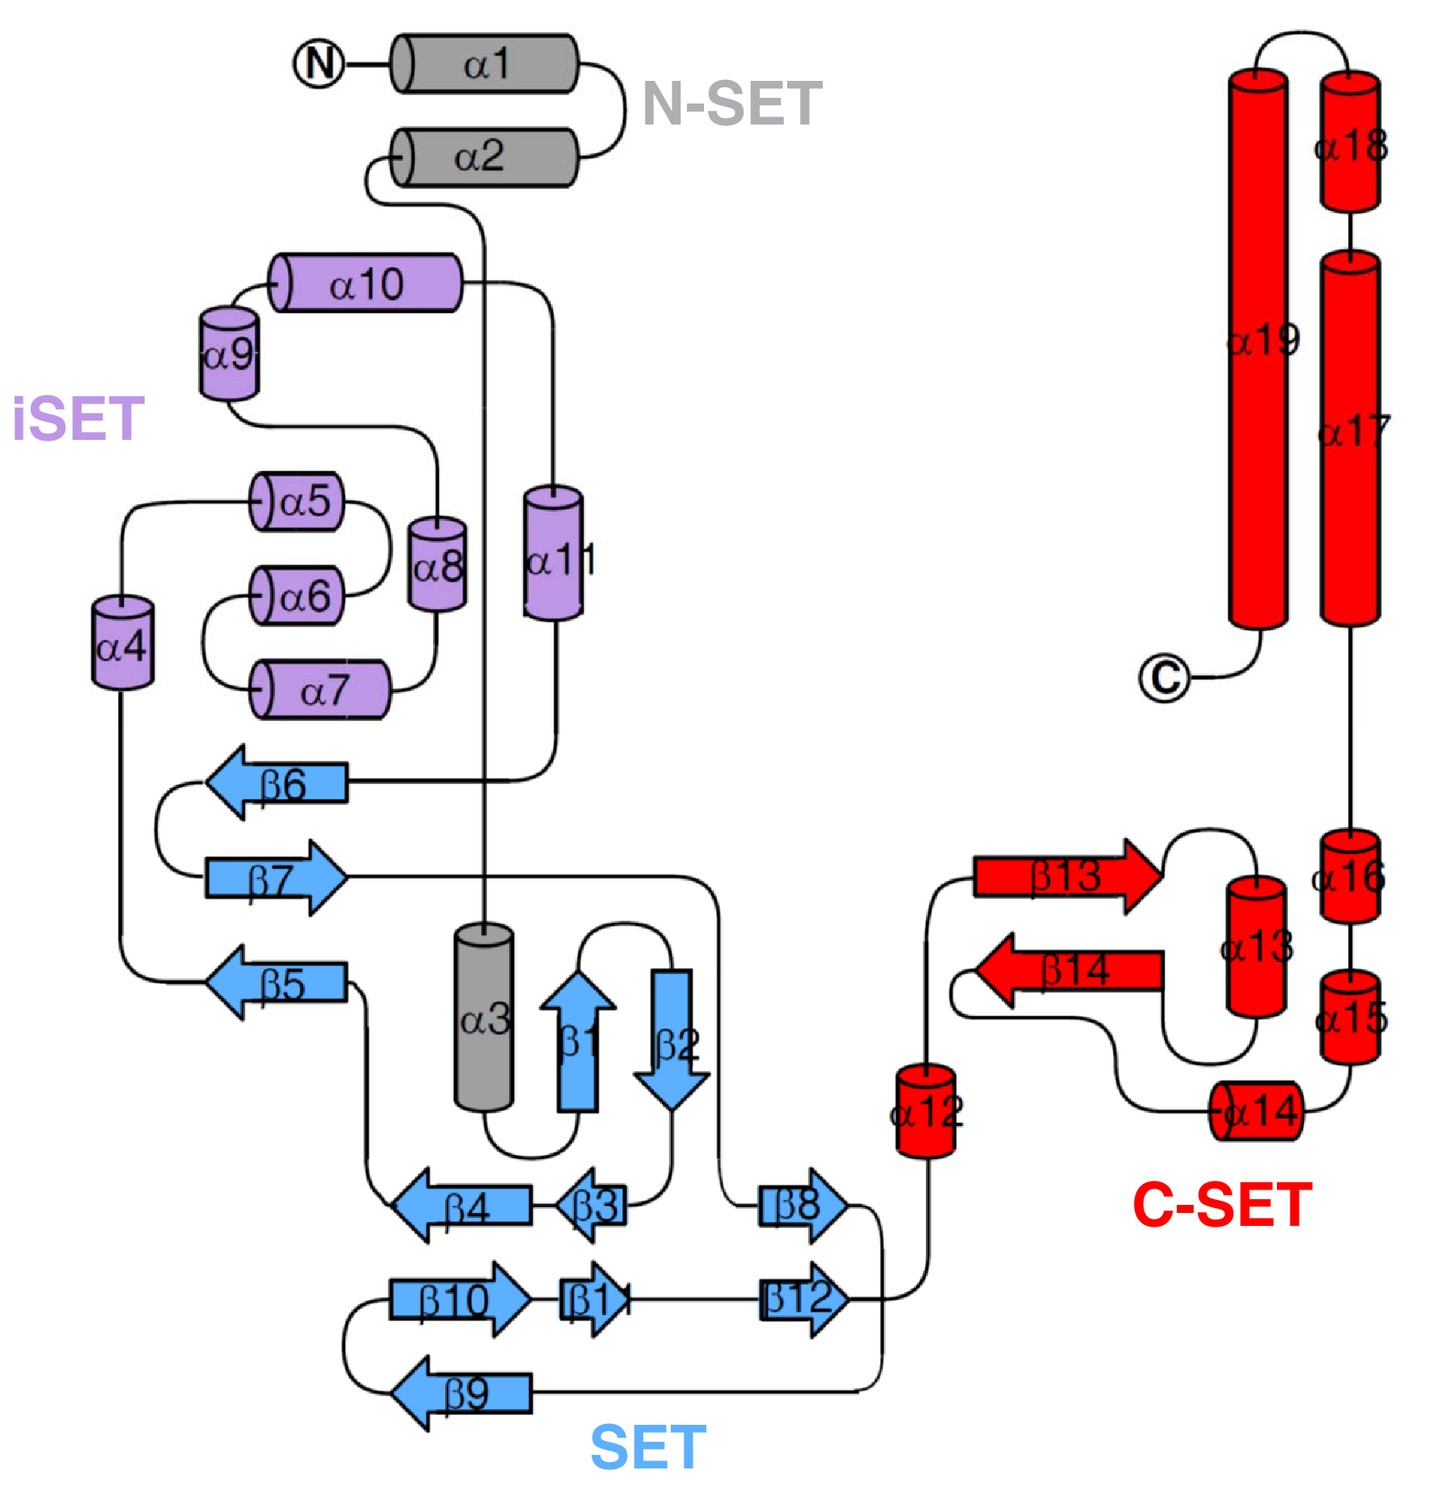
Topology of SETD3 (aa 2–502), with secondary structures marked and colored as in Figure 1—figure supplement 2A.
https://doi.org/10.7554/eLife.43676.005
Figure 1—figure supplement 4
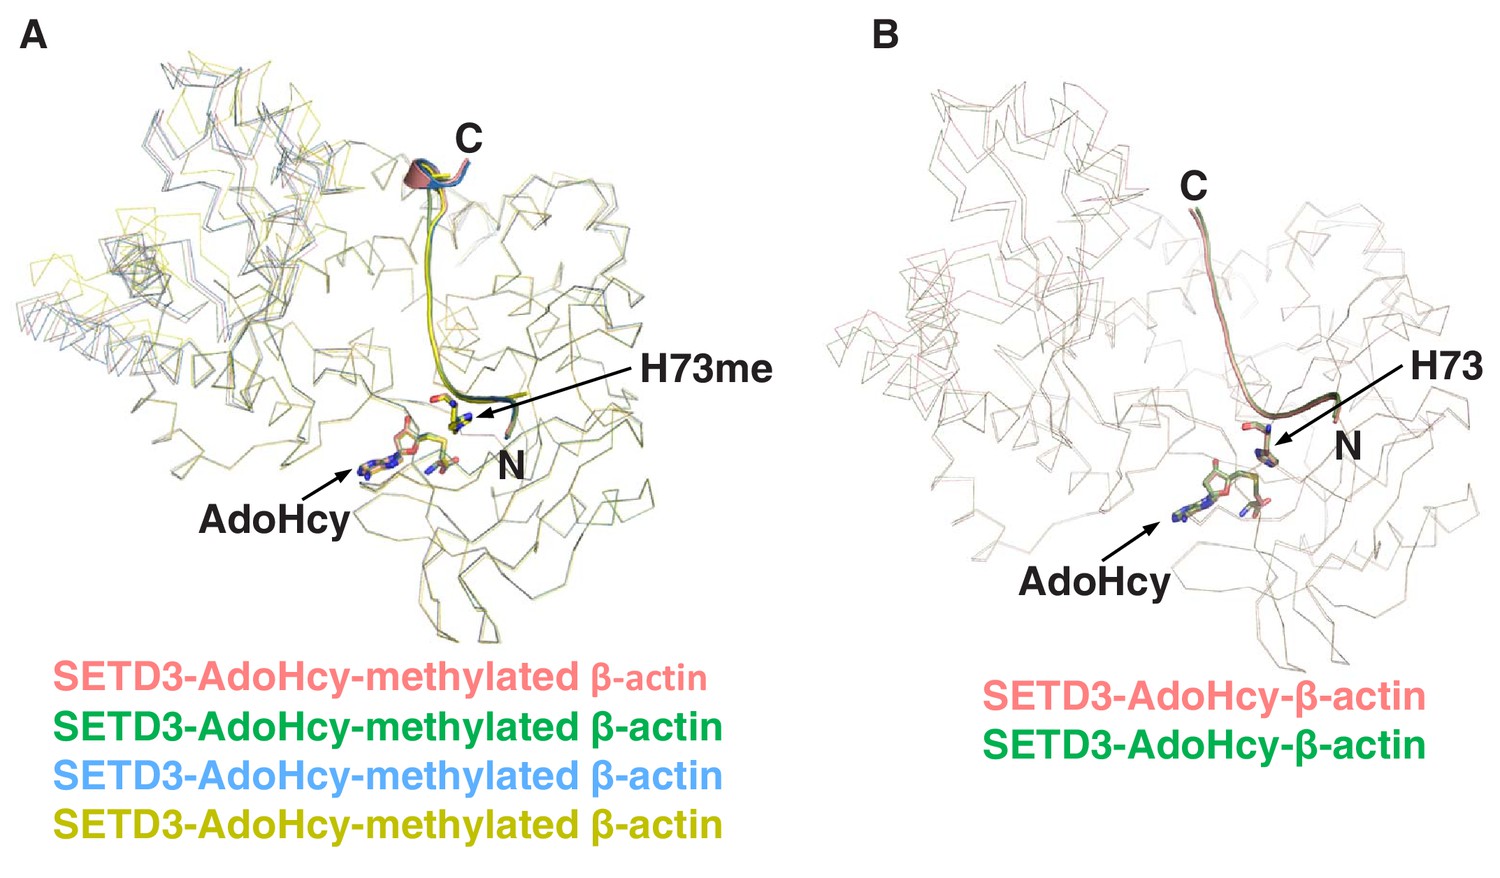
Superposition of SETD3 molecules.
(A) Superposition of four SETD3 molecules bound to methylated β-actin in the same asymmetric unit, with the four molecules shown in red, green, blue and yellow ribbons. His73me of β-actin and AdoHcy are shown in sticks. (B) Superposition of two molecules of SETD3 bound to unmodified β-actin in the same asymmetric unit, with the two molecules shown in red and green ribbons. His73 of β-actin and AdoHcy are shown in sticks.
Figure 1—figure supplement 5
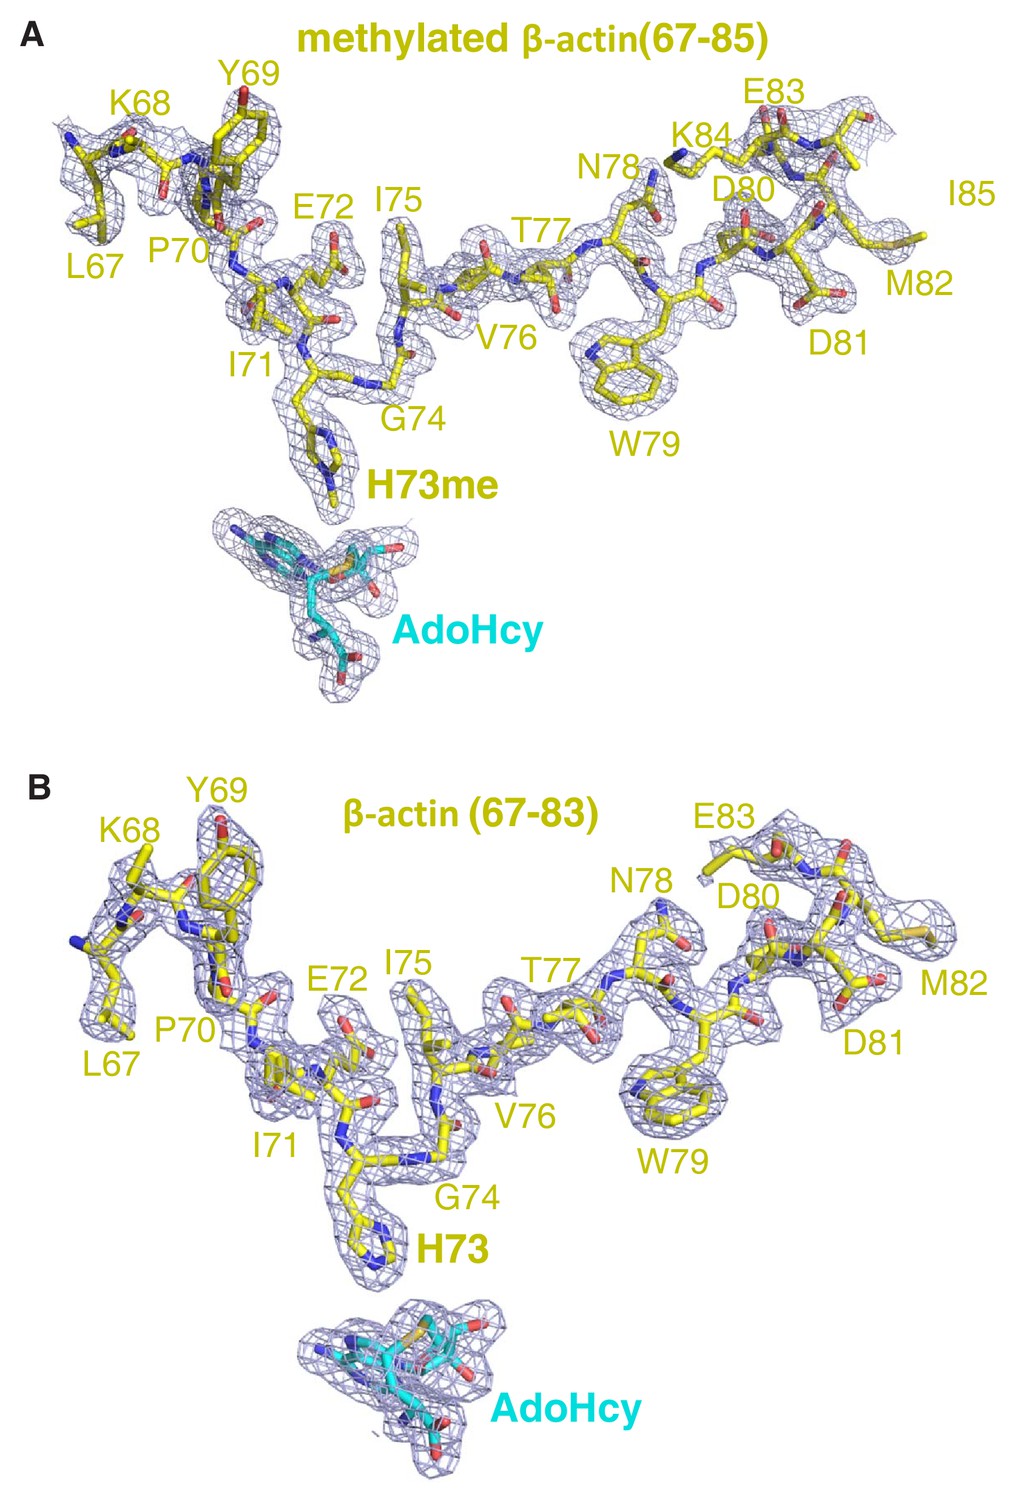
The 2|Fo|–|Fc| σ-weighted maps of peptide and AdoHcy.
The 2|Fo|–|Fc| σ-weighted maps of (A) methylated β-actin peptide and (B) unmodified β-actin peptide in the presence of AdoHcy are contoured at 1.2 σ (blue cage). The peptides are shown in yellow sticks.
Figure 1—figure supplement 6
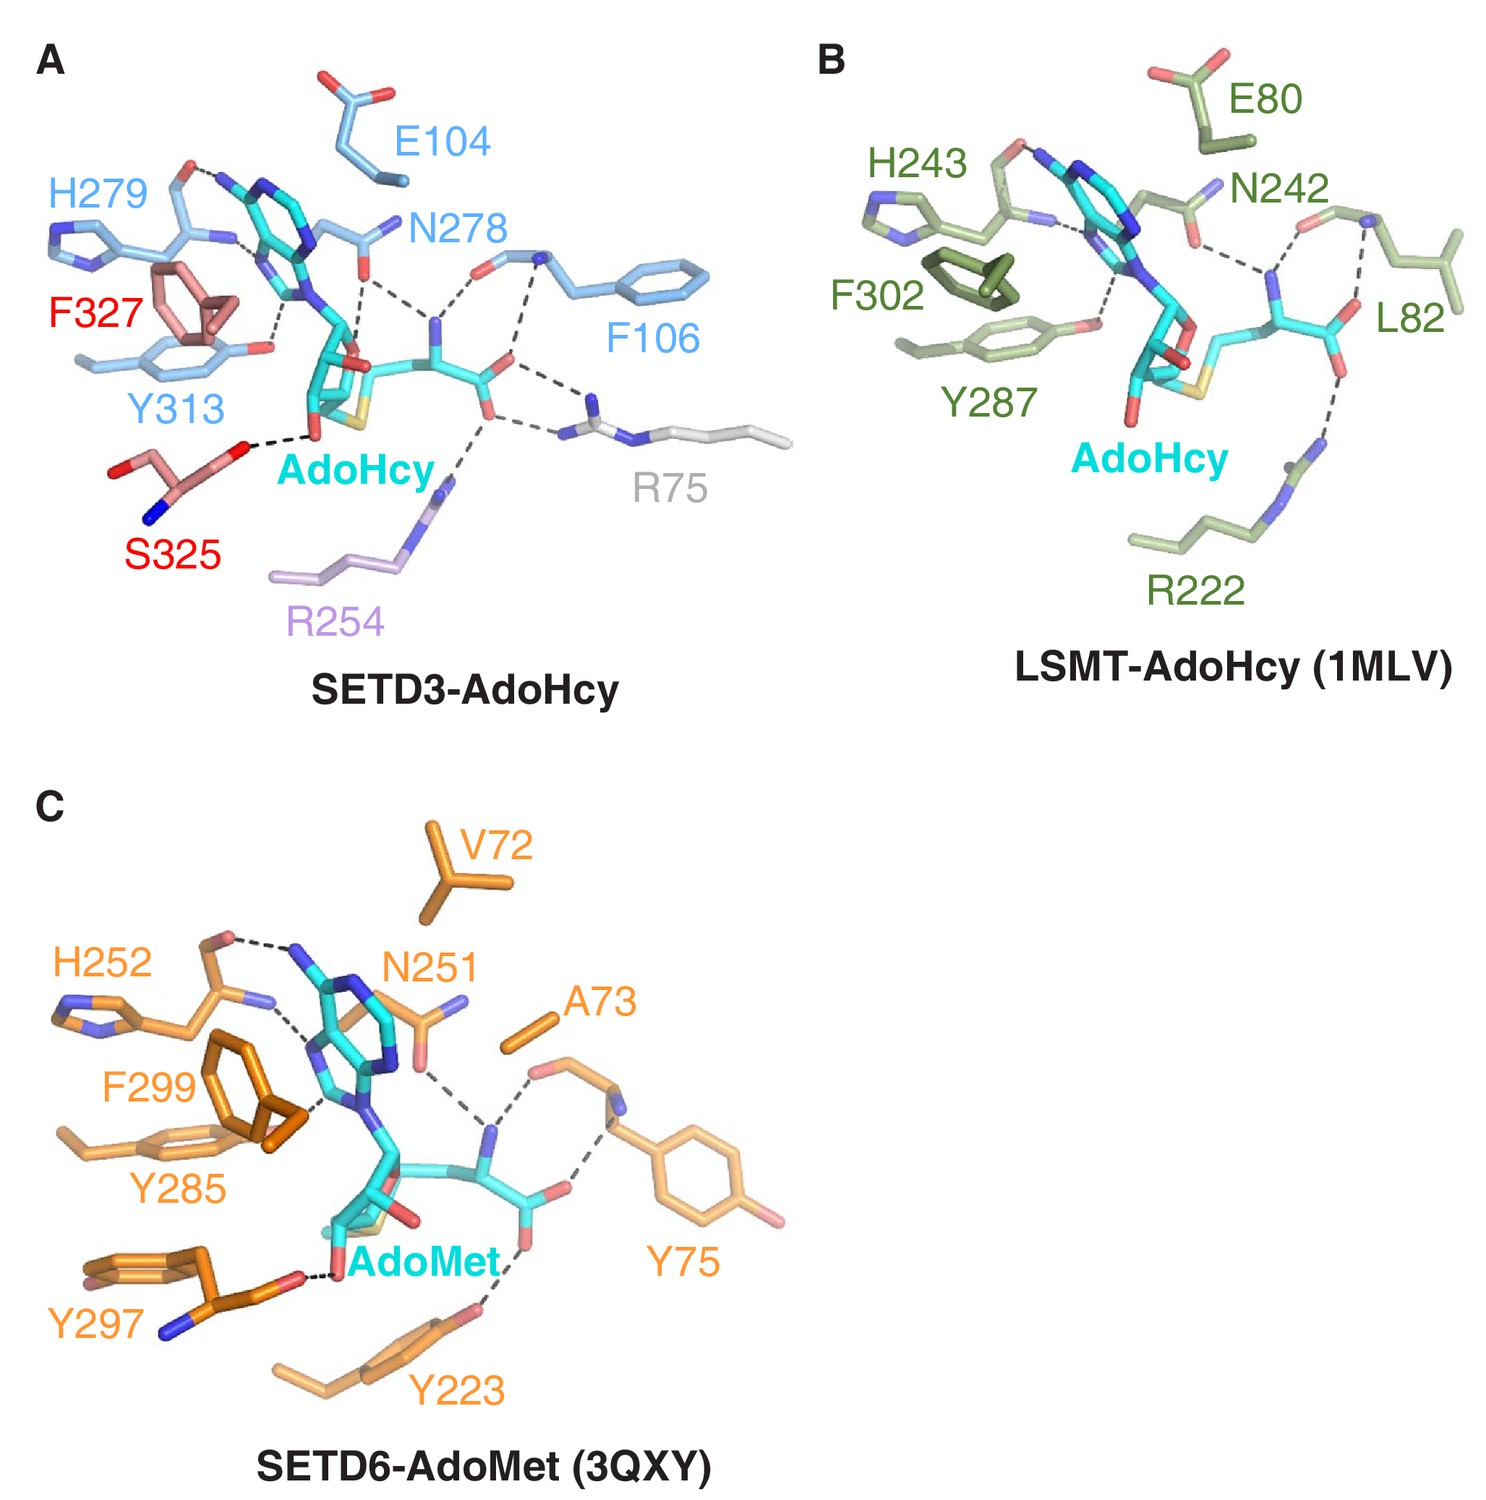
Comparison of AdoHcy's mode of binding to SETD3, LSMT or SETD6.
(A) A detailed depiction of intermolecular interactions between SETD3 and AdoHcy, with AdoHcy shown in cyan sticks, and the AdoHcy binding residues of SETD3 shown in sticks and colored as in Figure 1A. (B) Detailed interactions between AdoHcy and LSMT (PDB id: 1MLV), with the binding residues of LSMT and AdoHcy shown in green and cyan sticks, respectively. (C) Detailed interactions between AdoMet and SETD6 (PDB id: 3QXY), with the binding residues of SETD6 and AdoMet shown in orange and cyan sticks, respectively. In Figure 2B and C, hydrogen bonds are indicated by black dashes.
Figure 1—figure supplement 7
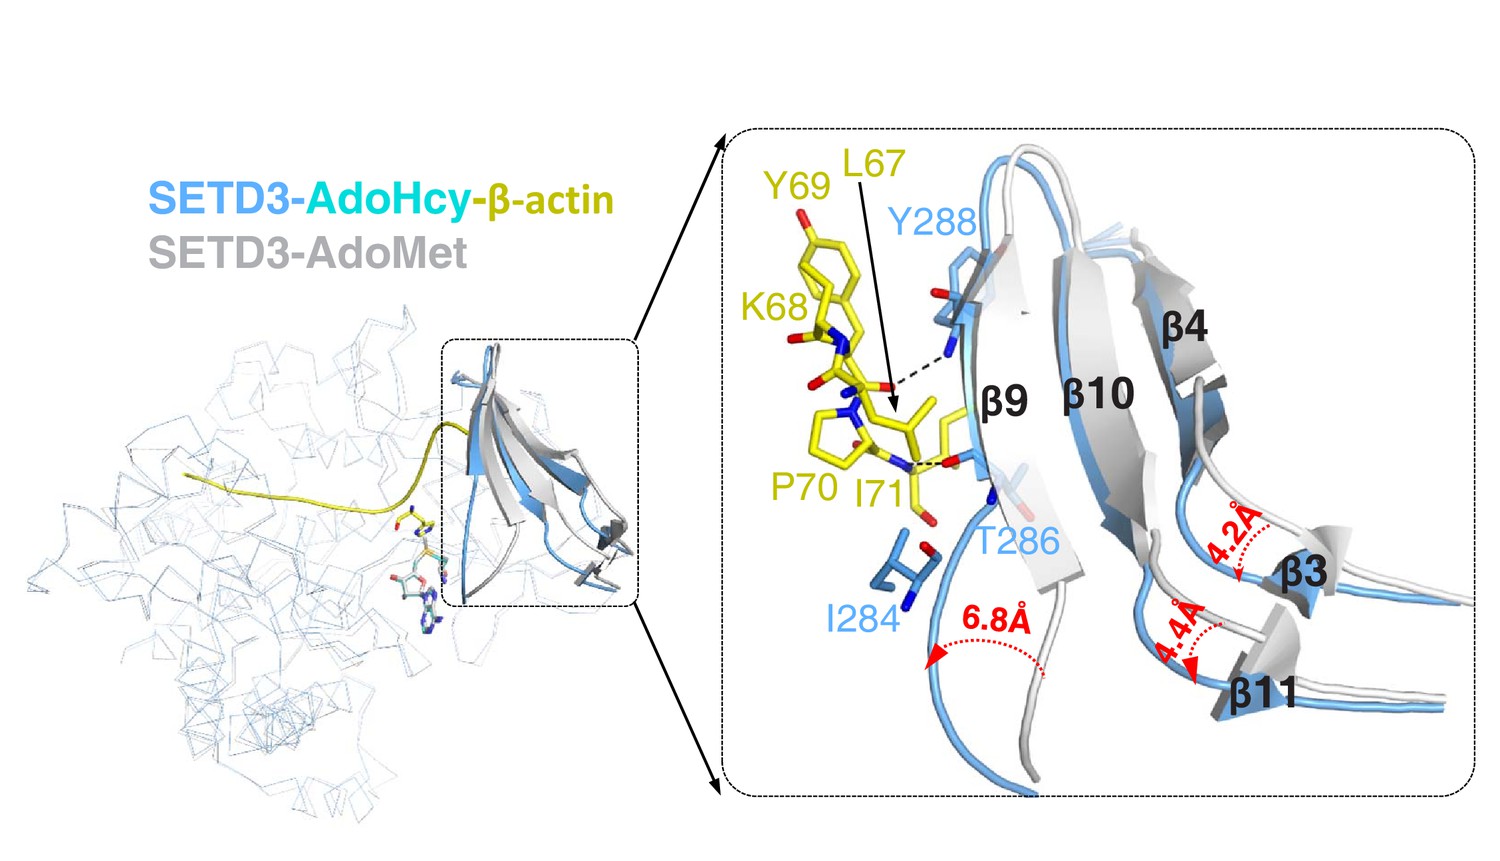
Superposition of AdoMet-bound SETD3 (PDB id: 3SMT) and AdoHcy-bound SETD3-actin.
In the structure of AdoMet-bound SETD3, the protein is shown in a gray ribbon and AdoMet is shown in gray sticks. In the structure of AdeHcy-bound SETD3 in the presence of actin, the SETD3 protein is represented by a blue ribbon and AdoHcy is represented by yellow sticks. β4-β9-β10 and β3-β11 of SETD3 changed their conformations significantly upon binding to actin peptide, as is shown in cartoon representation. Leu67-Ile71 of β-actin and their interacting residues in SETD3 are represented by sticks. Three loops that precede β4, β9 and β11 shift 4.2 Å, 4.4 Å, and 6.8 Å, respectively.
Figure 1—figure supplement 8
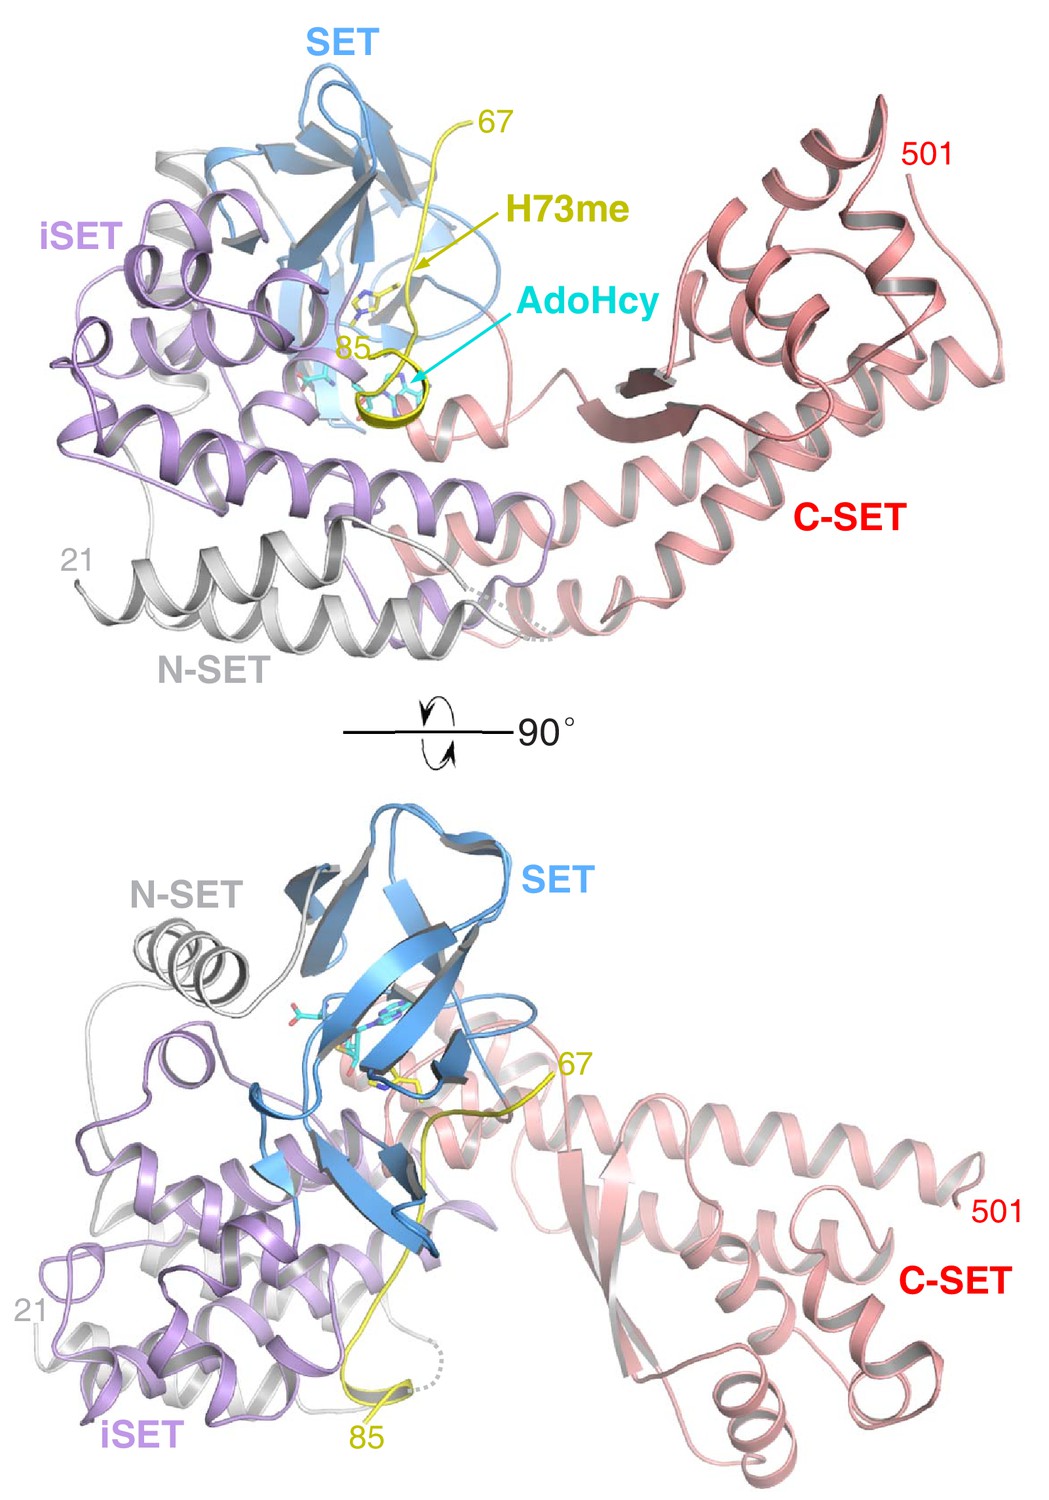
The overall structure of SETD3 with methylated β-actin peptide in the presence of AdoHcy.
SETD3 is colored and labeled as in Figure 1C. AdoHcy and His73me are shown in sticks.
Figure 2 with 3 supplements
Molecular mechanism of substrate recognition and histidine methylation by SETD3.
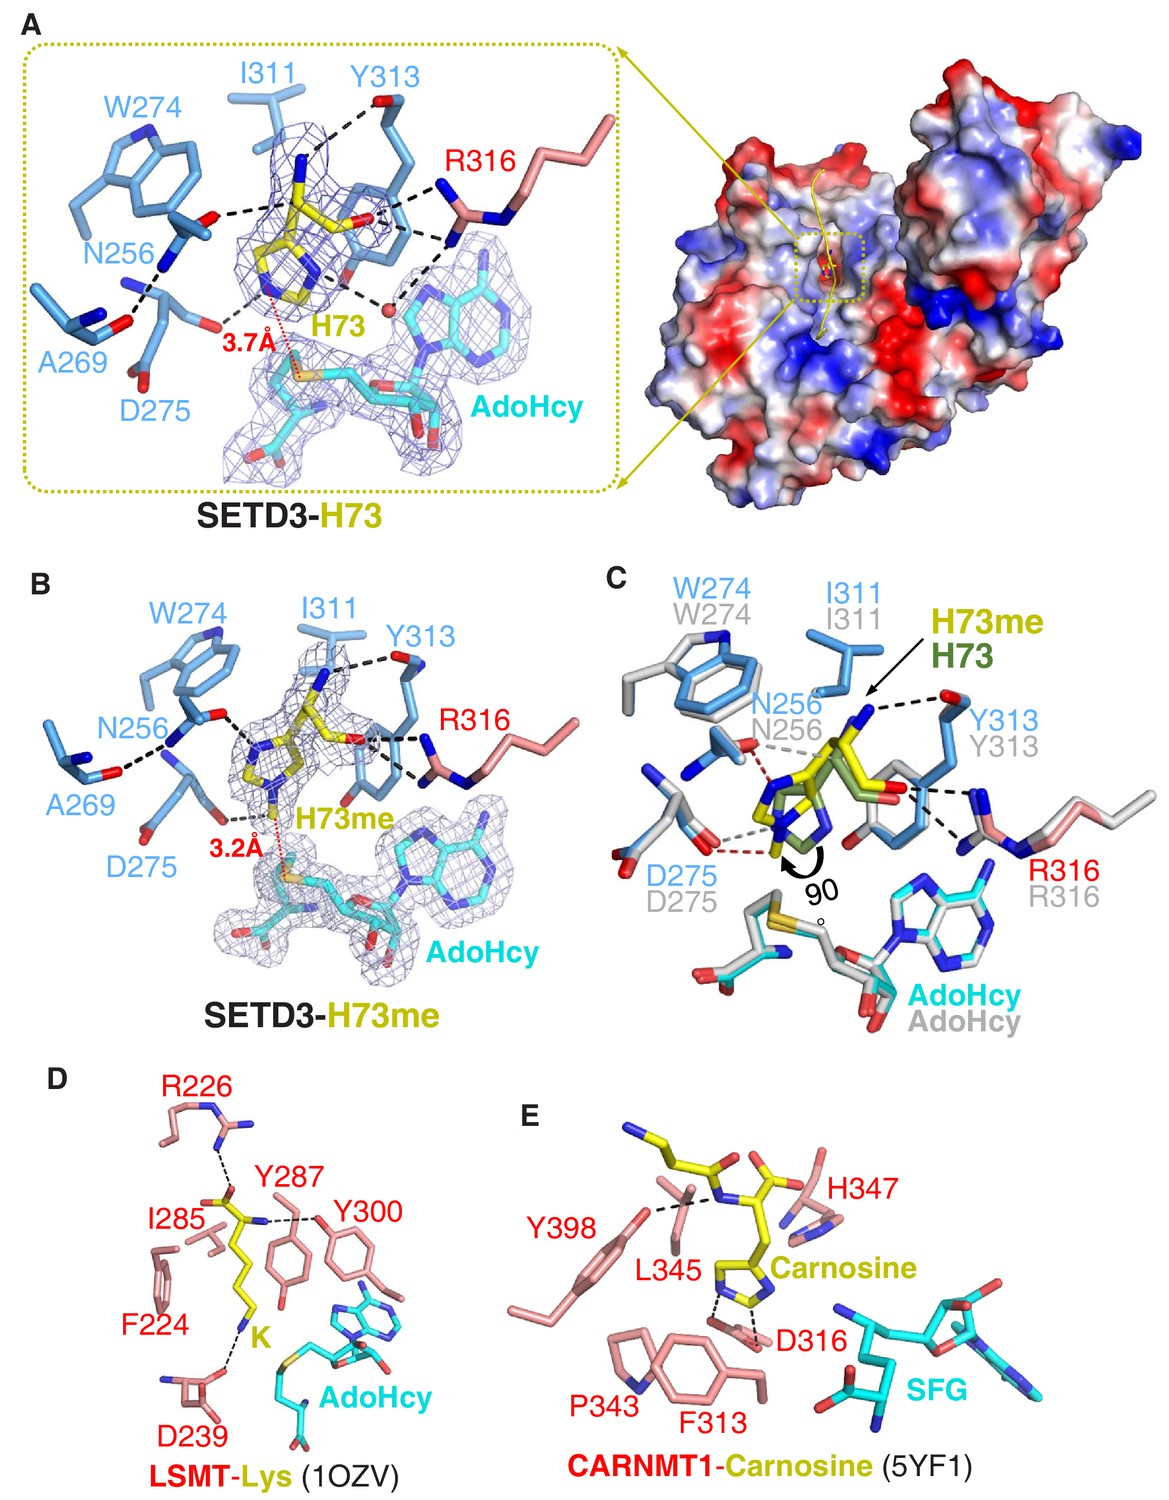
(A) The β-actin peptide binds into a long groove on the surface of the SETD3 N-lobe region (right), with His73 of β-actin positioned into a hydrophobic pocket (left). His73 and AdoHcy are shown in yellow and cyan sticks, respectively, and their 2|Fo|–|Fc| σ-weighted maps are contoured at 1.2 σ. The His73-binding residues of SETD3 and are colored according to on regions in which they reside, as shown in Figure 1A. (B) Detailed interactions between His73me and SETD3 in the post- methyl transfer complex. His73me and AdoHcy are shown in yellow and cyan sticks, respectively, and their 2|Fo|–|Fc| σ-weighted maps are contoured at 1.2 σ. The His73me-binding residues of SETD3 are colored according to the scheme shown in Figure 2A. (C) Superposition of the two complexes on the histidine/methylhistidine binding pocket. For the SETD3–His73me complex, the His73me-binding residues of SETD3 are illustrated as in Figure 2A, with His73me and AdoHcy shown in yellow and cyan sticks, respectively. For the SETD3–His73 complex, the His73-binding residues and AdoHcy are shown in gray sticks, whereas His73 is shown in green sticks to show that it rotates 90 degrees after catalysis. After methylation, one new hydrogen bond is formed between Asn256 and the N1 atom of His73me (red dashed line). (D) Lysine recognition by LSMT(PDB id: 1OZV) in the presence of AdoHcy. (E) Carnosine recognition by CARNMT1 (PDB id: 5YF1) in the presence of the AdoHcy mimics SINEFUNGIN (SFG). Histidine, lysine and carnosine are shown in yellow sticks, whereas the protein residues that are involved in binding are shown in red sticks. AdoHcy and SFG are shown in cyan sticks.
Figure 2—figure supplement 1
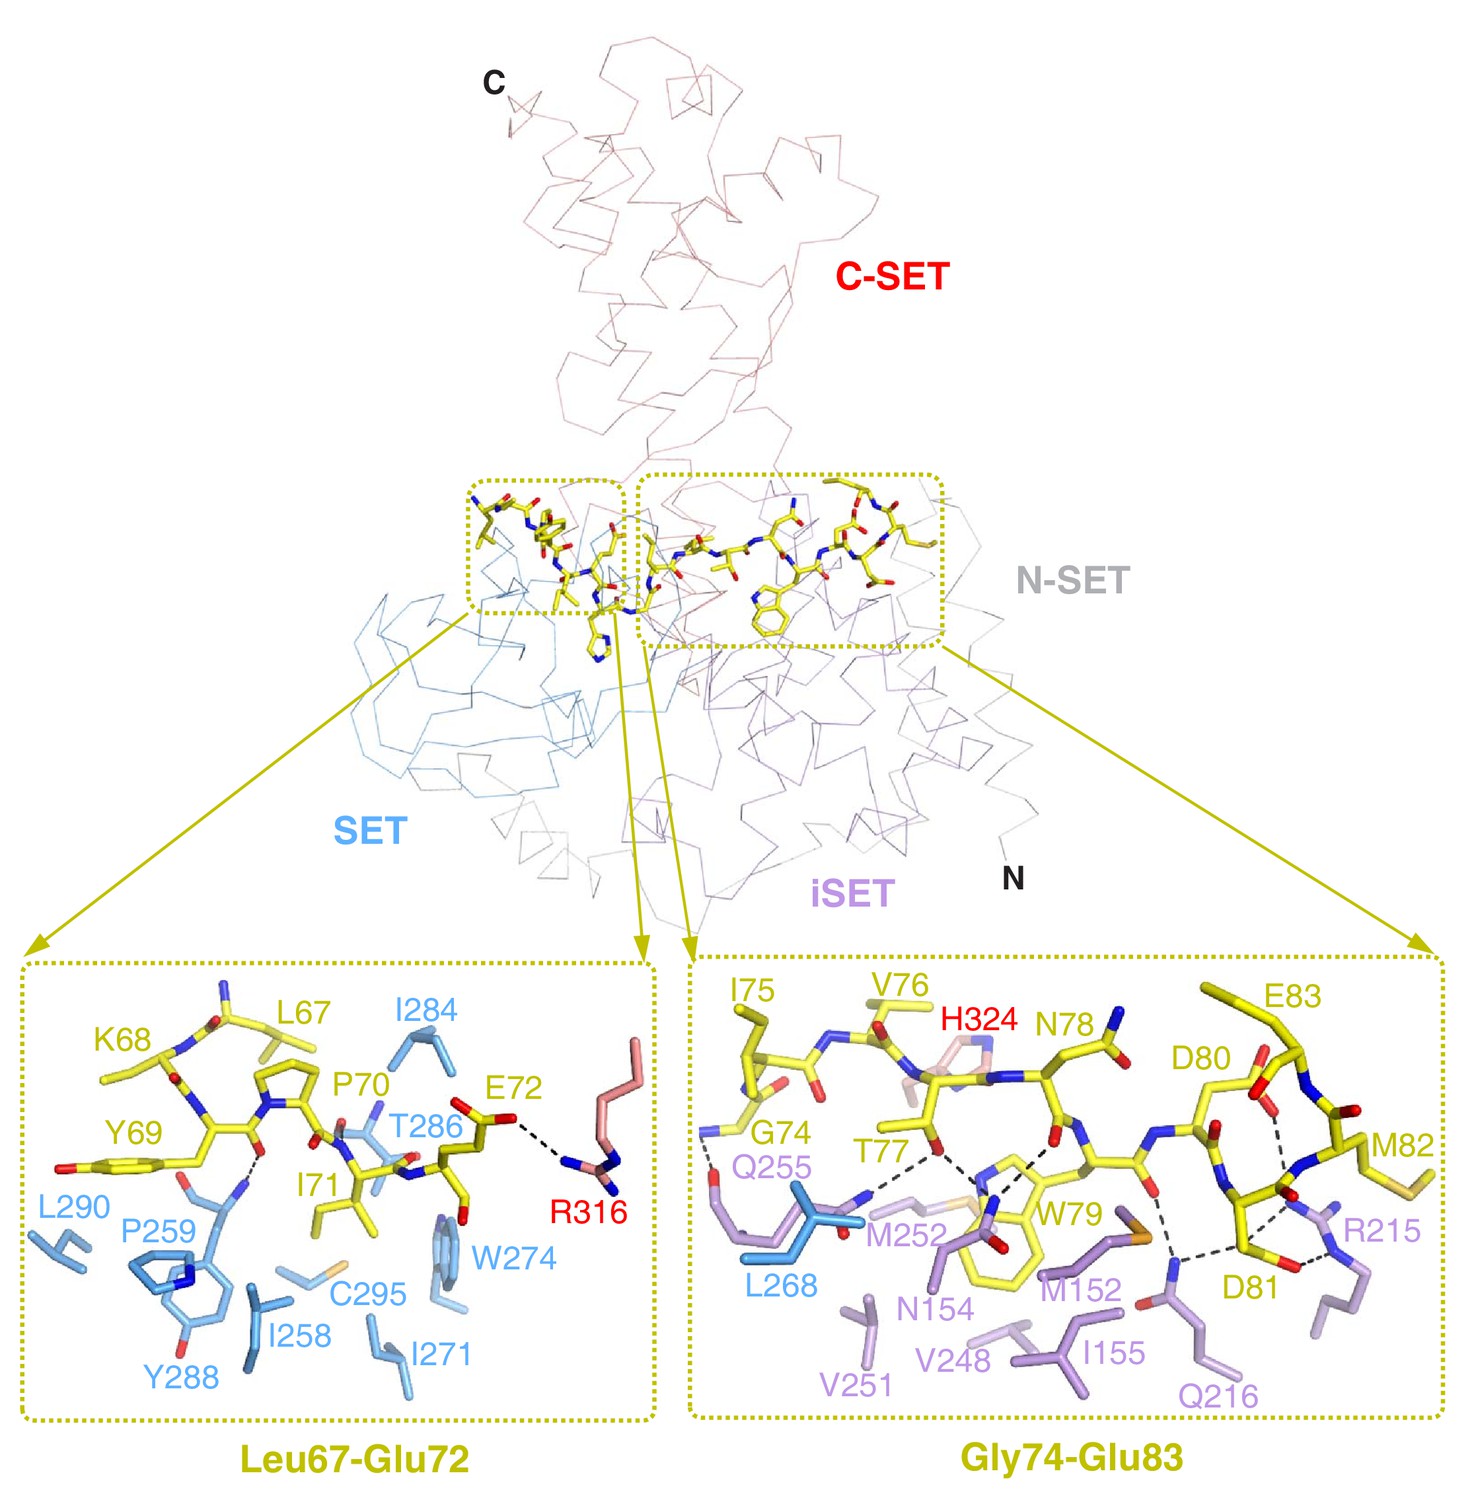
Detailed interactions of SETD3 and β-actin peptide(66–88).
The β-actin peptide mainly contacts with the N-terminal lobe of SETD3, while its N-terminal and C-terminal sides contact the SET and iSET domains, respectively. In the top panel, SETD3 is shown in ribbons and colored as in Figure 2A. β-actin peptide is shown in yellow sticks. Detailed interactions between SETD3 and Leu67-Glu72, and between SETD3 and Gly74 and Glu83, are shown in the bottom left and right panels, respectively. The SETD3 residues that are involved in β-actin-binding are shown in sticks.
Figure 2—figure supplement 2
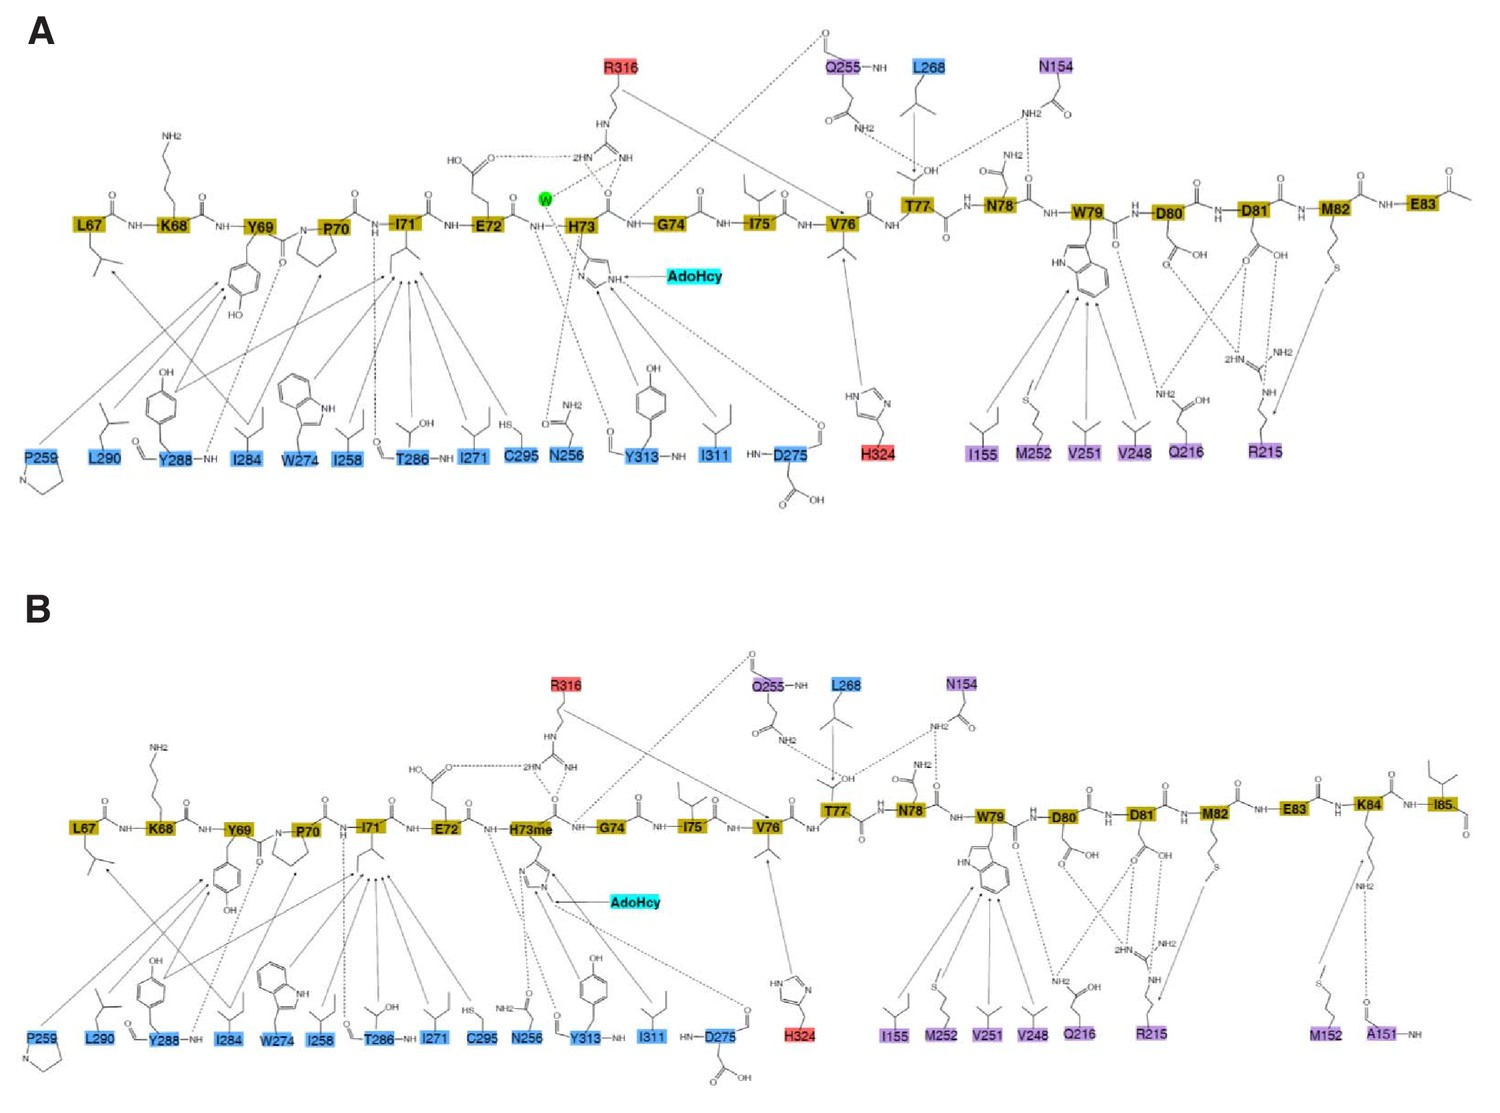
Interactions between SETD3 and peptide.
Schematic of the detailed interactions (A) between SETD3 and unmodified β-actin and (B) between SETD3 and methylated β-actin. SETD3 residues are colored as in Figure 1A, while the peptide residues are colored in yellow. The hydrophobic interactions and hydrogen bonds between the proteins and peptides are shown in black solid arrows and black dashed arrows, respectively.
Figure 2—figure supplement 3
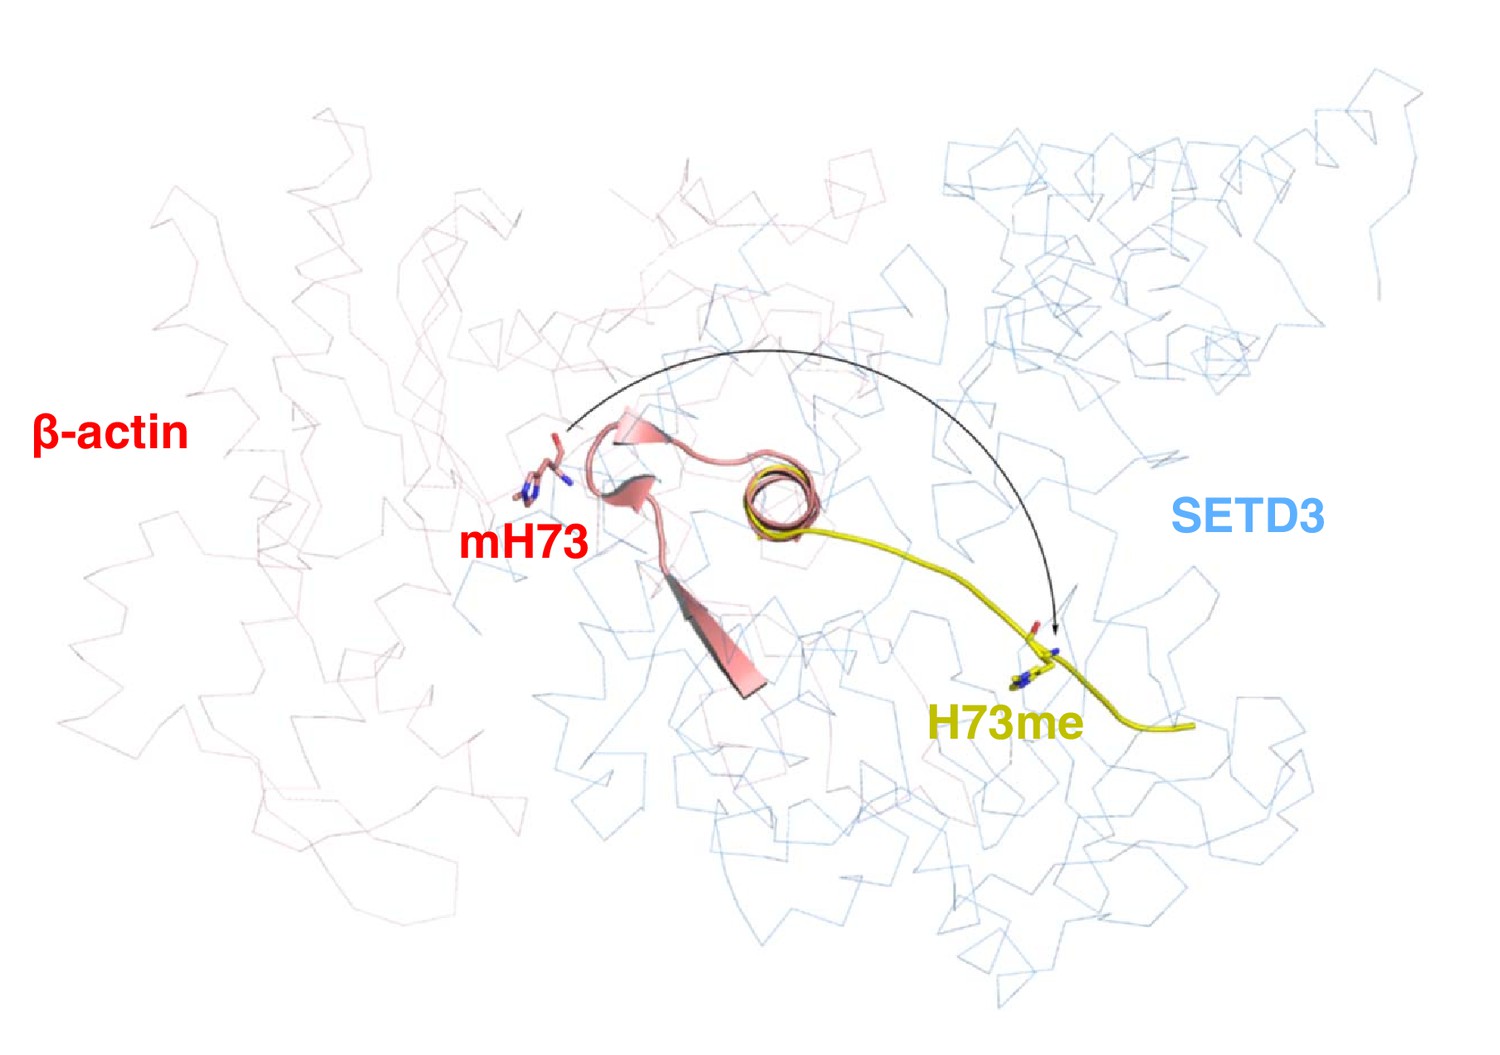
Actin undergoes conformational changes upon binding to SETD3.
β-actin peptide(66–88) (yellow cartoon) is overlaid with the same fragment in the structure of native β-actin (red cartoon) (PDB id: 1HLU). Native β-actin decomposes its local secondary structures upon SETD3 binding. Native β-actin and SETD3 are shown in red and blue ribbons, respectively.
Figure 3
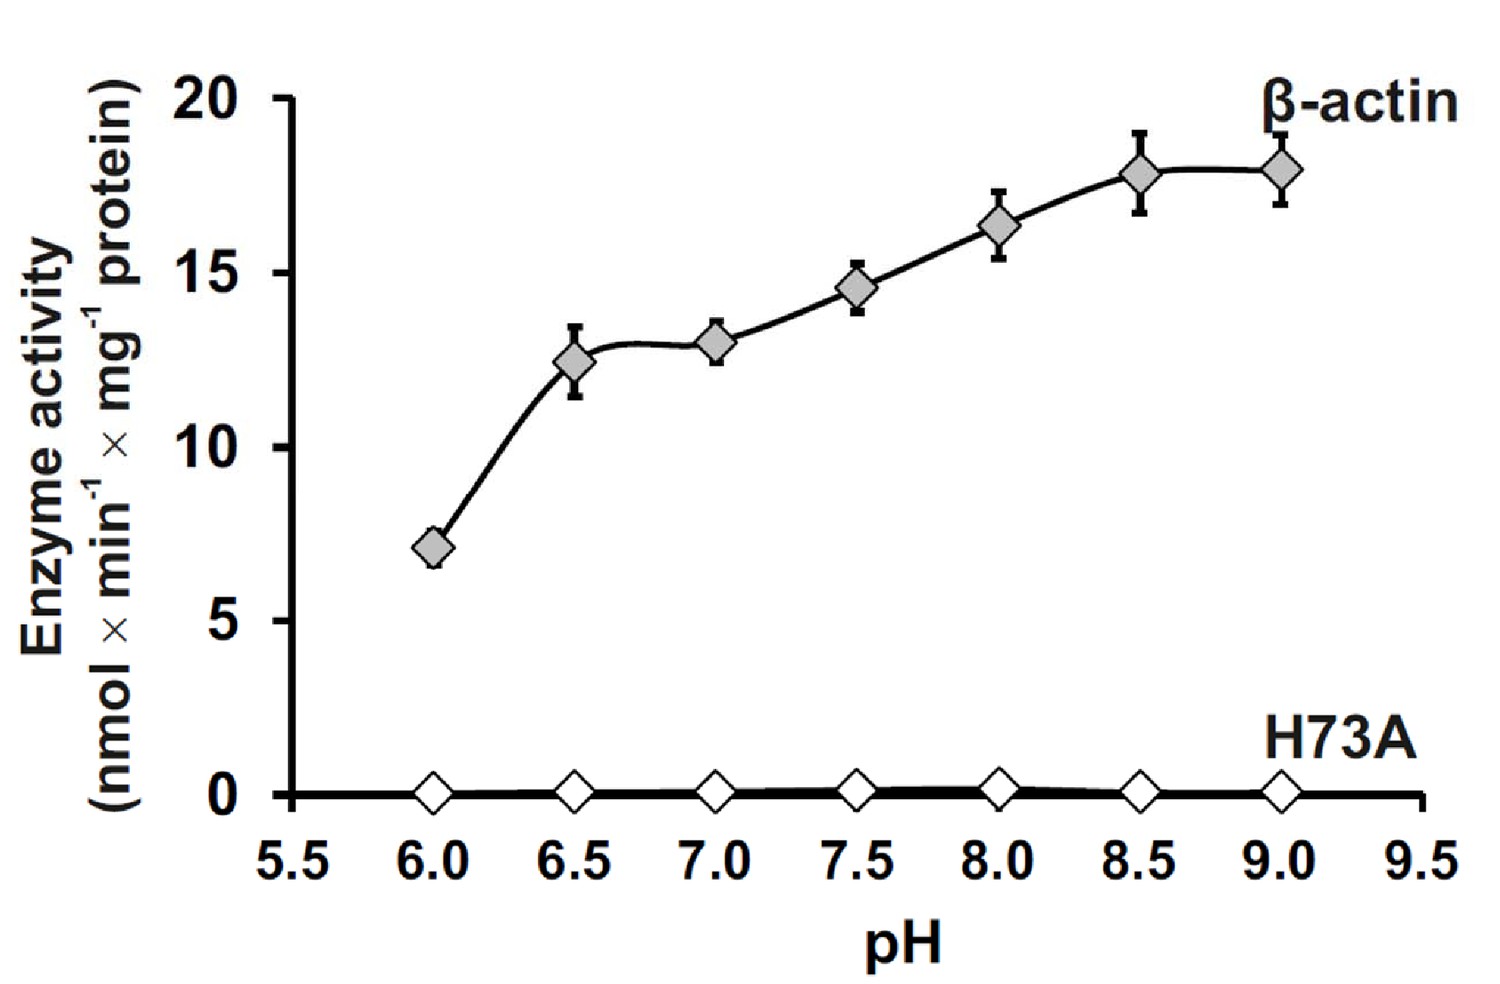
Effect of pH on SETD3 enzyme activity.
The pH-dependence of human SETD3 was determined with the use of a purified recombinant N-terminal His6-tagged SETD3 protein (aa 2–502). The enzyme preparation (0.045 µg protein) was incubated at 37°C for 10 min in the presence of 0.8 μM [1H+3H] AdoMet (80 pmol, ≈350 × 103 cpm) and either 5 µM (500 pmol, 22.34 µg) purified recombinant human β-actin or its mutated form (H73A), with the latter serving as a negative control. In all experiments, the reaction mixture contained the homogenous recombinant AdoHcy nucleosidase (1.6 mg protein, 600 nM, E. coli) and adenine deaminase (3.9 mg protein, 600 nM, B. subtilis) to prevent AdoHcy accumulation. The reaction was stopped and the proteins present in the assay mixture were precipitated by adding 10% trichloroacetic acid. This allowed for the separation and specific measurement of the radioactivity incorporated in the protein pellet (representing the extent of actin methylation) from the total radioactivity present in the assay mixture. Values are the means ± S.E. (error bars) of three separate experiments. If no error bar is visible, it is shorter than the height of the symbol.
-
Figure 3—source data 1
Radiochemical measurements of SETD3-dependent methylation of either human recombinant β-actin or its mutated form (H73A) in the presence of increasing pH values of the reaction mixture.
- https://doi.org/10.7554/eLife.43676.021
Tables
Table 1
Binding affinities of SETD3 proteins to β-actin peptides.
https://doi.org/10.7554/eLife.43676.011| β-actin peptide | SETD3 (aa 2–502) | Stoichiometric coefficient (N) | Kd (µM) |
|---|---|---|---|
| 66TLKYPIEHGIVTNWDDMEKIWHH88 | Wildtype | 1.0 | 0.17 ± 0.04 |
| 66TLKYPIEAGIVTNWDDMEKIWHH88 (H73A) | Wildtype | 1.3 | 0.45 ± 0.08 |
| 1ARTKQTARKSTGGKAPRKQLATK23 (H3K4) | Wildtype | *N/A | *NB |
| 25ARKSAPATGGVKKPHRYRPGTVA47 (H3K36) | Wildtype | N/A | NB |
| 66TLKYPIEHGIVTNWDDMEKIWHH88 | R215A | 1.2 | 3.6 ± 1.0 |
| 66TLKYPIEHGIVTNWDDMEKIWHH88 | N256A | 0.94 | 2.1 ± 0.4 |
| 66TLKYPIEHGIVTNWDDMEKIWHH88 | N256D | 1.3 | 23 ± 7 |
| 66TLKYPIEHGIVTNWDDMEKIWHH88 | N256Q | 1.1 | 2.5 ± 0.5 |
| 66TLKYPIEHGIVTNWDDMEKIWHH88 | W274A | 0.94 | 0.51 ± 0.10 |
| 66TLKYPIEHGIVTNWDDMEKIWHH88 | Y313F | 0.86 | 3.0 ± 0.1 |
| 66TLKYPIEHGIVTNWDDMEKIWHH88 | R316A | 1.1 | 7.4 ± 0.9 |
| 66TLKAPIEHGIVTNWDDMEKIWHH88 (Y69A) | Wildtype | 1.4 | 3.8 ± 0.8 |
| 66TLKYPAEHGIVTNWDDMEKIWHH88 (I71A) | Wildtype | 1.3 | 16 ± 3 |
| 66TLKYPIEHGIVTNWADMEKIWHH88 (D80A) | Wildtype | 1.3 | 3.5 ± 0.4 |
| 66TLKYPIEHGIVTNWDAMEKIWHH88 (D81A) | Wildtype | 1.3 | 2.0 ± 0.5 |
| 66TLKYPIEHGIVTNWDDAEKIWHH88 (M82A) | Wildtype | 1.2 | 0.89 ± 0.08 |
| 66TLKYPIEHGIVTNWD80 | Wildtype | 1.0 | 2.9 ± 0.7 |
-
*N/A: Not applicable. *NB: no binding affinity detectable by ITC.
Dissociation constants (Kds) were derived from a minimum of two experiments (mean ± S.D.). The original binding curves are shown in Supplementary file 1.
Table 2
Data collection and refinement statistics.
https://doi.org/10.7554/eLife.43676.012| SETD3–β-actin | SETD3-methylated β-actin | |
|---|---|---|
| Protein Data Bank ID | 6ICV | 6ICT |
| Data collection | ||
| Radiation wavelength (Å) | 0.9789 | 0.9792 |
| Space group | P 1 21 1 | P 1 21 1 |
| Cell dimensions | ||
| a, b, c (Å) | 60.19, 175.17, 66.50 | 59.98, 176.69, 125.89 |
| α, β, γ (°) | 90, 92.57, 90 | 90, 93.37, 90 |
| Resolution (Å) | 35.00–2.15 (2.23–2.15) | 72.27–1.95 (2.06–1.95) |
| Rmerge | 0.135 (0.609) | 0.169 (0.868) |
| I / σI | 14 (3.4) | 8.1 (2.6) |
| CC1/2 | 0.988 (0.884) | 0.991 (0.827) |
| Completeness (%) | 100(100) | 99.1 (99.7) |
| Redundancy | 6.4 (6.4) | 7.0 (7.0) |
| Refinement | ||
| Resolution (Å) | 35.00–2.15 | 59.87–1.95 |
| No. of reflections (used/free) | 71998/3629 | 187163/9084 |
| Rwork/Rfree | 0.168/0.205 | 0.178/0.214 |
| Number of atoms/B-factor (Å2) | 8493/30.7 | 16956/33.7 |
| Protein | 7574/30.3 | 15147/33.1 |
| Peptide | 276/32.9 | 591/38.4 |
| AdoHcy | 52/19.3 | 104/20.0 |
| Solvent | 591/36.2 | 1114/40.0 |
| RMSD bonds (Å)/angles (°) | 0.007/0.84 | 0.007/0.87 |
| Ramachandran Plot favored/allowed/outliers (%) | 98.76/1.24/0 | 98.98/1.02/0 |
-
Values in parentheses are for the highest-resolution shell.
Table 3
Kinetic properties of wildtype SETD3 and its mutants.
Kinetic parameters were determined by using purified recombinant N-terminal His6-tagged SETD3 proteins.
| SETD3 | Substrate | Kinetic parameters | |||
|---|---|---|---|---|---|
| Vmax | KM | kcat | kcat/KM | ||
| nmol min−1 mg−1 | µM | min−1 | min−1 µM−1 | ||
| Wildtype | β-actin | 13.550 ± 0.364 | 0.502 ± 0.041 | 0.809 | 1.612 |
| R75A | 0.037 ± 0.002 | 0.565 ± 0.071 | 0.002 | 0.004 | |
| R215A | 3.553 ± 0.068 | 1.087 ± 0.056 | 0.212 | 0.195 | |
| N256A | 0.512 ± 0.019 | 0.449 ± 0.053 | 0.031 | 0.069 | |
| N256D | 0.973 ± 0.017 | 0.305 ± 0.0196 | 0.058 | 0.190 | |
| N256Q | 10.860 ± 0.172 | 0.784 ± 0.035 | 0.649 | 0.828 | |
| N278A | 0.019 ± 0.000 | 0.047 ± 0.009 | 0.001 | 0.021 | |
| Y313F | 0.367 ± 0.005 | 0.581 ± 0.023 | 0.022 | 0.038 | |
| R316A | 2.903 ± 0.0477 | 1.115 ± 0.049 | 0.173 | 0.155 | |
| Wildtype | AdoMet | 11.260 ± 0.466 | 0.111 ± 0.020 | 0.673 | 6.063 |
| R75A | 0.265 ± 0.072 | 3.601 ± 1.363 | 0.016 | 0.004 | |
| R215A | 3.666 ± 0.078 | 0.165 ± 0.013 | 0.219 | 1.327 | |
| N256A | 1.136 ± 0.038 | 0.686 ± 0.052 | 0.068 | 0.099 | |
| N256D | 0.671 ± 0.021 | 0.165 ± 0.019 | 0.040 | 0.242 | |
| N256Q | 6.368 ± 0.266 | 0.103 ± 0.019 | 0.380 | 3.689 | |
| N278A | 0.018 ± 0.001 | 0.350 ± 0.042 | 0.001 | 0.003 | |
| Y313F | 1.623 ± 0.348 | 6.543 ± 1.736 | 0.097 | 0.015 | |
| R316A | 4.099 ± 0.054 | 0.149 ± 0.008 | 0.244 | 1.638 |
-
Determinations for S-adenosyl-L-methionine (AdoMet) were performed with the SETD3 preparations (0.05–5.00 µg protein, 8.38–838 nM), which were incubated for 10 min at 37°C in a reaction mixture containing 5 µM recombinant human β-actin and variable concentrations of [1H+3H] AdoMet (≈330 × 103 cpm). The measurements for β-actin were done following a 10 min incubation of SETD3 in the presence of a 0.8 μM concentration of [1H+3H] AdoMet (80 pmol, 300–700 × 103 cpm). In all experiments, the reaction mixture contained the homogenous recombinant AdoHcy nucleosidase (1.6 µg protein, 600 nM, E. coli) and adenine deaminase (3.9 µg protein, 600 nM, B. subtilis) to prevent S-adenosyl-L-homocysteine (AdoHcy) accumulation. Values are the means of three separate experiments. The S.E. values are also given.
-
Table 3—source data 1
Determination of the kinetic parameters of SETD3-catalyzed methylation of actin (for β-actin as the substrate).
- https://doi.org/10.7554/eLife.43676.018
-
Table 3—source data 2
Determination of kinetic parameters of SETD3-catalyzed methylation of actin (for AdoMet as the substrate).
- https://doi.org/10.7554/eLife.43676.019
Key resources table
| Reagent type (species) or resource | Designation | Source or reference | Identifiers | Additional information |
|---|---|---|---|---|
| ene (E. coli) | AdoHcy nucleosidase | NA | NCBI: NC_000913.3 | |
| Gene (B. subtilis) | adenine deaminase | NA | NCBI: NC_000964.3 | |
| Gene (Homo sapiens) | β-actin | NA | GenBank: NM_001101.4 | |
| Gene (H. sapiens) | SETD3 | NA | NCBI: NM_032233.2 | |
| Recombinant DNA reagent | pCOLD I (plasmid) | Takara Bio | 3361 | |
| Genetic reagent (E. coli) | pCOLD I/β-actin | PMID: 20851184 | Kind gift from M. Tamura, Ehime University | |
| Genetic reagent (E. coli) | pCOLD I/AdoHcy nucleosidase | PMID: 30526847 | Overexpression of the recombinant E. coli AdoHcy nucleosidase in E. coli BL21 (DE3) | |
| Genetic reagent (E. coli) | pCOLD I/adenine deaminase | PMID: 30526847 | Overexpression of the recombinant B. subtilis adenine deaminase in E. coli BL21 (DE3) | |
| Strain, strain background (B. subtilis) | B. subtilis | Sigma-Aldrich | ATCC:6633 | |
| Strain, strain background (E. coli) | E. coli BL21 (DE3) | Agilent Technologies | 200131 | |
| Chemical compound, drug | S-[methyl-3H]adenosyl-L-methionine; [3H]SAM | PerkinElmer | NET155V250UC; NET155V001MC | |
| Software, algorithm | GraphPad Prism | GraphPad Software | RRID:SCR_002798 | |
| pET28-MHL | Vector | Addgene | 26096 (Genbank accession number: EF456735) | Expression of SETD3 and its mutants |
| Origin 6.1, Origin 7.0 | Software | OriginLab | http://www.originlab.com/ | For ITC curve fitting and calculation of Kd values |
| HKL2000 | Software | PMID: 27754618 | http://www.hkl-xray.com/ | Processing the crystal structure data |
| Phaser | Software | PMID: 19461840 | http://www.phaser.cimr.cam.ac.uk/ | Molecular replacement |
| Phenix | Software | PMID: 20124702 | http://www.phenix-online.org/ | Structure refinement |
| Coot | Software | PMID: 15572765 | http://www2.mrc-lmb.cam.ac.uk/Personal/pemsley/coot/ | Structure refinement |
| Pymol | Software | DeLano Scientific LLC | http://www.pymol.org/ | Making structure figures |
| Molprobity | Software | PMID: 20057044 | http://molprobity.biochem.duke.edu/ | Structure validation |
Additional files
-
Supplementary file 1
ITC binding curves for the binding measurements reported in Table 1.
- https://doi.org/10.7554/eLife.43676.022
-
Transparent reporting form
- https://doi.org/10.7554/eLife.43676.023
Download links
A two-part list of links to download the article, or parts of the article, in various formats.
Downloads (link to download the article as PDF)
Open citations (links to open the citations from this article in various online reference manager services)
Cite this article (links to download the citations from this article in formats compatible with various reference manager tools)
Structural insights into SETD3-mediated histidine methylation on β-actin
eLife 8:e43676.
https://doi.org/10.7554/eLife.43676


