Agrin-Lrp4-Ror2 signaling regulates adult hippocampal neurogenesis in mice
- Case Western Reserve University, United States
- Augusta University, United States
- Harvard Medical School, United States
- Louis Stokes Cleveland Veterans Affairs Medical Center, United States
Figures
Figure 1 with 1 supplement
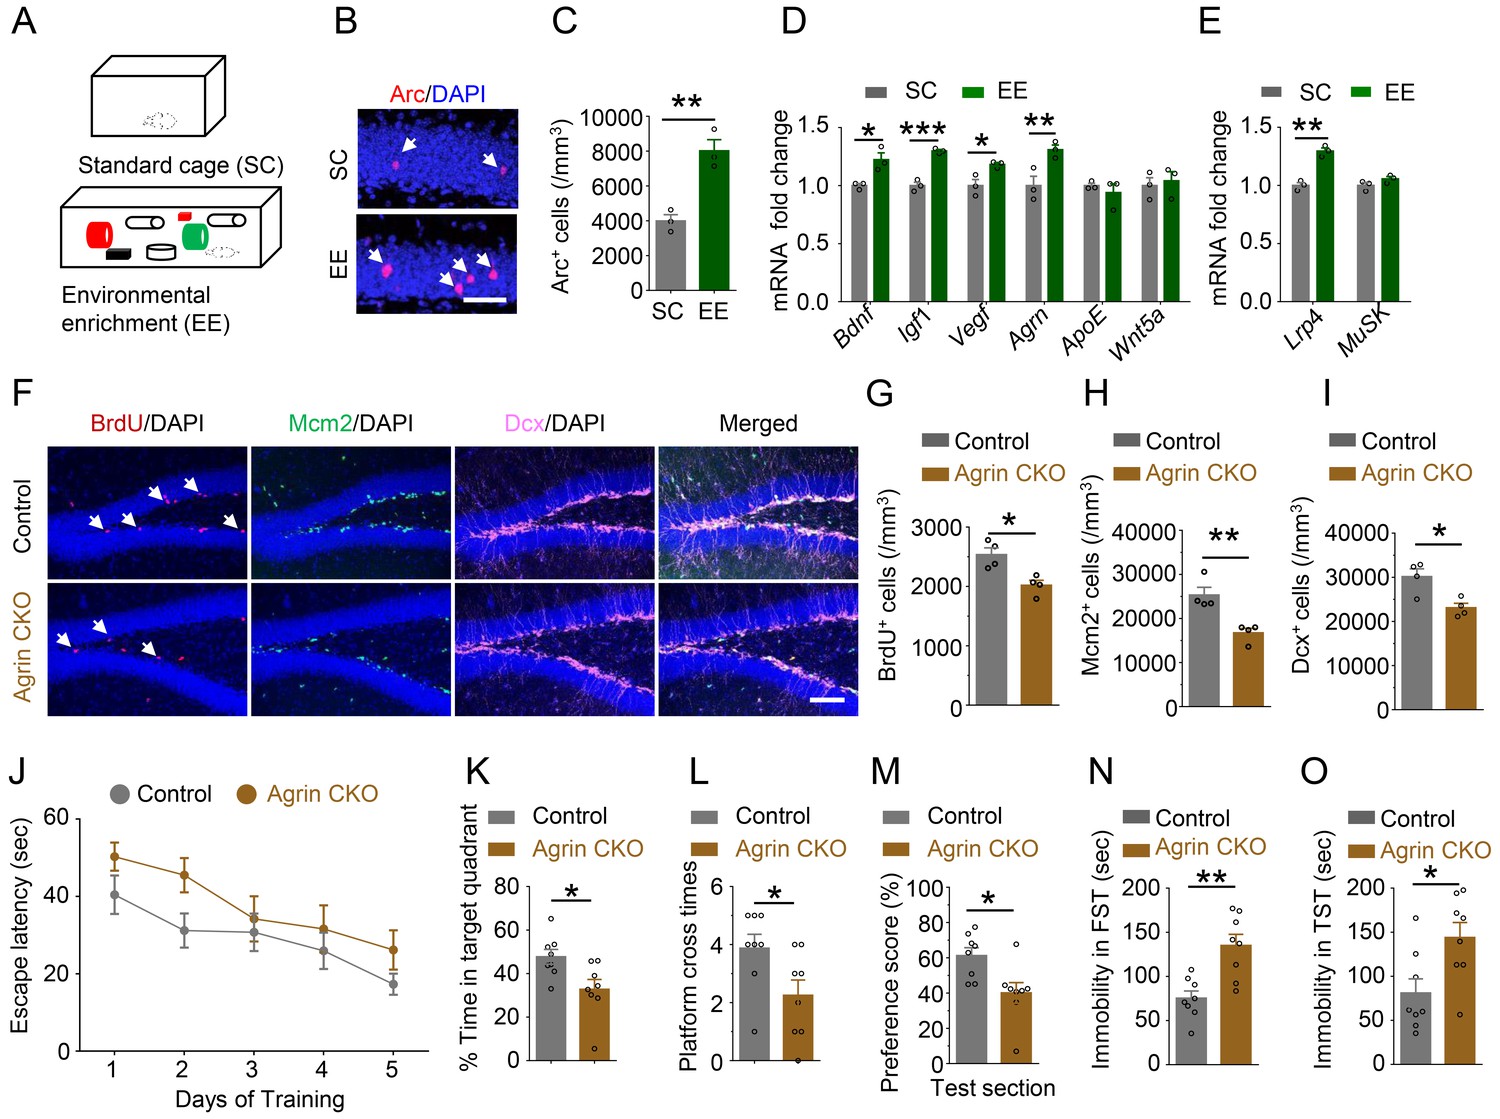
Requirement of Agrin for adult hippocampal neurogenesis.
(A) Schematic diagram of standard cage (SC) and environmental enrichment (EE) housing. (B–C) Increased Arc+ cells in hippocampus of mice in EE, compared with SC-housed mice. n = 3 for each group, Student’s t-test: t (4)=5.493, p=0.0054. (D) Increased Agrn mRNA level in hippocampus of EE-housed mice, compared with SC-housed mice. n = 3 for each group. Student’s t-test: t (4)=3.641, p=0.022 (Bdnf); t (4)=9.545, p=0.0007 (Igf1); t (4)=3.32, p=0.0294 (Vegf); t (4)=3.434, p=0.0264 (Agrn); t (4)=0.7758, p=0.4812 (ApoE); t (4)=0.3968, p=0.7117 (Wnt5a). (E) Increased Lrp4 mRNA level in hippocampus of EE-housed mice, compared with SC-housed mice. n = 3 for each group. Student’s t-test: t (4)=8.04, p=0.0013 (Lrp4); t (4)=1.76, p=0.1527(MuSK). (F–I) Reduced BrdU, Mcm2, and Dcx-labeled cells in Agrin CKO hippocampal SGZ. (F) Representative images. Scale bar,100 µm. (G–I) Stereological quantification of BrdU+ (G), Mcm2+ (H), and Dcx+ (I) cells. n = 4 for each group. Student’s t-test: t (6)=3.656, p=0.0106 for BrdU; t (6)=4.185, p=0.0058 for Mcm2; t (6)=3.410, p=0.0143 for Dcx. (J) Agrin CKO mice increased latency to find the hidden platform F(1,70)=7.81, p=0.0067. (K) Reduced time spent in target quadrant. n = 8 for each group, Student’s t test: t (14)=2.639, p=0.0195. (L) Reduced number of platform crossings. n = 8 for each group, Student’s t test: t (14)=0.0386. (M) Reduced preference score during test section. n = 8 for each group, Student’s t test t (14)=2.865, p=0.0125. (N–O) Increased immobility of Agrin CKO mice, compared with control mice, in FST (N) and TST (O). n = 8 for each group. Student’s t-test: t (14)=3.956, p=0.0014 for FST; t (14)=2.691, p=0.0175 for TST. Data are mean ± s.e.m; *, p<0.05; **, p<0.01; ***, p<0.001.
-
Figure 1—source data 1
Requirement of Agrin for adult hippocampal neurogenesis.
- https://doi.org/10.7554/eLife.45303.004
-
Figure 1—source data 2
Characterization of neuronal Agrn knockout mice.
- https://doi.org/10.7554/eLife.45303.005
Figure 1—figure supplement 1
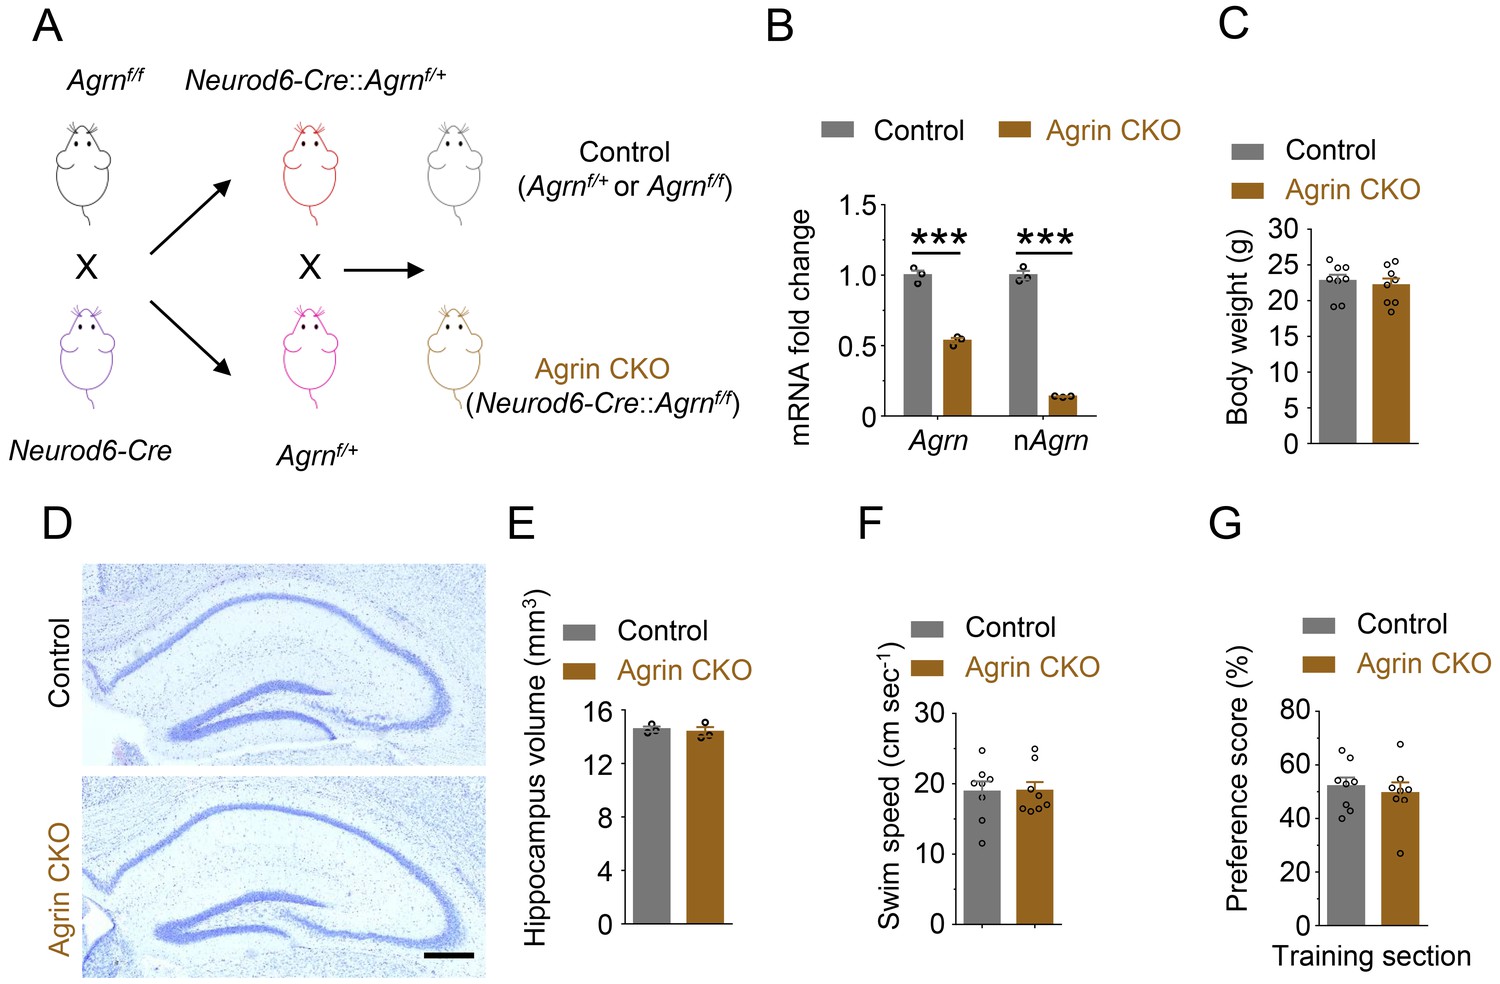
Generation and characterization of neuronal Agrn knockout mice.
(A) Agrnf/f mice were crossed with Neurod6-Cre mice. Resulting Neurod6-Cre::Agrnf/+ mice were crossed with Agrnf/+ mice to generate Neurod6-Cre::Agrnf/f (Agrin CKO) and Agrnf/+ or Agrnf/f (Control). (B) Reduced Agrn mRNA levels in Agrin CKO hippocampus, compared with control mice. nAgrn, neuronal Agrn. n = 3 for each group. Student’s t-test: t (4)=12.5, p=0.0002 (total Agrn); t (4)=28.1, p<0.001 (nAgrn). (C) Similar body weights between control and Agrin CKO mice. n = 8 for each group, P56. Student’s t-test: t (14)=0.4794, p=0.6391. (D) Similar hippocampal morphology between control and Agrin CKO mice. Scale bar, 200 µm. (E) Similar hippocampus volume between control and Agrin CKO mice at P60. Student’s t-test: t (4)=0.4905, p=0.6495. (F) Agrin CKO shows similar swim speed with control in water maze; t (14)=0.07001, p=0.9452. (G) Similar preference score during training section. n = 8 for each group, Student’s t test t (14)=0.5091, p=0.6186. Data are mean ± s.e.m; ***, p<0.001.
Figure 2

Lrp4 expression in adult hippocampal NSPCs in mice.
(A) X-gal staining of coronal brain sections of Lrp4-LacZ mice. Arrowheads, astrocytes; arrows, NSPCs. Scale bar, 100 µm. (B) Lrp4 expression in neural stem cells labeled by Gfap and Nestin. DG sections of Lrp4-LacZ mice were stained for β-gal, Gfap, Nestin, and DAPI. A representative cell was circled that was positive for Gfap and Nestin. Scale bar, 5 µm. (C, D) No-detectable β-gal level in Tbr2+ (C) and PSA-NCAM (D) cells in DG. Scale bar, 5 µm.
Figure 3 with 2 supplements
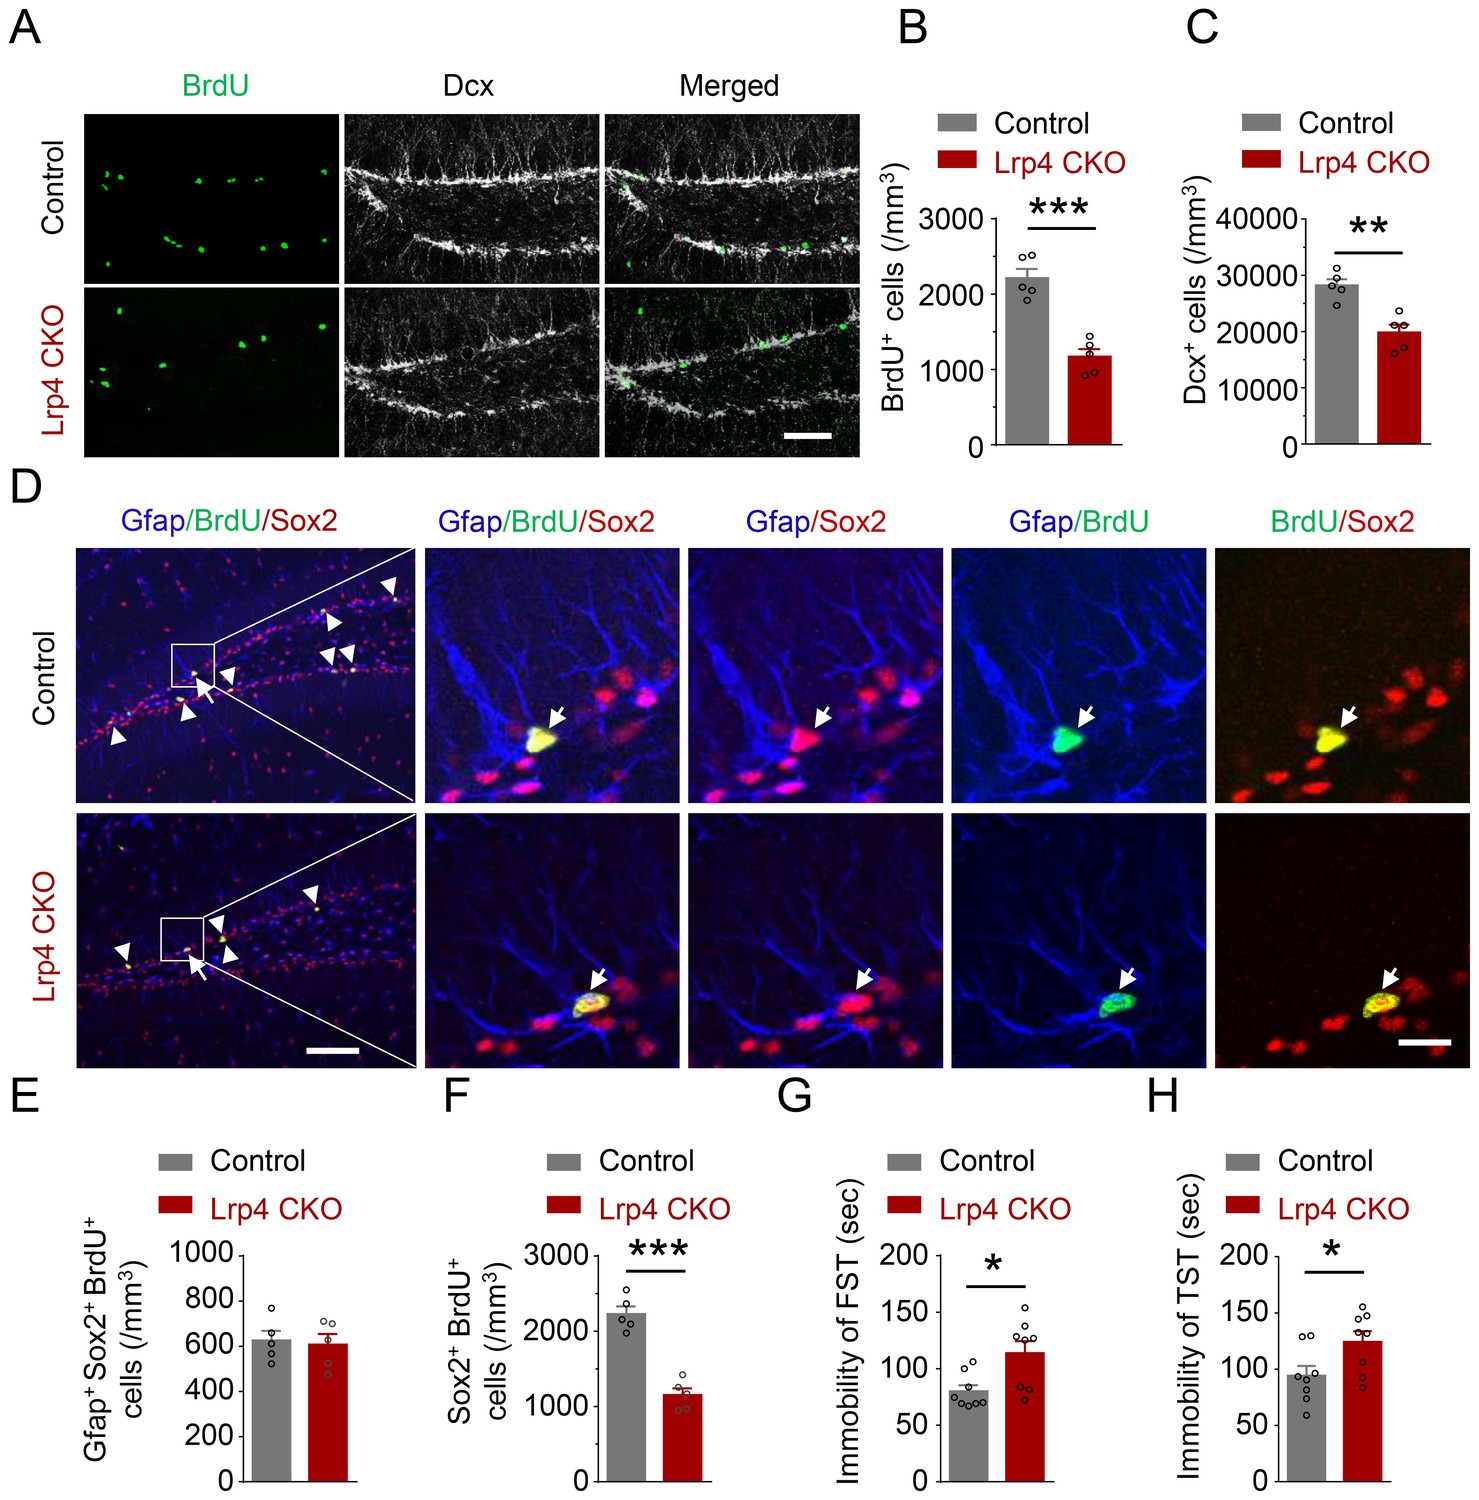
Reduced NSPCs proliferation and increased immobility of Lrp4 CKO mice.
(A–C) Reduced numbers of BrdU- and Dcx-labeled cells in Lrp4 CKO SGZ. (A) Representative images. Scale bar, 100 μm. (B–C) Stereological quantification of SGZ BrdU+ (B) and Dcx+ (C) cells. n = 5 for each group. Student’s t-test: t (8)=6.602, p=0.0002 for BrdU; t (8)=4.701, p=0.0015 for Dcx. (D–F) Reduced NPCs proliferation in Lrp4 CKO. (D) Representative images. The arrow indicated Gfap+/BrdU+/Sox2+, while the arrow head indicated BrdU+/Sox2+ cells. Scale bar, left 100 µm, right 20 µm. (E) Similar numbers of SGZ Gfap+Sox2+ BrdU+ NSCs between the two genotypes. n = 5 for each group. Student’s t-test: t (8)=0.2947, p=0.7757. (F) Decreased the density of Sox2+BrdU+ NPCs in Lrp4 CKO mice, compared with control. n = 5 for each group. Student’s t-test: t (8)=7.943, p<0.0001. (G–H) Increased duration of immobility in FST (G) and TST (H) of Lrp4 CKO mice, compared with control. n = 8 for each group. Student’s t-test: t (14)=2.826, p=0.0135 for FST; t (14)=2.332, p=0.0352 for TST. Data are mean ± s.e.m; *, p<0.05; **, p<0.01; ***, p<0.001.
-
Figure 3—source data 1
Reduced adult neurogenesis and increased immobility of Lrp4 CKO mice.
- https://doi.org/10.7554/eLife.45303.010
-
Figure 3—source data 2
Characterization of Lrp4 CKO mice.
- https://doi.org/10.7554/eLife.45303.011
-
Figure 3—source data 3
Similar number of cleaved caspase-3 labeled cells between Lrp4 CKO and control mice.
- https://doi.org/10.7554/eLife.45303.012
Figure 3—figure supplement 1
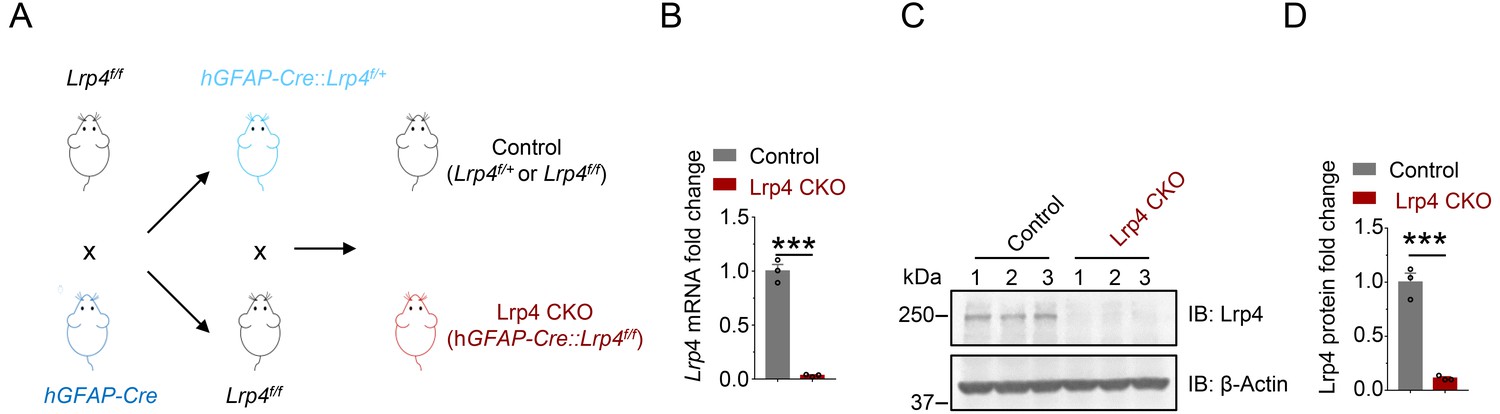
Generation and characterization of Lrp4 mutant mice.
(A) Lrp4f/f mice were crossed with hGFAP-Cre mice; resulting GFAP-Cre::Lrp4f/+ were crossed with Lrp4f/f mice to generate hGFAP-Cre::Lrp4f/f (Lrp4 CKO) and Lrp4f/+ or Lrp4f/f (control). (B) Reduced Lrp4 mRNA in Lrp4 CKO hippocampus, compared with control. n = 3 for each group. Student’s t-test: t (4)=15.76, p<0.0001. (C–D) Reduced Lrp4 protein in Lrp4 CKO hippocampus, compared with control. n = 3 for each group. Student’s t-test: t (4)=10.49, p=0.0005. Data are mean ± s.e.m. ***, p<0.001.
Figure 3—figure supplement 2
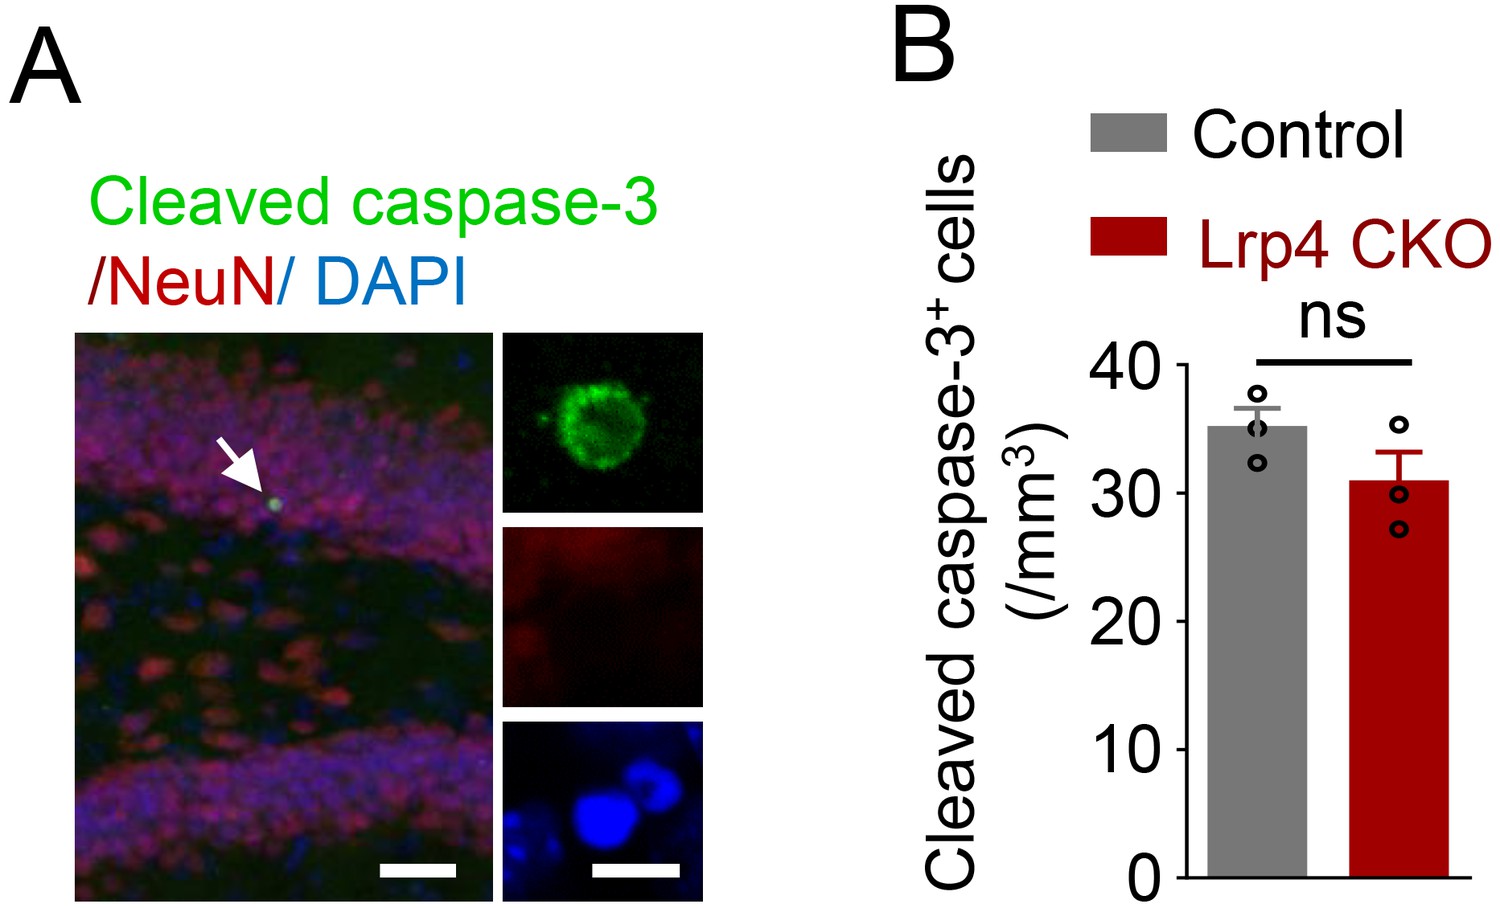
Similar number of cleaved caspase-3 labeled cells between Lrp4 CKO and control mice.
(A) Representative images. Scale bar, left 50 µm, right 5 µm. (B) Quantitative data. n = 3 for each group. Student’s t-test: t (4)=0.2427, p=0.8202. Data are mean ± s.e.m; ns, p>0.05.
Figure 4 with 2 supplements
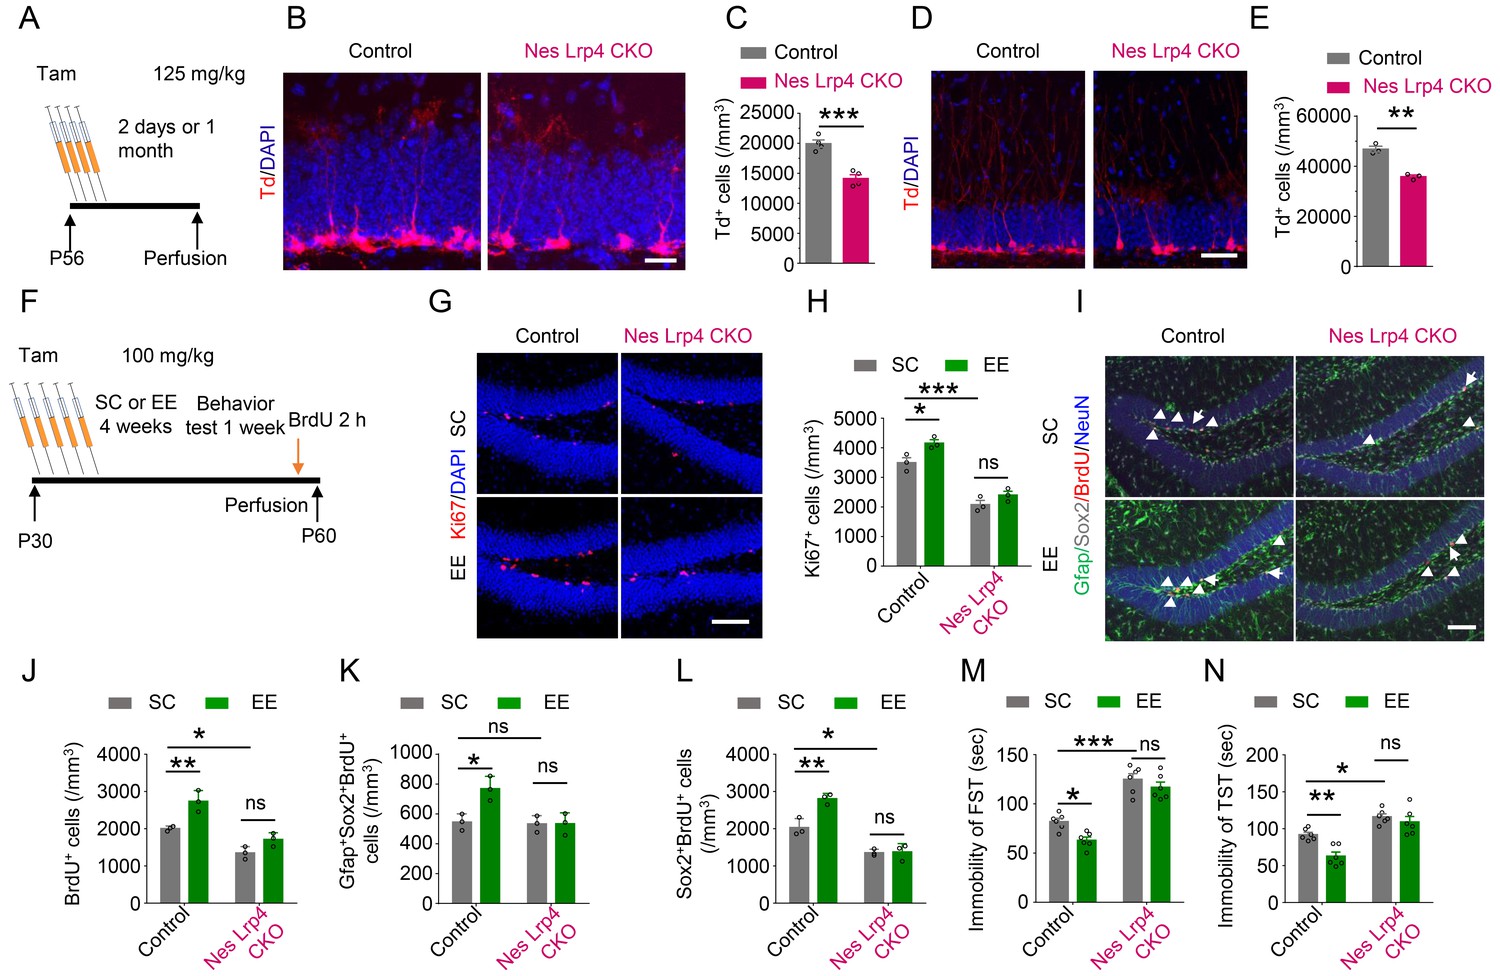
Cell-autonomous effect of Lrp4 in regulating NSPCs proliferation and behavior improvement.
(A) The protocol of Tam treatment. (B–C) Decreased Td+ cells in Nes Lrp4 CKO mice compared with control at 2 days after Tam treatment. (B) Representative images. Scale bar, 25 µm. (C) Stereological quantification of Td+ cell density. n = 4 for each group. Student’s t-test: t (6)=6.553, p=0.0006. (D–E) Decreased Td+ cells in Nes Lrp4 CKO mice compared with control after 1 months of Tam treatment. (D) Representative images. Scale bar, 50 µm. (E) Stereological quantification of Td+ cell density. Student’s t-test: t (4)=8.159, p=0.0012. (F) Time schedule of Tam injection, EE, and BrdU administration. (G–H) EE for 4 weeks failed to increase the density of Ki67+ cells in the DG of iNestin-Lrp4f/f mice. (G) Representative images, Scale bar, 100 µm. (H) Stereological quantification of Ki67+ cell density. n = 3 for each group. Two-way ANOVA test, F (1,8)=129.4, p<0.0001 for genotype; F(1,8) = 12.4, p=0.0078 for EE). (I–L) EE for 4 weeks failed to increase the density of BrdU+, Gfap+Sox2+BrdU+, Sox2+BrdU+ cells in the DG of Nes Lrp4 CKO mice. (I) Representative images, Scale bar, 100 µm. (J) EE for 4 weeks failed to increase the density of BrdU+ cells in the DG of Nes Lrp4 CKO mice. n = 3 for each group. Two-way ANOVA test, F (1,8)=57.01, p<0.0001 for genotype; F (1,8)=24.28, p=0.0012 for EE. (K) EE for 4 weeks increase the density of Gfap+Sox2+BrdU+ cells in the DG of Nes Lrp4 CKO mice. n = 3 for each group. Two-way ANOVA test, F (1,8)=10.09, p=0.0131 for genotype; F (1,8)=8.321, p=0.0204 for EE. (L) EE for 4 weeks increase the density of Sox2+BrdU+ cells in the DG of Nes Lrp4 CKO mice. n = 3 for each group. Two-way ANOVA test, F (1,8)=98.21, p<0.0001 for genotype; F (1,8)=14.09, p=0.0056 for EE. (M–N) Nes Lrp4 CKOmice did not display decrease the duration of immobility in FST (K) and TST (L) after EE for 4 weeks. n = 6 for each group. In FST, two-way ANOVA test: F (1,20)=115.5, p<0.0001 for genotype; F (1,20)=9.04, p=0.007 for EE. In TST, two-way ANOVA test: F (1,20)=44.99, p<0.0001 for genotype; F (1,20)=11.85, p=0.0026 for EE. Data are mean ± s.e.m; ns, p>0.05; *, p<0.05; **, p<0.01; ***, p<0.001.
-
Figure 4—source data 1
Cell-autonomous effect of Lrp4 in regulating NSPCs proliferation and behavior improvement.
- https://doi.org/10.7554/eLife.45303.016
-
Figure 4—source data 2
Characterization of inducible NSPCs-specific Lrp4 knockout mice.
- https://doi.org/10.7554/eLife.45303.017
-
Figure 4—source data 3
Impaired maturation of Lrp4 mutant newborn neurons.
- https://doi.org/10.7554/eLife.45303.018
Figure 4—figure supplement 1
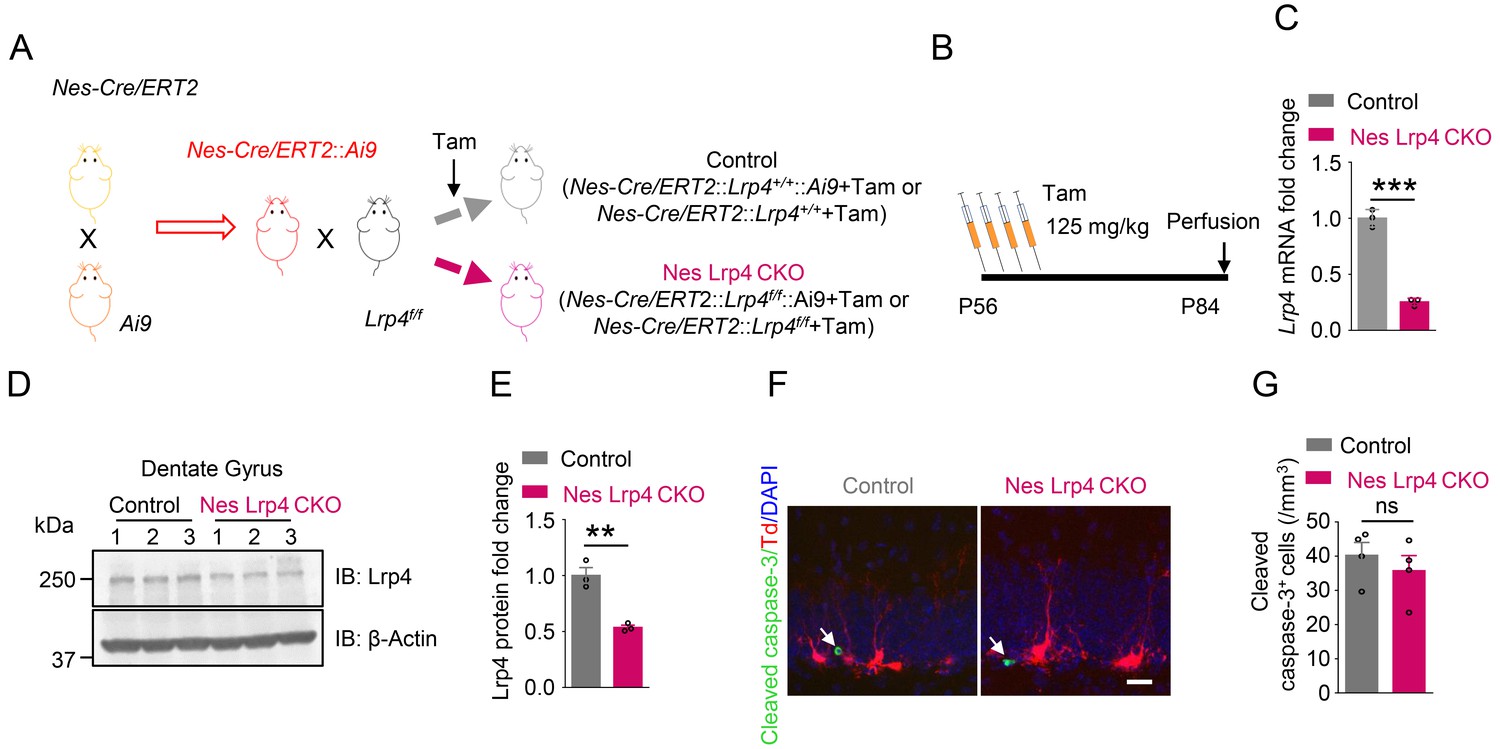
Generation and characterization of inducible NSPCs-specific Lrp4 knockout mice.
(A) Strategy of mouse crossing and Tam treatment. (B) Tam treatment diagram. (C) Decreased Lrp4 mRNA in the DG of Nes Lrp4 CKO mice after Tam treatment. n = 3 for each group. Student’s t-test: t (4)=15.18, p=0.0001. (D–E) Reduced Lrp4 protein in Nes Lrp4 CKO DG after Tam treatment. n = 3 for each group. Student’s t-test: t (4)=6.31, p=0.0032. (F–G) Similar number of cleaved Caspase-3 labeled cells between Nes Lrp4 CKO and control mice 2 days after last Tam treatment. (F) Representative images, Scale bar 20 µm. (G) Quantitative data, n = 4 for each group. Student’s t test: t (6)=0.7717, p=0.4696. Data are mean ± s.e.m; **, p<0.01; ***, p<0.001.
Figure 4—figure supplement 2
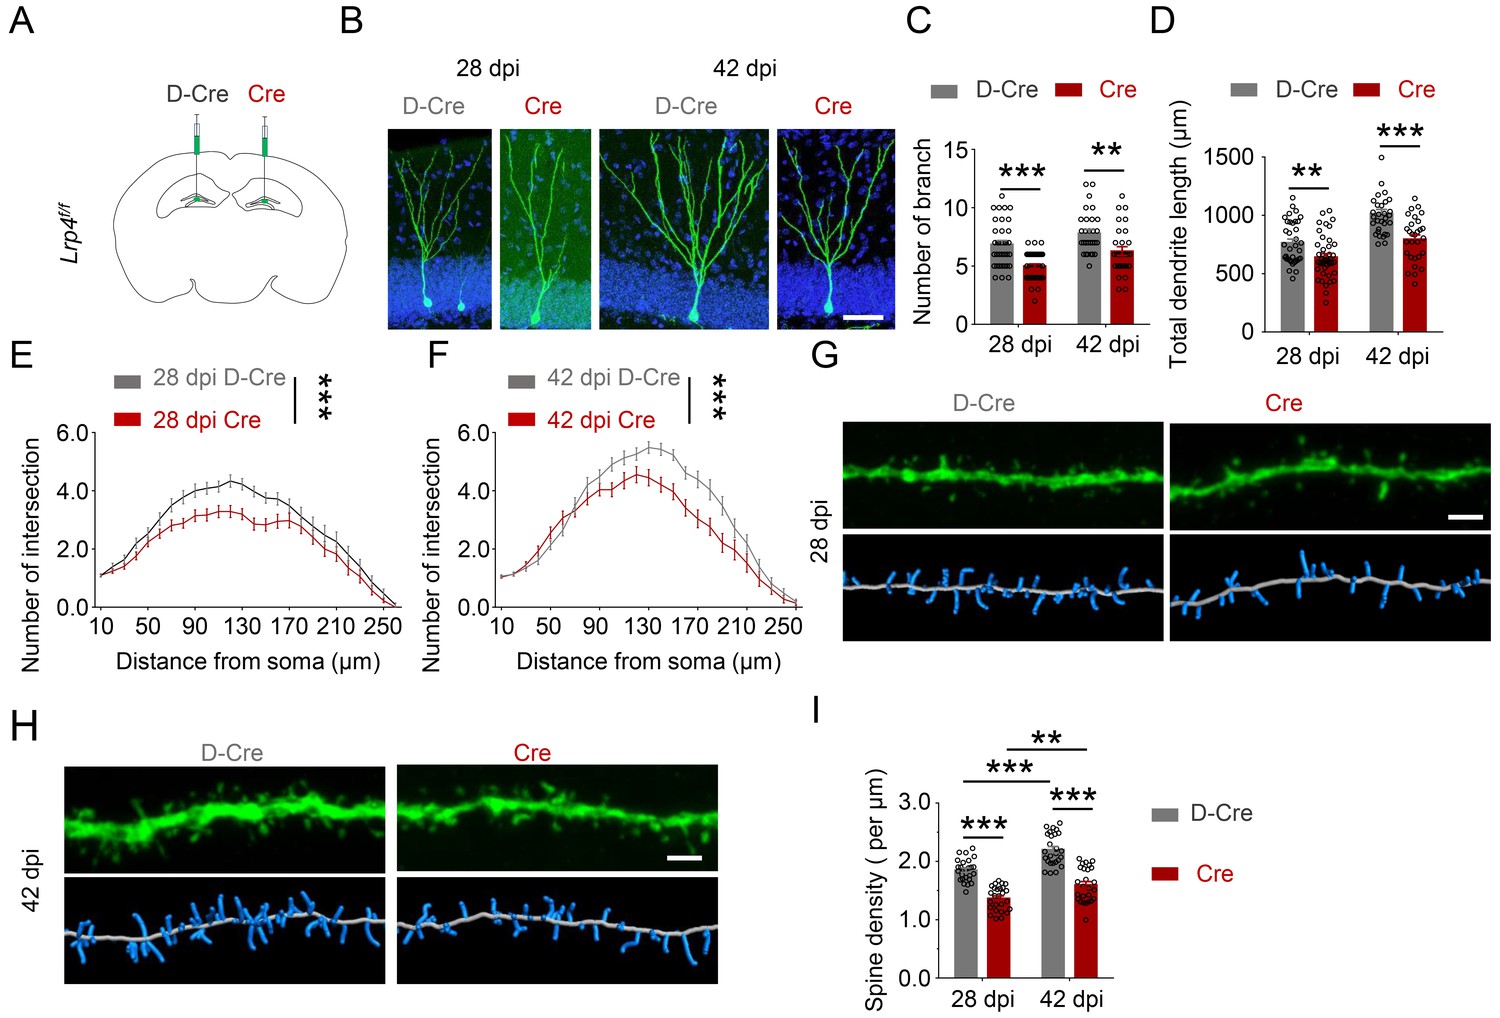
Impaired maturation of Lrp4 mutant newborn neurons.
(A) Schematic diagram of retroviral injection. (B–F) Impaired dendrite maturation of Lrp4 mutant newborn neurons. (B) Representative image. Scale bar, 50 µm. (C) Decreased numbers of dendrite branches of GFP+ newborn neurons that expressed Cre, compared with those that expressed D-Cre. dpi, days post injection. n = 36 for D-Cre 28 dpi; n = 42 for Cre 28 dpi; n = 31 for D-Cre 42 dpi; n = 29 for Cre 42 dpi. Student’s t test: t (76)=5.234, p<0.0001 for 28 dpi; t (58)=3.094, p=0.003 for 42 dpi. (D) Reduced total dendrite length of GFP+ newborn neurons that expressed Cre, compared with those that expressed D-Cre. n = 36 for D-Cre 28 dpi; n = 42 for Cre 28 dpi; n = 31 for D-Cre 42 dpi; n = 29 for Cre 42 dpi. Student’s t-test: t (76)=2.974, p=0.0039 for 28 dpi; t (58)=4.332, p<0.0001 for 42 dpi. (E–F) Decreased dendrite complexity by Lrp4 mutation. Two-way ANOVA followed by Bonferroni multiple comparisons test, F (1,1949)=92.61, p<0.0001 for 28 dpi (E); F(1,1450) = 64.91, p<0.0001 for 42 dpi (F). (G–H) Impaired dendritic spine development. (G and H) Representative images. Scale bar, 2 µm. (I) Decreased spine density in Lrp4 mutant newborn neurons. n = 26 for D-Cre 28 dpi; n = 26 for Cre 28 dpi; n = 26 for D-Cre 42 dpi; n = 26 for Cre 42 dpi. Two-way ANOVA with Tukey’s multiple comparisons test, F (1,100)=37.42, p<0.0001 for 28 and 42 dpi. F (1,100)=130.1, p<0.0001 for D-Cre and Cre. p<0.0001 for D-Cre 28 dpi and Cre 28 dpi. p<0.0001 for D-Cre 28 dpi and 42 D-Cre dpi. p<0.0001 for D-Cre 42 dpi and Cre 42 dpi. p=0.0049 for Cre 28 dpi and Cre 42 dpi. More than three mice were analyzed in each genotype for 28 dpi and 42 dpi. Data are mean ± s.e.m. **, p<0.01, ***, p<0.001.
Figure 5 with 1 supplement
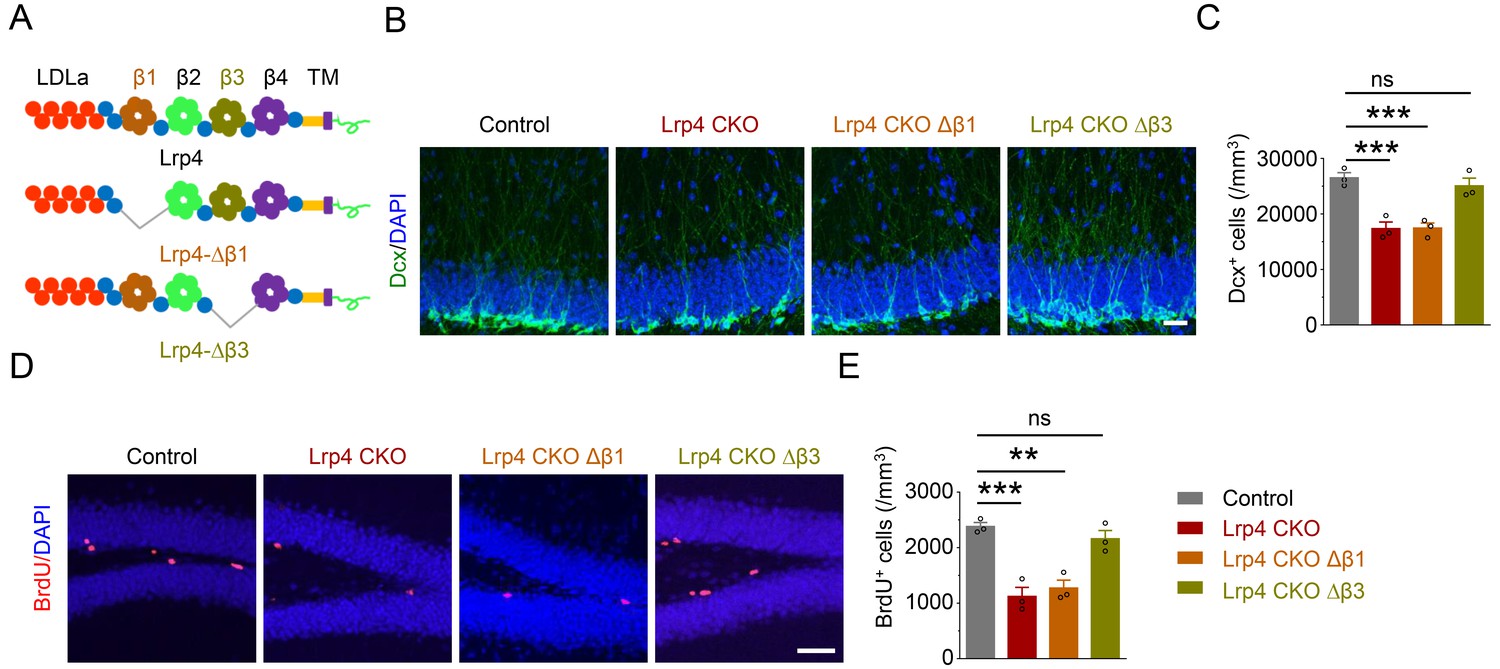
Requirement of the β1 propeller domain for Lrp4 regulation of adult neurogenesis.
(A) Domain structures of Lrp4 and deletion mutants. (B–C) Reduced Dcx+ cell density in Lrp4 CKO and Lrp4 CKO ∆β1, compared with control and Lrp4 CKO ∆β3 mice. (B) Representative images. Scale bar, 50 µm. (C) Stereological quantification of Dcx+ cell density. n = 3 for each group. One-way ANOVA multiple comparisons test, F (3,8)=18.69, p=0.0006; control vs Lrp4 CKO, p=0.0011; control vs Lrp4 CKO ∆β1, p=0.0012; control vs Lrp4 CKO ∆β3, p=0.7005. (D–E) Reduced BrdU+ cell density in Lrp4 CKO and Lrp4 CKO ∆β1, compared with control and Lrp4 CKO ∆β3 mice. (D) Representative images. Scale bar, 50 µm. (E) Stereological quantification. One-way ANOVA multiple comparisons test, F (3,8)=21.26, p=0.0004; control vs Lrp4 CKO, p=0.0005; control vs Lrp4 CKO ∆β1, p=0.0011; control vs Lrp4 CKO ∆β3, p=0.5538. Data are mean ± s.e.m. ns, p>0.05; **, p<0.01; ***, p<0.001.
-
Figure 5—source data 1
Requirement of the β1 propeller domain for Lrp4 regulation of adult neurogenesis.
- https://doi.org/10.7554/eLife.45303.021
Figure 5—figure supplement 1
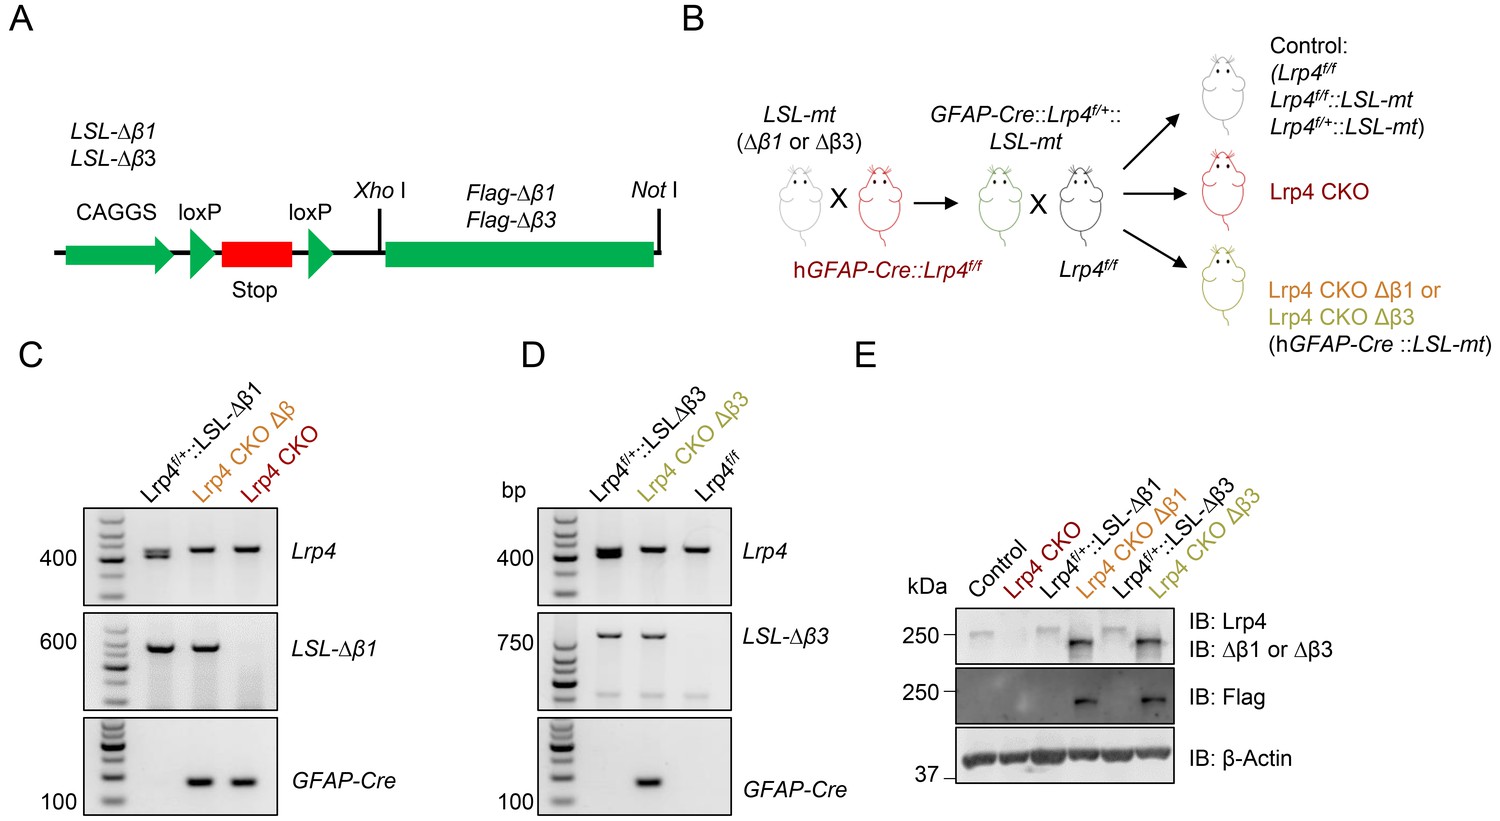
Generation of Lrp4 CKO ∆β1 and Lrp4 CKO ∆β3 mice.
(A) Transgene constructs. (B) Mouse crossing strategy. mt indicates either Lrp4-∆β1 or Lrp4-∆β3. (C–D) Genotyping of indicated mice. wt allele generated 415 bp; floxed allele generated 455 bp; LSL-∆β1 generated ~567 bp; LSL-∆β3 generated ~842 bp; and GFAP-Cre generated ~150 bp bands. (E) Expression of Lrp4-∆β1 and Lrp4-∆β3 in indicated mouse strains, n = 3 for each group. Western blotting was performed with indicated antibodies.
Figure 6 with 2 supplements
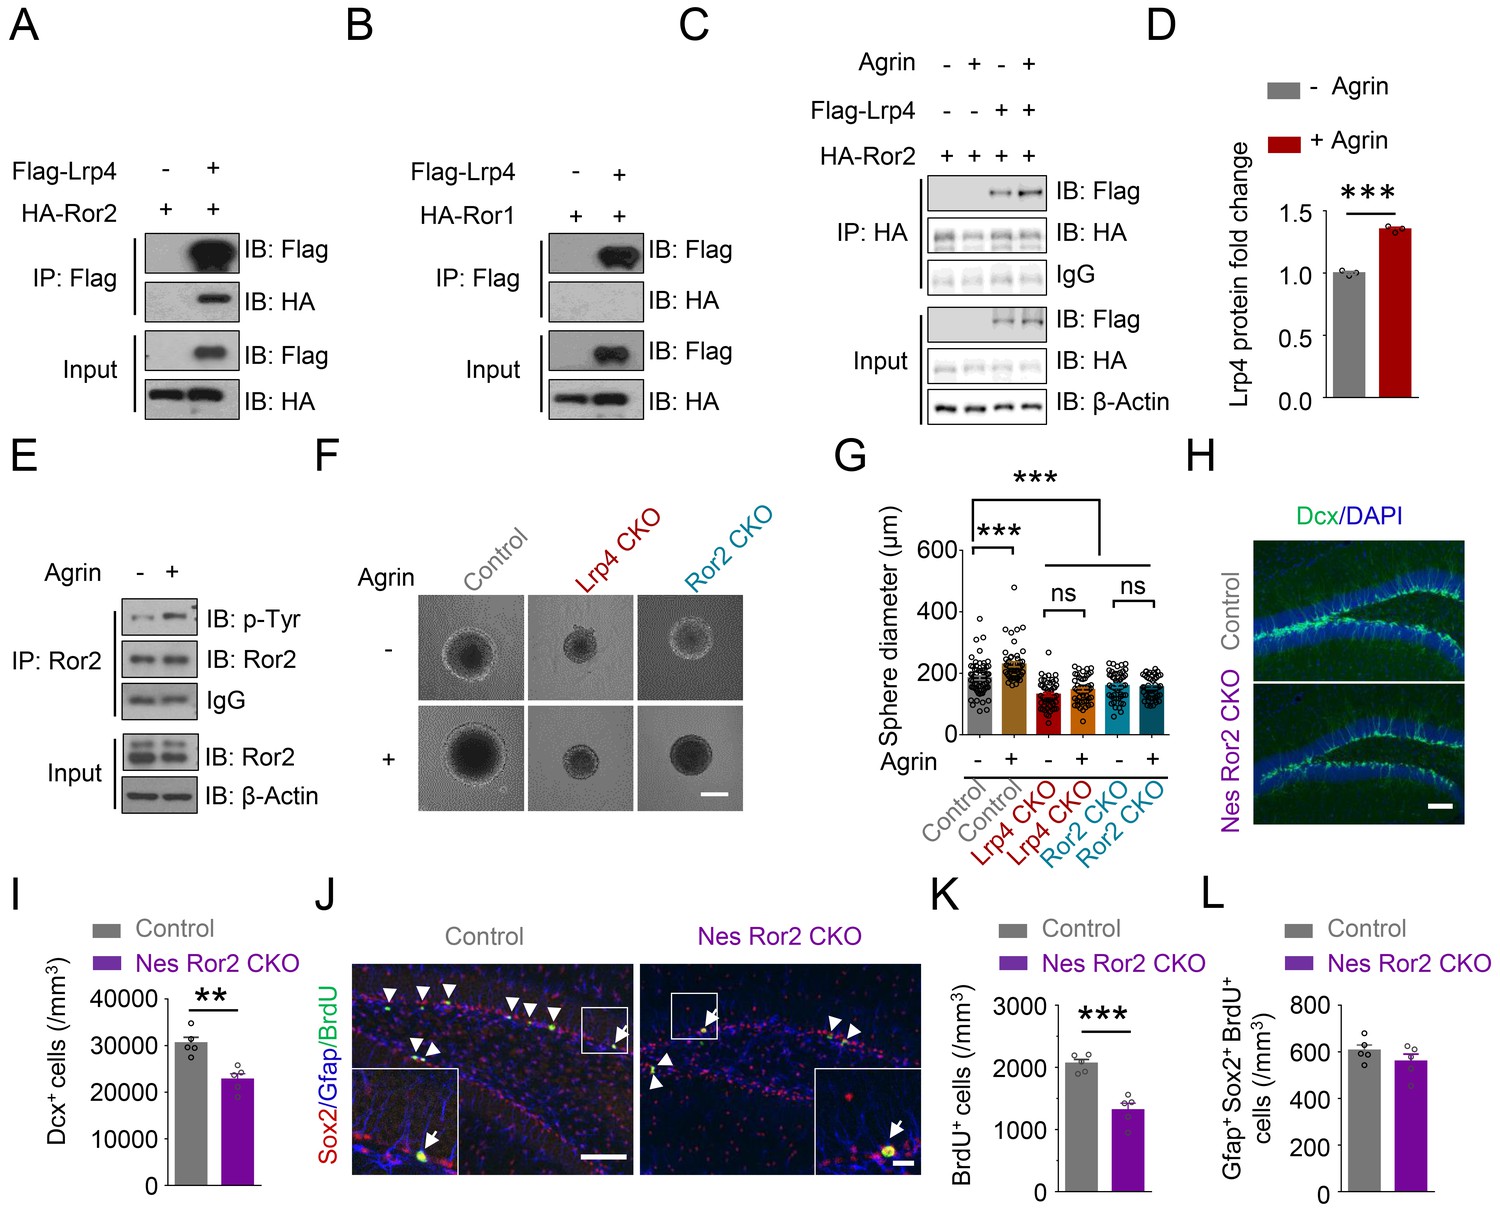
Requirement of Ror2 for adult neurogenesis.
(A–B) Co-immunoprecipitation Ror2 (A), not Ror1 (B), with Lrp4 in co-transfected HEK293T cell. (C–D) Increased Lrp4-Ror2 interaction in Agrin-treated HEK293T cell. (D) Quantitative analysis of data of C. Lrp4 intensity was normalized by that of IgG. Student’s t-test: t (4)=18.47, p<0.0001. (E) Increased Ror2 tyrosine phosphorylation in Agrin-treated neurosphere. Three independent experiments were performed. (F–G) Increased neurosphere size by Agrin and blockade by Lrp4 or Ror2 mutation. (F) Representative images. Scale bar, 100 µm. (G) Quantification of neurosphere size. One-way ANOVA test: F (5,314)=28.55, p<0.0001. Three independent experiments were performed. (H–I) Decreased Dcx+ cell density in Nes Ror2 CKO mice, compared with control. (H) Representative images. Scale bar, 100 µm. (I) Stereological quantification of Dcx+ cell density. n = 5 for each group. Student’s t-test: t (8)=4.523, p=0.0019. (J–L) Reduced BrdU+ cell density in Nes Ror2 CKO mice, compared with control. (J) Representative images. Scale bar 100 µm. (K) Stereological quantification of BrdU+ cell density. n = 5 for each group. Student’s t-test: t (8)=5.948, p=0.0003. (L) Similar density of SGZ Gfap+Sox2+ BrdU+ NSCs between the two genotypes. Student’s t-test: t (8)=1.22, p=0.2572. Data are mean ± s.e.m. **, p<0.01; ***, p<0.001.
-
Figure 6—source data 1
Requirement of Ror2 for adult neurogenesis.
- https://doi.org/10.7554/eLife.45303.025
-
Figure 6—source data 2
Characterization of Ror2 mutant mice.
- https://doi.org/10.7554/eLife.45303.026
-
Figure 6—source data 3
Characterization of inducible NSPCs-specific Ror2 knockout mice.
- https://doi.org/10.7554/eLife.45303.027
Figure 6—figure supplement 1
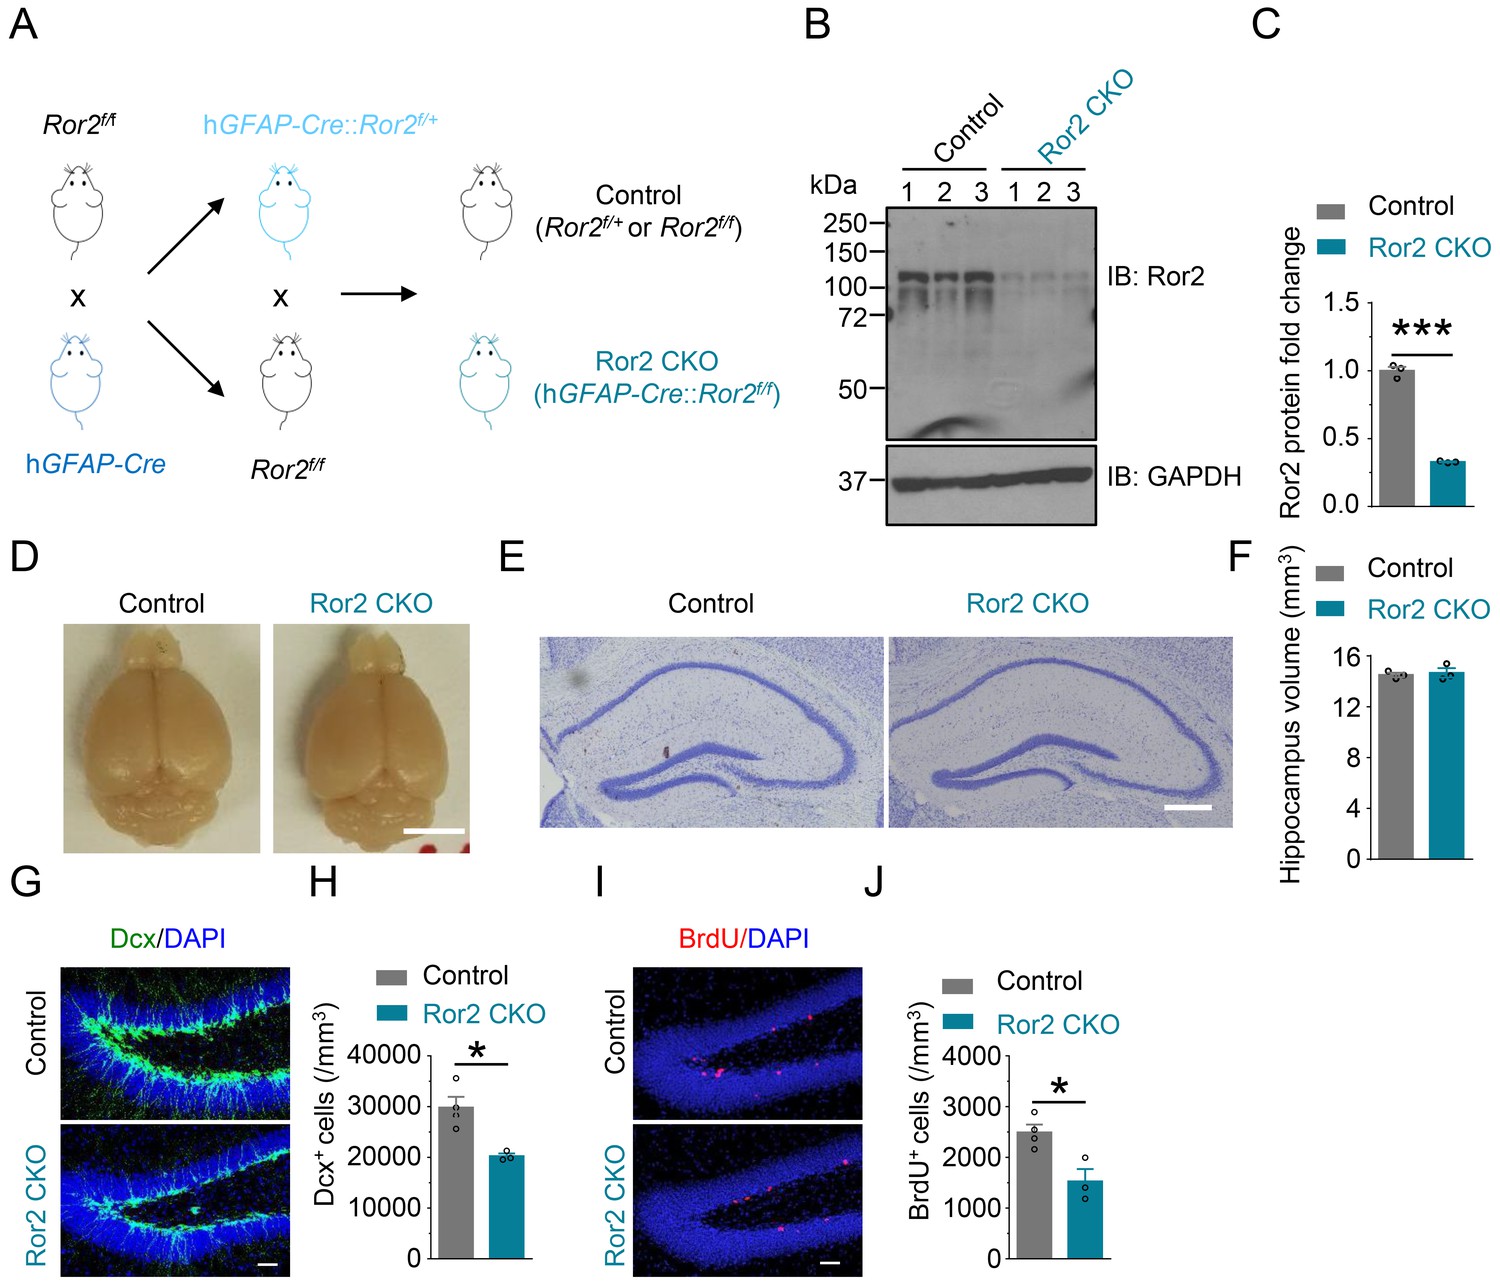
Generation and characterization of Ror2 mutant mice.
(A) Generation of Ror2 conditional knockout mice. (B–C) Reduced Ror2 protein in Ror2 CKO hippocampus, compared with control. (B) Representative western blot. (C) Quantitative data of B. n = 3 for each group. Student’s t-test: t (4)=22.97, p<0.0001. (D) Similar brain gross morphology of Ror2 CKO and control mice. Scale bar, 5 mm. (E) Similar hippocampus morphology between control and Ror2 CKO mice. (F) Similar hippocampus volume of Ror2 CKO and control mice at P60. Student’s t-test: t (4)=0.416, p=0.6988. Scale bar, 200 µm. (G–H) Reduced density of Dcx+ cells in Ror2 CKO DG, compared with control. (G) Representative images. Scale bar, 50 µm. (H) Stereological. n = 4 for control and n = 3 for Ror2 CKO. Student’s t-test: t (5)=3.77, p=0.013. (I–J) Decreased numbers of BrdU+ cells in Ror2 CKO DG, compared with control. (I) Representative images. Scale bar 50 µm. (J) Stereological quantification. n = 4 for control and n = 3 for Ror2 CKO. Student’s t-test: t (5)=3.538, p=0.0166. Data are mean ± s.e.m. *, p<0.05; ***, p<0.001.
Figure 6—figure supplement 2
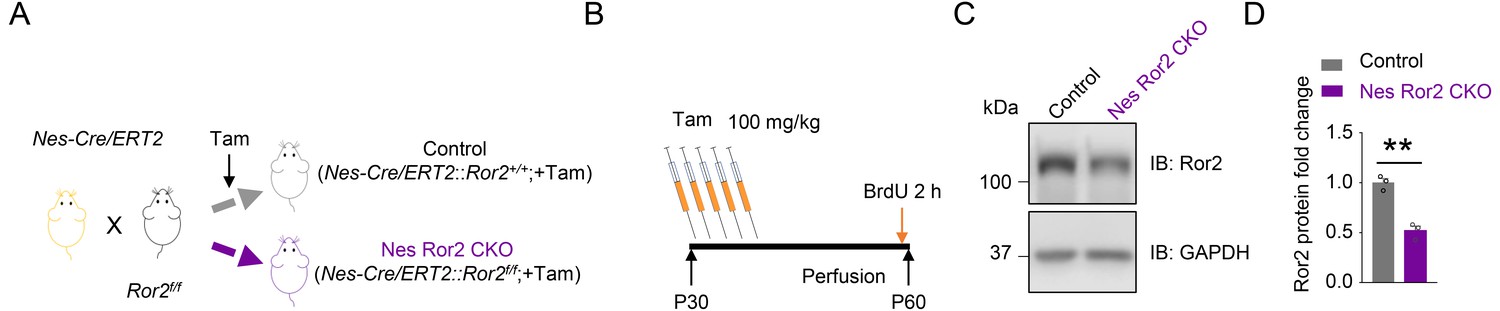
Generation and characterization of inducible NSPCs-specific Ror2 knockout mice.
(A) Strategy of mouse crossing and Tam treatment. (B) Tam treatment diagram. (C) Reduced Ror2 protein in Nes Ror2 CKO DG after Tam treatment. n = 3 for each group. Student’s t-test: t (4)=7.7, p=0.0015. Data are mean ± s.e.m; **, p<0.01.
Tables
Key resources table
| Reagent type (species) or resource | Designation | Source or reference | Identifiers | Additional information |
|---|---|---|---|---|
| Genetic reagent (M. musculus) | Agrnf | Jackson Laboratory | Stock #: 031788 | Harvey et al., 2007 |
| Genetic reagent (M. musculus) | Lrp4f | Wu et al., 2012 | ||
| Genetic reagent (M. musculus) | Ror2f | Jackson Laboratory | Stock #: 018354 | Ho et al., 2012 |
| Genetic reagent (M. musculus) | Neurod6-Cre | CARD R-BASE | CARD ID: 2556 | Goebbels et al., 2006 |
| Genetic reagent (M. musculus) | GFAP-Cre | Jackson Laboratory | Stock #: 004600 | Zhuo et al., 2001 |
| Genetic reagent (M. musculus) | Ai9 (B6.Cg-Gt(ROSA)26Sortm9(CAG-tdTomato)Hze/J) | Jackson Laboratory | Stock #: 007909 | Madisen et al., 2010 |
| Genetic reagent (M. musculus) | Nes-Cre/ERT2 (C57BL/6Tg(Nes-cre/ERT2)KEisc/J) | Jackson Laboratory | Stock #: 016261 | PMID:17166924 |
| Genetic reagent (M. musculus) | Lrp4-LacZ | KNOCKOUT MOUSE PROJECT | Project ID: VG15248 | Sun et al., 2018 |
| Genetic reagent (M. musculus) | LSL-Lrp4-Δβ1 | This paper | ||
| Genetic reagent (M. musculus) | LSL-Lrp4-Δβ3 | This paper | ||
| Cell line (Homo sapiens) | HEK293T | ATCC | Cat#:CRL-3216 RRID: CVCL_0042 | |
| Cell line (Homo sapiens) | GP2-293 | Clontech | Cat #: 631458 RRID: CVCL_WI48 | |
| Antibody | Mouse anti-Arc | Santa Cruz Biotechnology | Cat #: sc-7839 RRID: AB_626696 | IHC (1:200) |
| Antibody | Goat anti-Dcx | Santa Cruz Biotechnology | Cat #: sc-8066 RRID: AB_2088494 | IHC (1:200) |
| Antibody | Mouse anti-Mcm2 | BD Biosciences | Cat #: 610701 RRID: AB_398024, | IHC (1:500) |
| Antibody | Rat anti-BrdU | Accurate Chemical and Scientific Corporation | Cat #: OBT0030 RRID: AB_2313756 | IHC (1:500) |
| Antibody | Rabbit anti-Ki67 | Millipore | Cat #: AB9260 RRID: AB_2142366 | IHC (1:200) |
| Antibody | Mouse anti-Nestin | BD Biosciences | Cat #: 556309 RRID: AB_396354 | IHC (1:200) |
| Antibody | Rabbit anti-GFAP | Dako | Cat #: Z0334 RRID: AB_10013382 | IHC (1:1000) |
| Antibody | Chicken anti-β-gal | Aves Labs | Cat #: BGL-1040 RRID: AB_2313507 | IHC (1:1000) |
| Antibody | Mouse anti-Sox2 | Santa Cruz Biotechnology | Cat #: sc-20088 RRID: AB_2255358 | IHC (1:200) |
| Antibody | Rabbit anti-Tbr2 | Abcam | Cat #: ab23345 RRID: AB_778267 | IHC (1:1000) |
| Antibody | Mouse anti-PSA-NCAM | Millipore | Cat #: MAB5324 RRID: AB_95211 | IHC (1:500) |
| Antibody | Rabbit anti-Cleaved Caspase3 | Cell Signaling Technology | Cat #: 9661 RRID: AB_2341188 | IHC (1:200) |
| Antibody | Mouse anti-NeuN | Millipore | Cat #: MAB377 RRID: AB_2298772 | IHC (1:1000) |
| Antibody | Chicken anti-GFP | AVES | Cat #: GFP-1020 RRID: AB_10000240 | IHC (1:1000) |
| Antibody | Rabbit anti-Flag | Sigma-Aldrich | Cat #: F7425 RRID: AB_439687 | WB (1:1000) |
| Antibody | Mouse anti-HA | Sigma-Aldrich | Cat #: H9658 RRID: AB_260092 | WB (1:5000) |
| Antibody | Mouse anti-GAPDH | Santa Cruz Biotechnology | Cat #: sc-32233, RRID: AB_627679 | WB (1:10000) |
| Antibody | Mouse anti-β-Actin | Cell Signaling Technology | Cat #: 12262 RRID: AB_2566811 | WB (1:5000) |
| Antibody | Mouse anti-P-Tyr-100 | Cell Signaling Technology | Cat #: 9411 RRID: AB_331228 | WB (1:1000) |
| Antibody | Rabbit anti-Ror2 | Cell Signaling Technology | Cat #: 4105 RRID: AB_2180134 | WB (1:1000) |
| Antibody | Mouse anti-Lrp4 | UC Davis/NIH NeuroMab Facility | Cat #: 75–221 RRID: AB_2139030 | WB (1:1000) |
| Antibody | Alexa Fluor 647-AffiniPure Fab Fragment Donkey Anti-Rabbit IgG (H + L) | Jackson Immuno Research Labs | Cat #: 711-607-003 RRID: AB_2340626 | IHC (1:200) |
| Antibody | Alexa Fluor 594-AffiniPure F(ab')2 Fragment Donkey Anti-Rabbit IgG (H + L) | Jackson Immuno Research Labs | Cat #: 711-586-152 RRID: AB_2340622 | IHC (1:200) |
| Antibody | Alexa Fluor 488-AffiniPure Fab Fragment Donkey Anti-Rabbit IgG (H + L) | Jackson ImmunoResearch Labs | Cat #: 711-547-003 RRID: AB_2340620 | IHC (1:200) |
| Antibody | Alexa Fluor 647-AffiniPure Fab Fragment Donkey Anti-Mouse IgG (H + L) | Jackson ImmunoResearch Labs | Cat #: 715-607-003 RRID: AB_2340867 | IHC (1:200) |
| Antibody | Alexa Fluor 488-AffiniPure Fab Fragment Donkey Anti-Mouse IgG (H + L) | Jackson ImmunoResearch Labs | Cat #: 715-547-003 RRID: AB_2340851 | IHC (1:200) |
| Antibody | Alexa Fluor 488-AffiniPure Fab Fragment Donkey Anti-Goat IgG (H + L) | Jackson ImmunoResearch Labs | Cat #: 705-547-003 RRID: AB_2340431 | IHC (1:200) |
| Antibody | Alexa Fluor 488-AffiniPure F(ab')2 Fragment Donkey Anti-Chicken IgY (IgG) (H + L) | Jackson ImmunoResearch Labs | Cat #: 703-546-155 RRID: AB_2340376 | IHC (1:200) |
| Antibody | Alexa Fluor 647- AffiniPure Fab Fragment Donkey Anti-Rat IgG (H + L) | Jackson ImmunoResearch Labs | Cat #: 712-607-003, RRID: AB_2340697 | IHC (1:200) |
| Antibody | IRDye 680RD Donkey anti-Rabbit IgG (H + L) | LI-COR Biosciences | Cat #: 926–68073, RRID:AB_10954442 | WB (1:10000) |
| Antibody | Donkey Anti-Mouse IgG, IRDye 800CW Conjugated | LI-COR Biosciences | Cat # 926–32212, RRID: AB_621847 | WB (1:10000) |
| Recombinant DNA reagent | pFlag-Lrp4 | PMID: 30171091 | Materials and methods subsection: antibodies and plasmid | |
| Recombinant DNA reagent | HA-Ror1 | This paper | Materials and methods subsection: antibodies and plasmid | |
| Recombinant DNA reagent | HA-Ror2 | This paper | Materials and methods subsection: antibodies and plasmid | |
| Chemical compound,drug | BrdU | Sigma | Cat #: B5002 | |
| Chemical compound,drug | Tamoxifen | Sigma | Cat #: T5648 | |
| Software, algorithm | Image J | NIH, USA | RRID:SCR_003070 |
Additional files
-
Transparent reporting form
- https://doi.org/10.7554/eLife.45303.028
Download links
A two-part list of links to download the article, or parts of the article, in various formats.
Downloads (link to download the article as PDF)
Open citations (links to open the citations from this article in various online reference manager services)
Cite this article (links to download the citations from this article in formats compatible with various reference manager tools)
Agrin-Lrp4-Ror2 signaling regulates adult hippocampal neurogenesis in mice
eLife 8:e45303.
https://doi.org/10.7554/eLife.45303


