PLK4 promotes centriole duplication by phosphorylating STIL to link the procentriole cartwheel to the microtubule wall
- Johns Hopkins University School of Medicine, United States
Figures
Figure 1

PLK4 kinase activity promotes STIL binding to CPAP.
(A–D) HEK293FT cells were transfected with the indicated constructs, subjected to co-immunoprecipitation and immunoblotted with the indicated antibodies. PLK4 activity increased binding of both SAS6 and CPAP to STIL.
Figure 2 with 1 supplement
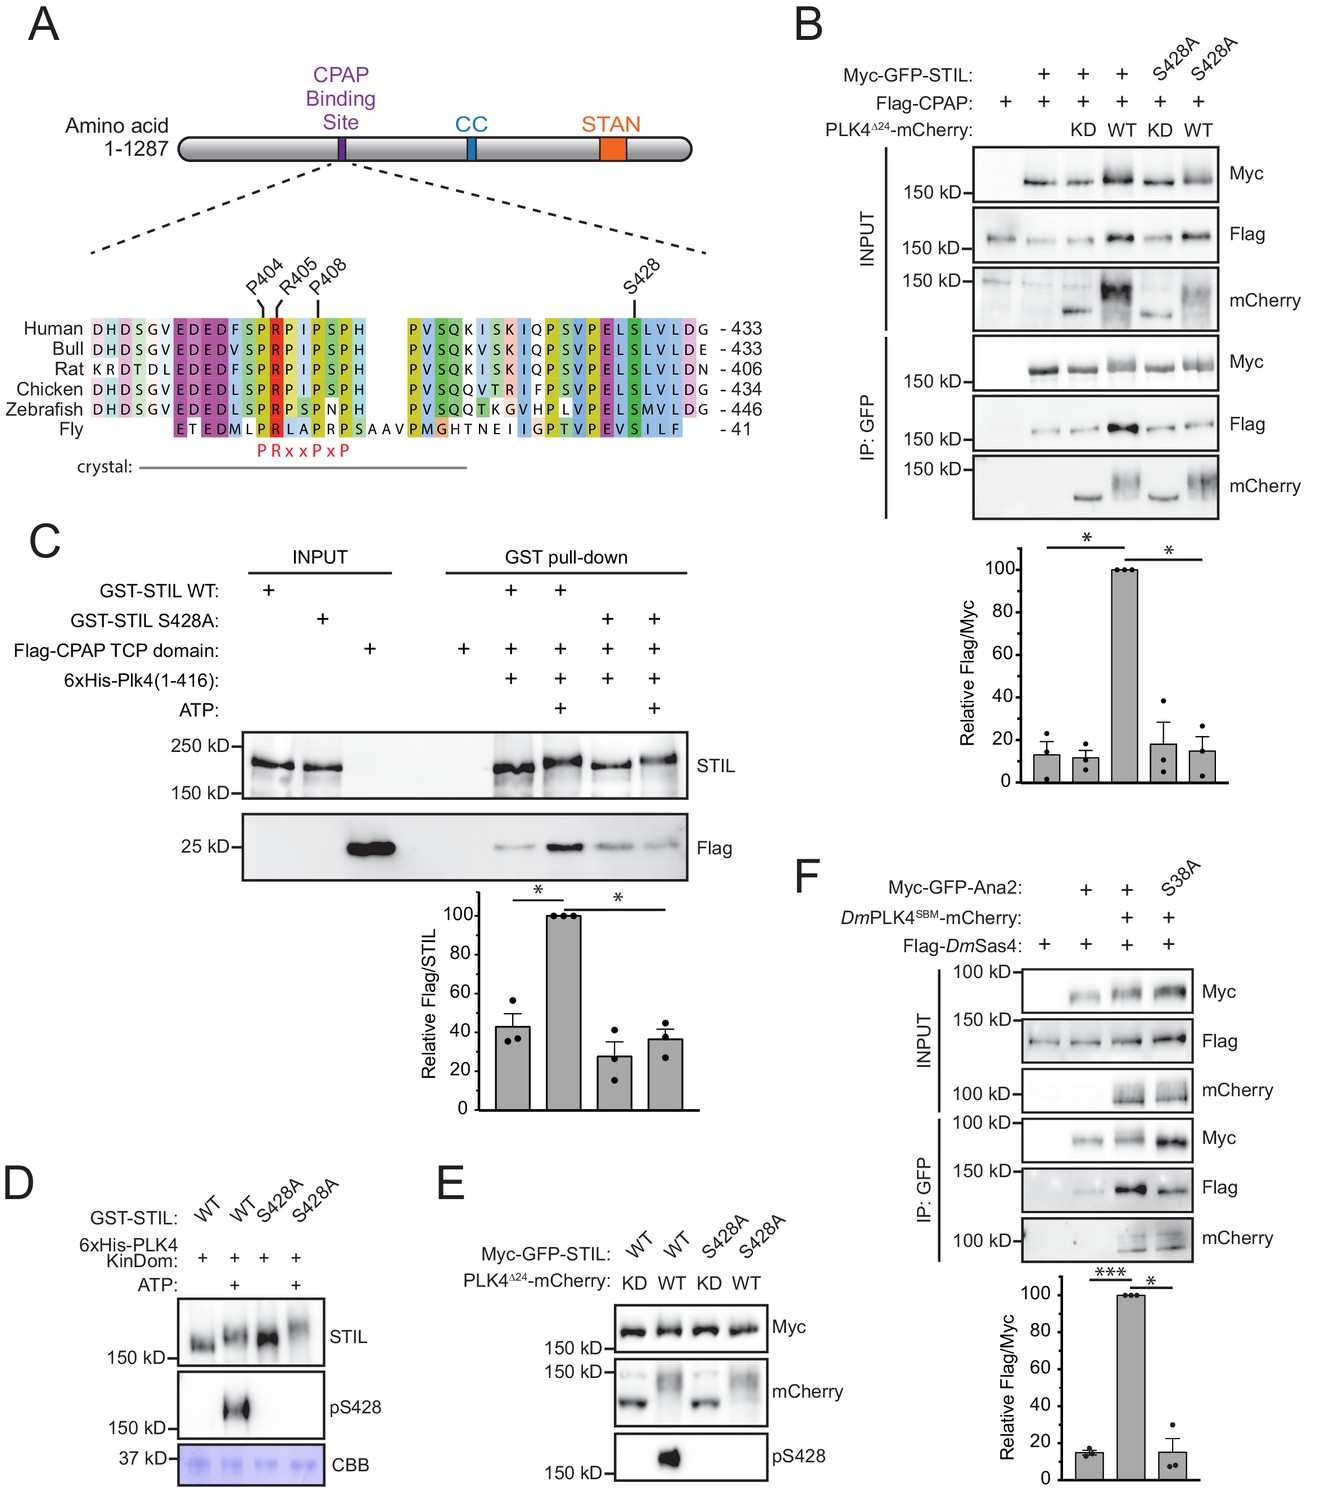
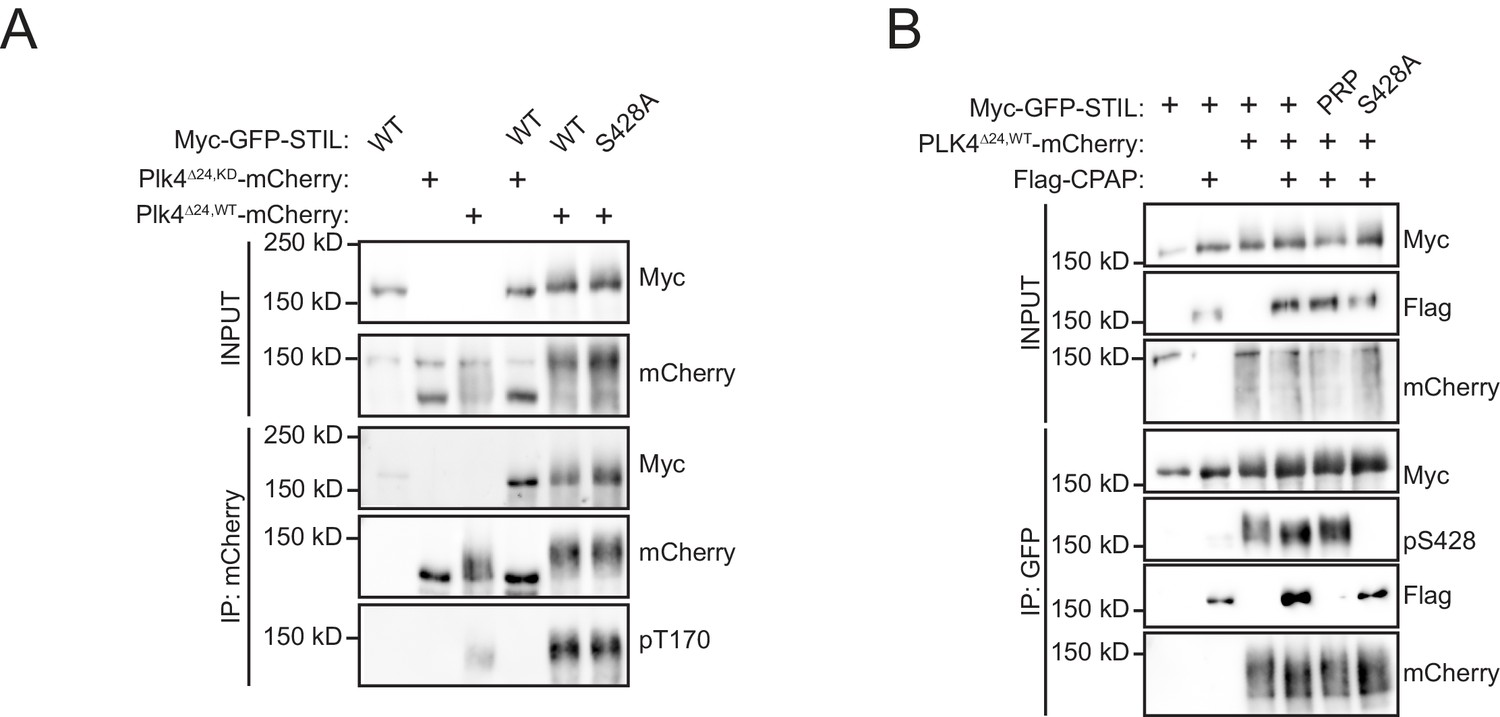
Phosphorylation of STIL by PLK4 promotes increased CPAP binding.
(A) Schematic of full-length STIL showing locations of the known CPAP binding motif, coiled-coil (CC), and STAN motif important for SAS6 binding. Sequence alignment shows the conserved CPAP binding motif. The fragment of STIL crystalized with CPAP is shown by the gray bar (Cottee et al., 2013). STIL residues key to the STIL-CPAP interaction (P404, R405, and P408) are highlighted. The conserved PRxxPxP motif is indicated in red. Alignment was generated using Muscle under standard parameters. (B) HEK293FT cells were transfected with the indicated constructs, subjected to co-immunoprecipitation and immunoblotted with the indicated antibodies. The graph represents the mean of relative levels of immunoprecipitated Flag/Myc signal across three independent experiments. A dot displays measurements from each experiment. Error bars represent the standard error of the mean. (C) Recombinant full-length GST-STIL (WT or S428A) was bound to beads, phosphorylated by recombinant 6xHis-PLK4 kinase domain, and then incubated with Flag-CPAP TCP domain. GST-pulldowns were analyzed by immunoblotting with the indicated antibodies. The graph represents the mean of relative levels of Flag-TCP pulled down with GST-STIL. A dot displays measurements from each experiment. Error bars represent the standard error of the mean. (D) Recombinant full-length GST-STIL (WT or S428A) was phosphorylated in vitro by recombinant 6xHis-PLK4 kinase domain. Samples were immunoblotted with the indicated antibodies. PLK4 phosphorylates STIL at multiple sites leading to a reduced mobility on an SDS-PAGE gel. CBB represents ‘coomassie brilliant blue’ staining and shows the recombinant PLK4 kinase domain. (E) HEK293FT cells were transfected with the indicated constructs and immunoblotted with the indicated antibodies. (F) Drosophila melanogaster S2 cells were transfected with the indicated constructs, subjected to co-immunoprecipitation and immunoblotted with the indicated antibodies. DmPLK4SBM (Slimb Binding Mutant) is stabilized through mutation of critical serines in the Slimb-binding domain to alanine, which prevents auto-regulation of the kinase (Rogers et al., 2009). The graph represents the mean of relative levels of immunoprecipitated Flag/Myc signal across three independent experiments. A dot displays measurements from each experiment. Error bars represent the standard error of the mean. Asterisks indicate statistically significant differences between measurements (*: p<0.05; **: p<0.005; ***: p<0.0005). Statistics for all figures were calculated using a one-sample t-test where mean values were tested as being different from a value of 100.
-
Figure 2—source data 1
Figure 2 Data and Statistical Analysis.
- https://doi.org/10.7554/eLife.46054.006
Figure 2—figure supplement 1
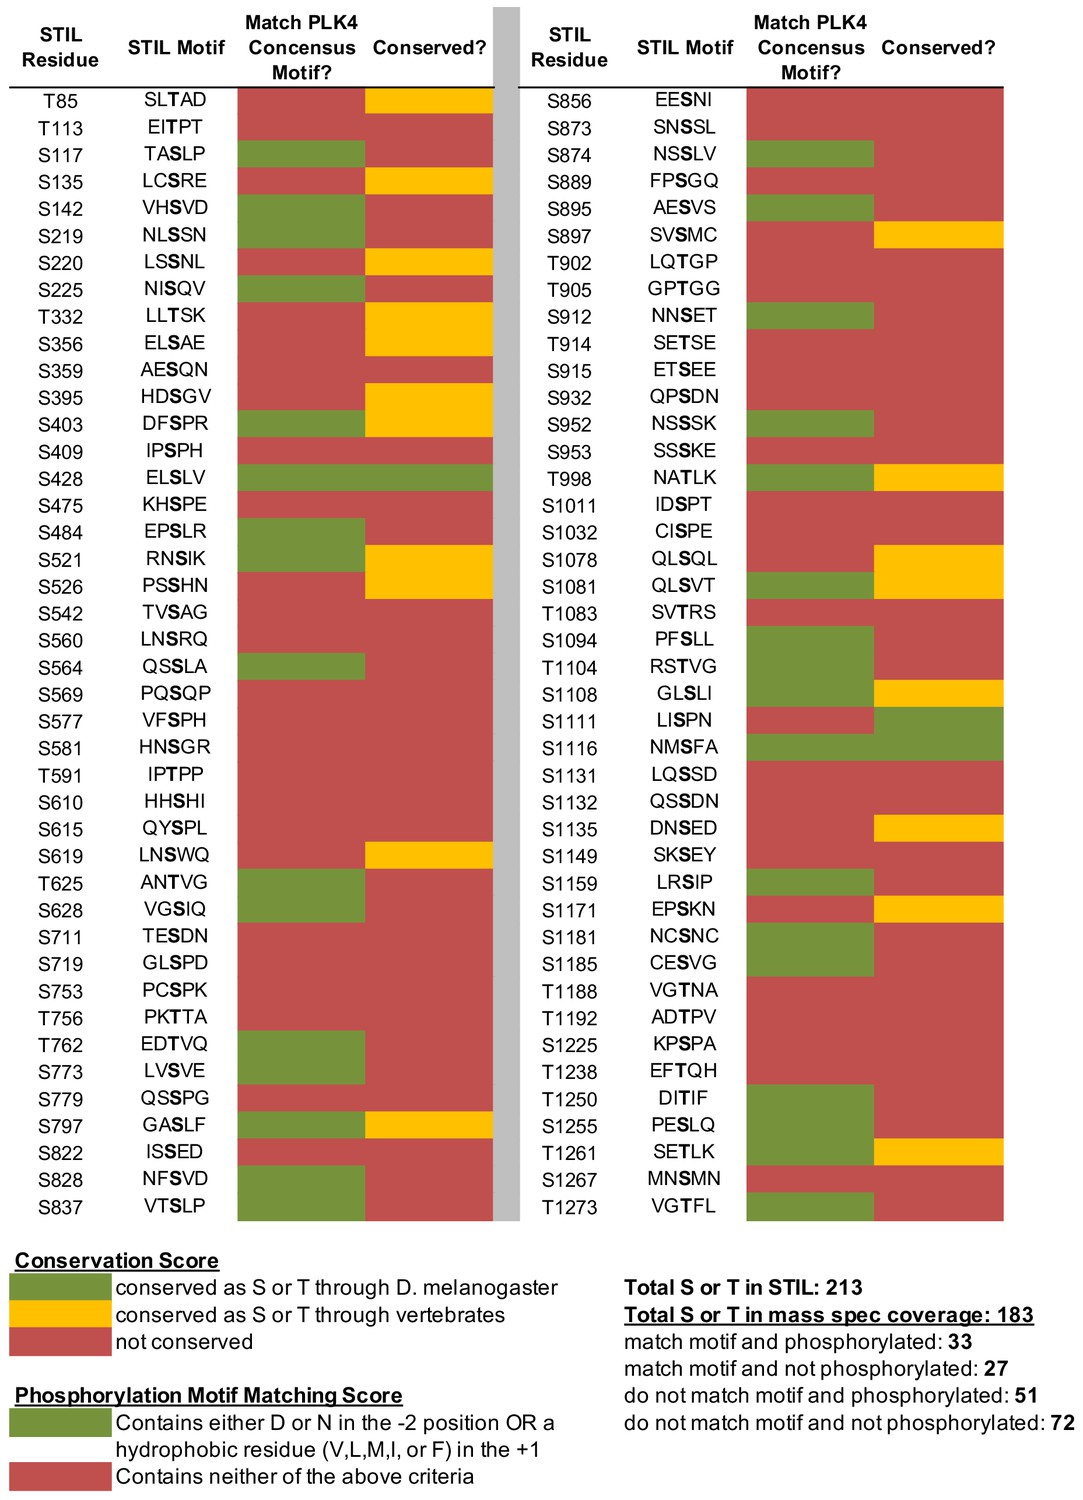
In vitro PLK4 phosphorylation sites on STIL.
Recombinant GST-STIL was phosphorylated by Plk4 kinase domain in vitro, and phosphorylation sites were mapped with mass spectrometry. Phosphorylated residues were scored as to whether or not they are conserved (see Figure 2A for sample alignment) and whether they match the PLK4 phosphorylation consensus motif.
Figure 3 with 4 supplements
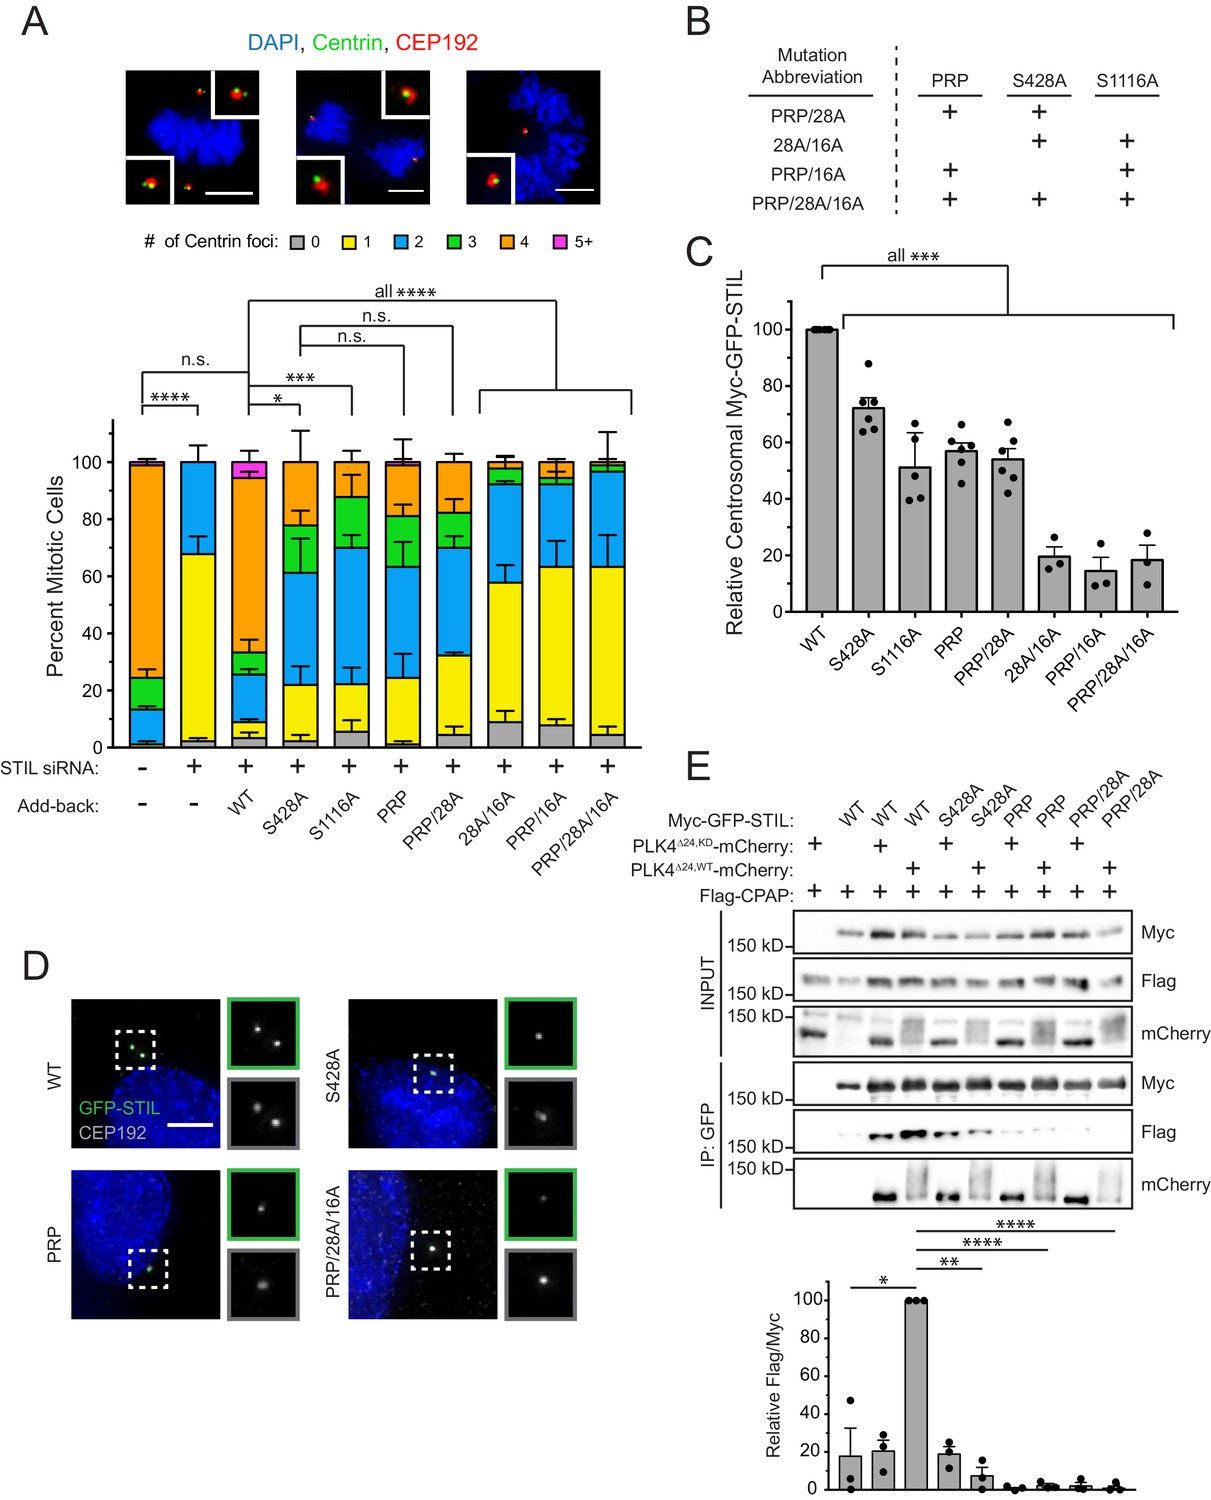
STIL S428 phosphorylation promotes centriole duplication.
(A) Quantification showing the number of mitotic Centrin foci in cells that were depleted of endogenous STIL and induced to express a siRNA-resistant Myc-GFP-STIL transgene as indicated. Error bars represent the standard error of the mean across three independent experiments. Representative images show example mitotic cells. Scale bars represent 5 µm. (B) The table shows abbreviations for Myc-GFP-STIL transgenes with multiple mutations. ‘PRP’ represents a triple mutation of P404A, R405A, and P408A. (C) Quantification of the relative centrosomal levels of Myc-GFP-STIL constructs from (A) in S/G2 phase cells with at least 40 cells measured per experiment. Bars represent the mean of at least three independent experiments with the average within each experiment shown as a dot. Error bars represent the standard error of the mean. (D) Representative images of data shown in (C). Scale bar represents 5 µm. (E) HEK293FT cells were transfected with the indicated constructs and subjected to co-immunoprecipitation and immunoblotted with the indicated antibodies. Graph represents the mean of relative levels of immunoprecipitated Flag/Myc signal across three independent experiments. A dot displays measurement from each experiment. Error bars represent the standard error of the mean. Asterisks indicate statistically significant differences between measurements (*: p<0.05; **: p<0.005; ***: p<0.0005; ****: p<0.0001). For Figure 3A, statistics were calculated using an unpaired t-test against the fraction of cells containing less than four centrioles in mitosis. For Figure 3C and E, statistics were calculated using a one-sample t-test where mean values were tested as being different from a value of 100.
-
Figure 3—source data 1
Figure 3 Data and Statistical Analysis.
- https://doi.org/10.7554/eLife.46054.012
-
Figure 3—source data 2
Figure 3—figure supplement 4 Data and Statistical Analysis.
- https://doi.org/10.7554/eLife.46054.013
Figure 3—figure supplement 1
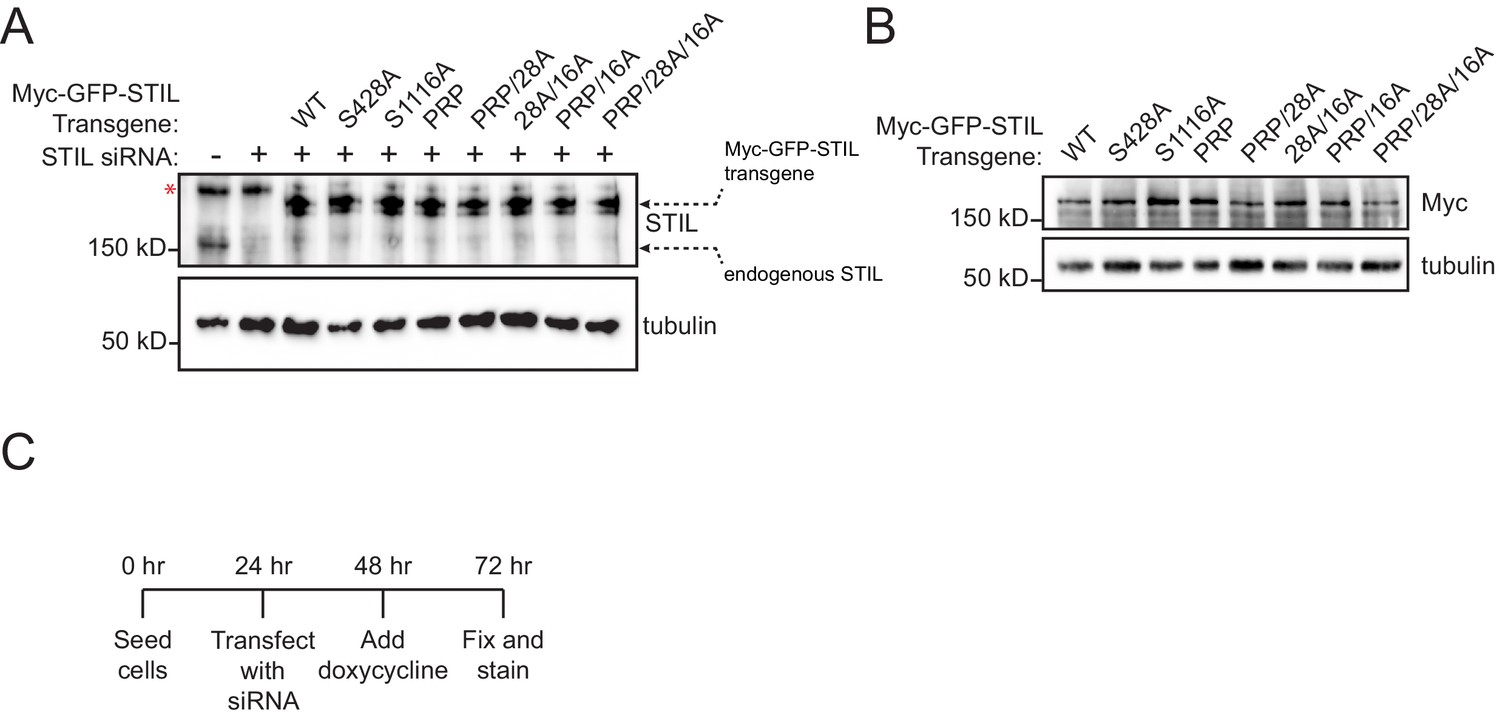
STIL transgenes are expressed to similar levels.
(A) Immunoblot showing the Myc-GFP-STIL transgene expression levels compared to endogenous STIL. Note that a background band (denoted by a red asterisk) is present in the non-transgenic cell lines. (B) Immunoblot showing only Myc-GFP-STIL transgene expression levels after knockdown of endogenous STIL. (C) Experimental outline for the STIL RNAi-replacement experiments.
Figure 3—figure supplement 2
The STIL PRP mutations do not affect STIL S428 phosphorylation.
HEK293FT cells were transfected with the indicated constructs, subjected to co-immunoprecipitation and immunoblotted with the indicated antibodies. (A) Both WT and S428A STIL are capable of activating PLK4 and increasing autophosphorylation of T170. (B) The STIL PRP mutations do not affect S428 phosphorylation.
Figure 3—figure supplement 3
Preventing STIL phosphorylation reduces the accumulation of STIL at the centriole.
Representative images of data shown in (Figure 3C). Scale bar represents 5 µm.
Figure 3—figure supplement 4
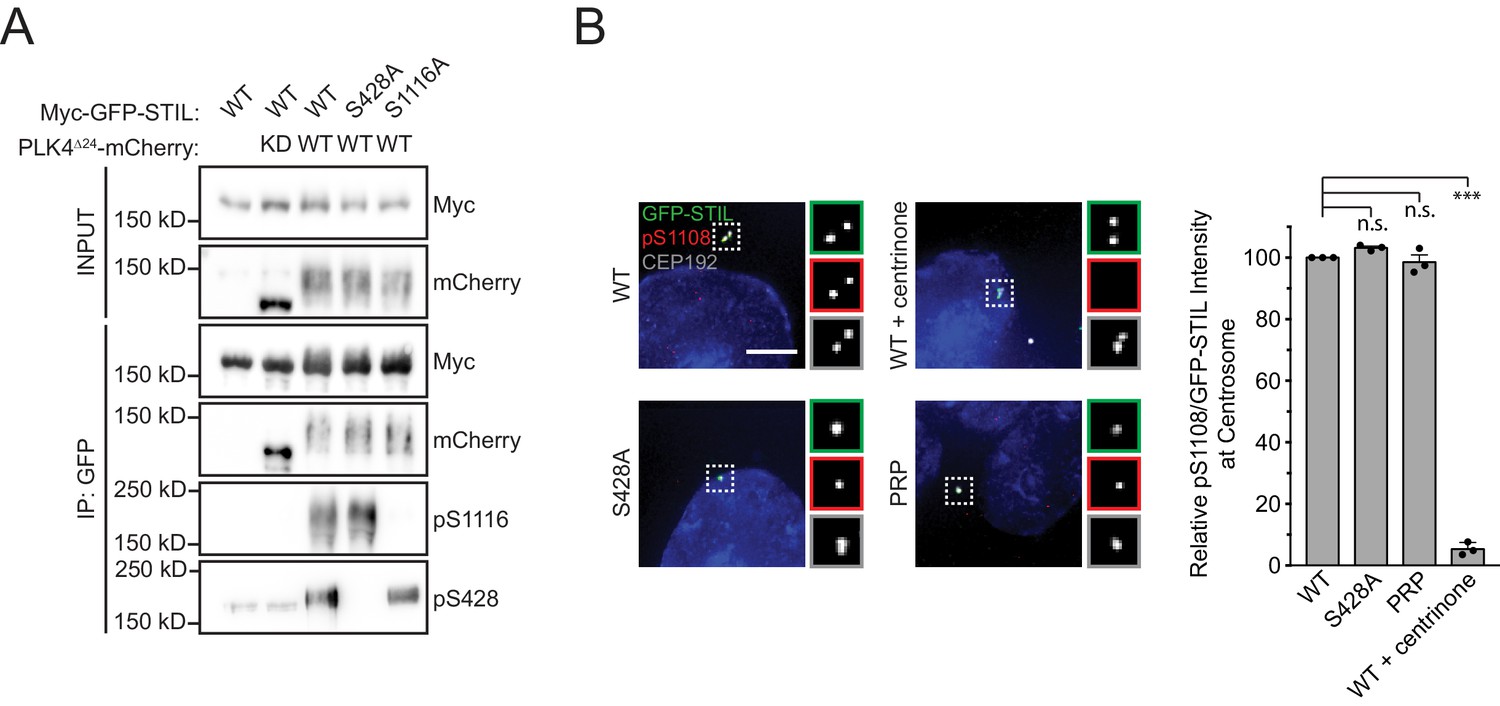
Phosphorylation of the STIL STAN motif by PLK4 does not require STIL S428 phosphorylation.
(A) HEK293FT cells were transfected with the indicated constructs, subjected to co-immunoprecipitation and immunoblotted with the indicated antibodies. Preventing phosphorylation of STIL S428 does not block STIL S1116 phosphorylation, and vice-versa. (B) Endogenous STIL was knocked down and replaced with the indicated Myc-GFP-STIL transgene. Where indicated, cells were treated with centrinone for 1 hr. Left, representative images showing Myc-GFP-STIL and pS1108 staining. Scale bar represents 5 µm. Right, quantification of the relative centrosomal ratio of pS1108/GFP-STIL in S/G2 phase cells. Bars represent the mean of three independent experiments in which at least 40 cells were quantified per experiment, and the average within each experiment is shown as a dot. Error bars represent the standard error of the mean. Asterisks indicate statistically significant differences between measurements (*: p<0.05; **: p<0.005; ***: p<0.0005). Statistics were calculated using a one-sample t-test where mean values were tested as being different from a value of 100.
Figure 4 with 2 supplements
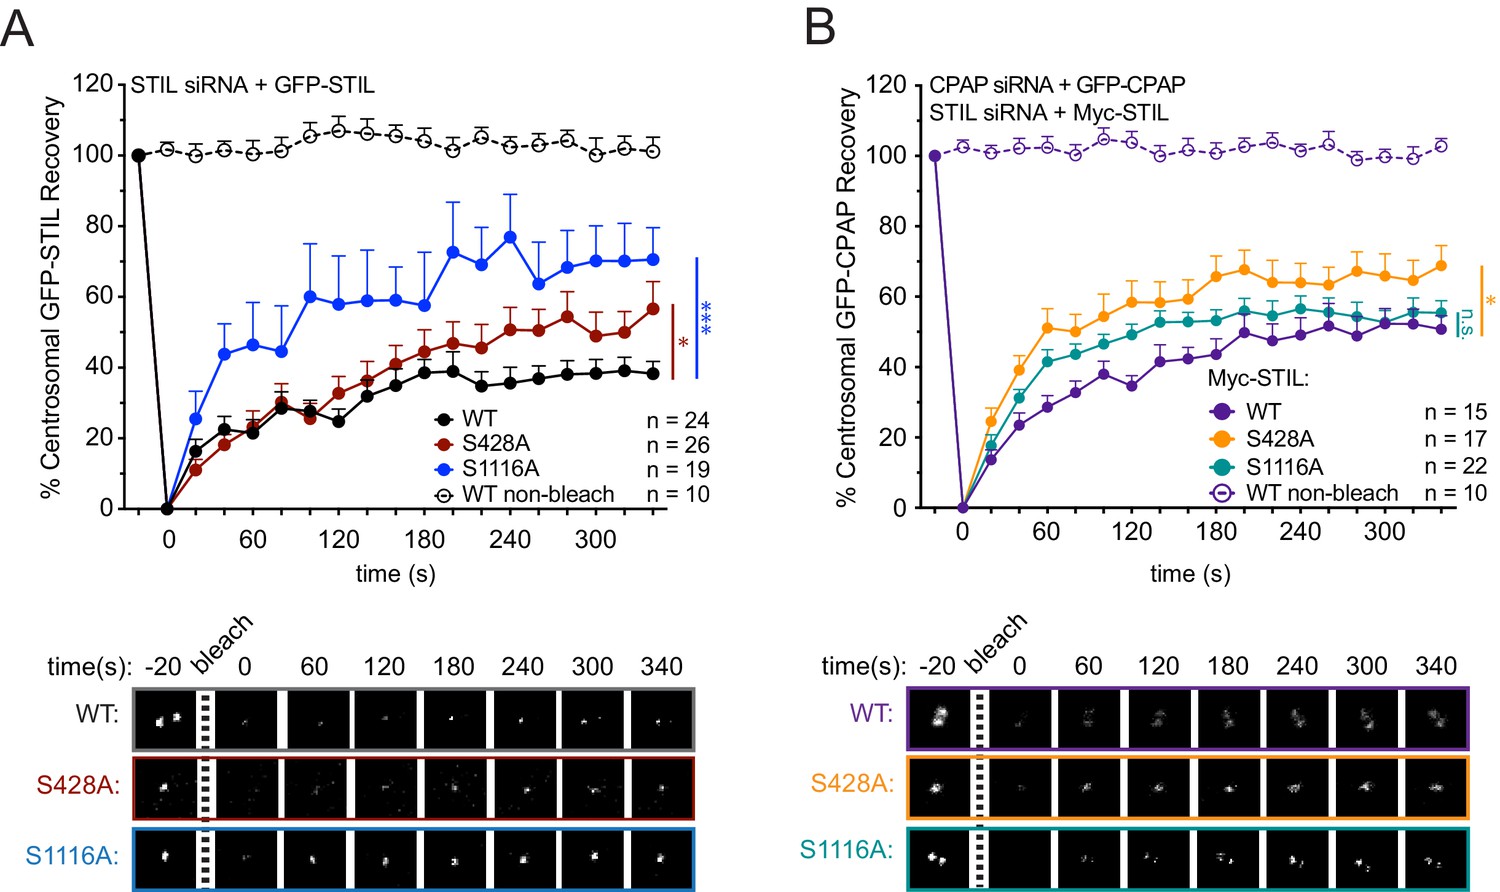
STIL S428 phosphorylation promotes the stable integration of CPAP into the centrosome.
(A) Cells were depleted of endogenous STIL and replaced with the indicated transgene. Myc-GFP-STIL centrosomal foci were photobleached, and fluorescence recovery was measured. The number of quantified photobleaching and recovery events are indicated. Representative timepoints are shown below. Error bars represent the standard error of the mean. (B) Cells were depleted of endogenous STIL and CPAP and replaced with the indicated Myc-STIL-T2A-GFP-CPAP transgene. GFP-CPAP centrosomal foci were photobleached, and fluorescence recovery was measured. The number of quantified photobleaching events is indicated. Representative timepoints are shown below. Error bars represent the standard error of the mean. Asterisks indicate statistically significant differences between measurements (*: p<0.05; **: p<0.005; ***: p<0.0005). Statistics were calculated using an unpaired t-test against the population of recovery measurements between indicated samples at the 340 s timepoint.
-
Figure 4—source data 1
Figure 4 Data and Statistical Analysis.
- https://doi.org/10.7554/eLife.46054.017
-
Figure 4—source data 2
Figure 4—figure supplement 1 Data and Statistical Analysis.
- https://doi.org/10.7554/eLife.46054.018
-
Figure 4—source data 3
Figure 4—figure supplement 2 Data and Statistical Analysis.
- https://doi.org/10.7554/eLife.46054.019
Figure 4—figure supplement 1
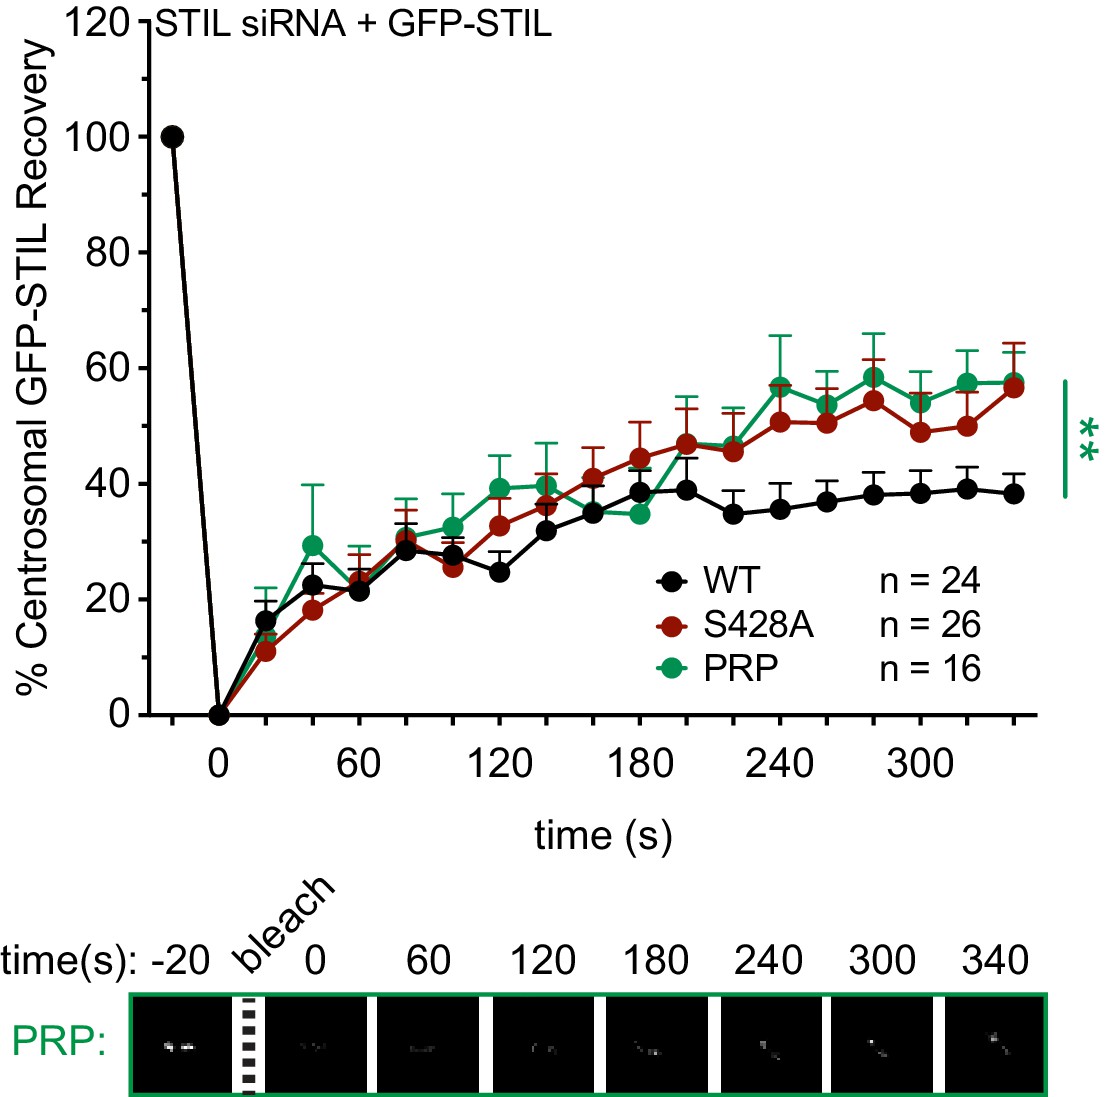
The STIL PRP mutation mimics the turnover dynamics of the STIL S428A mutation.
(A) Cells were depleted of endogenous STIL and replaced with the indicated transgene. Myc-GFP-STIL centrosomal foci were photobleached, and fluorescence recovery was measured. The number of quantified photobleaching and recovery events is indicated. Representative timepoints are shown below. Error bars represent the standard error of the mean. Note that ‘WT’ and ‘S428A’ recovery traces are repeated from Figure 4A. Asterisks indicate statistically significant differences between measurements (*: p<0.05; **: p<0.005; ***: p<0.0005). Statistics were calculated using an unpaired t-test against the population of recovery measurements between indicated samples at the 340 s timepoint.
Figure 4—figure supplement 2

Centrosomal CPAP turns over in response to STIL depletion.
(A) Cells were depleted of endogenous CPAP and replaced with a Myc-GFP-CPAP transgene (WT, gray). Cells were depleted of endogenous CPAP and STIL, and CPAP was replaced with either a Myc-GFP-CPAP transgene (WT, STIL siRNA) or a Myc-STIL-T2A-GFP-CPAP transgene (WT, STIL siRNA +Myc STIL). Centrosomal GFP-CPAP foci were photobleached, and fluorescence recovery was measured. Representative timepoints are shown below. Error bars represent the standard error of the mean. (B) Cells were depleted of endogenous STIL and CPAP and replaced with the indicated Myc-STIL-T2A-GFP-CPAP transgene. Centrosomal GFP-CPAP foci were photobleached, and fluorescence recovery was measured. The number of quantified photobleaching and recovery events is indicated. Representative timepoints are shown below. Error bars represent the standard error of the mean. Note that ‘WT’ and ‘S428A’ Myc-STIL recovery traces are repeated from Figure 4B. Asterisks indicate statistically significant differences between measurements (*: p<0.05; **: p<0.005; ***: p<0.0005). Statistics were calculated using an unpaired t-test against the population of recovery measurements between indicated samples at the 340 s timepoint.
Figure 5 with 1 supplement
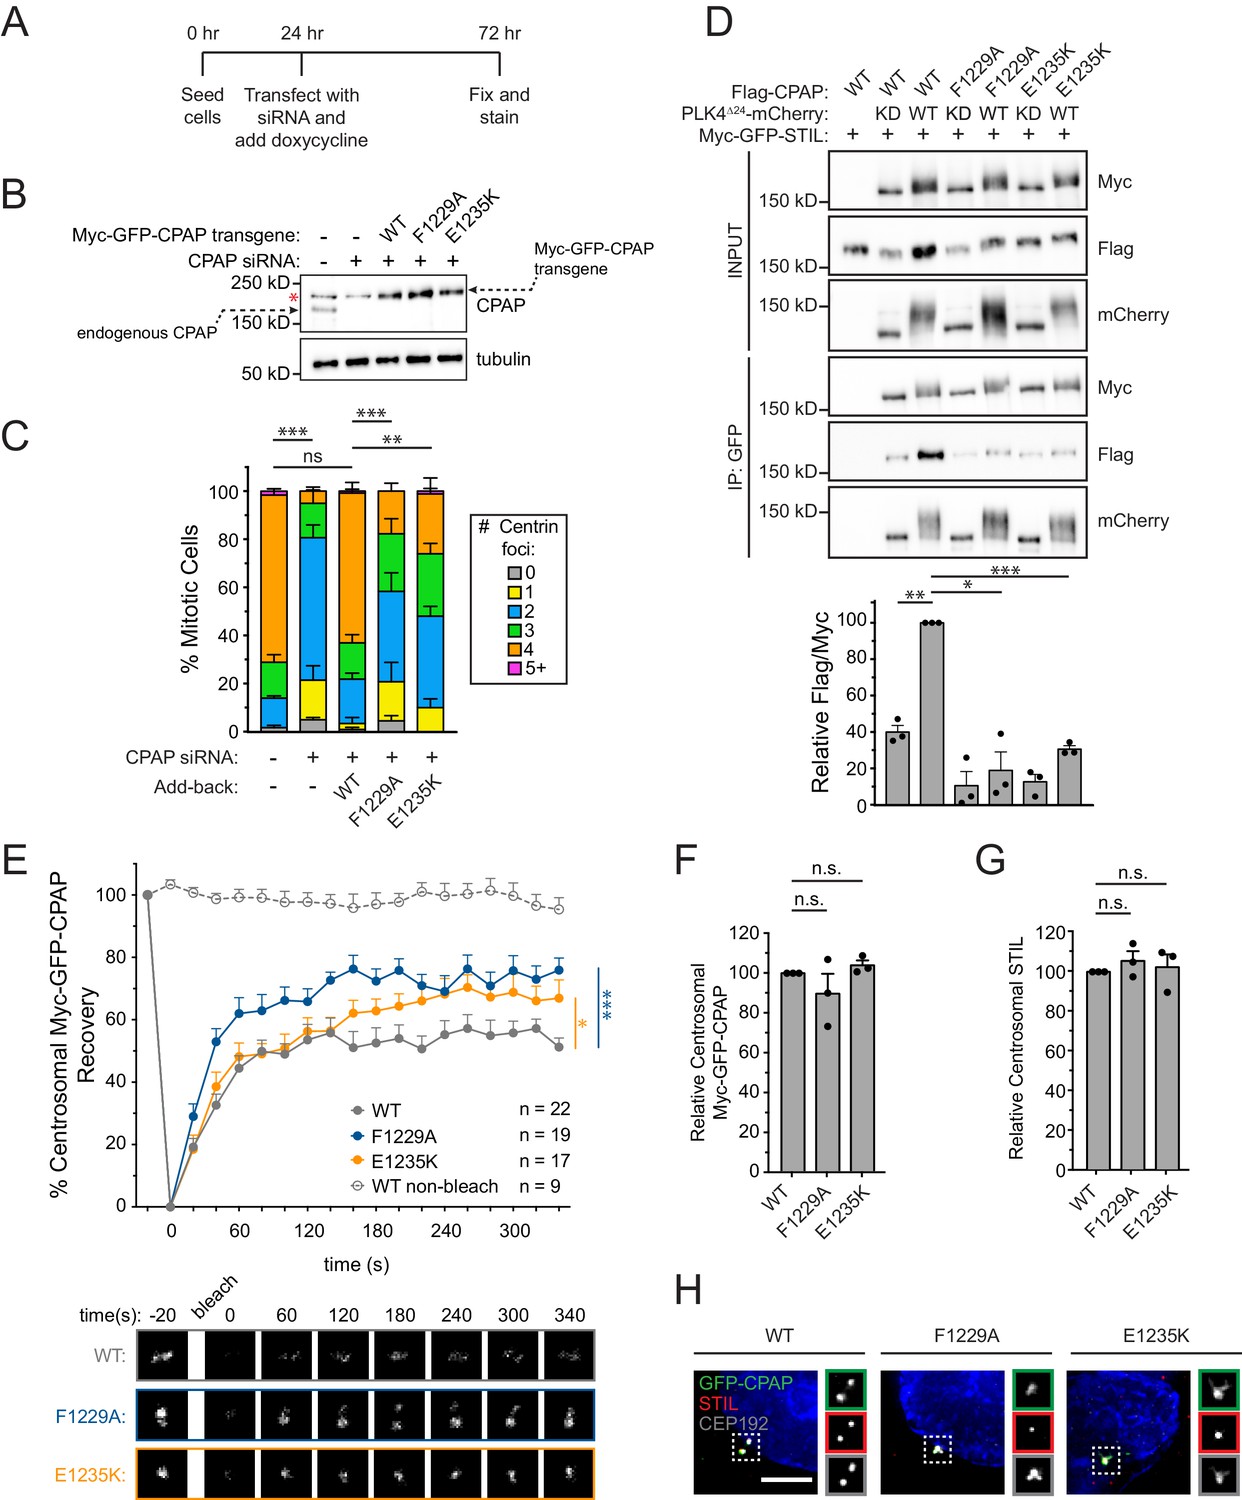
Mutations in the CPAP TCP domain cause less stable CPAP incorporation into the centrosome.
(A) Experimental outline for the CPAP RNAi-replacement experiments. (B) Immunoblot showing the Myc-GFP-CPAP transgene expression levels after knockdown of endogenous CPAP. Note that a background band (denoted by a red asterisk) appears in control lanes that overlaps with the Myc-GFP-CPAP transgene. (C) Quantification showing the number of mitotic Centrin foci in cells depleted of endogenous CPAP and induced to express a siRNA-resistant Myc-GFP-CPAP transgene as indicated. Error bars represent the standard error of the mean across three independent experiments. (D) HEK293FT cells were transfected with the indicated constructs, subjected to co-immunoprecipitation and immunoblotted with the indicated antibodies. Graph represents the mean of relative levels of immunoprecipitated Flag/Myc signal across three independent experiments. A dot indicates the average within each experiment. Error bars represent the standard error of the mean. (E) Cells were depleted of endogenous CPAP and replaced with the indicated transgene. Myc-GFP-CPAP centrosomal foci were photobleached, and fluorescence recovery was measured. The number of quantified photobleaching and recovery events is indicated. Error bars represent the standard error of the mean. Representative timepoints are shown below. Note that ‘WT’ trace is repeated from Figure 4—figure supplement 2A. (F) Quantification of the relative centrosomal levels of Myc-GFP-CPAP from S/G2 phase cells with at least 40 cells measured per experiment. Bars represent the mean of at least three independent experiments with the average within each experiment shown as a dot. Error bars represent the standard error of the mean. (G) Quantification of the relative centrosomal levels of STIL from S/G2 phase cells with at least 40 cells measured per experiment. Bars represent the mean of at least three independent experiments with the average within each experiment shown as a dot. Error bars represent the standard error of the mean. (H) Representative images from data quantified in (F) and (G). Scale bar represents 5 µm. Asterisks indicate statistically significant differences between measurements (*: p<0.05; **: p<0.005; ***: p<0.0005). For Figure 5C, statistics were calculated using an unpaired t-test against the fraction of cells containing less than four centrioles in mitosis. For Figure 5D,F and G, statistics were calculated using a one-sample t-test where mean values were tested as being different from a value of 100. For Figure 5E, statistics were calculated using an unpaired t-test against the population of recovery measurements between indicated samples at the 340 s timepoint.
-
Figure 5—source data 1
Figure 5 Data and Statistical Analysis.
- https://doi.org/10.7554/eLife.46054.022
-
Figure 5—source data 2
Figure 5—figure supplement 1 Data and Statistical Analysis.
- https://doi.org/10.7554/eLife.46054.023
Figure 5—figure supplement 1
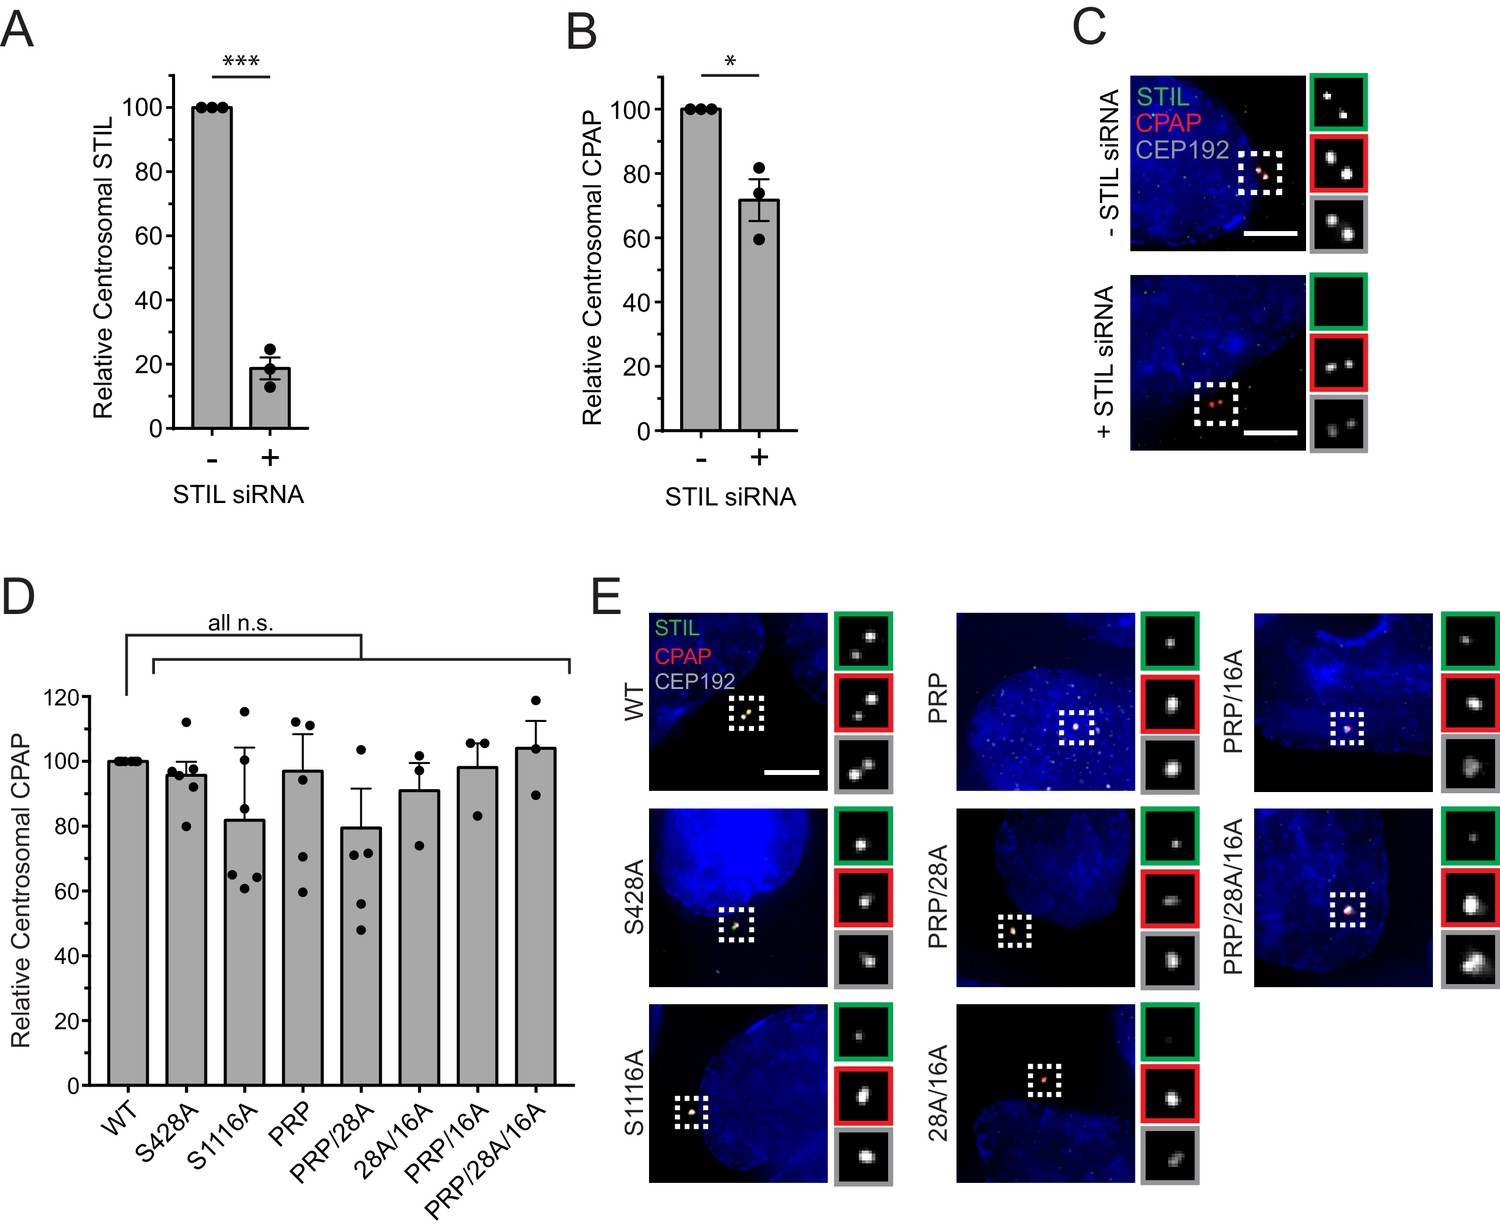
Centrosomal CPAP localization does not depend on the STIL-CPAP interaction.
(A) Quantification of the relative centrosomal levels of endogenous STIL in S/G2 phase cells 48 hr after STIL siRNA. Bars represent the mean of three independent experiments in which at least 40 cells were quantified per experiment, and the average within each experiment is shown as a dot. Error bars represent the standard error of the mean. (B) Quantification of the relative centrosomal levels of CPAP in S/G2 phase cells 48 hr after STIL siRNA. Bars represent the mean of three independent experiments in which at least 40 cells were quantified per experiment, and the average within each experiment is shown as a dot. Error bars represent the standard error of the mean. (C) Representative images from the quantification shown in (A) and (B). (D) Quantification of the relative centrosomal levels of CPAP from experiment described in Figure 3A–C in S/G2 phase cells with at least 40 cells measured per experiment. Bars represent the mean of at least three independent experiments with the average within each experiment shown as a dot. Error bars represent the standard error of the mean. (E) Representative images of data shown in (D). Scale bar represents 5 µm. Asterisks indicate statistically significant differences between measurements (*: p<0.05; **: p<0.005; ***: p<0.0005). Statistics were calculated using a one-sample t-test where mean values were tested as being different from a value of 100.
Figure 6 with 1 supplement
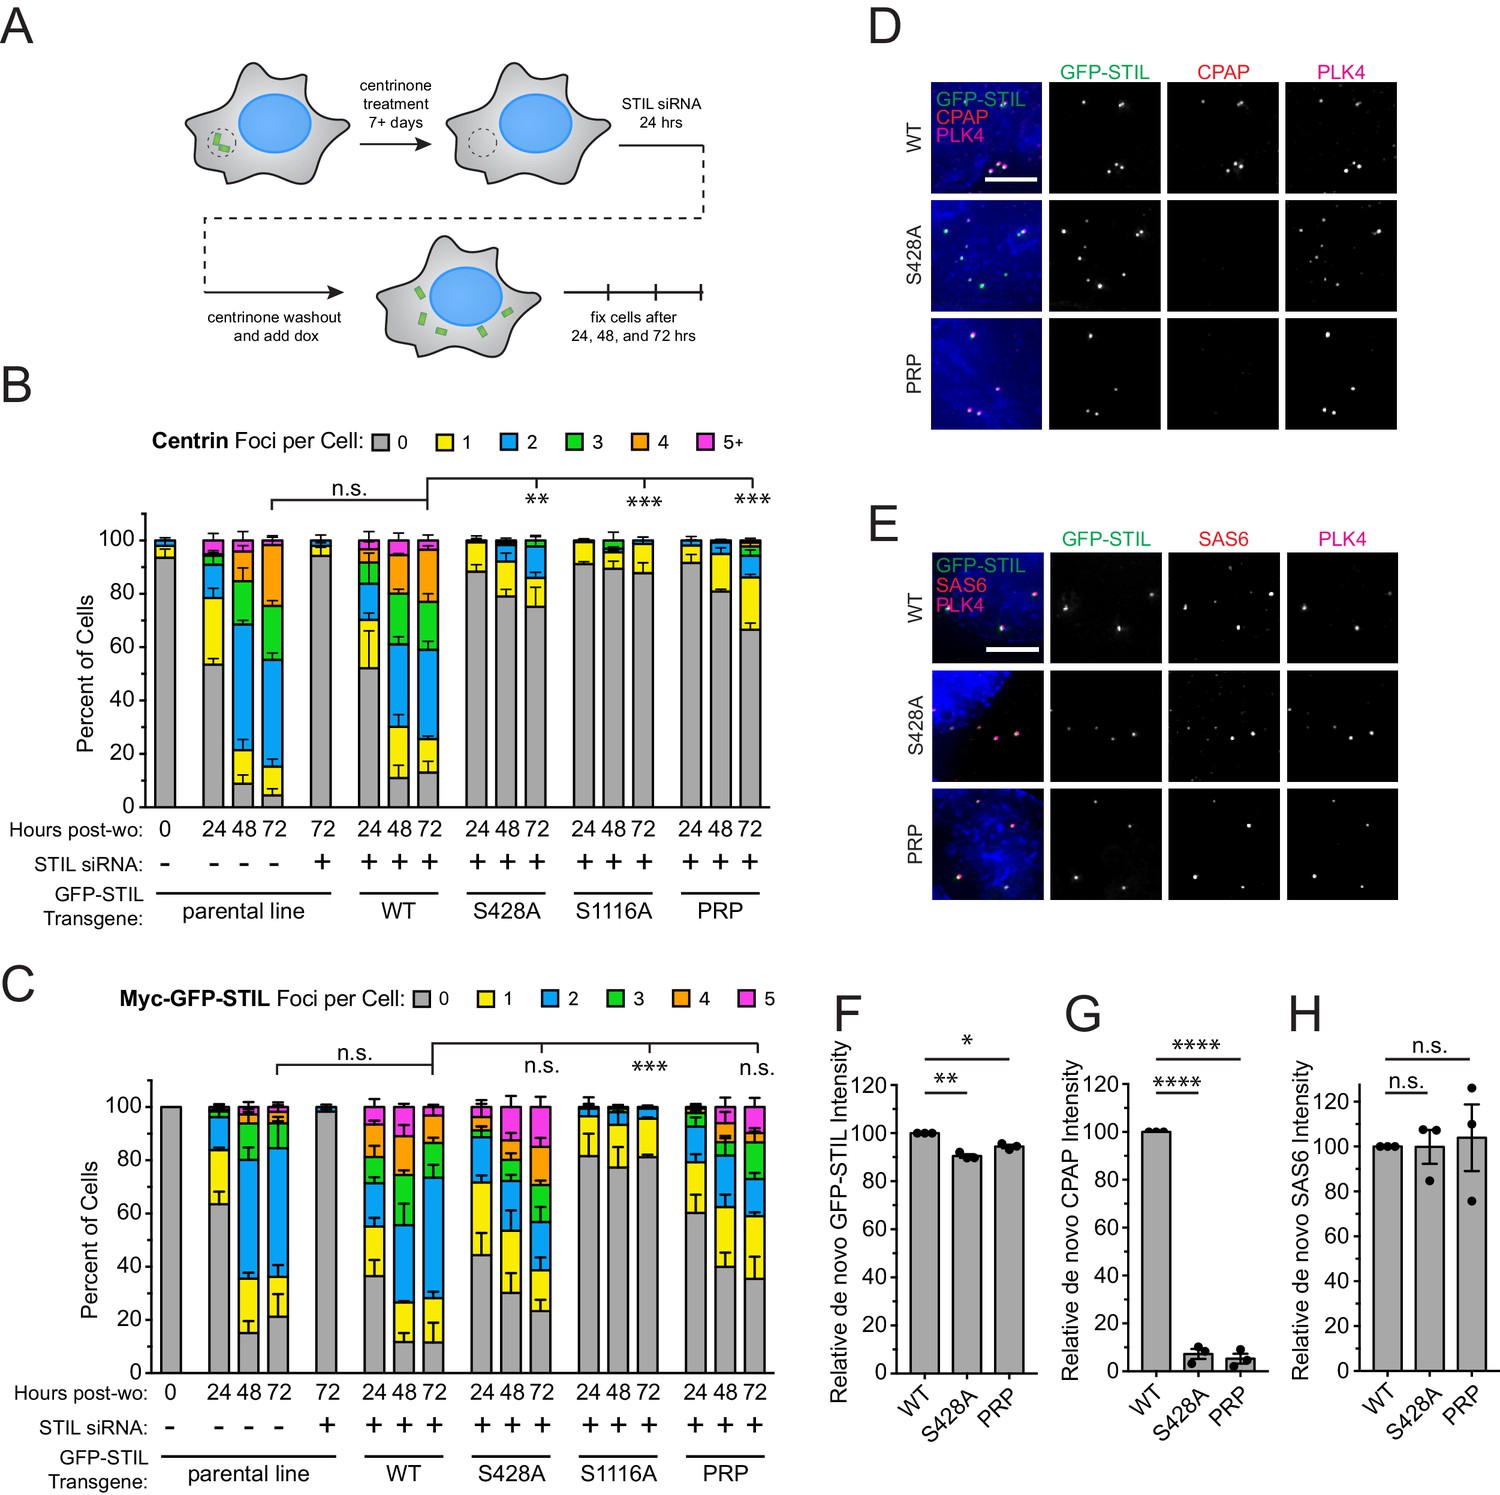
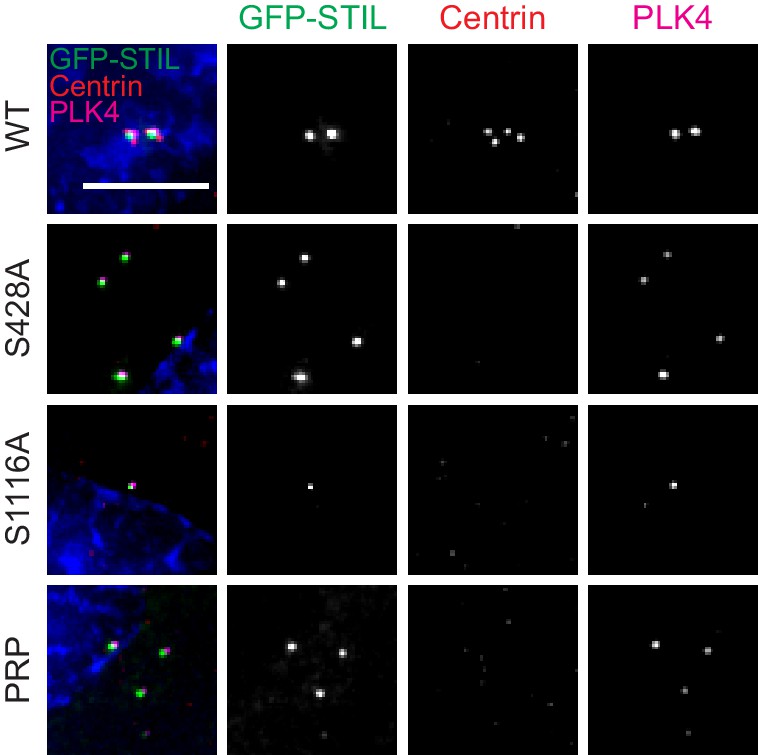
STIL S428 phosphorylation is required for recruitment of CPAP to de novo centrioles.
(A) Experimental outline for de novo centriole assembly assay. DLD-1 cells were maintained in 500 nM centrinone for seven or more days to deplete centrioles, and then endogenous STIL was knocked down with siRNA. Twenty-four hours later, centrinone was washed out, and the expression of a siRNA-resistant Myc-GFP-STIL transgene was induced with doxycycline. Cells were analyzed at 24, 48, and 72 hr post-centrinone washout. (B) Quantification showing the number of Centrin foci in interphase cells under the indicated conditions. Bars represent the mean of three independent experiments in which at least 40 cells were counted per condition. Error bars represent the standard error of the mean. ‘Post-wo’ refers to post-washout. A Centrin focus was counted as a de novo centriole if it overlapped with a PLK4 focus (see Figure 5—figure supplement 1). (C) Quantification showing the number of Myc-GFP-STIL foci, or endogenous STIL foci in parental line, in cells under the indicated conditions. ‘Post-wo’ refers to post-washout. Bars represent the mean of three independent experiments in which at least 40 cells were counted per condition. Error bars represent the standard error of the mean. (D) Representative images of de novo centriole formation showing CPAP localization. Cells were fixed at 24 hr post-centrinone washout. Scale bar represents 5 µm. (E) Representative images of de novo centriole formation showing SAS6 localization. Cells were fixed at 24 hr post-centrinone washout. Scale bar represents 5 µm. (F–H) Quantification of the relative localization of (F) Myc-GFP-STIL, (G) CPAP, and (H) SAS6 at de novo centrioles at 24 hr post-centrinone washout. Bars represent the mean of three independent experiments in which at least 40 cells were quantified per mutant, and a dot indicates the average within each experiment. Error bars represent the standard error of the mean. Asterisks indicate statistically significant differences between measurements (*: p<0.05; **: p<0.005; ***: p<0.0005; ****: p<0.0001). For Figure 6B and C, statistics were calculated using an unpaired t-test against the fraction of cells containing no Centrin foci or GFP-STIL foci, respectively, after 72 hr post-washout. For Figure 6F,G and H, statistics were calculated using a one-sample t-test where mean values were tested as being different from a value of 100.
-
Figure 6—source data 1
Figure 6 Data and Statistical Analysis.
- https://doi.org/10.7554/eLife.46054.026
Figure 6—figure supplement 1
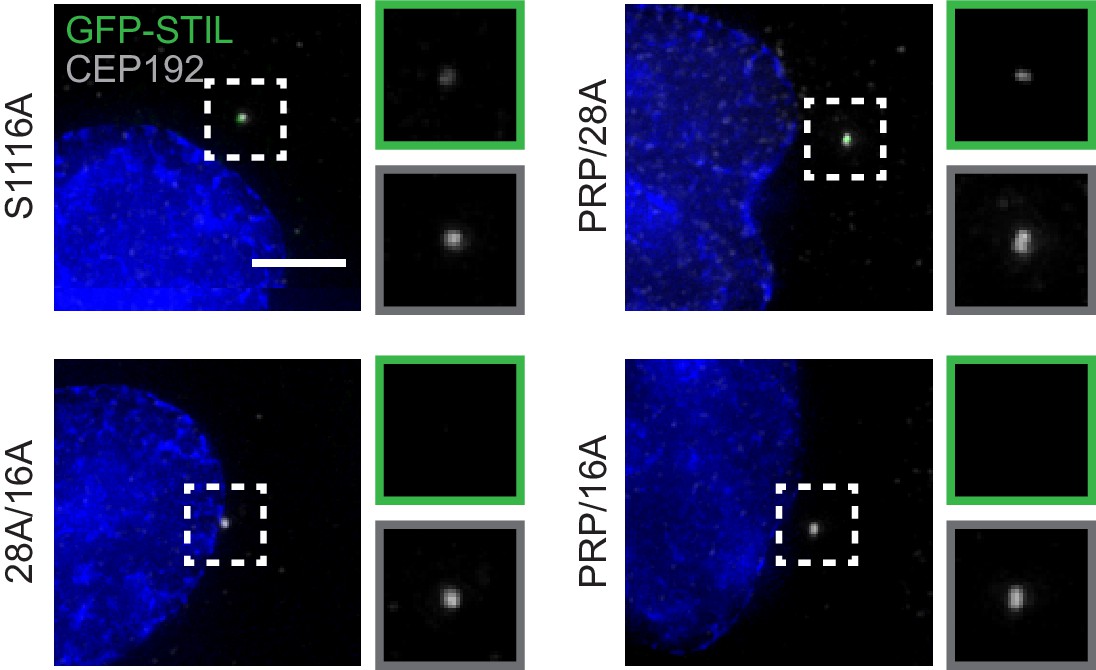
De novo centriole formation requires phosphorylation of STIL S428 and S1116 by PLK4.
Representative images of de novo centriole formation at 72 hr after centrinone washout. Scale bar represents 5 µm.
Figure 7
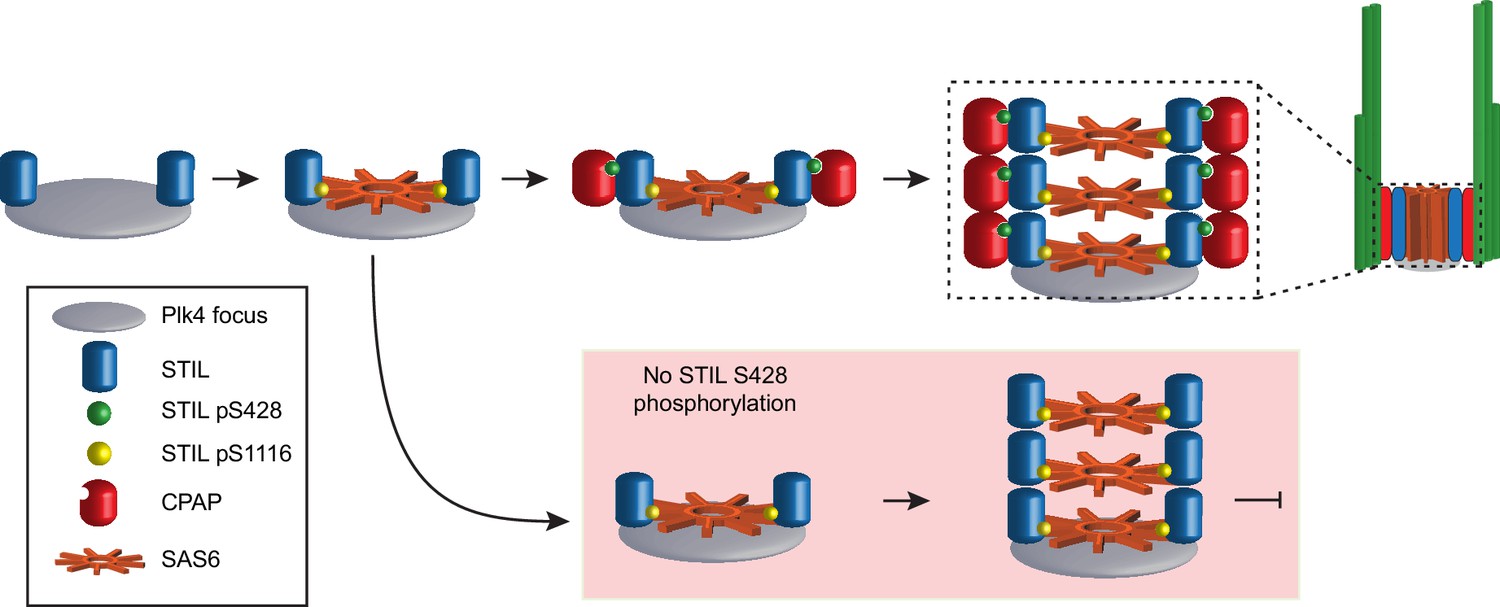
Model depicting the early stages of de novo centriole formation.
A PLK4 focus forms and phosphorylates STIL at S1116 in the STAN motif to recruit SAS6 and initiate cartwheel assembly. Phosphorylation of STIL at S428 by PLK4 promotes CPAP binding and connects the growing cartwheel to the triplet microtubules of the centriole wall. In the absence of STIL S428 phosphorylation, STIL is able to recruit SAS6 and promote cartwheel assembly. However, STIL S428A fails to recruit CPAP and link the cartwheel to the microtubule wall, leading to a failure of de novo centriole assembly. In the absence of STIL S1116 phosphorylation, STIL is not effectively recruited to a PLK4 focus and cartwheel assembly fails.
Tables
Key resources table
| Reagent type (species) or resource | Designation | Source or reference | Identifiers | Additional information |
|---|---|---|---|---|
| Cell line (H. sapien) | DLD-1 LacZeo | Moyer et al., 2015. DOI: 10.1083/jcb.201502088 | available upon request | |
| Cell line (H. sapien) | DLD-1 LacZeo; Myc-GFP-STIL WT | Moyer et al., 2015. DOI: 10.1083/jcb.201502088 | available upon request | |
| Cell line (H. sapien) | DLD-1 LacZeo; Myc-GFP-STIL S1116A | Moyer et al., 2015. DOI: 10.1083/jcb.201502088 | available upon request | |
| Cell line (H. sapien) | DLD-1 LacZeo; Myc-GFP-STIL S428A | this study | DLD-1 cell line in which a Myc-GFP-STIL construct with indicated mutation is integrated at a single locus | |
| Cell line (H. sapien) | DLD-1 LacZeo; Myc-GFP-STIL PRP | this study | DLD-1 cell line in which a Myc-GFP-STIL construct with indicated mutation is integrated at a single locus | |
| Cell line (H. sapien) | DLD-1 LacZeo; Myc-GFP-STIL PRP/28A | this study | DLD-1 cell line in which a Myc-GFP-STIL construct with indicated mutation is integrated at a single locus | |
| Cell line (H. sapien) | DLD-1 LacZeo; Myc-GFP-STIL 28A/16A | this study | DLD-1 cell line in which a Myc-GFP-STIL construct with indicated mutation is integrated at a single locus | |
| Cell line (H. sapien) | DLD-1 LacZeo; Myc-GFP-STIL PRP/16A | this study | DLD-1 cell line in which a Myc-GFP-STIL construct with indicated mutation is integrated at a single locus | |
| Cell line (H. sapien) | DLD-1 LacZeo; Myc-GFP-STIL PRP/28A/16A | this study | DLD-1 cell line in which a Myc-GFP-STIL construct with indicated mutation is integrated at a single locus | |
| Cell line (H. sapien) | DLD-1 LacZeo; Myc-GFP-CPAP WT | this study | DLD-1 cell line in which a Myc-GFP-CPAP construct with indicated mutation is integrated at a single locus | |
| Cell line (H. sapien) | DLD-1 LacZeo; Myc-GFP-CPAP F1229A | this study | DLD-1 cell line in which a Myc-GFP-CPAP construct with indicated mutation is integrated at a single locus | |
| Cell line (H. sapien) | DLD-1 LacZeo; Myc-GFP-CPAP E1235K | this study | DLD-1 cell line in which a Myc-GFP-CPAP construct with indicated mutation is integrated at a single locus | |
| Cell line (H. sapien) | DLD-1 LacZeo; Myc-STIL-T2A-GFP-CPAP | this study | DLD-1 cell line in which a Myc-STIL-T2A-GFP-CPAP construct with indicated mutation is integrated at a single locus | |
| Cell line (H. sapien) | DLD-1 LacZeo; Myc-STIL S428A -T2A-GFP-CPAP | this study | DLD-1 cell line in which a Myc-STIL-T2A-GFP-CPAP construct with indicated mutation is integrated at a single locus | |
| Cell line (H. sapien) | DLD-1 LacZeo; Myc-STIL PRP -T2A-GFP-CPAP | this study | DLD-1 cell line in which a Myc-STIL-T2A-GFP-CPAP construct with indicated mutation is integrated at a single locus | |
| Cell line (H. sapien) | DLD-1 LacZeo; Myc-STIL S1116A -T2A-GFP-CPAP | this study | DLD-1 cell line in which a Myc-STIL-T2A-GFP-CPAP construct with indicated mutation is integrated at a single locus | |
| Antibody | Mouse monoclonal, Myc | EMD Millipore | Cat. No. 05–724 | (WB) use 1:1000 |
| Antibody | Mouse monoclonal, Flag | Sigma | Cat. No. F1804 | (WB) use 1:1000 |
| Antibody | Rabbit polyclonal, mCherry | gift from Joo Soek-Han | (WB) use 1:1000 | |
| Antibody | Rabbit polyclonal, STIL (WB) | Bethyl | Cat. No. A302-441A | (WB) use 1:2500 |
| Antibody | Rabbit polyclonal, STIL pS428 | this study | see Materials and methods. (WB) use 1:1000 | |
| Antibody | Rabbit polyclonal, STIL pS1116 | Moyer et al., 2015. DOI: 10.1083/jcb.201502088 | (WB) use 1:1000 | |
| Antibody | Rabbit polyclonal, STIL pS1108 | Moyer et al., 2015. DOI: 10.1083/jcb.201502088 | (IF) use 1:250 | |
| Antibody | Mouse monoclonal, tubulin | Sigma | Cat. No. T6199 | (WB) use 1:1000 |
| Antibody | Rabbit polyclonal, Plk4 pT170 | this study | see Materials and methods. (WB) use 1:1000 | |
| Antibody | Goat polyclonal, CEP192 | this study | see Materials and methods. (IF) use 1:1000 | |
| Antibody | Rabbit polyclonal, Centrin | this study | see Materials and methods. (IF) use 1:1000 in | |
| Antibody | Rabbit polyclonal, CPAP | gift from Karen Oegema | (WB or IF) use 1:1000 | |
| Antibody | Rabbit polyclonal, STIL (IF) | Moyer et al., 2015. DOI: 10.1083/jcb.201502088 | (IF) use 1:250 | |
| Antibody | Rabbit polyclonal, Plk4 | Moyer et al., 2015. DOI: 10.1083/jcb.201502088 | (IF) use 1:1000 | |
| Antibody | Mouse monoclonal, SAS6 | Santa Cruz | Cat. No. sc-81431 | (IF) use 1:200 |
| Chemical compound, drug | centrinone | Tocris Bioscience | Cat. No. 5687 | use at 500 nM |
Additional files
-
Transparent reporting form
- https://doi.org/10.7554/eLife.46054.028
Download links
A two-part list of links to download the article, or parts of the article, in various formats.
Downloads (link to download the article as PDF)
Open citations (links to open the citations from this article in various online reference manager services)
Cite this article (links to download the citations from this article in formats compatible with various reference manager tools)
PLK4 promotes centriole duplication by phosphorylating STIL to link the procentriole cartwheel to the microtubule wall
eLife 8:e46054.
https://doi.org/10.7554/eLife.46054


