Lola regulates Drosophila adult midgut homeostasis via non-canonical hippo signaling
- Chinese Academy of Sciences, University of Chinese Academy of Sciences, China
- Shanghai Jiao Tong University, China
- ShanghaiTech University, China
Figures
Figure 1 with 1 supplement
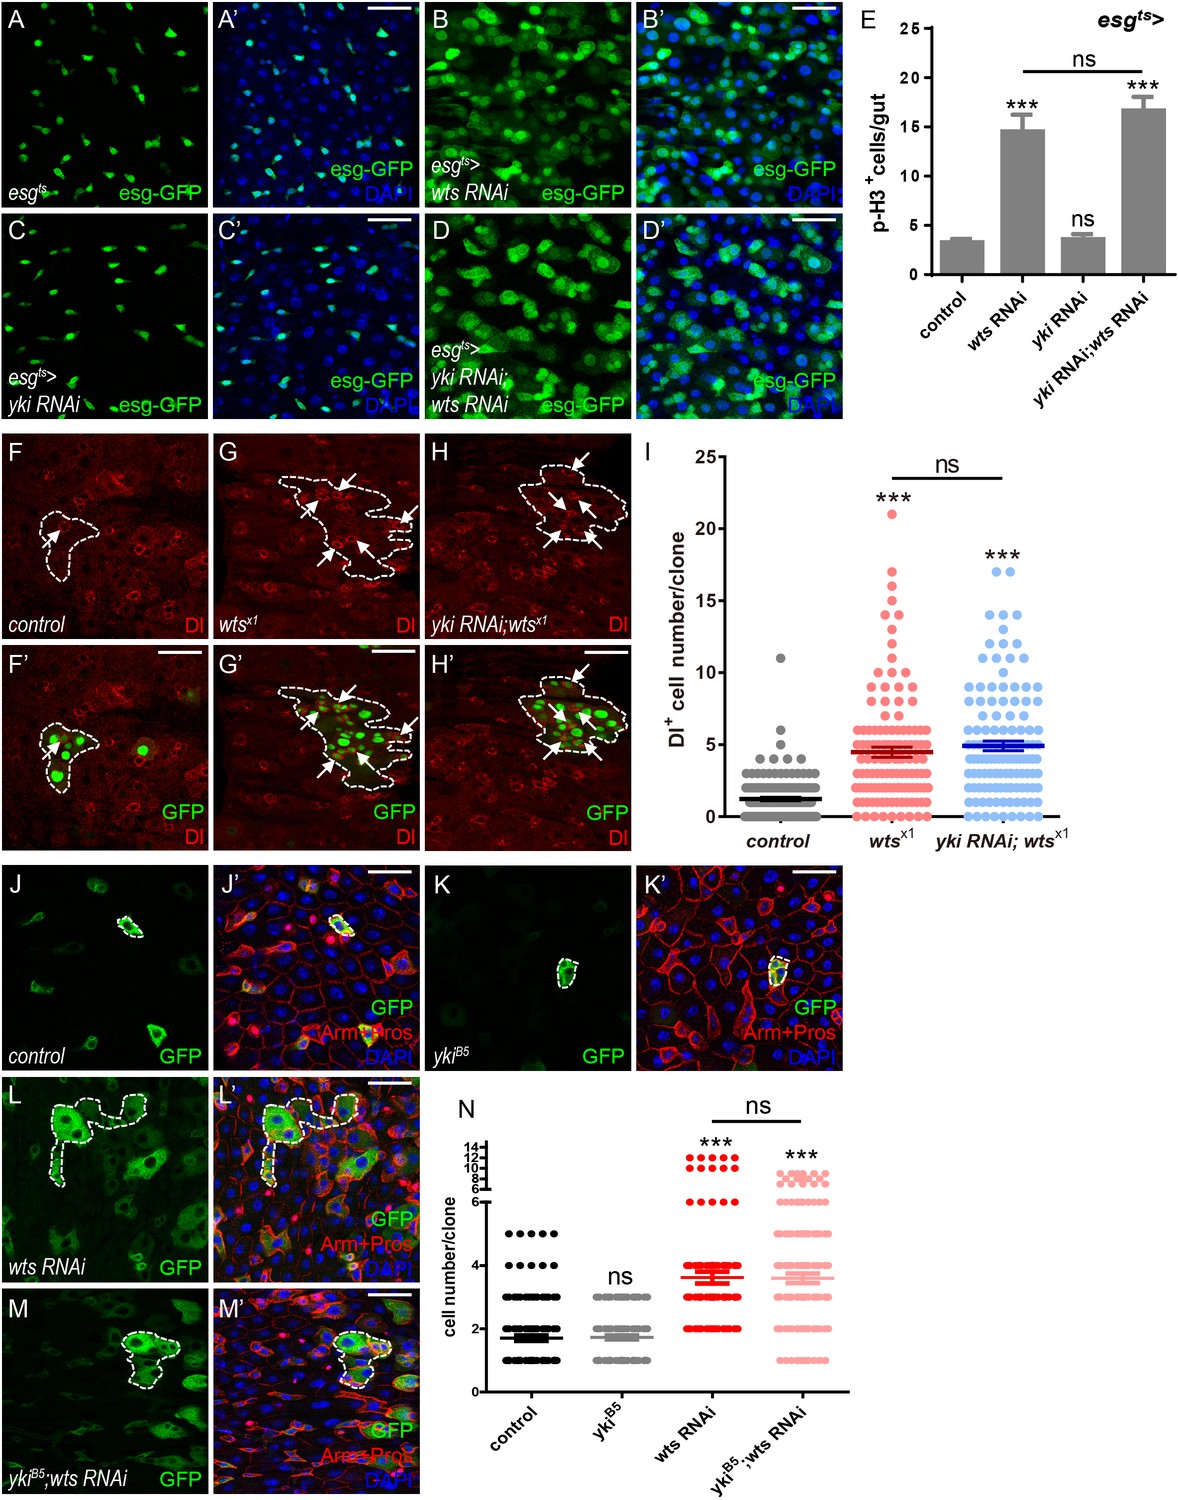
Yki is dispensable for Wts-mediated ISC proliferation in Drosophila midgut.
(A–D’) Representative images of Drosophila adult midguts of esg-Gal4; tubGal80ts (esgts) (A–A’), esgts >wts RNAi (B–B’), esgts >yki RNAi (C–C’), and esgts >yki RNAi; wts RNAi (D–D’). Midguts were dissected and immunostained with DAPI (nuclei, blue). ISCs and EBs are marked with esg-GFP (green). Merged images are shown in A’, B’, C’, and D’ (green and blue). (E) Quantifications of the p-H3+ cell number in adult midguts with the indicated genotypes in A-D (n = 20, 21, 22, 16). Note a significant increase in the p-H3+ cell number when wts RNAi is expressed (***p<0.001). Co-expression of yki and wts RNAi does not suppress the increase (ns p>0.05). (F–H’) Representative images of Drosophila adult midguts containing GFP positive MARCM clones of control (F–F’), wtsx1 (G–G’) and wtsx1 in the presence of yki RNAi (H–H’). Midguts were dissected and immunostained with antibodies against Dl (red) 4 days after clone induction. Areas enclosed by the dashed lines indicate clone regions. White arrows indicate ISCs marked by Dl. Merged images are shown in F’, G’ and H’ (green and red). (I) Quantifications of the Dl+ cell number per clone in adult midguts from the indicated genotypes in F-H. Average of 124–152 clones from 10 midguts for each genotype were quantified. (J–M’) Representative images of Drosophila adult midguts containing GFP positive MARCM clones of control (J–J’), ykiB5 (K–K’), wts RNAi (L–L’), and ykiB5 in the presence of wts RNAi (M–M’). Midguts were dissected 2 days after clone induction and immunostained with antibodies against Arm and Pros (red) and DAPI (nuclei, blue). Areas enclosed by the dashed lines indicate respective clone size. Merged images are shown in J’, K’, L’, and M’ (green, blue, and red). (N) Quantifications of the cell number per clone in adult midguts from the indicated genotypes in H-K. Note that ykiB5 does not restore the large clone size induced by wts RNAi expression (red). Average of 122–176 clones from 10 midguts for each genotype were quantified. Scale bars: 30 μm. Data are shown as mean ± SEM. P-values of significance (indicated with asterisks, ns no significance p>0.05, *p<0.05, **p<0.01, and ***p<0.001) are calculated by Student’s T-test. Confocal images were taken from the basal layer of the midgut where ISCs can be clearly visualized. Single layer image is shown.
Figure 1—figure supplement 1

Yki is dispensable for Wts-mediated ISC proliferation in Drosophila midgut (A)Relative wts mRNA levels were analyzed by real-time PCR.
Total RNAs were collected from wing discs of MS1096-Gal4 (black bar), MS1096-Gal4 > wts RNAi-1 (red bar), and MS1096-Gal4 > wts RNAi-2 (blue bar). Note a significant decrease in the mRNA levels when wts RNAi is expressed (**p<0.01 and ***p<0.001). (B-E) Representative images of Drosophila adult midguts of esg-Gal4; tubGal80ts (esgts) (B), esgts >wts RNAi-2 (C), esgts >yki RNAi (D), and esgts >yki RNAi; wts RNAi-2 (E). ISCs and EBs are marked with esg-GFP (green). (F) Quantifications of the p-H3+ cell number in adult midguts from the indicated genotypes in B-E (n = 14, 13, 14, 12). Note a significant increase in the p-H3+ cell number when wts RNAi-2 is expressed (*p<0.05). (G-J) Representative images of female wings from flies of control (G), MS1096-Gal4 > wts RNAi (H), MS1096-Gal4 > yki RNAi (I), and MS1096-Gal4 > yki RNAi; wts RNAi (J). Control wing size is marked by a white dashed line for comparison (G-J). (K) Quantifications of relative wing sizes (normalized to the control wing size) from flies with the indicated genotypes in G-J (n = 16, 22, 10, 11). Wing sizes were quantified using ImageJ software by measuring the area of wings. Note a significant increase in the wing size when wts RNAi is expressed (***p<0.001). Co-expression of yki and wts RNAi rescues the increase (***p<0.001). (L-O’) Representative images of adult midguts containing GFP positive MARCM clones of control (L-L’), sd∆B1 (M-M’), wts RNAi (N-N’), and sd∆B1 in the presence of wts RNAi (O-O’). Midguts were dissected 4 days after clone induction and immunostained with DAPI (blue). Areas enclosed by the dashed lines indicate respective clone size. Merged images are shown in L’, M’, N’, and O’ (green and blue). (P) Quantifications of the cell number per clone in adult midguts from the indicated genotypes in L-O. Note that sd∆B1 partially suppresses the large clone size induced by wts RNAi (*p<0.05). Average 90–110 clones from 10 midguts were quantified for each genotype. Scale bars: 30 μm in B-E, L’-O’; 500 μm in G-J. Data are shown as mean ± SEM. P-values of significance (indicated with asterisks, ns no significance p>0.05, *p<0.05, **p<0.01, and ***p<0.001) are calculated by Student’s T-test. At least 10 midguts or female wings were dissected for each genotype. Confocal images were taken from the basal layer of the midgut where ISCs can be clearly visualized. Single layer image is shown.
Figure 2 with 1 supplement
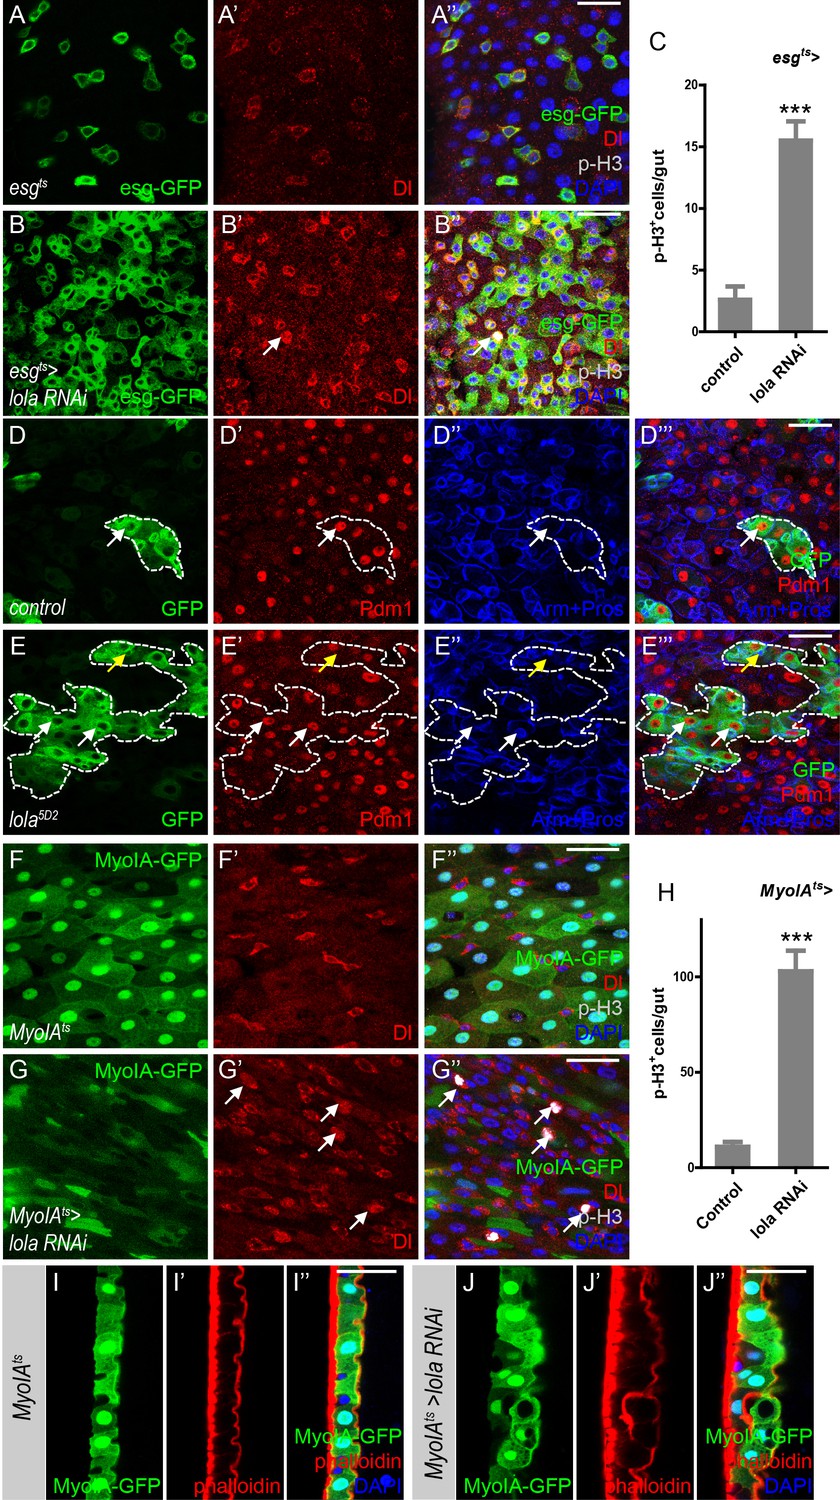
Lola is required for ISC proliferation and midgut homeostasis.
(A–B’’) Representative images of Drosophila adult midguts of esgts (A–A’) and esgts >lola RNAi (B–B’’). Midguts were dissected and immunostained with antibodies against Dl (red), p-H3 (gray), and DAPI (nuclei, blue). ISCs and EBs are marked with esg-GFP (green). White arrows indicate proliferative ISCs marked by Dl and p-H3 (B’ and B’’). Merged images are shown in A’’ and B’’ (green, red, gray, and blue). (C) Quantifications of the p-H3+ cell number in adult midguts with the indicated genotypes in A and B (n = 9, 10). Note a significant increase in the p-H3+ cell number when lola RNAi is expressed (***p<0.001). (D–E’’’) Representative images of Drosophila adult midguts containing GFP positive MARCM clones of control (D–D’’’) and the hypomorphic allele lola5D2 (E–E’’’). Midguts were dissected 4 days after clone induction and immunostained with antibodies against Arm and Pros (blue) and Pdm1 (red). Areas enclosed by the dashed lines indicate respective clone size. White arrows indicate Pdm1+ ECs, and yellow arrows indicate Pros+ ee cells. Merged images are shown in D’’’ and E’’’ (green, red, and blue). (F–G’’) Representative images of Drosophila adult midguts of MyoIA-Gal4; tubGal80ts (MyoIAts) (F–F’’) and MyoIAts > lola RNAi (G–G’’). Midguts were dissected and immunostained with antibodies against Dl (red), p-H3 (gray), and DAPI (blue). ECs are marked with MyoIA-GFP (green). White arrows indicate proliferative ISCs marked by Dl and p-H3 (G’ and G’’). Merged images are shown in F’’ and G’’ (green, red, gray, and blue). (H) Quantifications of the p-H3+ cell number in adult midguts from the indicated genotypes in F and G (n = 10, 10). Note a significant increase in the p-H3+ cell number when lola RNAi is expressed (***p<0.001). (I–J’’) Representative images of cross section of Drosophila adult midguts from MyoIAts (I–I’’) and MyoIAts > lola RNAi (J–J’’) immunostained with antibodies against phalloidin (red) and DAPI (blue). Merged images are shown in I’’ and J’’ (green, red, and blue). Scale bars: 30 μm in A’’, B’’, D’’’, E’’’; 25 μm in F’’, G’’, I’’, J’’. Data are shown as mean ± SEM. ***p<0.001 by Student’s T-test. Confocal images were taken from the basal layer of the midgut where ISCs can be clearly visualized except in I-J’’. Single layer image is shown.
-
Figure 2—source data 1
Source data for Figure 2C, Figure 2H, Figure 2—figure supplement 1D, and Figure 2—figure supplement 1G.
- https://cdn.elifesciences.org/articles/47542/elife-47542-fig2-data1-v2.xlsx
Figure 2—figure supplement 1
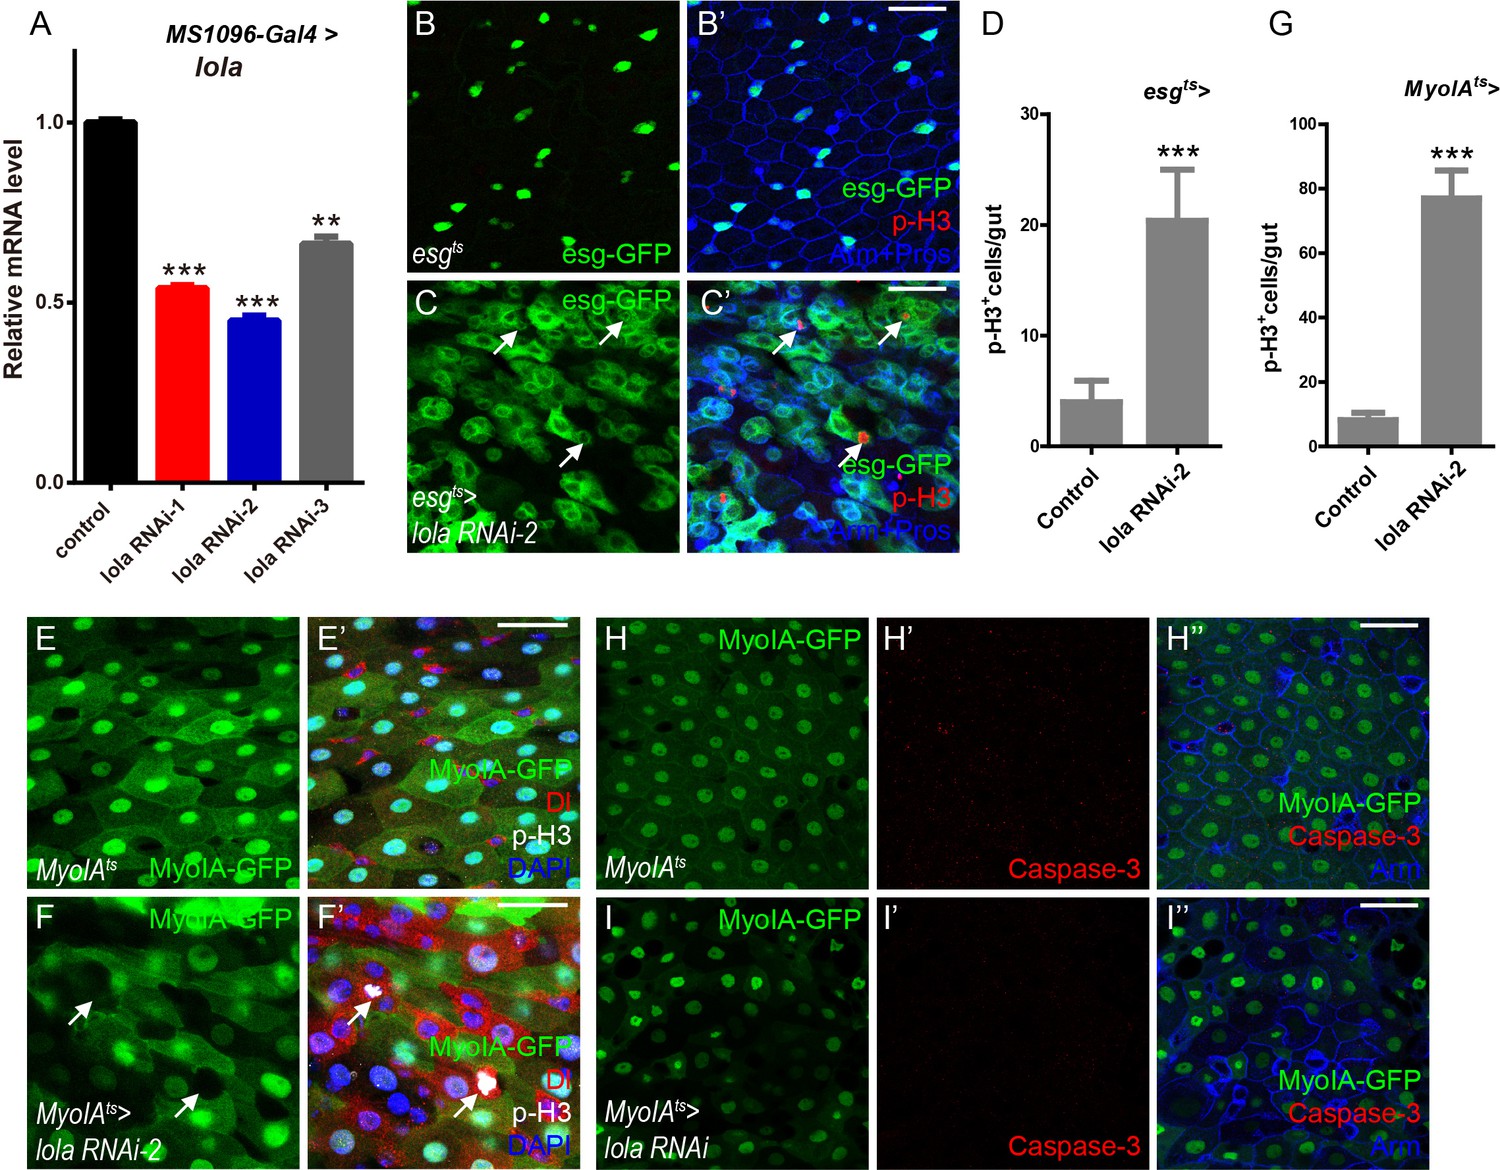
Lola is required for ISC proliferation and midgut homeostasis (A)Relative lola mRNA levels were analyzed by real-time PCR.
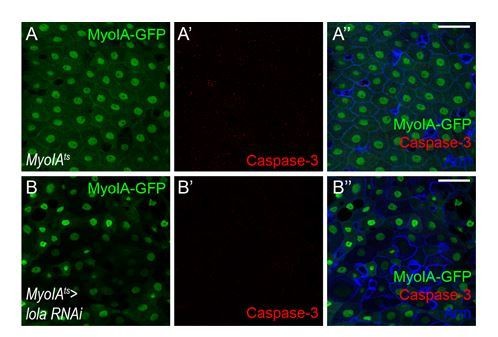
Total RNAs were collected from wing discs of MS1096-Gal4 (black bar), MS1096-Gal4 > lola RNAi-1 (red bar), MS1096-Gal4 > lola RNAi-2 (blue bar), and MS1096-Gal4 > lola RNAi-3 (gray bar). Note a significant decrease in the mRNA levels when lola RNAi is expressed (**p<0.01 and ***p<0.001). (B-C’) Representative images of adult midguts of esgts (B-B’) and esgts >lola RNAi-2 (C-C’). Midguts were immunostained with p-H3 (red) and Arm and Pros (blue). ISCs and EBs are marked with esg-GFP (green). White arrows indicate cells marked by p-H3. Merged images are shown in B’ and C’ (green, red, and blue). (D) Quantification of the p-H3+ cell number in adult midguts from the indicated genotypes in B and C (n = 5, 5). Note a significant increase in the p-H3+ cell number when lola RNAi-2 is expressed (***p<0.001). (E-F’) Representative images of adult midguts of MyoIA-Gal4; tubGal80ts (MyoIAts) (E-E’) and MyoIAts > lola RNAi-2 (F-F’). Midguts were immunostained with Dl (red), p-H3 (gray), and DAPI (nuclei, blue). ECs are marked with MyoIA-GFP (green). White arrows indicate proliferative ISCs marked by Dl and p-H3. Merged images are shown in E’ and F’ (green, red, gray, and blue). ECs were marked by MyoIA-Gal4 driven GFP expression. (G) Quantification of the p-H3+ cell number in adult midguts from the indicated genotypes in E and F (n = 5, 5). Note a significant increase in the p-H3+ cell number when lola RNAi-2 is expressed (***p<0.001). (H-I’’) Representative images of adult midguts of MyoIA-Gal4; tubGal80ts (MyoIAts) (H-H’’) and MyoIAts > lola RNAi (I-I’’) immunostained with Caspase-3 (red), and Arm (blue). Merged images are shown in H’’ and I’’ (green, red, and blue). Scale bars: 30 μm in B’, C’, H’’, I’’; 25 μm in E’, F’. Data are shown as mean ± SEM. **p<0.01 and ***p<0.001 by Student’s T-test. At least 10 midguts were dissected for each genotype. Confocal images were taken from the basal layer of the midgut where ISCs can be clearly visualized. Single layer image is shown.
Figure 3
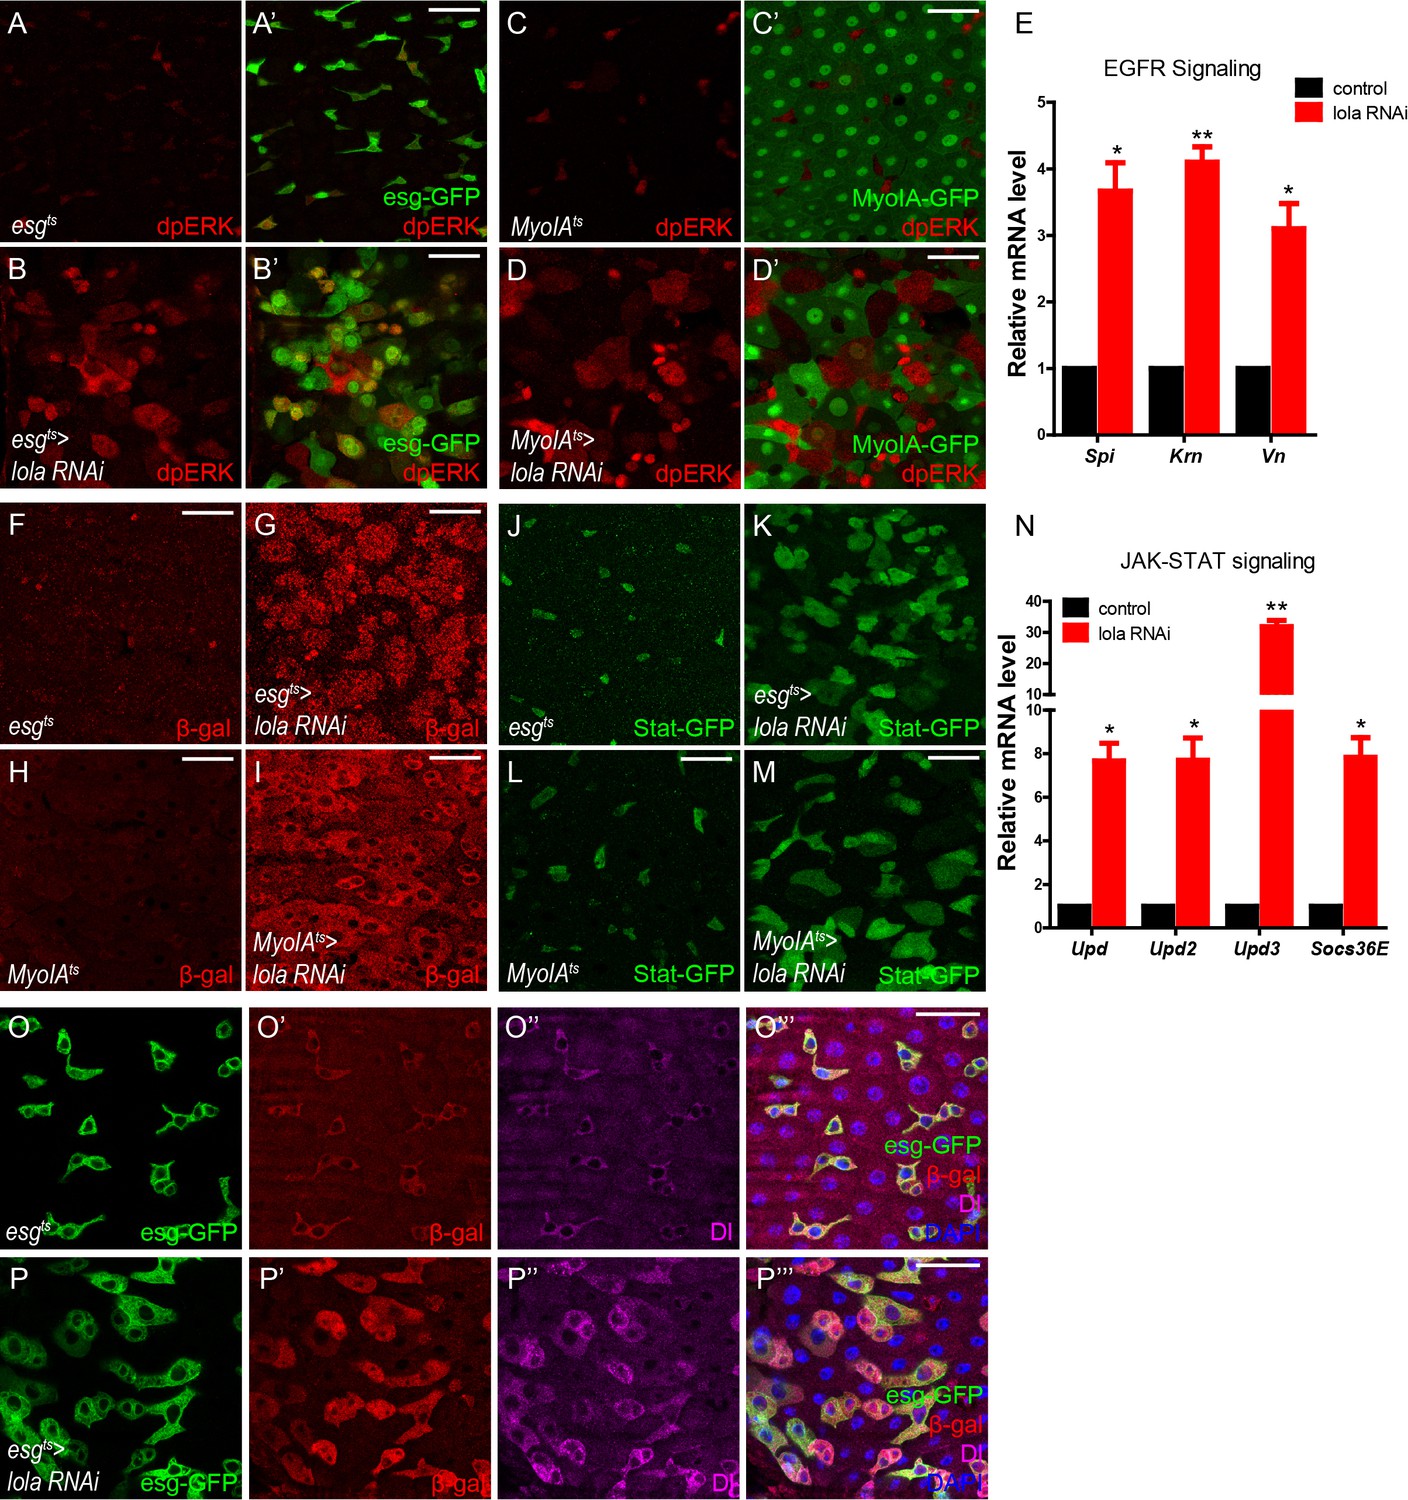
Loss of Lola activates EGFR, JAK-STAT, and microRNA bantam signaling.
(A–B’) Representative images of Drosophila adult midguts of esgts (A–A’) and esgts >lola RNAi (B–B’) immunostained with dpERK (red). ISCs and EBs are marked with esg-GFP (green). Merged images are shown in A’ and B’ (green and red). Note the increased dpERK signal in lola RNAi guts compared with control. (C–D’) Representative images of Drosophila adult midguts of MyoIAts (C–C’) and MyoIAts > lola RNAi (D–D’) immunostained with dpERK (red). ECs are marked with MyoIA -GFP (green). Merged images are shown in C’ and D’ (green and red). Note the increased dpERK signal in lola RNAi guts compared with control. (E) Relative mRNA levels of EGFR ligands Spi, Krn, and Vn were analyzed by real-time PCR. Total RNAs were collected from whole midguts of the indicated genotypes: MyoIAts (black bars) and MyoIAts > lola RNAi (red bars). Note a significant increase in the mRNA levels when lola RNAi is expressed (*p<0.05 and **p<0.01). (F–I) Representative images of Drosophila adult midguts of esg-Gal4; tubGal80ts/Upd3 LacZ (esgts/Upd3 LacZ) (F), esgts/Upd3 LacZ>lola RNAi (G), MyoIA-Gal4; tubGal80ts/Upd3 LacZ (MyoIAts/Upd3 LacZ) (F), and MyoIAts/Upd3 LacZ>lola RNAi (G) immunostained with β-gal (red). Note an increase in Upd3-LacZ levels marked by β-gal when lola RNAi is expressed in either precursors or ECs. (J–M) Representative images of Drosophila adult midguts of esg-Gal4/Stat GFP; tubGal80ts (esgts/Stat GFP) (J), esgts/Stat GFP>lola RNAi (K), MyoIA-Gal4/Stat GFP; tubGal80ts (MyoIAts/Stat GFP) (L), and MyoIAts/Stat GFP>lola RNAi (M) immunostained with GFP (green). Note the increased Stat-GFP signal when lola RNAi is expressed in either precursors or ECs. (N) Relative mRNA levels of JAK-STAT ligands Upd, Upd2, Upd3, and EGFR downstream gene target Socs36E were analyzed by real-time PCR. Total RNAs were collected from whole midguts of the indicated genotypes: MyoIAts (black bars) and MyoIAts > lola RNAi (red bars). Note a significant increase in the mRNA levels when lola RNAi is expressed (*p<0.05 and **p<0.01). (O–P’’’) Representative images of Drosophila adult midguts of esgts/bantam-LacZ (O–O’’’), and esgts/bantam-LacZ >lola RNAi (P–P’’’) immunostained with β-gal (red), Dl (magenta), and DAPI (nuclei, blue). ISCs and EBs are marked with esg-GFP (green). Merged images are shown in O’’’, and P’’’ (green, red, magenta, and blue). Note the increase in bantam-LacZ levels marked by β-gal when lola RNAi is expressed. Scale bars: 30 μm. Data are shown as mean ± SEM. *p<0.05 and **p<0.01 by Student’s T-test. At least 10 midguts were dissected for each genotype. Confocal images were taken from the basal layer of the midgut where ISCs can be clearly visualized. Single layer image is shown.
Figure 4 with 1 supplement
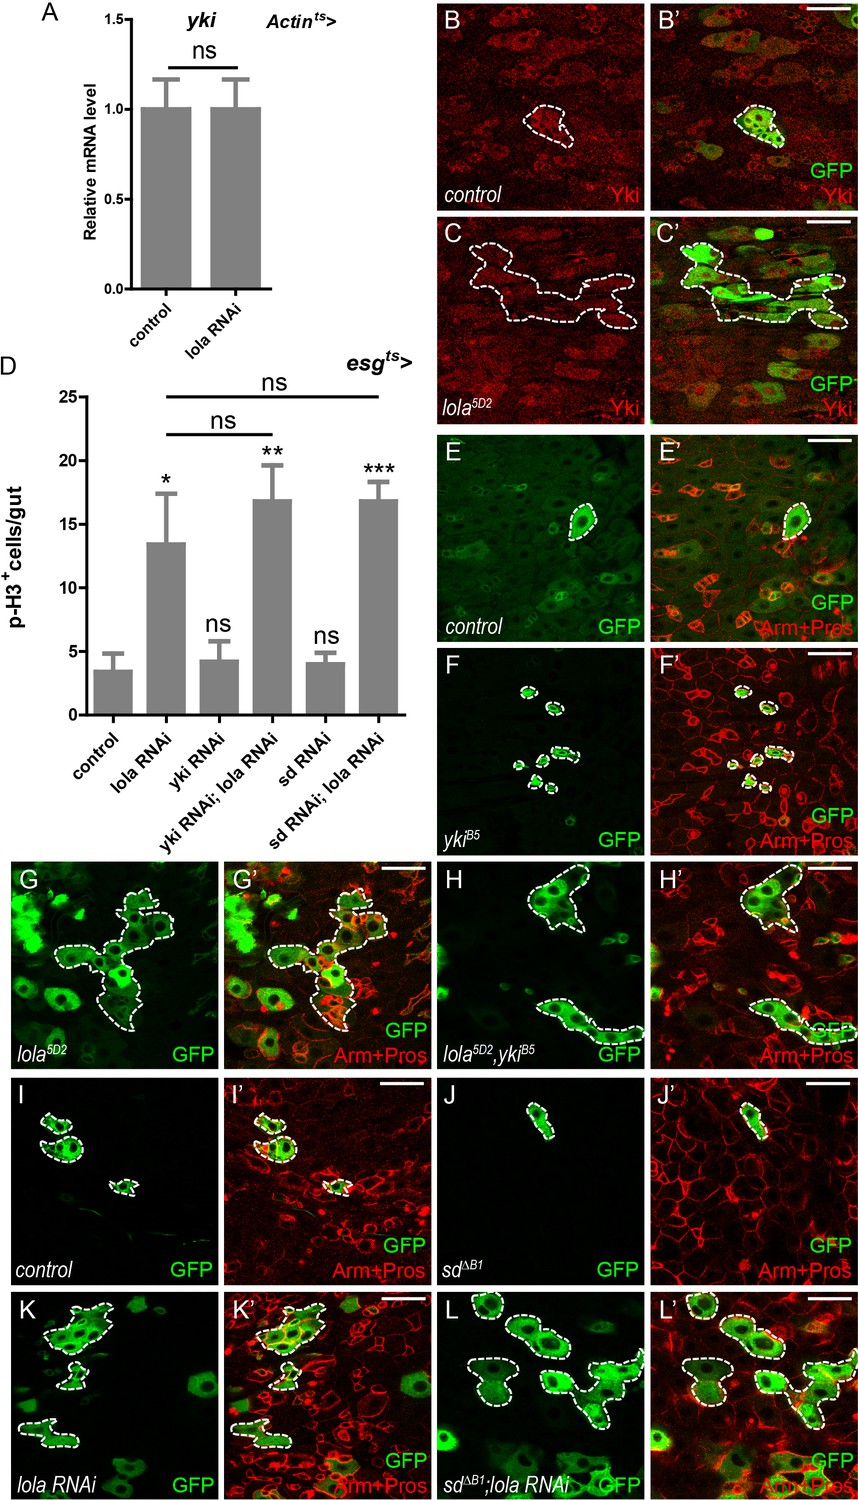
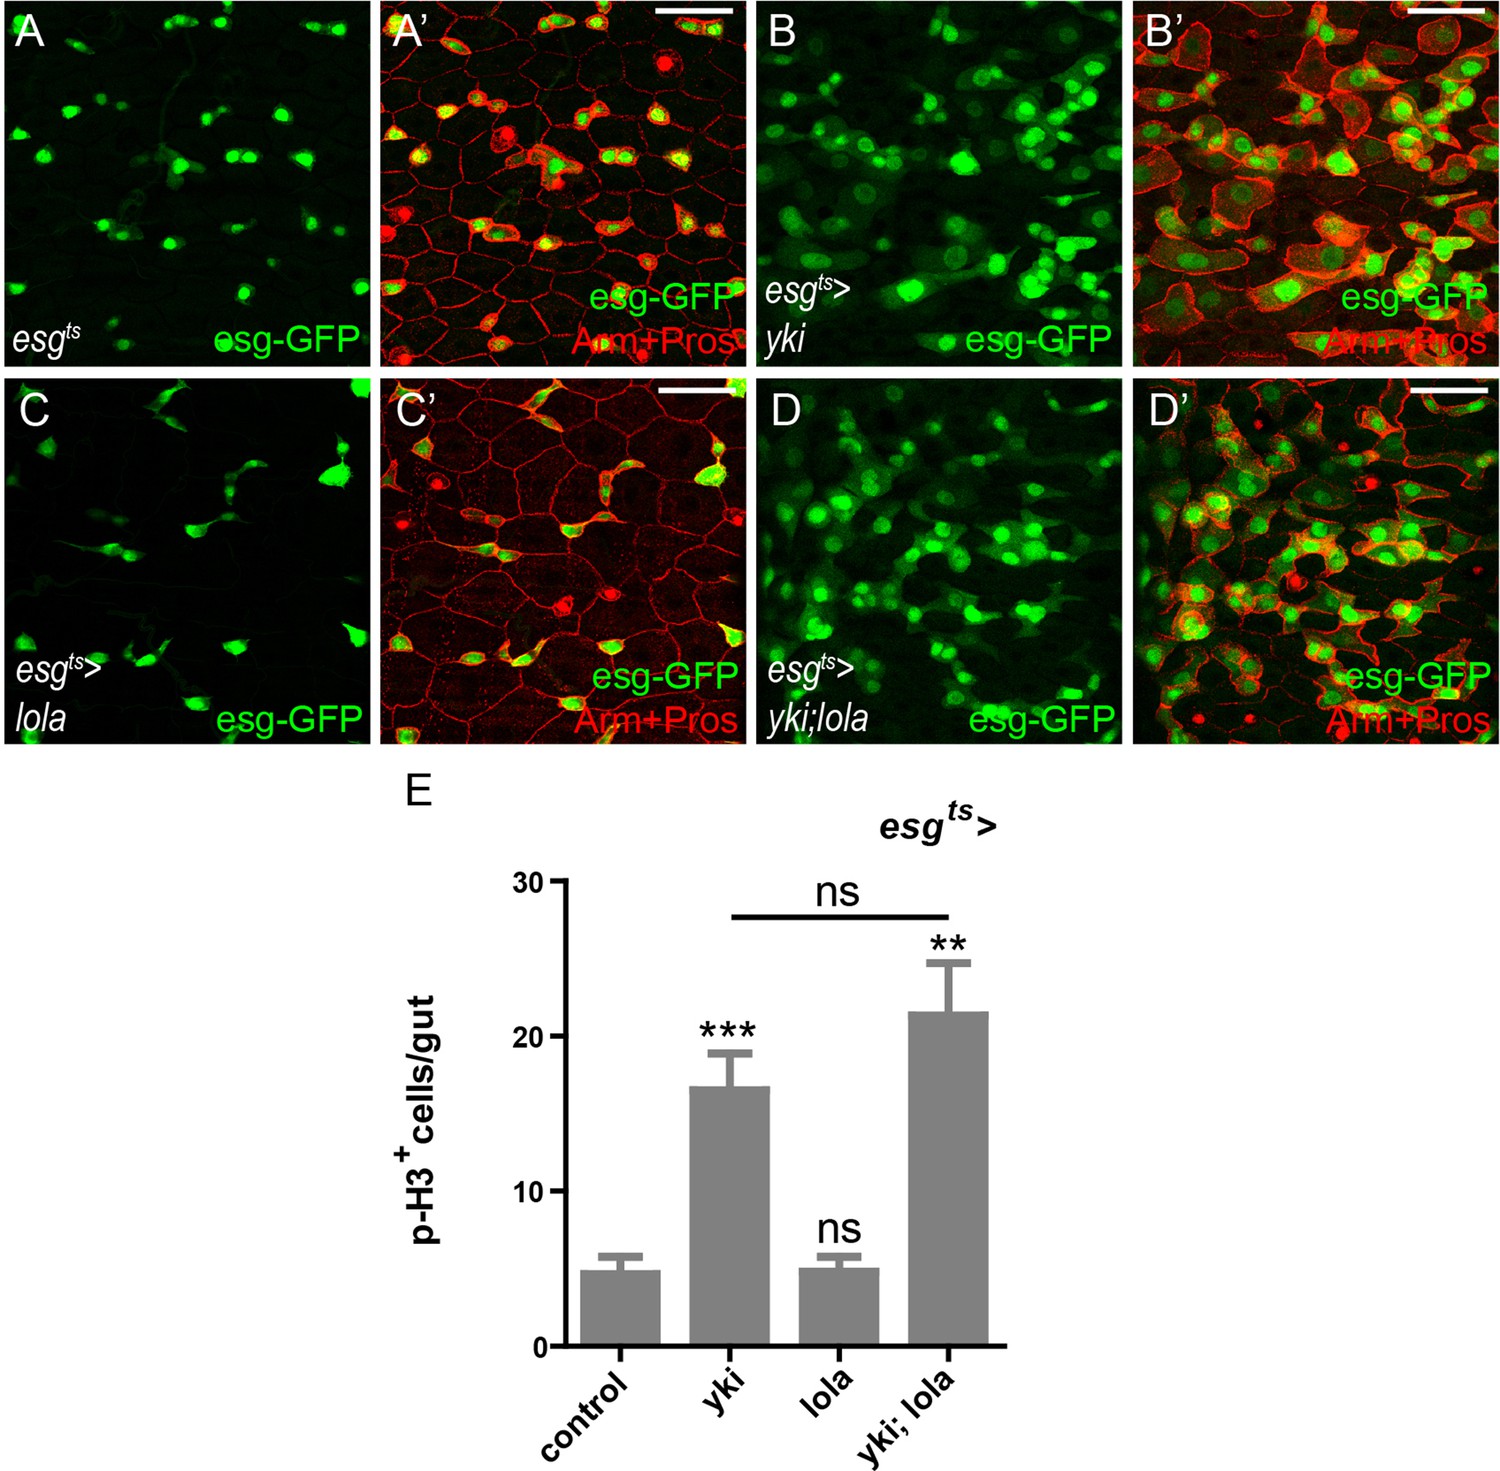
Lola regulates midgut homeostasis independently of Yki-Sd.
(A) Relative yki mRNA levels were analyzed by real-time PCR. Total RNAs were collected from whole midguts of Actin-Gal4; tub-Gal80ts (Actints) and Actints > lola RNAi. Note that yki mRNA levels remain similar to the control when lola RNAi is expressed (ns p>0.05). (B–C’) Representative images of Drosophila adult midguts containing GFP positive MARCM clones of control (B–B’) and the hypomorphic allele lola5D2 clones (C–C’). Midguts were dissected 2 days after clone induction and immunostained with antibodies against Yki (red). Areas enclosed by the dashed lines indicate respective clone size. Merged images are shown in B’ and C’ (green and red). Note that Yki protein levels are not affected in lola5D2 mutant clones. (D) Quantifications of the p-H3+ cell number in adult midguts from the indicated genotypes in Figure 4—figure supplement 1A–F (n = 9, 10, 10, 11, 11, 9). Note a significant increase in the p-H3+ cell number when lola RNAi is expressed (*p<0.05). Co-expression of yki or sd RNAi does not suppress the increase (ns p>0.05). (E–H’) Representative images of Drosophila adult midguts containing GFP positive MARCM clones of control (E–E’), ykiB5 (F–F’), the hypomorphic allele lola5D2 (G–G’), ykiB5 and lola5D2 double mutants (H–H’). Midguts were dissected 2 days after clone induction and immunostained with antibodies against Arm and Pros (red). Areas enclosed by the dashed lines indicate respective clone size. Merged images are shown in E’, F’, G’, and H’ (green and red). Note that MARCM clones of ykiB5 and lola5D2 exhibit similar size to lola5D2. (I–L’) Representative images of Drosophila adult midgut containing GFP positive MARCM clones of control (I–I’), sd∆B1 (J–J’), lola RNAi (K–K’), and sd∆B1 in the presence of lola RNAi (L–L’). Midguts were dissected 2 days after clone induction and immunostained with antibodies against Arm and Pros (red). Areas enclosed by the dashed lines indicate respective clone size. Merged images are shown in I’, J’, K’, and L’ (green and red). Note that MARCM clones of sd∆B1 expressing lola RNAi exhibit similar size to clones expressing lola RNAi alone. Scale bars: 30 μm. Data are shown as mean ± SEM. ns p>0.05, *p<0.05, **p<0.01, and ***p<0.001 by Student’s T-test. At least 10 midguts were dissected for each genotype. Confocal images were taken from the basal layer of the midgut where ISCs can be clearly visualized. Single layer image is shown.
-
Figure 4—source data 1
Source data for Figure 4D.
- https://cdn.elifesciences.org/articles/47542/elife-47542-fig4-data1-v2.xlsx
Figure 4—figure supplement 1

Lola regulates midgut homeostasis independently of Yki-Sd.
(A-F’) Representative images of Drosophila adult midguts of esgts (A-A’), esgts >lola RNAi (B-B’), esgts >yki RNAi (C-C’), esgts >yki RNAi; lola RNAi (D-D’), esgts >sd RNAi (E-E’), and esgts >sd RNAi; lola RNAi (F-F’) immunostained with DAPI (nuclei, blue). ISCs and EBs are marked with esg-GFP (green). Merged images are shown in A’, B’, C’, D’, E’, and F’ (green and blue). Scale bars: 30 μm. At least 10 midguts were dissected for each genotype. Confocal images were taken from the basal layer of the midgut where ISCs can be clearly visualized. Single layer image is shown.
Figure 5 with 1 supplement
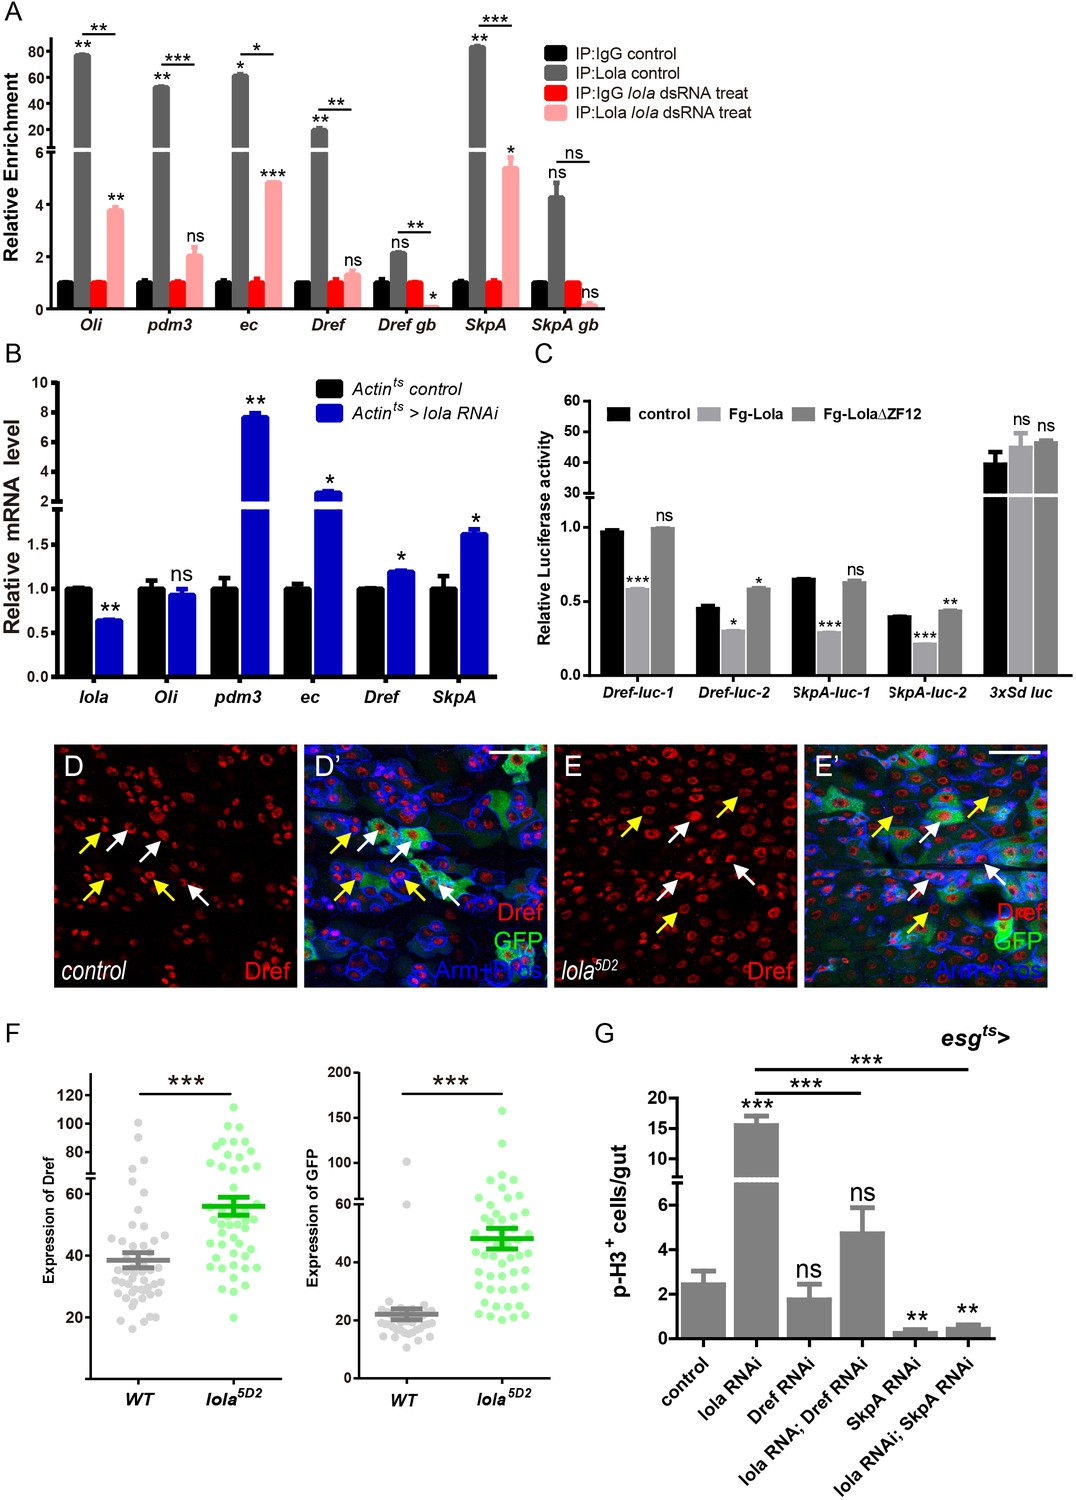
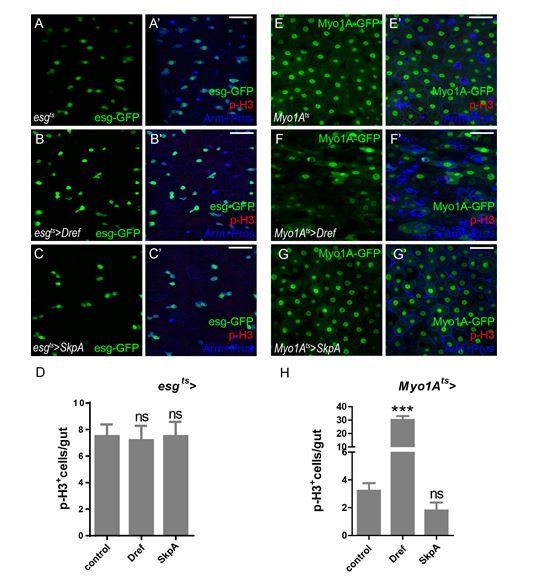
Lola restricts ISC proliferation by suppressing Dref and SkpA expression levels.
(A) Relative enrichment of Lola on binding and non-binding (genebody, gb) regions compared to IgG in control (Renilla dsRNA treated, gray and black bars) and Lola knockdown cells (lola dsRNA treated, pink and red bars) were analyzed by ChIP and real-time PCR. Note a significant increase of Lola enrichment in regions near pdm3, ec, Dref and SkpA (ns p>0.05, *p<0.05, **p<0.01, and ***p<0.001). (B) Relative mRNA levels of the indicated genes analyzed by real-time PCR. Total RNAs were collected from whole midguts of the indicated genotypes: Actints (black bars) and Actints > lola RNAi (blue bars). Note a significant increase in the mRNA levels of pdm3, ec, Dref and SkpA when lola RNAi is expressed (ns p>0.05, *p<0.05, and **p<0.01). (C) Relative luciferase activity of the luciferase reporter plasmids carrying Lola-binding-region on Dref or SkpA in S2 cells transfected with the indicated constructs. The luciferase reporter plasmid with 3xSd-binding sites (3xSd luc) was used as control. (ns p>0.05, *p<0.05, **p<0.01, and ***p<0.001) (D–E’) Representative images of Drosophila adult midguts containing GFP positive MARCM clones of control (D–D’) and the hypomorphic allele lola5D2 (E–E’). Midguts were dissected 4 days after clone induction and immunostained with antibodies against Dref (red) and Arm and Pros (blue). White arrows indicate GFP positive clonal cells and yellow arrows indicate adjacent control cells. Merged images are shown in C’ and D’ (green, red, and blue). Note an increase on Dref protein levels in the GFP positive lola5D2 mutant clones (white arrows in E and E’). (F) Quantification of Dref expression in E. (G) Quantifications of the p-H3+ cell number in adult midguts with the indicated genotypes in Figure 5—figure supplement 1C–H (n = 7, 8, 8, 7, 8, 7). Note a significant increase in the p-H3+ cell number when lola RNAi is expressed (***p<0.001). Co-expression of Dref or SkpA RNAi and lola RNAi suppresses the increase (***p<0.001). Scale bars: 30 μm. Data are shown as mean ± SEM. ns p>0.05, *p<0.05, **p<0.01, and ***p<0.001 by Student’s T-test. At least 10 midguts were dissected for each genotype. Confocal images were taken from the basal layer of the midgut where ISCs can be clearly visualized. Single layer image is shown.
-
Figure 5—source data 1
- https://cdn.elifesciences.org/articles/47542/elife-47542-fig5-data1-v2.xlsx
Figure 5—figure supplement 1
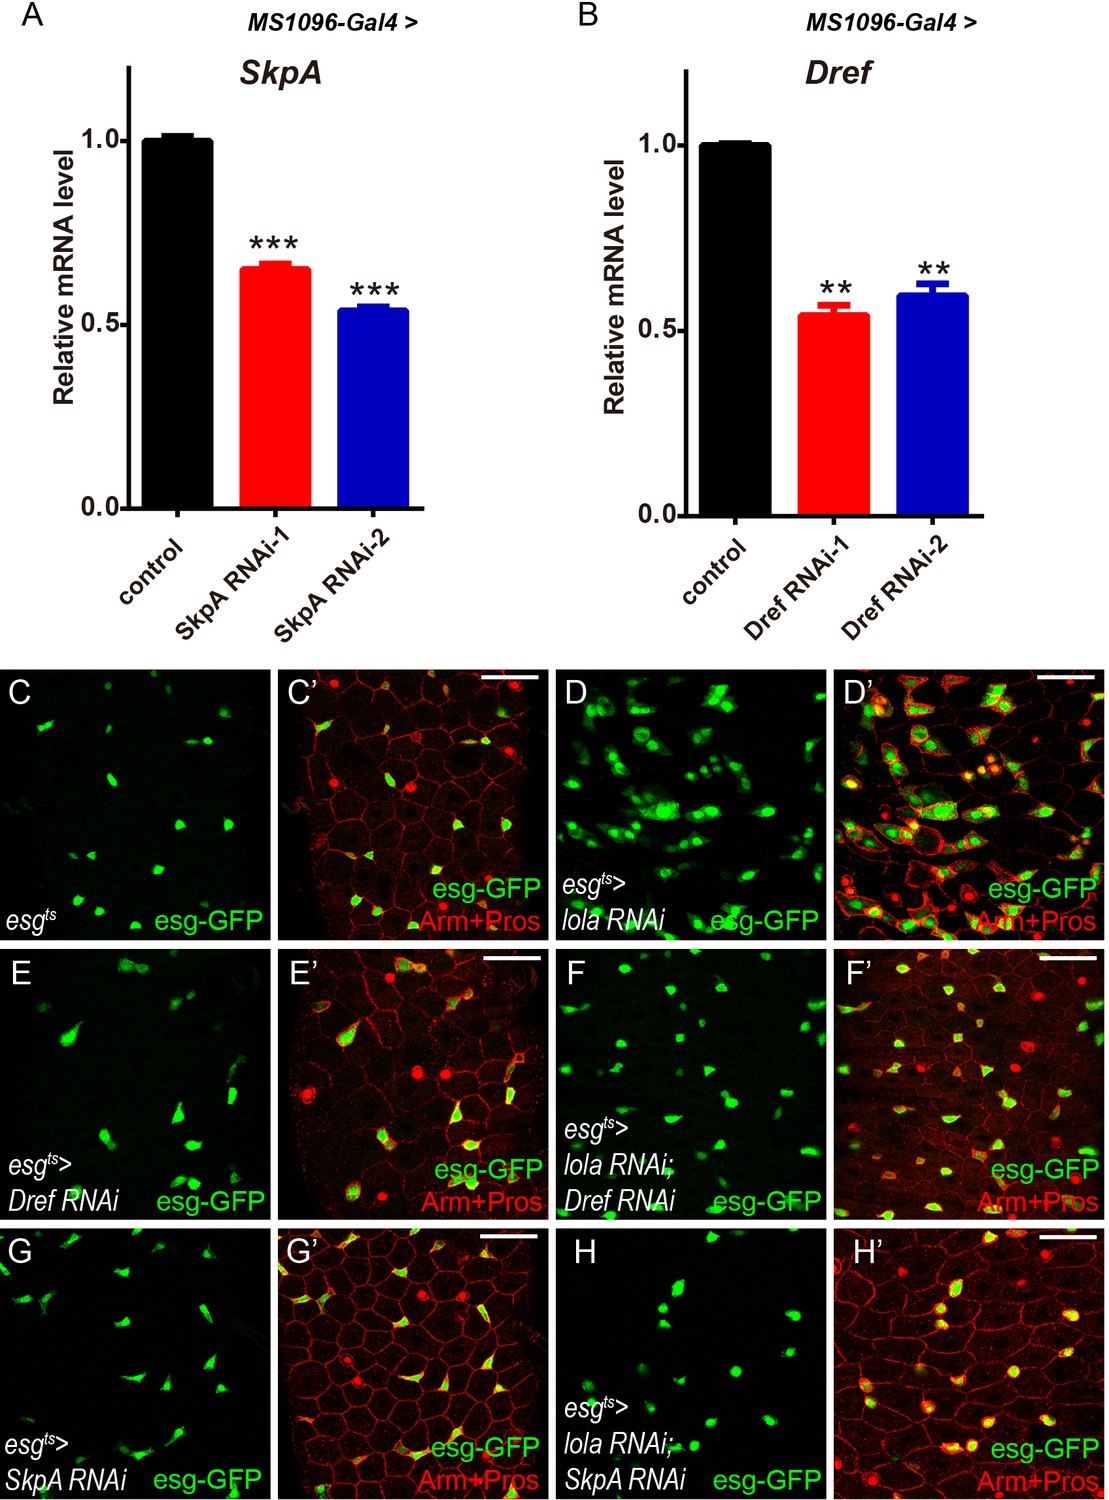
Lola restricts ISC proliferation by suppressing Dref and SkpA expression levels.
(A) Relative SkpA mRNA levels were analyzed by real-time PCR. Total RNAs were collected from wing discs of MS1096-Gal4 (black bar), MS1096-Gal4 > SkpA RNAi-1 (red bar), and MS1096-Gal4 > SkpA RNAi-2 (blue bar). Note a significant decrease in the mRNA levels when SkpA RNAi is expressed (***p<0.001). (B) Relative Dref mRNA levels were analyzed by real-time PCR. Total RNAs were collected from wing discs of MS1096-Gal4 (black bar), MS1096-Gal4 > Dref RNAi-1 (red bar), and MS1096-Gal4 > Dref RNAi-2 (blue bar). Note a significant decrease in the mRNA levels when Dref RNAi is expressed (**p<0.01). (C-H’) Representative images of Drosophila adult midguts of esgts (C-C’), esgts >lola RNAi (D-D’), esgts >Dref RNAi (E-E’), esgts >lola RNAi; Dref RNAi (F-F’), esgts >SkpA RNAi (G-G’), and esgts >lola RNAi; SkpA RNAi (H-H’) immunostained with Arm and Pros (red). ISCs and EBs are marked with esg-GFP (green). Merged images are shown in C’, D’, E’, F’, G’, and H’ (green and red). Scale bars: 30 μm. At least 10 midguts were dissected for each genotype. Confocal images were taken from the basal layer of the midgut where ISCs can be clearly visualized. Single layer image is shown.
Figure 6 with 3 supplements
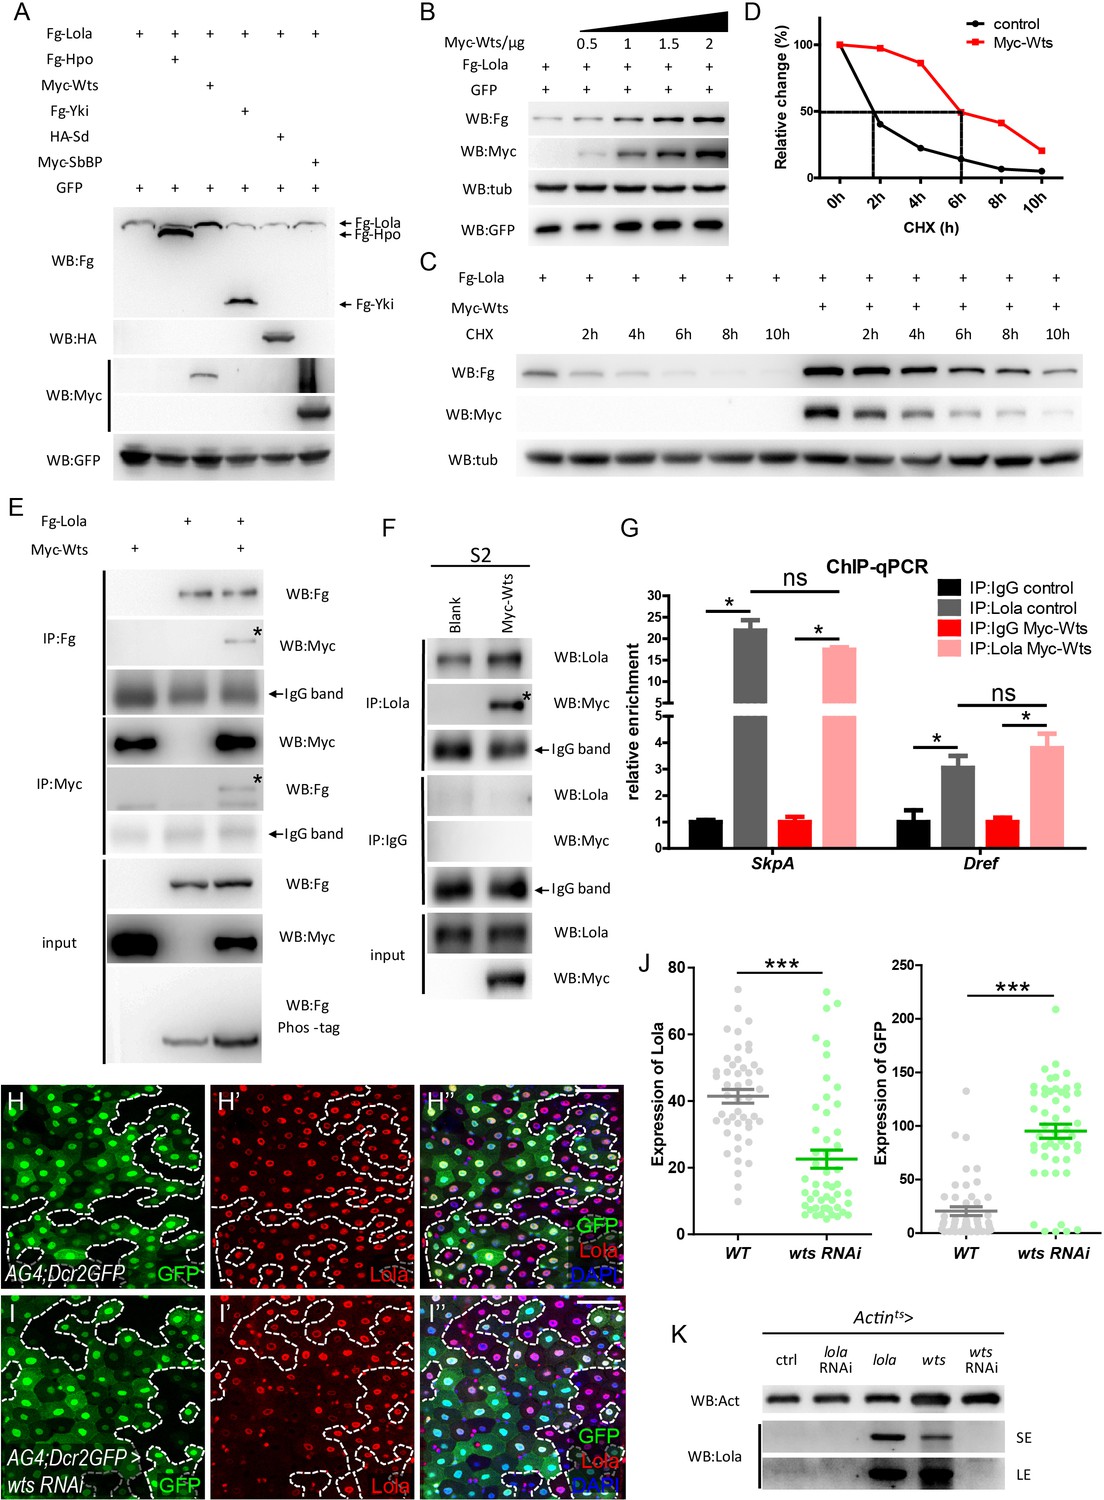
Wts interacts with Lola and affects Lola protein turnover.
(A) S2 cells were co-transfected with constructs expressing different Hippo components (Fg-Hpo, Myc-Wts, Fg-Yki, HA-Sd, or Myc-SbBP) and Fg-Lola. Cell extracts were collected and analyzed by Western blot with the indicated antibodies. Note that Lola protein levels were specifically modulated by Wts. (B) Collected cell extracts from S2 cells co-transfected with plasmids expressing Fg-Lola (1 μg) and Myc-Wts (0.5, 1, 1.5, and 2 ug) were analyzed by Western blot with the indicated antibodies. Plasmids expressing GFP were also added as a control. Note that Lola is stabilized by Wts in a dosage-dependent manner. (C) S2 cells were transfected with plasmids expressing Fg-Lola with or without Myc-Wts and treated with CHX for the indicated hours. Cells were harvested and analyzed by Western blot with the indicated antibodies. Note that Lola half-life extends in the presence of Wts. (D) Quantifications of results normalized to Tubulin in C. Note that Lola half-life extends from 2 to 6 hr in the presence of Myc-Wts. (E) Co-IP analysis indicates that Fg-Lola and Myc-Wts co-immunoprecipitate with each other using antibodies against either Flag or Myc. Pull-down proteins are marked by the asterisks. (F) Co-IP analysis indicates that Myc-Wts interacts with endogenous Lola using antibodies against Lola or Myc. Pull-down proteins are marked by the asterisk. (G) Relative enrichment of Lola on binding regions of SkpA and Dref compared to IgG in control (gray and black bars) and cells expressing Myc-Wts (pink and red bars) were analyzed by ChIP and real-time PCR. Note that Wts does not affect the significant increase of Lola enrichment in these regions (ns p>0.05 and *p<0.05). (H–I’’’) Representative images of Drosophila adult midguts containing GFP positive flip-out clones of hsflp; act >CD2>Gal4; UAS-Dicer2, UAS-GFP (AG4; Dcr2GFP) (H–H’’’) and AG4; Dcr2GFP >wts RNAi (I–I’’’). Midguts were dissected 2 days after clone induction and immunostained with antibodies against Lola (red) and DAPI (nuclei, blue). Areas enclosed by the dashed lines indicate clone regions, respectively. Merged images are shown in H’’’ and I’’’ (green, red, and blue). Note a decrease in Lola protein levels in GFP positive flip-out clones expressing wts RNAi (white arrows I-I’’’). (J) Quantification of Lola expression in I. (K) Western blot analysis of gut extracts collected from adult flies with the indicated genotypes (Actints > lola, wts, lola RNAi, or wts RNAi). Note that Lola protein levels were increased when lola or wts is overexpressed. SE: short exposure. LE: long exposure. Scale bars: 30 μm. Data are shown as mean ± SEM. ns p>0.05, *p<0.05 by Student’s T-test. At least 10 midguts were dissected for each genotype. Confocal images were taken from the basal layer of the midgut where ISCs can be clearly visualized. Single layer image is shown.
-
Figure 6—source data 1
Source data for Figure 6J.
- https://cdn.elifesciences.org/articles/47542/elife-47542-fig6-data1-v2.xlsx
Figure 6—figure supplement 1
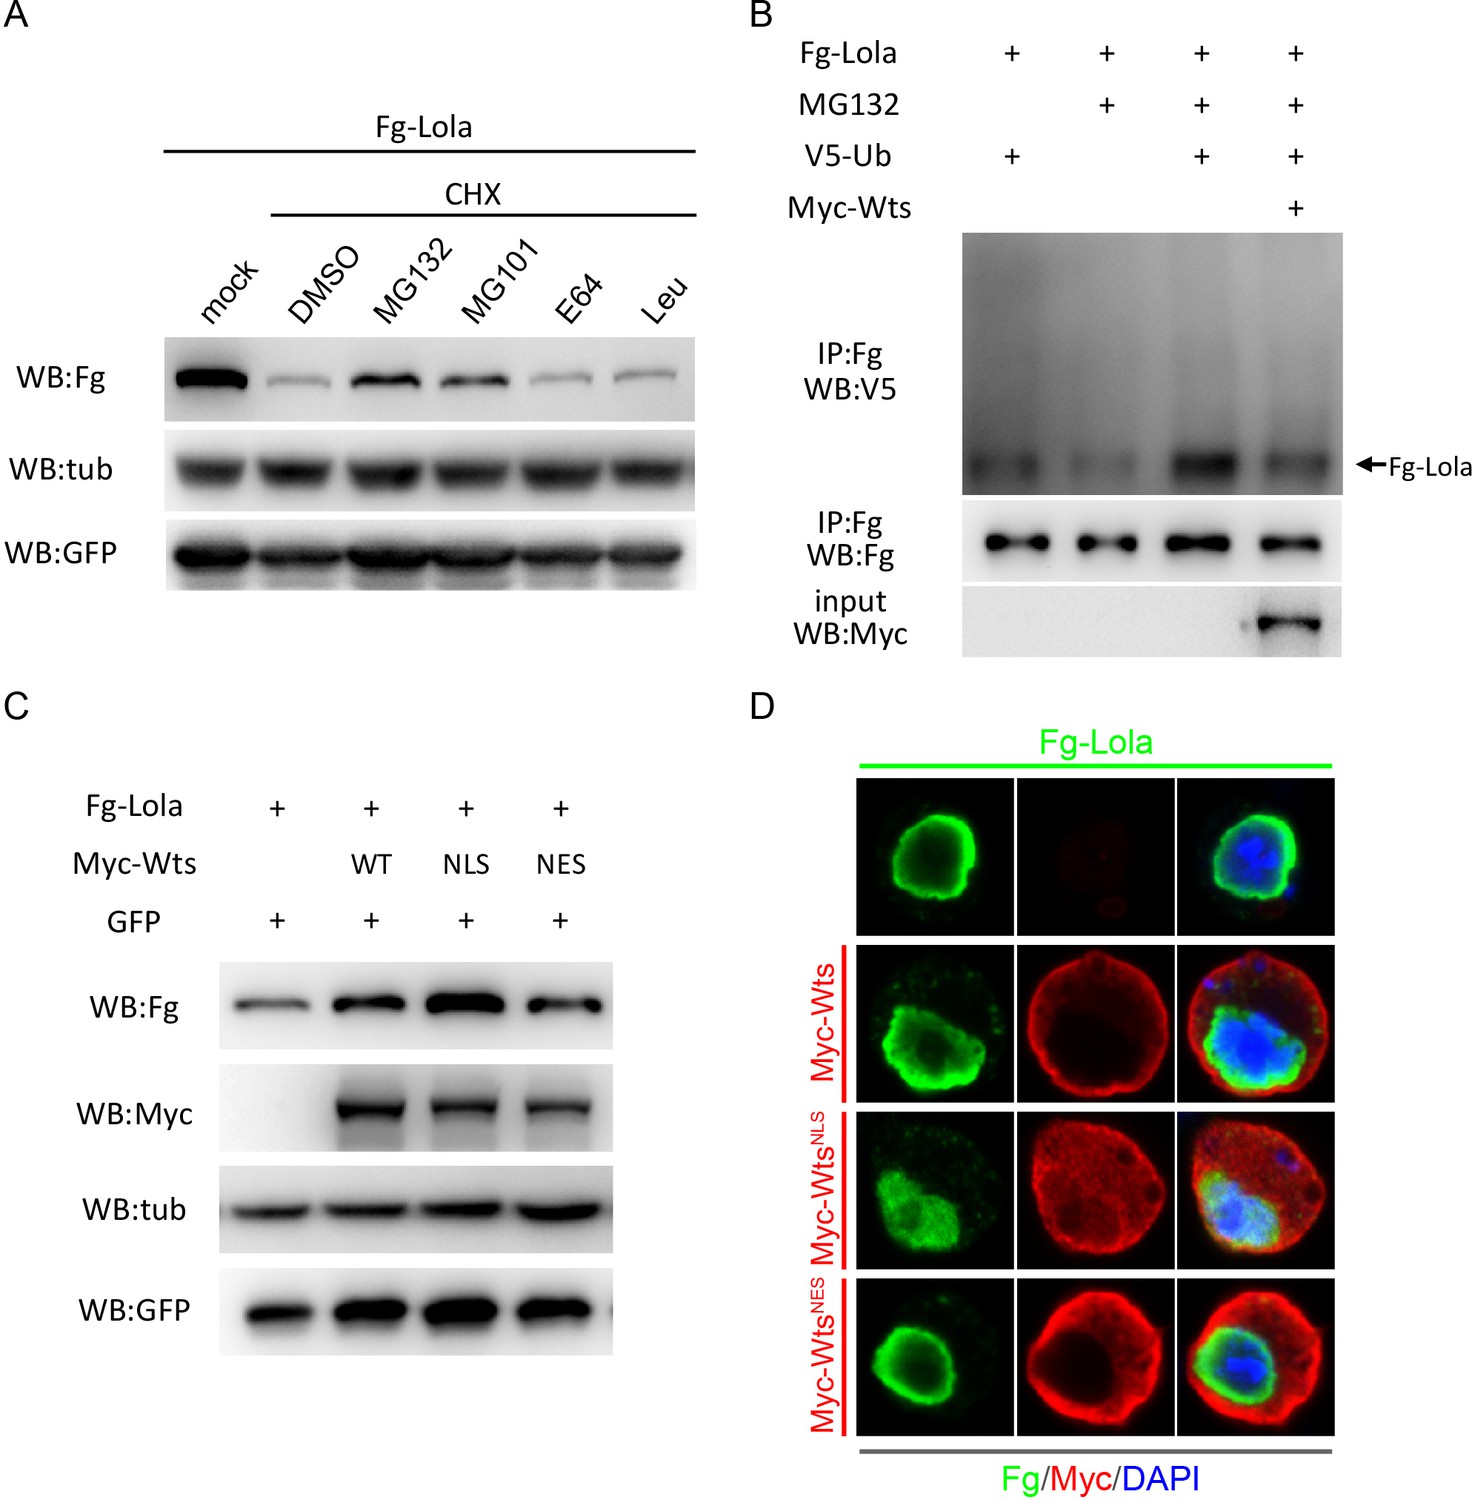
Wts affected Lola UPS-mediated degradation.
(A) S2 cells were transfected with plasmids expressing Fg-Lola and treated with UPS inhibitors (MG132 and MG101) or lysosomal inhibitors (E64 and Leupeptin) for 3 hr followed by CHX treatment for an additional 6 hr. Cells were harvested and analyzed by Western blot with the indicated antibodies. Note that CHX-induced Lola degradation was rescued upon incubation with UPS inhibitors (MG132 and MG101), but not with DMSO or lysosomal inhibitors (E64 and Leu). (B) In vivo ubiquitination assay of Lola in S2 cells. Fg-Lola was immunoprecipitated from S2 cells expressing the indicated proteins and treated with MG132, followed by Western blot with V5 antibody to detect conjugated V5-Ub. (C) Collected cell extracts from S2 cells transfected with plasmids expressing Fg-Lola, and Myc-Wts, Myc-WtsNLS or Myc-WtsNES were analyzed by Western blot with the indicated antibodies. (D) Representative images of S2 cells transfected with plasmids expressing Fg-Lola, and Myc-Wts, Myc-WtsNLS or Myc-WtsNES immunostained with Fg (green), Myc (red), and DAPI (nuclei, blue).
Figure 6—figure supplement 2
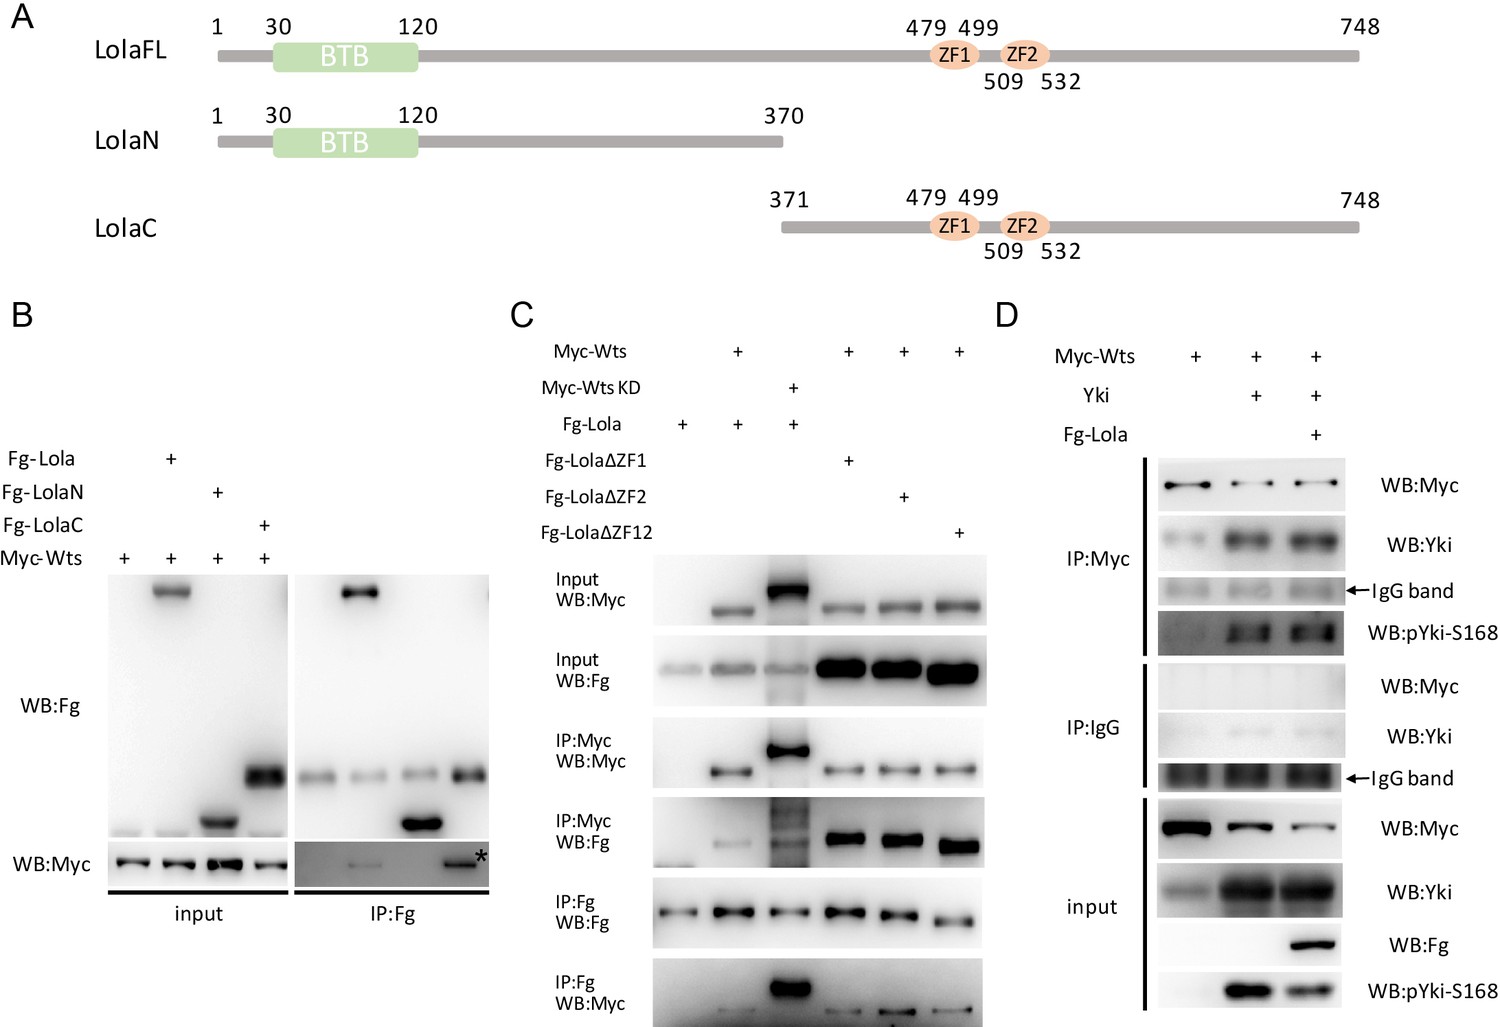
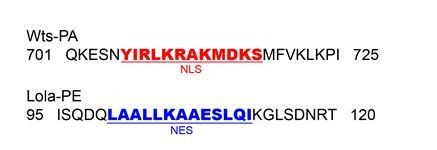
Wts interacts with C-terminal Lola independently of Wts kinase activity and Lola zinc finger domains.
(A) Schematic presentation illustrating Lola (LolaFL), truncated Lola N-terminus containing the BTB domain (1–370, LolaN), and truncated Lola C-terminus containing two zinc finger domains (371–748, LolaC). (B) Collected cell extracts from S2 cells transfected with plasmids expressing Fg-Lola, Fg-LolaN, or Fg-LolaC and Myc-Wts were analyzed by Co-IP with the indicated antibodies. Note that Wts co-immunoprecipitated with C-terminal Lola (asterisk). (C) Collected cell extracts from S2 cells transfected with plasmids expressing Fg-Lola, Fg-LolaΔZF1, Fg-LolaΔZF2, or Fg-LolaΔZF12 and Myc-Wts or Myc-WtsKD were analyzed by Co-IP with the indicated antibodies. Note that Wts-Lola interaction is independent of Wts kinase activity and Lola zinc finger domains. (D) Collected cell extracts from S2 cells transfected with plasmids expressing Fg-Lola, Yki, and Myc-Wts were analyzed by Co-IP with the indicated antibodies. Note that the total amount of co-immunoprecipitated Yki and its phosphorylation levels at S168 (pYki-S168 panel) are similar in the presence or absence of Myc-Wts.
Figure 6—figure supplement 3

Wts affects Lola protein levels in vivo.
(A-B’’’) Representative images of Drosophila adult midguts containing GFP positive MARCM clones of control (A-A’’’) and the hypomorphic allele lola5D2 (B-B’’’) immunostained with Lola (red) and DAPI (nuclei, blue). Merged images are shown in A’’’ and B’’’ (green, red, and blue). Note a decrease in Lola protein levels in lola5D2 clones (white arrows in B’). (C-D’’’) Representative images of Drosophila adult midguts containing GFP positive MARCM clones of control (A-A’’’) and wtsx1 (B-B’’’) immunostained with Lola (red) and DAPI (nuclei, blue). Merged images are shown in C’’’ and D’’’ (green, red, and blue). Note a decrease in Lola protein levels in wtsx1 clones (white arrows in D’). Scale bars: 30 μm. At least 10 midguts were dissected for each genotype. Confocal images were taken from the basal layer of the midgut where ISCs can be clearly visualized. Single layer image is shown.
Figure 7 with 3 supplements

Lola is essential for Wts-mediated ISC proliferation and midgut homeostasis.
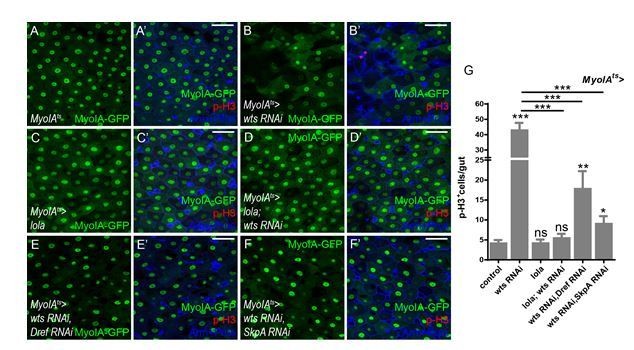
(A) Quantifications of the p-H3+ cell number in adult midguts with the indicated genotypes in Figure 7—figure supplement 1A–F (n = 18, 21, 19, 20, 18, 19). Note that co-expression of lola, Dref RNAi, or SkpA RNAi in the presence of wts RNAi suppresses the increase in the p-H3+ cell number (ns p>0.05, *p<0.05, and ***p<0.001). (B–E’) Representative images of Drosophila adult midguts containing GFP positive MARCM clones of control (B–B’), wtsx1 (C–C’), lola (D–D’), and wtsx1 in the presence of lola (E–E’). Midguts were dissected 4 days after clone induction and immunostained with antibodies against DAPI (nuclei, blue). Areas enclosed by the dashed lines indicate respective clone size. Merged images are shown in B’, C’, D’, and E’ (green and blue). Note a decrease in the wtsx1 clone size in the presence of lola. (F) Quantifications of the cell number per clone in adult midguts from the indicated genotypes in B-E at 2, 4, and 6 days after clone induction (***p<0.001). Average of 29–92 clones from 10 midguts for each genotype were quantified. (G) Heatmap of 2116 union DEGs in adult guts carrying genotypes: Actints, Actints > yki, Actints > lola RNAi, and Actints > wts RNAi. A decrease and an increase in expression is indicated by blue and red color, respectively. Note a high degree of similarity in the DEG expression profiles for lola and wts RNAi. (H) An illustrated model on Drosophila midgut homeostasis regulated by the Wts-Lola-Dref/SkpA signaling axis. Wts interacts with Lola and regulates its stability. In the absence of Lola, ISC undergoes hyperproliferation due to de-repression of Dref and SkpA expression levels. Yki and Lola regulate different target gene expression levels, thereby controlling midgut homeostasis via separate means. Scale bars: 30 μm. Data are shown as mean ± SEM. ns p>0.05, *p<0.05, and ***p<0.001 by Student’s T-test. At least 10 midguts were dissected for each genotype. Confocal images were taken from the basal layer of the midgut where ISCs can be clearly visualized. Single layer image is shown.
Figure 7—figure supplement 1
Lola is essential for Wts-mediated midgut homeostasis.
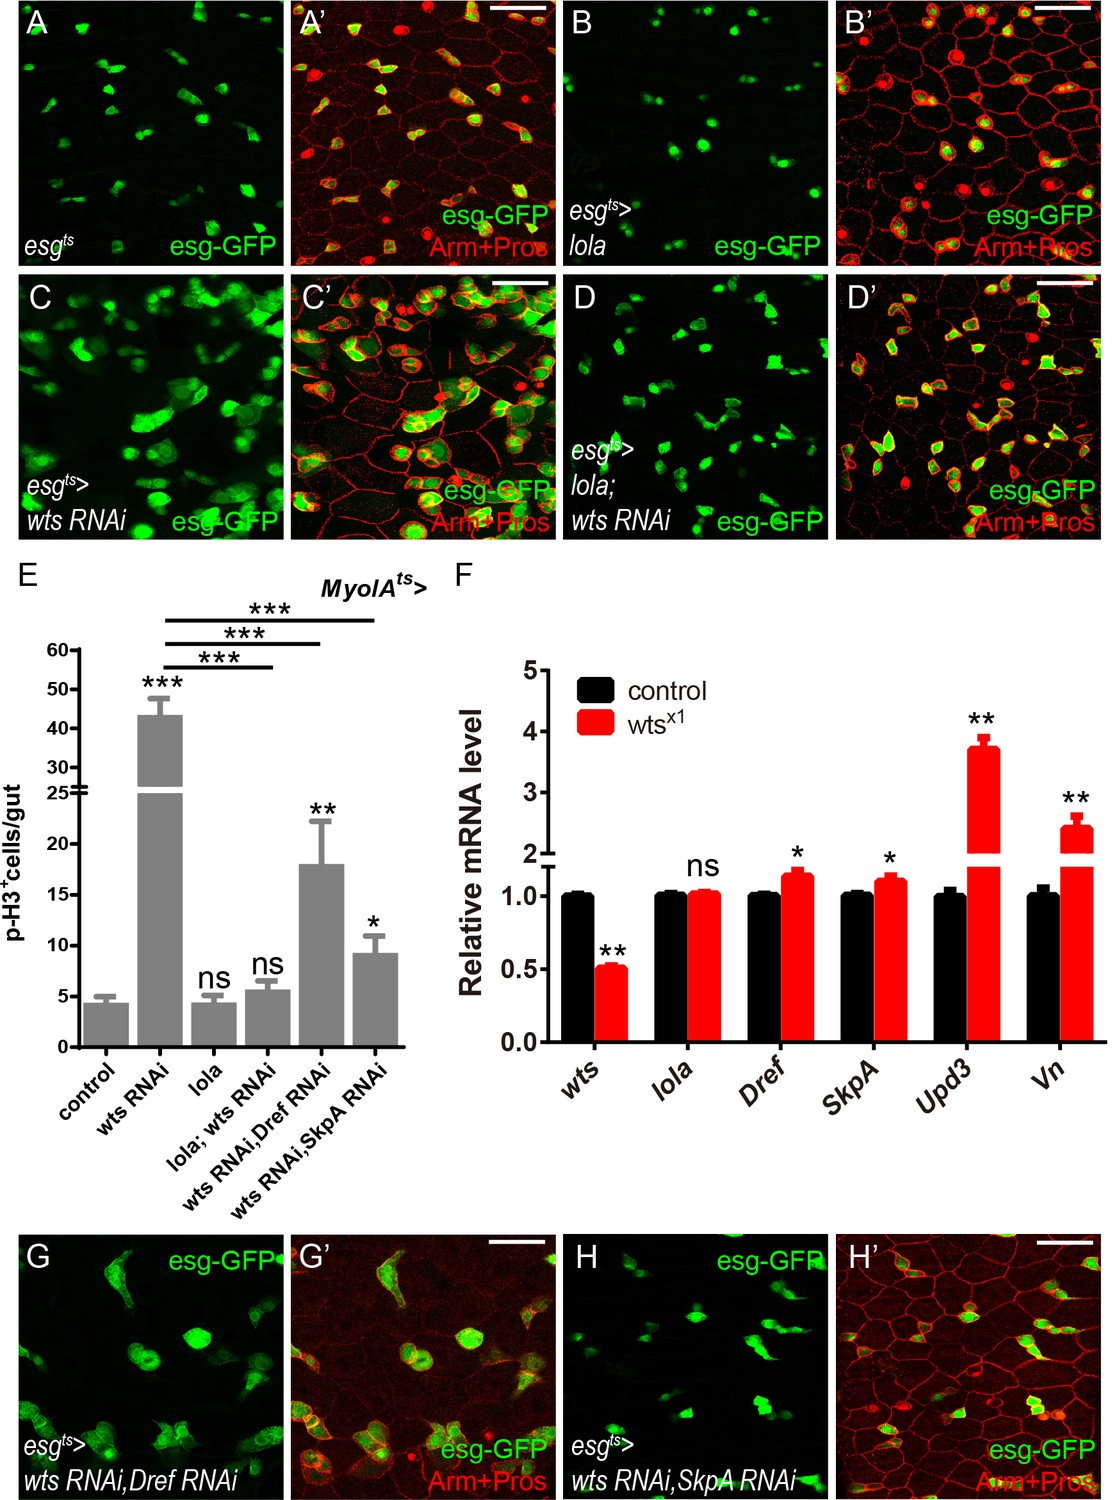
(A-D’) Representative images of Drosophila adult midguts of esgts (A-A’), esgts >lola (B-B’), esgts >wts RNAi (C-C’), and esgts >lola; wts RNAi (D-D’) immunostained with Arm and Pros (red). ISCs and EBs are marked with esg-GFP (green). Merged images are shown in A’, B’, C’, and D’ (green and red). (E) Quantifications of the p-H3+ cell number in adult midguts with the indicated genotypes: MyoIAts, MyoIAts > lola, MyoIAts > wts RNAi, MyoIAts > lola; wts RNAi, MyoIAts > wts RNAi, Dref RNAi, and MyoIAts > wts RNAi, SkpA RNAi (ns p>0.05, *p<0.05, **p<0.01, and ***p<0.001) (n = 9, 11, 8, 10, 8, 10). Note that co-expression of lola and wts RNAi suppresses the increase in the p-H3+ cell number (***p<0.001). (F) Relative mRNA levels of the indicated genes were analyzed by real-time PCR. Total RNAs were collected from the control (black bars) and wtsx1 (red bars) clonal guts. Note a significant increase in the mRNA levels of Dref and SkpA in wtsx1 clonal samples (p=0.0352, 0.0382). An increase in the EGFR ligand Vn and the JAK-STAT ligand Upd3 is also shown as positive controls (p=0.00112, 0.00447). (G-H’) Representative images of Drosophila adult midguts of esgts >wts RNAi, Dref RNAi (G-G’) and esgts >wts RNAi, SkpA RNAi (H-H’) immunostained with Arm and Pros (red). Merged images are shown in G’ and H’ (green and red). Scale bars: 30 μm. Data are shown as mean ± SEM. ns p>0.05, *p<0.05, **p<0.01, and ***p<0.001 by Student’s T-test. At least 10 midguts were dissected for each genotype. Confocal images were taken from the basal layer of the midgut where ISCs can be clearly visualized. Single layer image is shown.
Figure 7—figure supplement 2
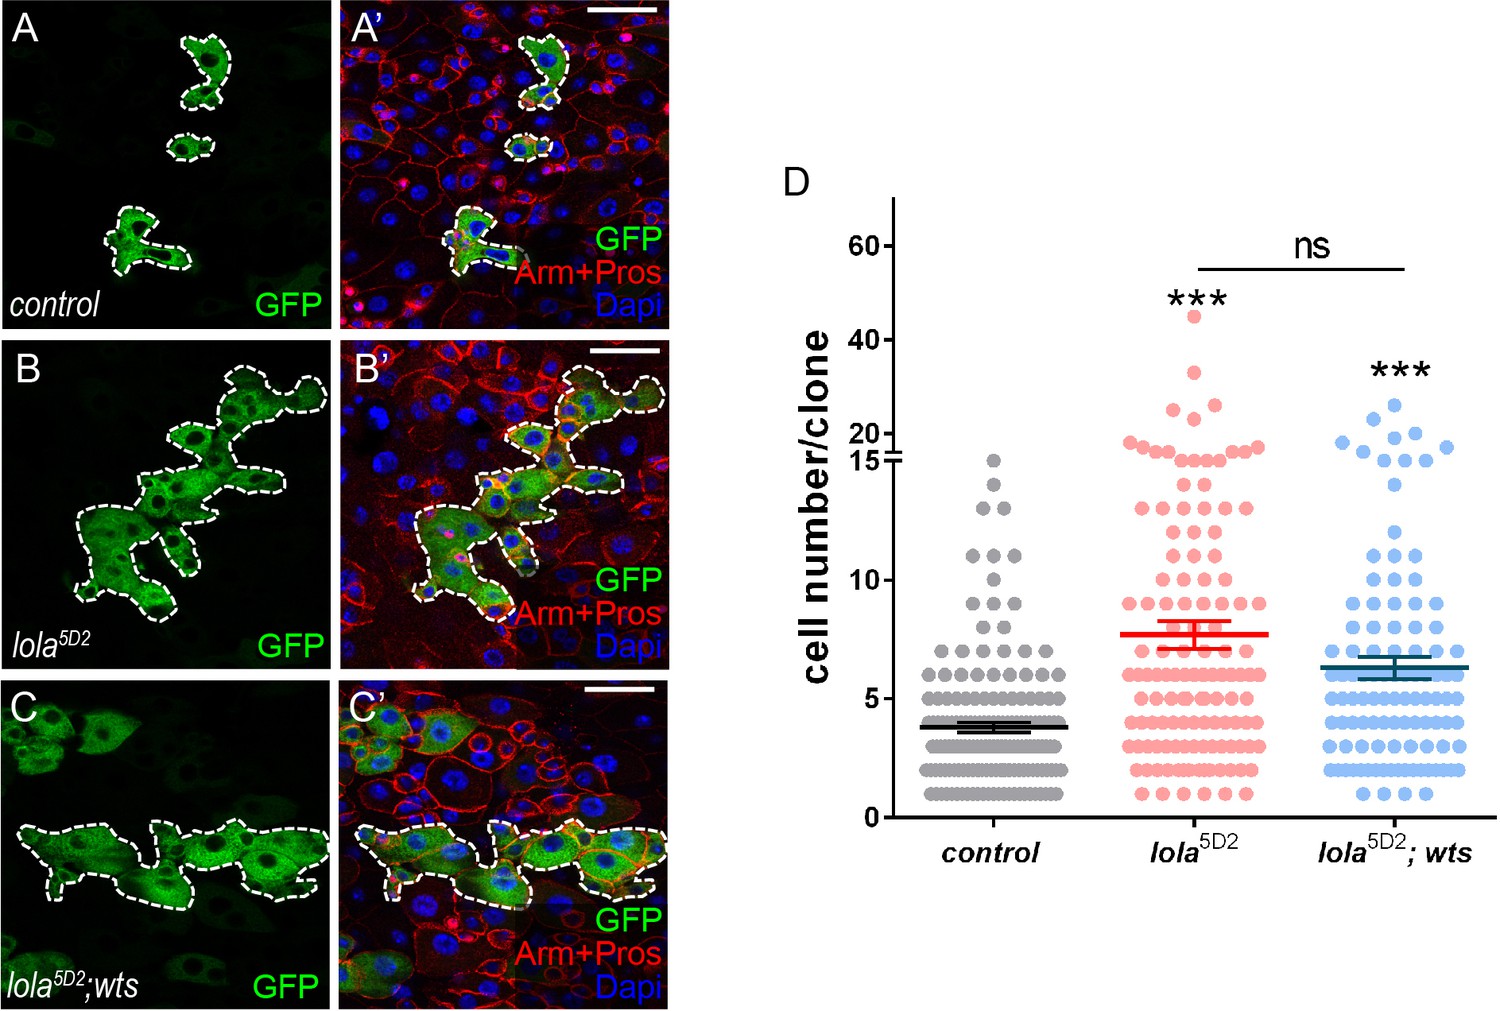
Lola is essential for Wts-mediated midgut homeostasis.
(A-C’) Representative images of Drosophila adult midguts containing GFP positive MARCM clones of control (A-A’), lola5D2 (B-B’), and lola5D2 in the presence of wts (C-C’). Midguts were dissected 4 days after clone induction and immunostained with antibodies against Arm and Pros (red) and DAPI (nuclei, blue). Areas enclosed by the dashed lines indicate respective clone size. Merged images are shown in A’, B’, and C’ (green, red, and blue). (D) Quantifications of the cell number per clone in adult midguts from the indicated genotypes in A-C 4 days after clone induction (ns p>0.05, ***p<0.001). Average of 107–162 clones from 10 midguts for each genotype were quantified. Scale bars: 30 μm. Data are shown as mean ± SEM. ns p>0.05, ***p<0.001 by Student’s T-test. At least 10 midguts were dissected for each genotype. Confocal images were taken from the basal layer of the midgut where ISCs can be clearly visualized. Single layer image is shown.
Figure 7—figure supplement 3
Lola and Yki regulate the midgut homeostasis in different means.
(A-F’) Representative images of Drosophila adult midguts of esgts (A-A’), esgts >yki (B-B’), esgts >lola (C-C’), and esgts >yki; lola (D-D’) immunostained with Arm and Pros (red). ISCs and EBs are marked with esg-GFP (green). Merged images are shown in A’, B’, C’, and D’ (green and red). (E) Quantifications of the p-H3+ cell number in adult midguts with the indicated genotypes in A-D (n = 6, 6, 7, 9). Note that co-expression of lola and yki does not suppress the increase in the p-H3+ cell number induced by yki overexpression (ns p>0.05). Scale bars: 30 μm. Data are shown as mean ± SEM. ns p>0.05, **p<0.01, and ***p<0.001 by Student’s T-test. At least 10 midguts were dissected for each genotype. Confocal images were taken from the basal layer of the midgut where ISCs can be clearly visualized. Single layer image is shown.
Author response image 1
Author response image 2

Author response image 3
Author response image 4
Author response image 5
Author response image 6

Author response image 7
Author response image 8
Tables
Key resources table
| Reagent type (species) or resource | Designation | Source or reference | Identifiers | Additional information |
|---|---|---|---|---|
| Gene (Drosophila melanogaster) | lola | FBgn0283521 | ||
| Cell line (Drosophila melanogaster) | S2 | ATCC | ATCC CRL-1963 RRID:CVCL_Z232 | |
| Genetic reagent (Drosophila melanogaster) | UAS-lola RNAi | Vienna Drosophila Resource Center | VDRC12574 | |
| Genetic reagent (Drosophila melanogaster) | UAS-lola RNAi | Vienna Drosophila Resource Center | VDRC12573 | |
| Genetic reagent (Drosophila melanogaster) | UAS-lola RNAi | Fly Stocks of National Institute of Genetics | NIG12052 R-1 | |
| Genetic reagent (Drosophila melanogaster) | FRT42Dlola5D2 | Bloomington Drosophila Stock Center, PMID: 8050351 | Bloomington #28266 | |
| Genetic reagent (Drosophila melanogaster) | UAS-wts RNAi | Vienna Drosophila Resource Center, PMID: 21666802 | VDRC9928 | |
| Genetic reagent (Drosophila melanogaster) | UAS-wts RNAi | Bloomington Drosophila Stock Center, PMID: 23989952 | Bloomington #34064 | |
| Genetic reagent (Drosophila melanogaster) | UAS-wtsEPG4808 | Bloomington Drosophila Stock Center, PMID: 21278706 | Bloomington #30099 | |
| Genetic reagent (Drosophila melanogaster) | FRT82Bwtsx1 | PMID: 7743921 | ||
| Genetic reagent (Drosophila melanogaster) | FRT42DykiB5 | PMID: 16096061 | ||
| Genetic reagent (Drosophila melanogaster) | UAS-yki RNAi | PMID: 16096061 | ||
| Genetic reagent (Drosophila melanogaster) | UAS-yki | PMID: 16096061 | ||
| Genetic reagent (Drosophila melanogaster) | FRT19Asd∆B1 | PMID: 18258485 | ||
| Genetic reagent (Drosophila melanogaster) | UAS-sd RNAi | PMID: 18258485 | ||
| Genetic reagent (Drosophila melanogaster) | UAS-Dref RNAi | Vienna Drosophila Resource Center | VDRC22209 | |
| Genetic reagent (Drosophila melanogaster) | UAS-Dref RNAi | Bloomington Drosophila Stock Center | Bloomington #31941 | |
| Genetic reagent (Drosophila melanogaster) | UAS-SkpA RNAi | Bloomington Drosophila Stock Center | Bloomington #32870 | |
| Genetic reagent (Drosophila melanogaster) | UAS-SkpA RNAi | Bloomington Drosophila Stock Center | Bloomington #32991 | |
| Genetic reagent (Drosophila melanogaster) | MS1096-Gal4; UAS-Dicer2 | PMID: 10557210 | ||
| Genetic reagent (Drosophila melanogaster) | esg-Gal4/UAS-GFP; tubGal80ts | PMID: 16340959 | ||
| Genetic reagent (Drosophila melanogaster) | MyoIA-Gal4/UAS-GFP; tubGal80ts | PMID: 16340959 | ||
| Genetic reagent (Drosophila melanogaster) | MyoIA-Gal4; tubGal80ts | a gift from Rongwen Xi, National Institute of Biological Sciences, Beijing, China | ||
| Genetic reagent (Drosophila melanogaster) | Upd3-LacZ | a gift from Rongwen Xi | ||
| Genetic reagent (Drosophila melanogaster) | bantam-lacZ | PMID: 18258485 | ||
| Genetic reagent (Drosophila melanogaster) | Stat-GFP | PMID: 17008134 | ||
| Genetic reagent (Drosophila melanogaster) | hsflp[122]; act > CD2>Gal4; UAS-Dicer2, UAS-GFP | PMID: 9428512 | ||
| Genetic reagent (Drosophila melanogaster) | UAS-lola | This paper | generated by microinjection | |
| Antibody | anti-Delta (mouse monoclonal) | DSHB | Cat# c594.9b, RRID:AB_528194 | IF (1:100) |
| Antibody | anti-Prospero (mouse monoclonal) | DSHB | Cat# Prospero (MR1A), RRID:AB_528440 | IF (1:2000) |
| Antibody | anti- Arm (mouse monoclonal) | DSHB | Cat# N2 7A1 ARMADILLO, RRID:AB_528089 | IF (1:500) |
| Antibody | anti-p-H3 (rabbit polyclonal) | Cell Signaling | Cat# 9701, RRID:AB_331535 | IF (1:2000) |
| Antibody | anti-dpERK (rabbit monoclonal) | Cell Signaling | Cat# 4370, RRID:AB_2315112 | IF (1:1000) |
| Antibody | anti-β-gal (rabbit polyclonal) | Thermo Fisher | Cat# A-11132, RRID:AB_221539 | IF (1:500) |
| Antibody | anti-Phalloidin-TRITC | PMID: 28242614 | IF (1:20000) | |
| Antibody | anti- Cleaved Caspase-3 (rabbit polyclonal) | Cell Signaling | Cat# 9661, RRID:AB_2341188 | IF (1:100) |
| Antibody | anti-Pdm1 | a gift from Xiaohang Yang, Zhejiang University, China | IF (1:500) | |
| Antibody | anti-Dref | a gift from Masamitsu Yamaguchi, Kyoto Institute of Technology, Japan | IF (1:100) | |
| Antibody | anti-Yki | PMID: 23999857 | IF (1:100) produced by immunizing rabbits with the Yki peptide of amino acids 180–418 | |
| Antibody | anti-Lola | This paper | IF (1:100) produced by immunizing rabbits with the peptide of Lola amino acids 1–467 |
Additional files
-
Supplementary file 1
Details of the top 500 peaks from lola ChIP-seq analysis.
- https://cdn.elifesciences.org/articles/47542/elife-47542-supp1-v2.xlsx
-
Supplementary file 2
The relative expression of 2116 DEGs indicated by reads counts from the RNA-seq profiles.
- https://cdn.elifesciences.org/articles/47542/elife-47542-supp2-v2.xlsx
-
Transparent reporting form
- https://cdn.elifesciences.org/articles/47542/elife-47542-transrepform-v2.docx
Download links
A two-part list of links to download the article, or parts of the article, in various formats.
Downloads (link to download the article as PDF)
Open citations (links to open the citations from this article in various online reference manager services)
Cite this article (links to download the citations from this article in formats compatible with various reference manager tools)
Lola regulates Drosophila adult midgut homeostasis via non-canonical hippo signaling
eLife 9:e47542.
https://doi.org/10.7554/eLife.47542


