Body height in young adult men and risk of dementia later in adult life
- Bispebjerg and Frederiksberg Hospital, Denmark
- University of Copenhagen, Denmark
- University of Southern Denmark, Denmark
Figures
Figure 1 with 1 supplement

Selection of the study population.
Figure 1—figure supplement 1
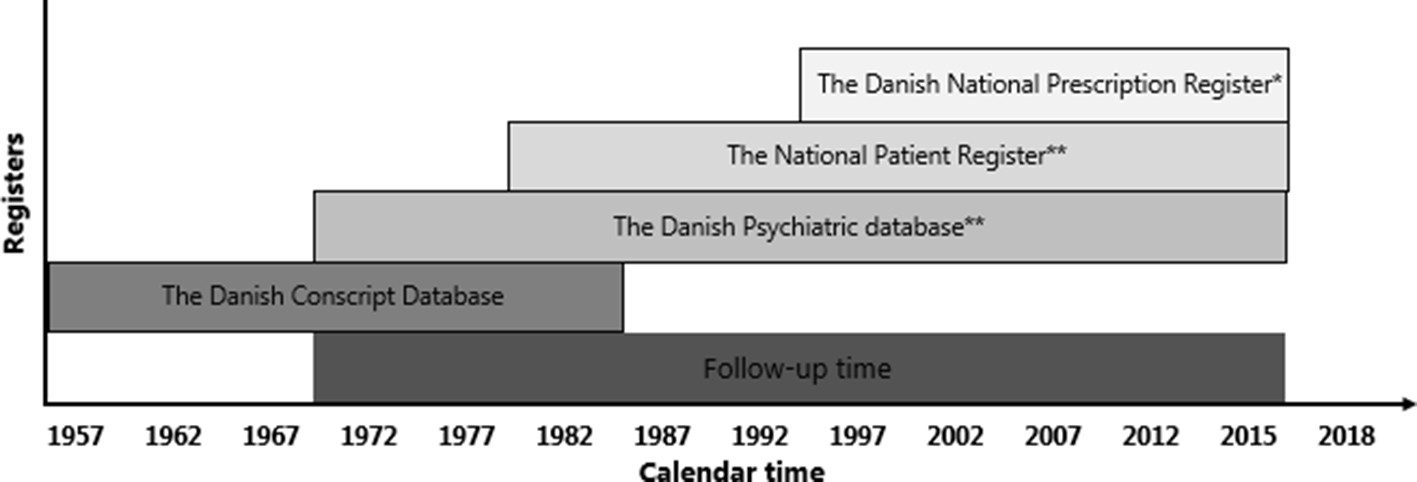
Time line of data collection from each of the registers and the total follow-up time.
Foot note: *Anatomic Therapeutical Chemical (ATC) code for dementia (N06D) is also used for patients with Parkinson’s disease, but the treatment is only indicated if the patients have comorbid dementia. **Dementia was identified by international classification of disease (ICD) version 8 codes (290.00–290.99) until the end of 1994 and by ICD10 codes (F00.0-F03.9; G30.0-G30.9) from 1995 and thereafter.
Figure 2 with 1 supplement

Hazard Ratios (HRs) and corresponding 95% confidence intervals (95% CIs) for the association between z-score of body height at the entry to adulthood as a cubic spline with four knots and dementia.
A z-score of 0 is the reference value. Stratified by birth cohort and adjusted for conscript board district, educational level and intelligence test scores. Age included as underlying scale of the model. The analysis included the total population of men. Identify cohort-specific values of one z-score in Supplementary file 2.
Figure 2—figure supplement 1
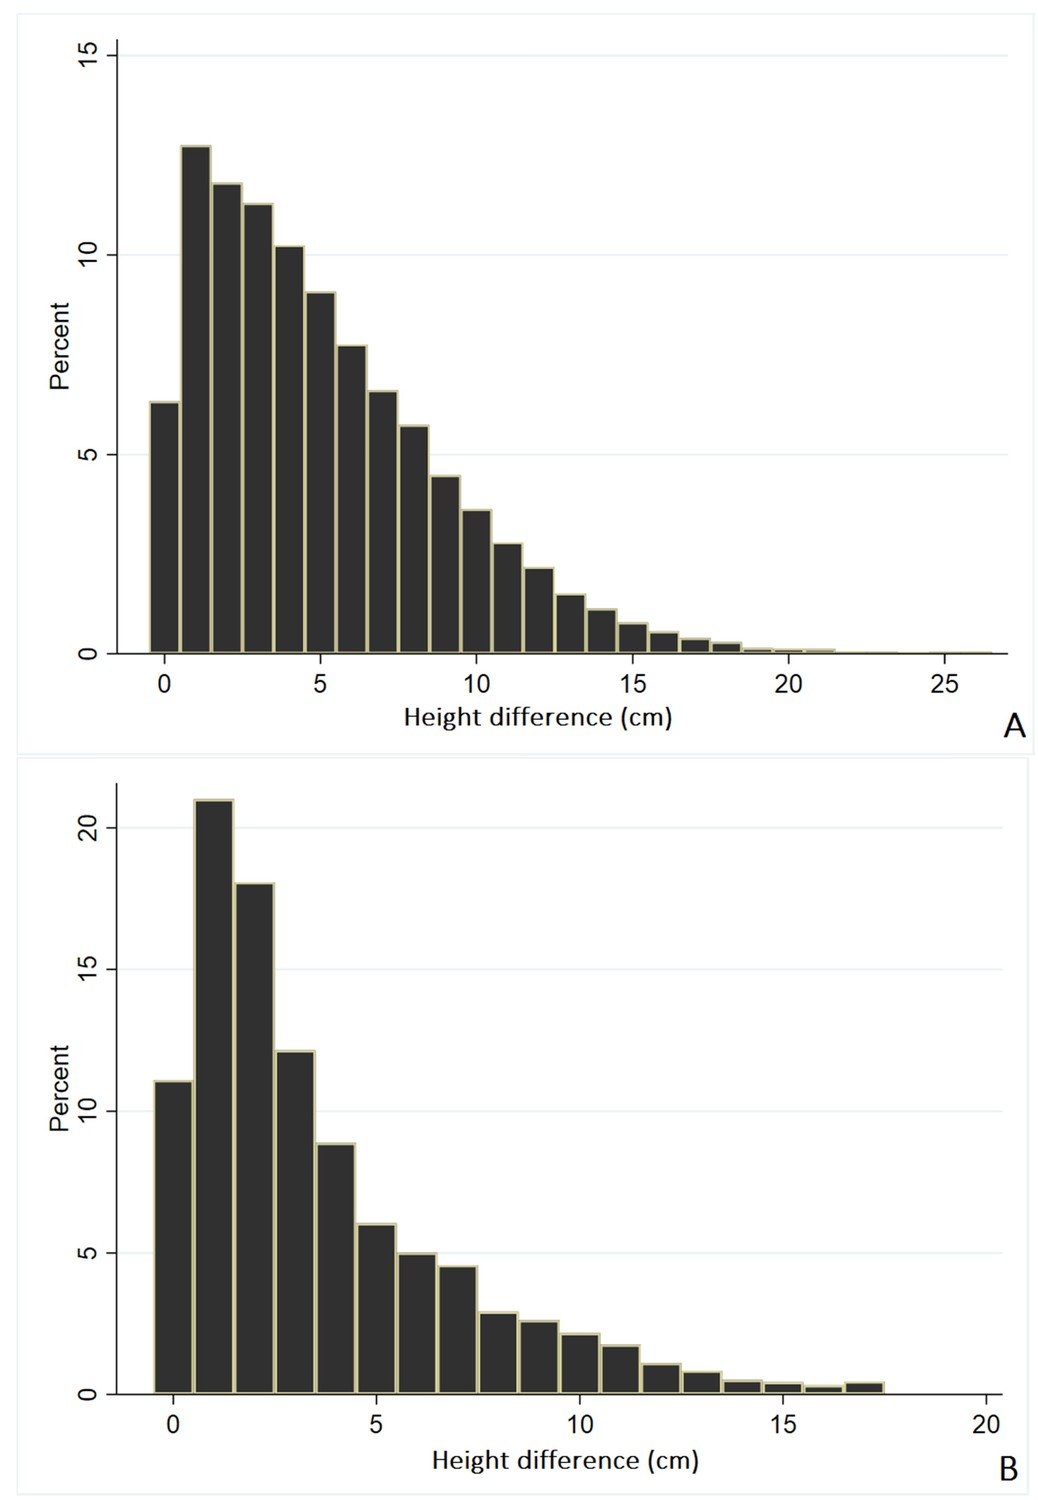
Distribution of mean numeric difference in body height in cm between brothers (A) and twins (B).
Note: to hide micro data, the value 26 includes all values above for brother and the value 17 includes all values above for twins. In cases where there were more than two brothers with a shared mother, the difference in body height between all brothers were included. For example, for a groups of three brothers, the differences between brother one and two, brother one and three, and brother two and three, respectively, were included.
Tables
Table 1
Hazard ratios (HRs) and corresponding 95% confidence intervals (95% CIs) of the association between taller body height at entry to adulthood and dementia diagnoses among the total population of men.
| Descriptive statistics | HR (95% CI) for onset of dementia per one z-score* higher | ||||
|---|---|---|---|---|---|
| Mean height (Standard diviation) | Dementia cases Number (%) | Model 1† | Model 2a‡ | Model 2b§ | Model 3¶ |
| 176.8 (6.6) | 10,599 (1.6) | 0.86 (0.85;0.87) | 0.88 (0.87;0.89) | 0.90 (0.89;0.90) | 0.90 (0.89;0.90) |
-
*Identify cohort-specific values of one z-score in Supplementary file 2.
†Model 1: Stratified by birthcohort and conscript board district. Age included as underlying scale of the model.
-
‡Model 2a: Model 1 + adjusted for educational level.
§Model 2b: Model 1 + adjusted for intelligence test scores.
-
¶Model 3: Model 1 + adjusted for educational level and intelligence test scores.
Table 2
Fully adjusted* hazard ratios (HRs) and corresponding 95% confidence intervals (95% CIs) of the association between taller body height at entry to adulthood and dementia diagnosis among all men.
| Dementia cases Number (%) | HR (95% CI) for onset of dementia per one z-score* higher |
|---|---|
| <60 years | |
| 4191 (0.6) | 0.87 (0.84;0.90) |
| ≥60 years | |
| 6408 (1.3) | 0.91 (0.90;0.92) |
-
*Identify cohort-specific values of one z-score in Supplementary file 2.
†Model 3: stratified by birth cohort and adjusted for conscript board district, educational level and intelligence test scores. Age included as underlying scale of the model.
Table 3
Fully adjusted* hazard ratios (HRs) and corresponding 95% confidence intervals (95% CIs) of the association between taller body height at entry to adulthood and dementia diagnosis among brothers and twins
| Descriptive statistics | HR (95% CI) for onset of dementia per one z-score* higher | ||
|---|---|---|---|
| Mean height (standard deviation) | Dementia cases Number (%) | Cohort analyses | Within-brother/twin analyses |
| Brothers | |||
| 177.8 (6.6) | 597 (0.8) | 0.90 (0.82;0.98) | 0.78 (0.64;0.96) |
| Twins | |||
| 175.8 (6.7) | 107 (1.4) | 0.91 (0.73;1.16) | 0.86 (0.44;1.68) |
-
*Identify cohort-specific values of one z-score in Supplementary file 2.
†Model 3: Stratified by birth cohort and adjusted for conscript board district, educational level and intelligence test scores. Age included as underlying scale of the model.
Additional files
-
Source code 1
Stata code used for the analyses.
- https://cdn.elifesciences.org/articles/51168/elife-51168-code1-v1.do
-
Supplementary file 1
Distribution of covariates for body height and dementia diagnoses among the total population of men.
- https://cdn.elifesciences.org/articles/51168/elife-51168-supp1-v1.docx
-
Supplementary file 2
Mean body height (z-scores) in cm for each of the birth cohorts in the full study population, brothers and twins.
- https://cdn.elifesciences.org/articles/51168/elife-51168-supp2-v1.docx
-
Supplementary file 3
Fully adjusted* hazard ratios (HRs) of the association between taller body height at entry to adulthood and dementia diagnosis among all men before 1995 and from 1995 and onwards.
- https://cdn.elifesciences.org/articles/51168/elife-51168-supp3-v1.docx
-
Supplementary file 4
Frequency (%) of individuals included from each birth cohort in the brother analyses.
- https://cdn.elifesciences.org/articles/51168/elife-51168-supp4-v1.docx
-
Transparent reporting form
- https://cdn.elifesciences.org/articles/51168/elife-51168-transrepform-v1.docx
Download links
A two-part list of links to download the article, or parts of the article, in various formats.
Downloads (link to download the article as PDF)
Open citations (links to open the citations from this article in various online reference manager services)
Cite this article (links to download the citations from this article in formats compatible with various reference manager tools)
Body height in young adult men and risk of dementia later in adult life
eLife 9:e51168.
https://doi.org/10.7554/eLife.51168


