Selection on mutators is not frequency-dependent
- Brown University, United States
Figures
Figure 1 with 1 supplement
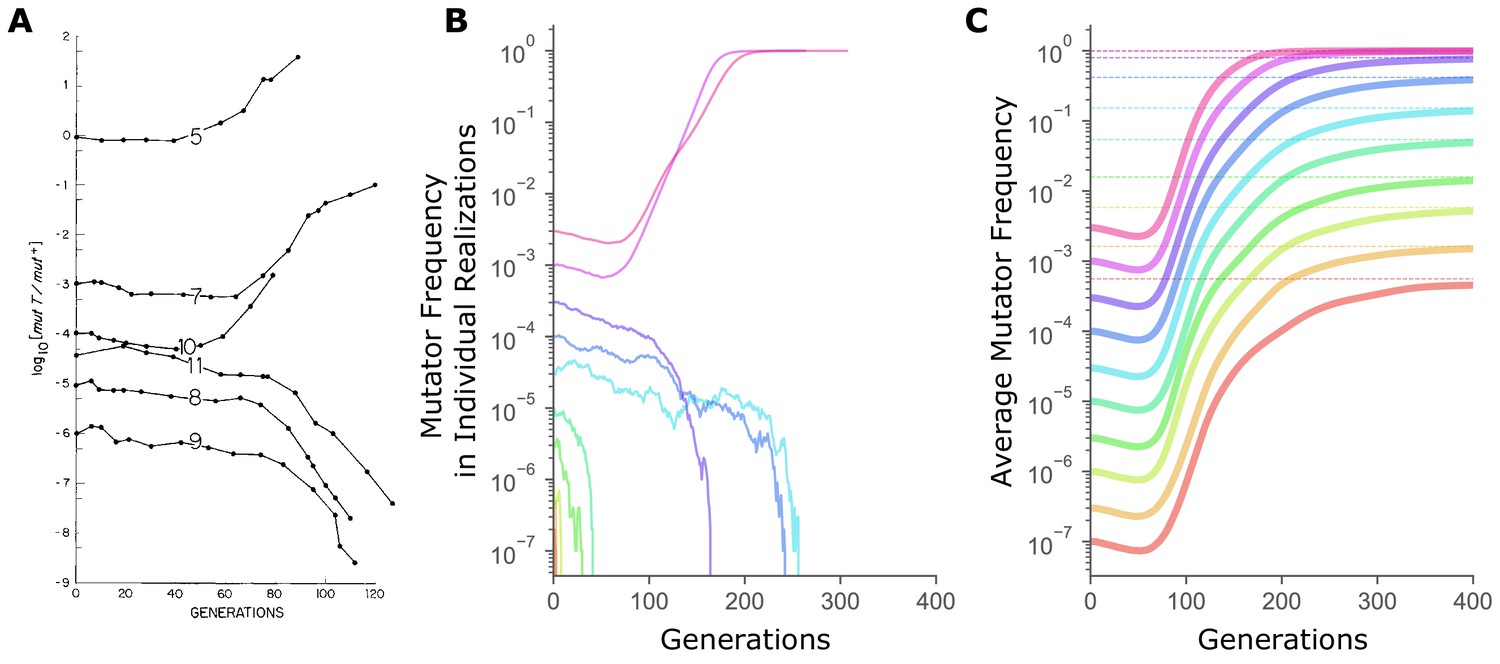
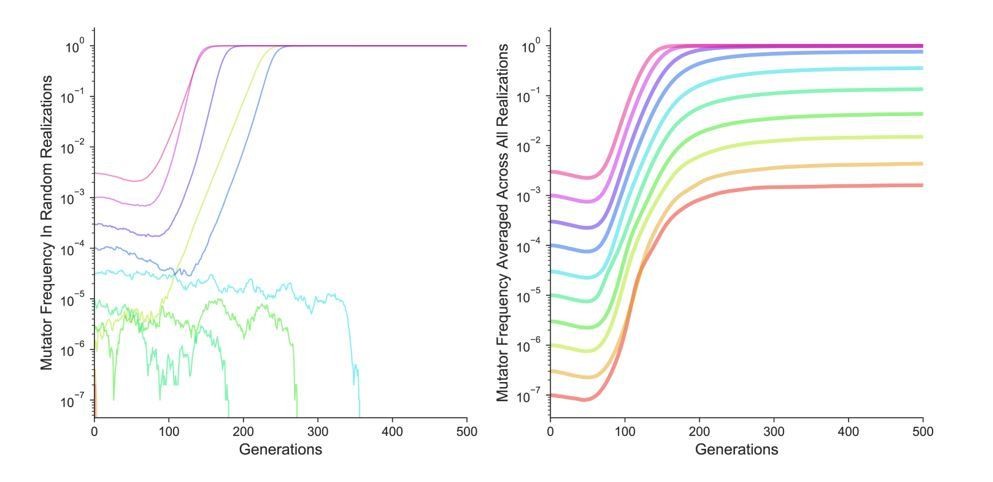
The sharp transition between fixation and loss in mutator dynamics at different starting frequencies is due to limited sampling.
(A) Changes in the ratio of the mutator and the wild-type alleles of the E. coli mutT locus over time in continuous chemostat cultures. (Figure 1 from Chao and Cox, 1983). (B) In simulations, mutator trajectories in individual realizations initiated at different starting frequencies recapitulate the experimental observation of the frequency-threshold for mutator hitchhiking. Parameter values used are typical of microbial experimental populations (Raynes et al., 2018): N = 107, Udel = 10−4, Uben = 10−6, constant sben = 0.1, constant sdel = -0.1. Mutators mutate 100× faster than non-mutators. (C) Average mutator trajectories across realizations do not show evidence of the frequency-threshold. On average, mutators increase in frequency at all , showing that selection favors mutators independent of frequency. Average mutator frequency always eventually reaches the expected (dashed horizontal lines) calculated in Figure 2. Mutator frequencies averaged across 106 simulation runs at = 10−7 and = 3×10⁻⁷, and across 105 simulation runs for all other starting frequencies. For simulations with exponentially distributed selection coefficients see Figure 1—figure supplement 1.
© 1983 John Wiley and Sons. All Rights Reserved. Figure 1 reproduced from Chao and Cox, 1983 with permission.
-
Figure 1—source data 1
Numerical data represented in Figure 1.
Data set includes mutator frequencies in randomly-chosen individual realizationss and mutator frequencies averaged across all realizations.
- https://doi.org/10.7554/eLife.51177.005
Figure 1—figure supplement 1
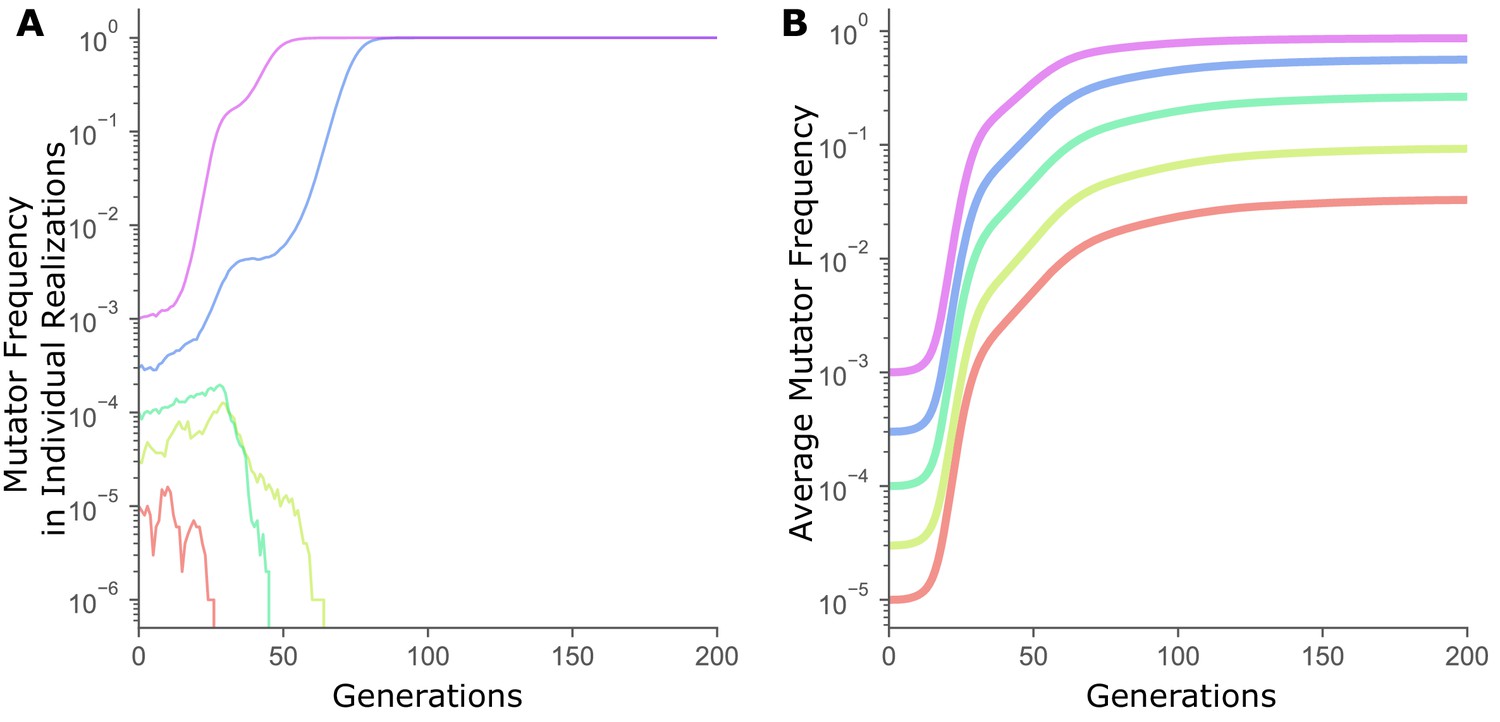
Simulations with exponentially distributed selection coefficients confirm that the frequency-dependent threshold in mutator dynamics is due to limited sampling.
(A) Mutator trajectories in individual realizations. (B) Average mutator trajectories across realizations. Mutator frequencies averaged across 105 simulation runs. Parameter values as in Figure 1 except N = 106, and beneficial and deleterious mutations are now randomly drawn from an exponential distribution with the mean sben = 0.1 and sdel = −0.1 respectively.
-
Figure 1—figure supplement 1—source data 1
Numerical data represented in Figure 1—figure supplement 1.
Data set includes mutator frequencies in randomly-chosen individual realizationss and mutator frequencies averaged across all realizations.
- https://doi.org/10.7554/eLife.51177.004
Figure 2
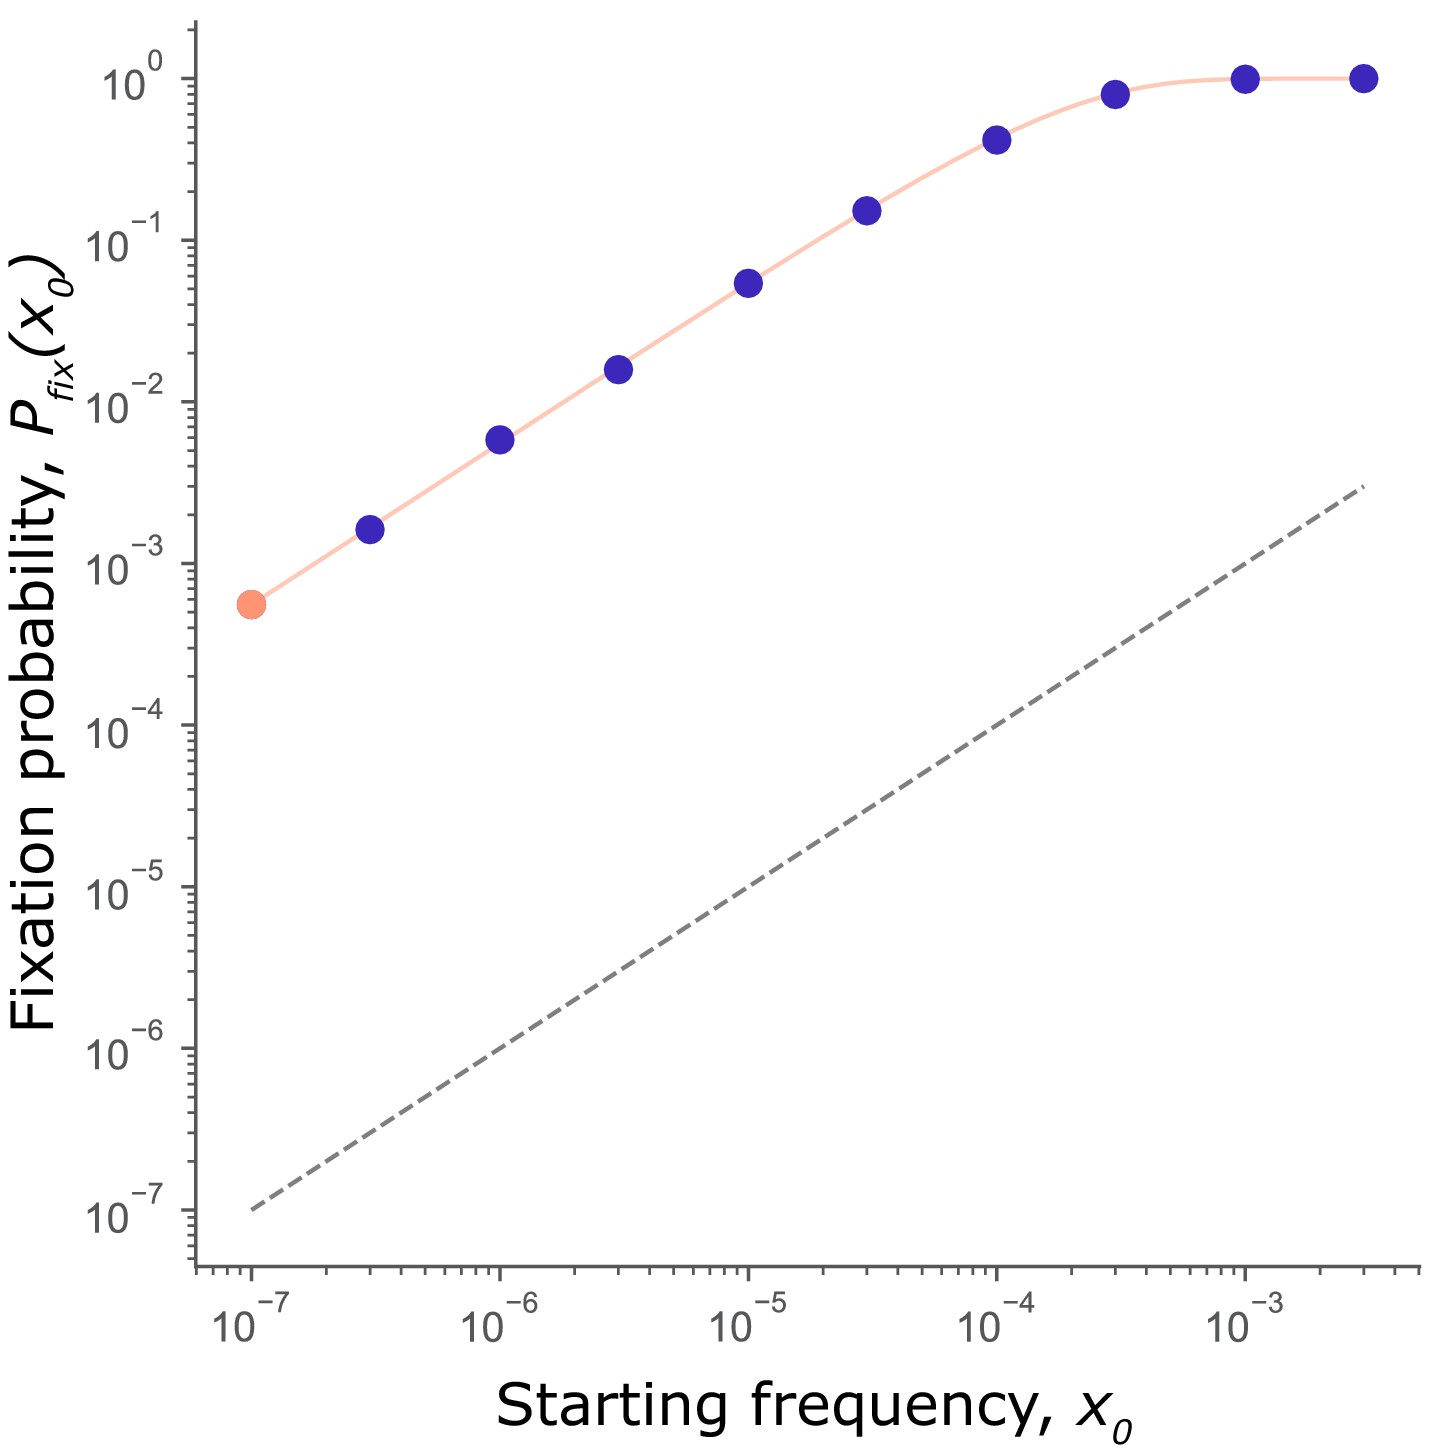
Mutator fixation probability is not frequency-dependent.
Fixation probability, of a mutator initiated at frequency (circles: orange for purple for ). Data from simulations in Figure 1. scales with but never crosses the fixation probability of a neutral mutation (; black dashed line). Thus, mutators are favored at all starting frequencies. The expected fixation probability (solid orange line), calculated from the fixation probability of a single mutator, = 5.6×10⁻⁴ (orange point) using Equation 1 is indistinguishable from the observed in simulations, demonstrating that the per-capita fixation probability at every frequency is independent of and equal to .
-
Figure 2—source data 1
Numerical data represented in Figure 2.
Data set includes fixation probabilities of a mutator allele at each initial frequency shown.
- https://doi.org/10.7554/eLife.51177.007
Figure 3
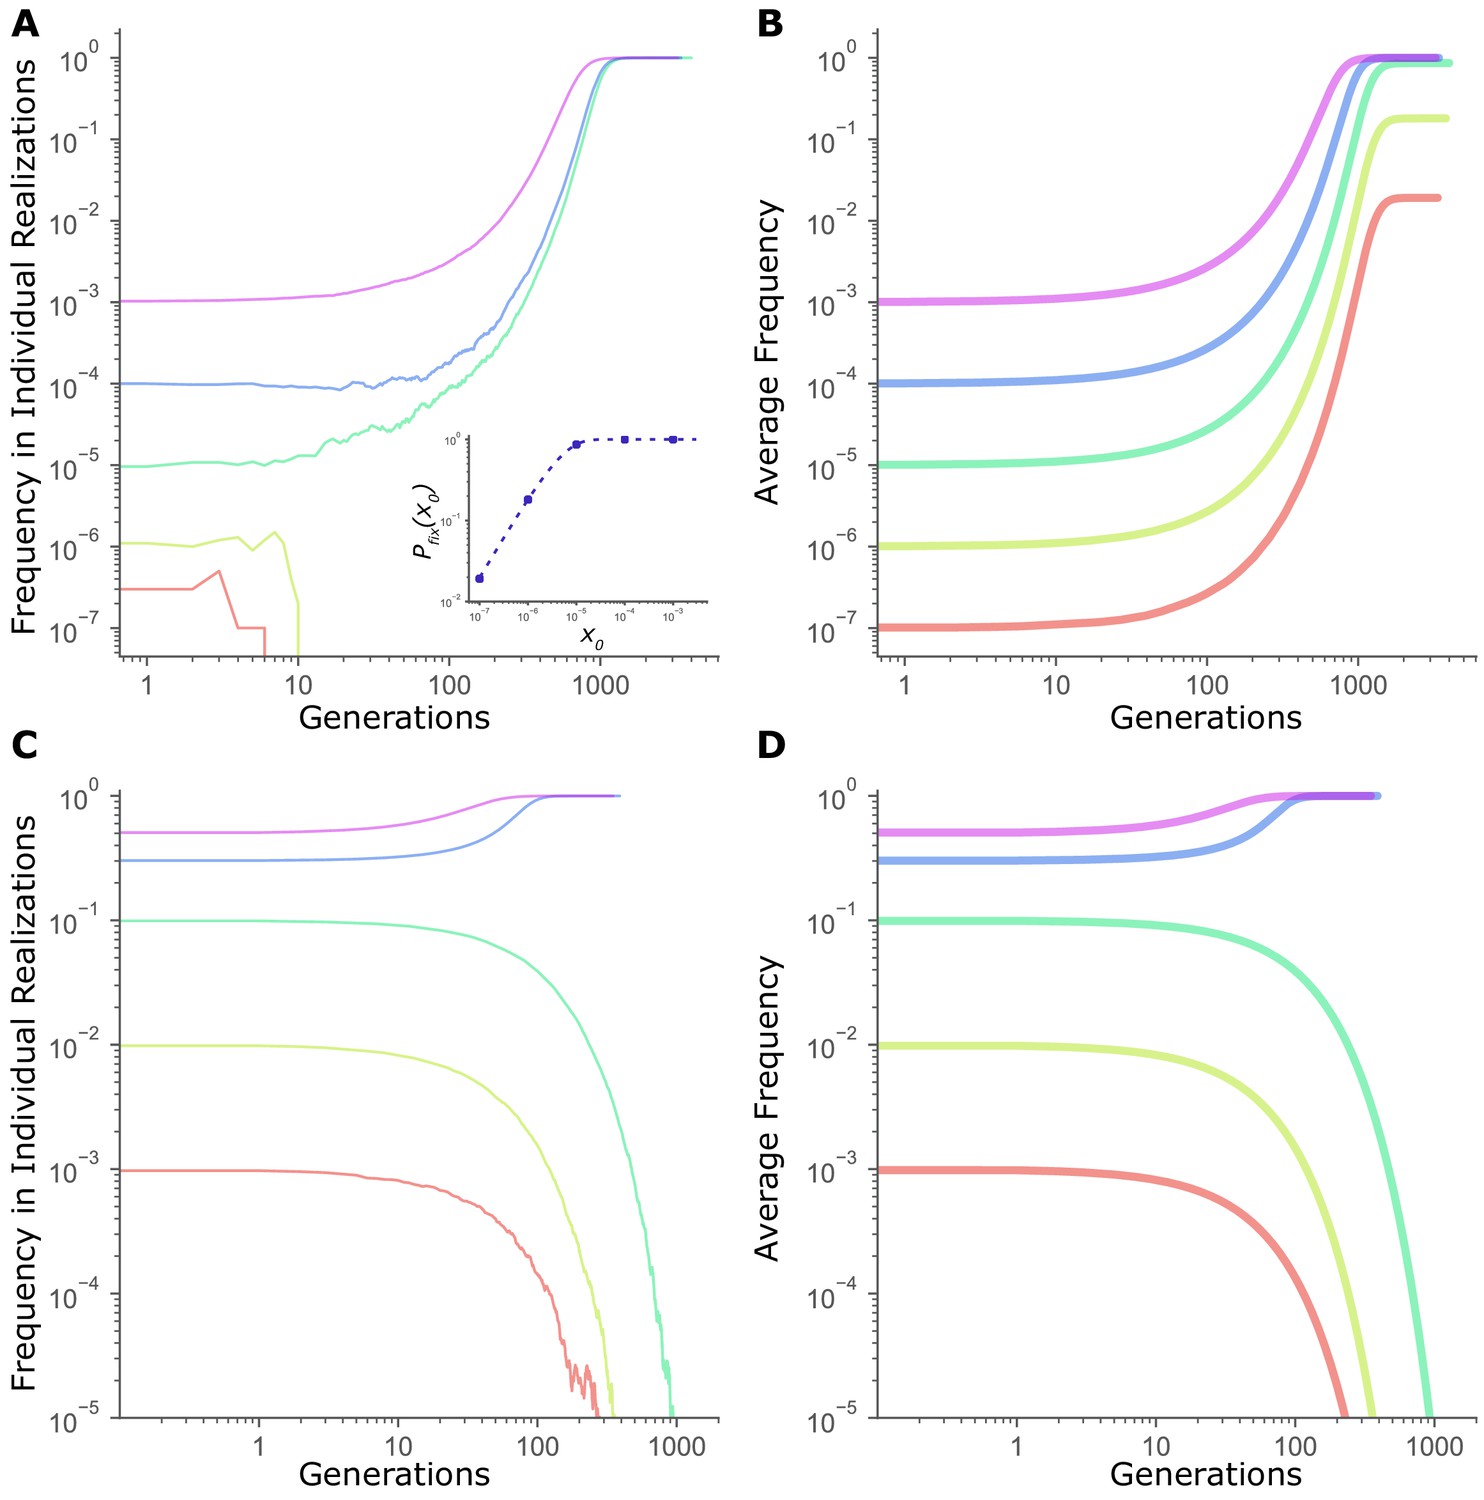
Frequency threshold in dynamics of fitness-affecting mutations.
(A) Individual realizations of a simulation initiated with a directly beneficial mutation of size = 0.01 at a starting frequency . Population size, N = 107. Inset: Fixation probability of a beneficial mutation of size =0.01 at N = 107. Dashed line is given by (Kimura, 1962), while circles are values of measured in simulations (averaged across 105 runs). (B) Average frequency trajectories of a beneficial mutation of size = 0.01 in (A) averaged across all 105 runs of simulation. (C) Individual realizations of a simulation initiated with a mutation under frequency dependent selection, with the selection coefficient s(x) = b + mx, where x is the frequency, b = -0.02, and m = 0.1, at N = 107. (D) Average frequency trajectories of the frequency-dependent mutation in (C) averaged across all 105 runs of simulation. All panels are on a log-log scale for clarity.
-
Figure 3—source data 1
Numerical data represented in Figure 3.
Data set includes frequencies of a beneficial mutation and a frequncy-dependent mutation in randomly-chosen individual realizations and averaged across all replicate realizations.
- https://doi.org/10.7554/eLife.51177.009
Author response image 1
Additional files
-
Transparent reporting form
- https://doi.org/10.7554/eLife.51177.010
Download links
A two-part list of links to download the article, or parts of the article, in various formats.
Downloads (link to download the article as PDF)
Open citations (links to open the citations from this article in various online reference manager services)
Cite this article (links to download the citations from this article in formats compatible with various reference manager tools)
Selection on mutators is not frequency-dependent
eLife 8:e51177.
https://doi.org/10.7554/eLife.51177


