Purkinje cell misfiring generates high-amplitude action tremors that are corrected by cerebellar deep brain stimulation
- Department of Pathology and Immunology, Baylor College of Medicine, United States
- Department of Neuroscience, Baylor College of Medicine, United States
- Jan and Dan Duncan Neurological Research Institute of Texas Children's Hospital, United States
- Development, Disease Models & Therapeutics Graduate Program, Baylor College of Medicine, United States
Figures
Figure 1 with 3 supplements

Purkinje cell neurotransmission is necessary for producing baseline physiological tremor and pathological tremor.
(a) Representation of a sagittal section of a mouse cerebellum indicating its spatial relationship to other landmarks of the central nervous system. Green region = Purkinje cell dendrites and molecular layer, purple region = cerebellar nuclei, yellow region = inferior olive. (b) Representation of a coronal section through a mouse cerebellum where the fastigial nucleus (FN), interposed nucleus (IN), and dentate nucleus (DN) are all visible. Green region = Purkinje cell dendrites and molecular layer, purple regions = cerebellar nuclei, yellow regions = inferior olive. (c) Representation of a simplified cerebellar circuit including a Purkinje cell (PC, green), cerebellar nuclei (CN, purple), inferior olive (IO, yellow), mossy fibers (MF), granule cell (GC), and molecular layer interneuron (MLI). Large circles = cell bodies, small circle terminals = excitatory synapses, flat terminals = inhibitory synapses. (d) Representation of the result of genetic manipulation in Pcp2Cre;Slc32a1flox/flox mice. Control Purkinje cell synapse depicted in blue on left, Pcp2Cre;Slc32a1flox/flox Purkinje cell synapse depicted in red on right. Large open circles = vesicles. Small filled circles = GABA. Purple ellipse pairs = VGAT. Bright red action potential cartoon represents an action potential reaching the synapse and triggering the fusion of vesicles to the presynaptic membrane and release of the vesicles’ contents, such as GABA, onto receptors in the postsynaptic membrane (black ellipse pairs). GABA is released from Purkinje cells during fast neurotransmission in Slc32a1flox/flox mice, but not in Pcp2Cre;Slc32a1flox/flox mice. (e) Representation of a commercial tremor monitor. Inset = dotted rectangle. Accelerometer = orange rectangle. (f–g) Solid line = mean. Shaded region = standard error of the mean (SEM). Legend above. Source data available in Figure 1—source data 1. (f) Mice lacking Purkinje cell GABA neurotransmission had lower baseline physiological tremor compared to control animals. Control N = 16, mutant N = 12. (g) While control animals exhibited the typical robust tremor after harmaline administration (N = 16), Pcp2Cre;Slc32a1flox/flox animals had no significant increase in tremor in response to the drug (N = 13). The baseline data from f are repeated on this graph for scale. (h) Summed tremor power within the alpha and beta bands. Legend above. (i) Summed tremor power within the gamma band. Legend above. Source data for h and i are available in Figure 1—source data 1. (j–q) c-Fos expression in the cerebellar nuclei (j, l, n, p) and inferior olive (k, m, o, q) after saline (j–k, n–o) or harmaline (l–m, p–q) administration. For the tremor recordings, we define baseline as it relates to the conditions performed with and without harmaline, whereas the saline injection group relates to the experiments in which c-Fos measurements were carried out. Cerebellar nuclei scale = 250 µm. Inferior olive scale = 250 µm.
-
Figure 1—source data 1
Source data for representative graphs in Figure 1.
- https://cdn.elifesciences.org/articles/51928/elife-51928-fig1-data1-v1.xlsx
Figure 1—figure supplement 1
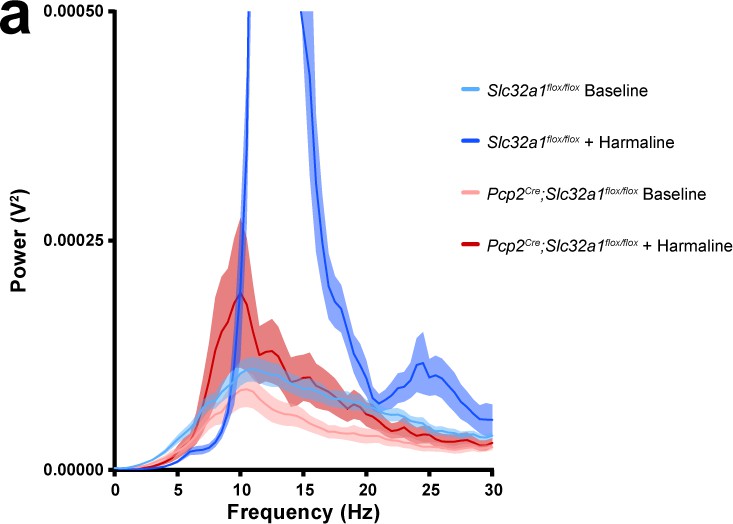
Baseline tremor power of both genotypes and power of tremor in recordings of Pcp2Cre;Slc32a1flox/flox mice after harmaline administration are an order of magnitude smaller than that of Slc32a1flox/flox mice after harmaline administration.
(a) Solid line = mean. Shaded region = standard error of the mean (SEM). Legend on right. This is a magnified view of the data in Figure 1g.
-
Figure 1—figure supplement 1—source data 1
Precision measures, exact p-values, and replicate data relevant to Figure 1.
- https://cdn.elifesciences.org/articles/51928/elife-51928-fig1-figsupp1-data1-v1.docx
Figure 1—figure supplement 2
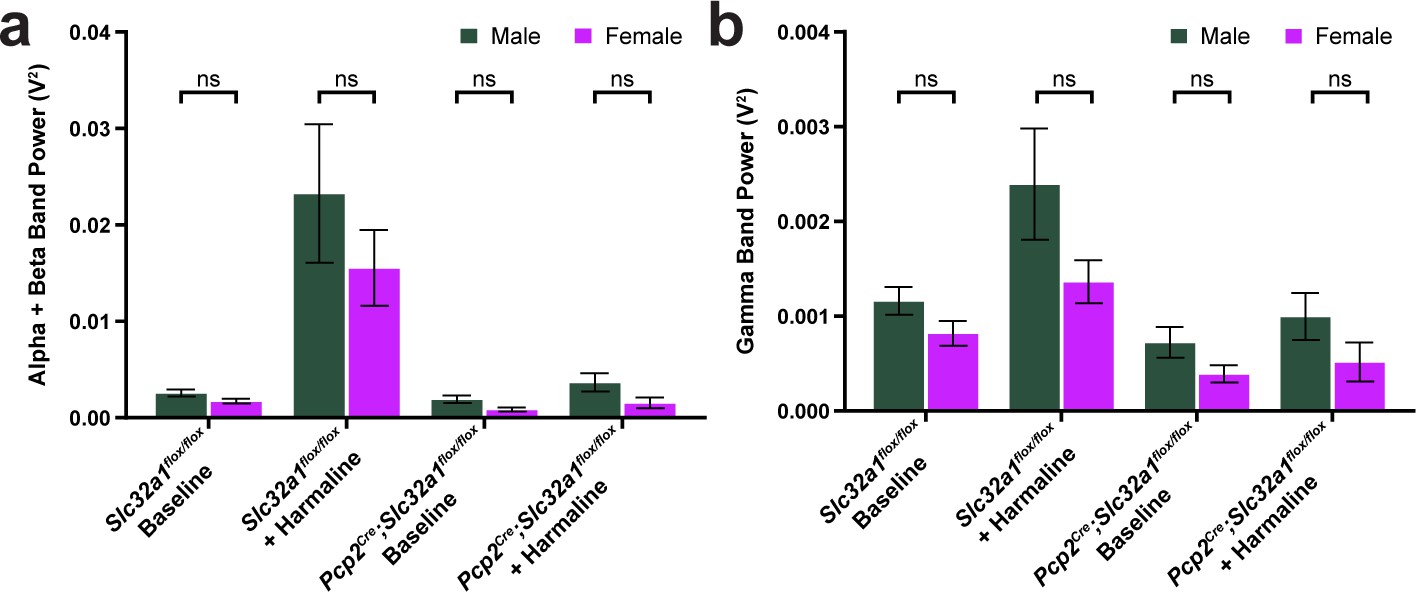
No difference in tremor was found between males and females.
(a–b) Comparison of male and female animals for all tremor conditions tested in Figure 1h–i. Green = male, magenta = female. No significant difference was found between sexes in any condition. Slc32a1flox/flox baseline male N = 10, alpha+beta mean = 0.002569, gamma mean = 0.001160; female N = 6, alpha+beta mean = 0.001718, gamma mean = 0.0008185. Slc32a1flox/flox + harmaline male N = 7, alpha+beta mean = 0.02326, gamma mean = 0.002392; female N = 6, alpha+beta mean = 0.01555, gamma mean = 0.001362. Pcp2Cre;Slc32a1flox/flox baseline male N = 7, alpha+beta mean = 0.001920, gamma mean = 0.0007224; female N = 5, alpha+beta mean = 0.0008516, gamma mean = 0.0003912. Pcp2;Slc32a1flox/flox + harmaline male N = 8, alpha+beta mean = 0.003662, gamma mean = 0.0009963; female N = 5, alpha+beta mean = 0.001541, gamma mean = 0.0005150. (a) Sex comparisons for alpha + beta tremor power. Slc32a1flox/flox baseline p=0.322685. Slc32a1flox/flox + harmaline p=0.464081. Pcp2Cre; Slc32a1flox/flox baseline p=0.218132. Pcp2Cre;Slc32a1flox/flox + harmaline p=0.322685. (b) Sex comparisons for gamma tremor power. Slc32a1flox/flox baseline p=0.443750. Slc32a1flox/flox + harmaline p=0.443750. Pcp2Cre;Slc32a1flox/flox baseline p=0.443750. Pcp2Cre;Slc32a1flox/flox + harmaline p=0.443750. Source data for this figure are available in Figure 1—figure supplement 2—source data 1.
-
Figure 1—figure supplement 2—source data 1
Source data for representative graphs in Figure 1—figure supplement 2.
- https://cdn.elifesciences.org/articles/51928/elife-51928-fig1-figsupp2-data1-v1.xlsx
Figure 1—figure supplement 3
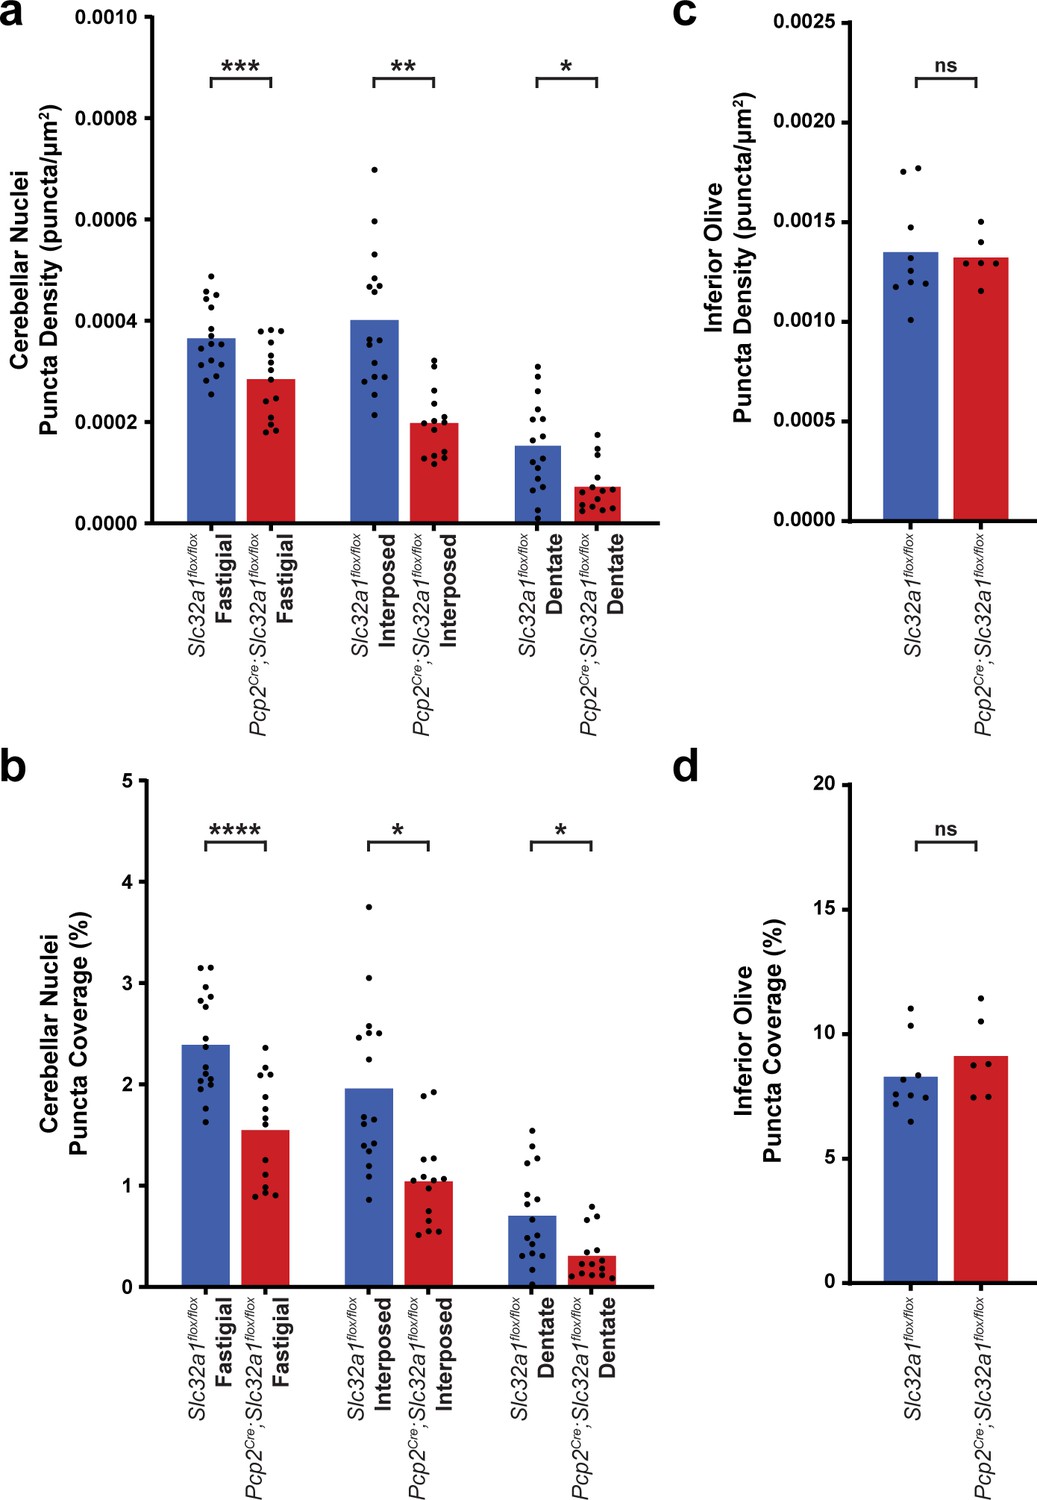
Mice lacking Purkinje cell GABA neurotransmission have reduced c-Fos expression in response to harmaline administration in the cerebellar nuclei, despite similar levels of activation in the inferior olive.
(a) Quantification of detected c-Fos puncta density in the cerebellar nuclei after harmaline administration. Fastigial: Slc32a1flox/flox n = 16, mean = 0.0003656; Pcp2Cre;Slc32a1flox/flox n = 14, mean = 0.0002849; p=0.0007. Interposed: Slc32a1flox/flox n = 16, mean = 0.0004015; Pcp2Cre;Slc32a1flox/flox n = 14, mean = 0.0001982; p=0.0011. Dentate: Slc32a1flox/flox n = 16, mean = 0.0001532; Pcp2Cre;Slc32a1flox/flox n = 14, mean = 7.209e-005; p=0.0418. (b) Quantification of the percent of the area of the cerebellar nuclei covered by the area of detected c-Fos puncta. Fastigial: Slc32a1flox/flox n = 16, mean = 2.390; Pcp2Cre;Slc32a1flox/flox n = 14, mean = 1.549; p<0.0001. Interposed: Slc32a1flox/flox n = 16, mean = 1.959; Pcp2Cre;Slc32a1flox/flox n = 14, mean = 1.042; p=0.0123. Dentate: Slc32a1flox/flox n = 16, mean = 0.7028; Pcp2Cre;Slc32a1flox/flox n = 14, mean = 0.3080; p=0.0368. (c) Quantification of detected c-Fos puncta density in the inferior olive after harmaline administration. Slc32a1flox/flox n = 9, mean = 0.001350; Pcp2Cre;Slc32a1flox/flox n = 6, mean = 0.001324; p=0.8202. (d) Quantification of the percent of the area of the inferior olive covered by the area of detected c-Fos puncta. Slc32a1flox/flox n = 9, mean = 8.284; Pcp2Cre;Slc32a1flox/flox n = 6, mean = 9.119; p=0.3229. Source data for this figure are available in Figure 1—figure supplement 3—source data 1.
-
Figure 1—figure supplement 3—source data 1
Source data for representative graphs in Figure 1—figure supplement 3.
- https://cdn.elifesciences.org/articles/51928/elife-51928-fig1-figsupp3-data1-v1.xlsx
Figure 2
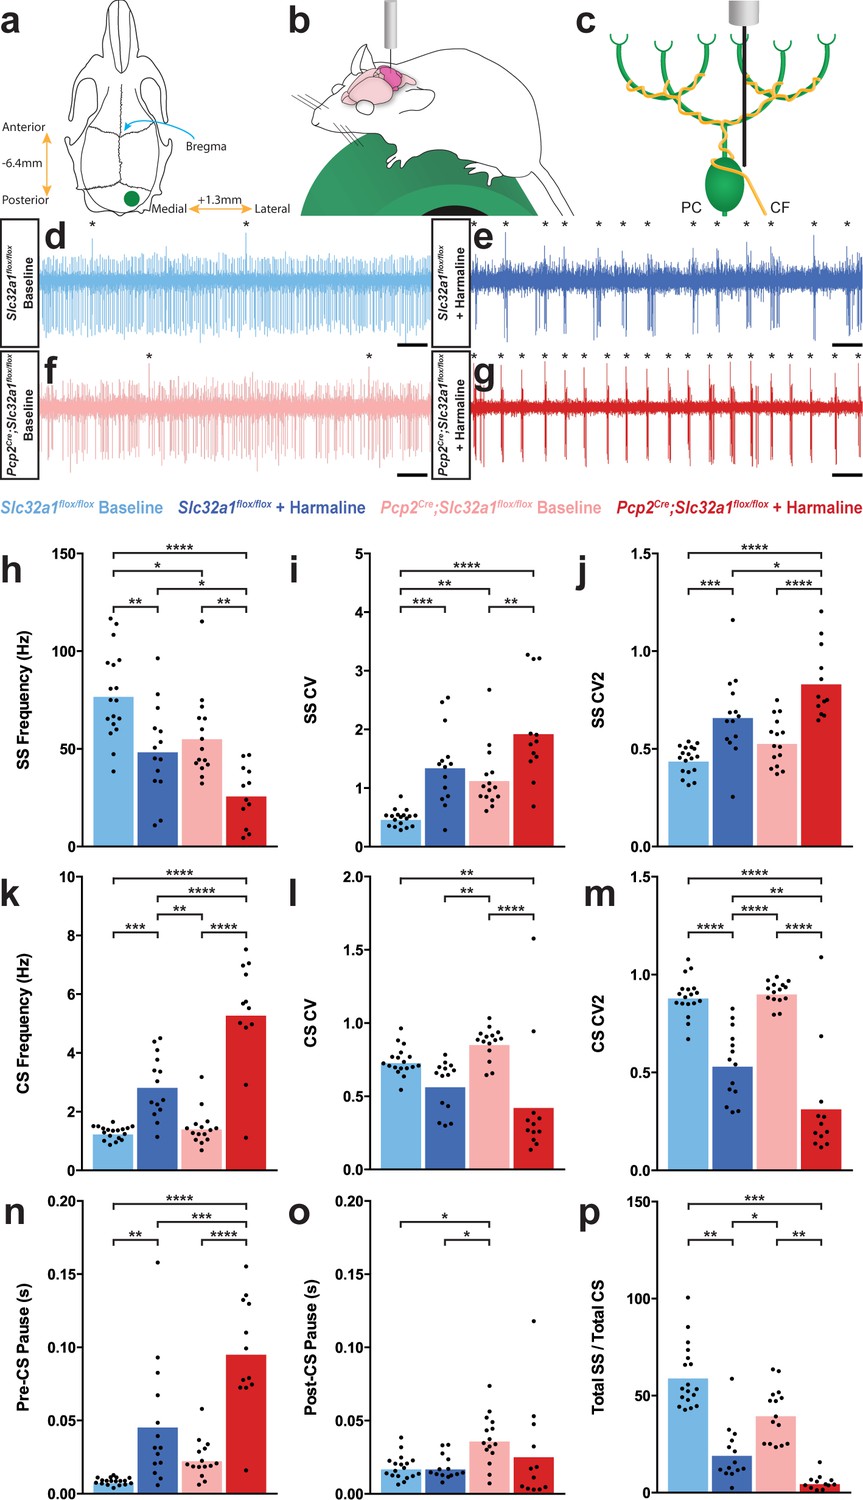
Purkinje cell firing patterns are significantly altered after harmaline administration.
(a) Representation of craniotomy site using skull landmarks. Craniotomy (green circle) for awake head-fixed neural recordings was made −6.4 mm from Bregma (blue arrow) and 1.3 mm lateral from midline. (b) Representation of awake head-fixed recordings. Mice were allowed to stand on a green foam wheel (green cylinder) during recordings. (c) Representation of extracellular recordings of Purkinje cells (PC) which allowed recordings of simple spikes and complex spikes, which are triggered by the climbing fiber (CF). (d–g) Example raw traces from recordings of Purkinje cells. Complex spikes are indicated with asterisks. Scale = 500 ms. (d) Purkinje cell from a control animal. (e) Purkinje cell from a control animal during tremor after harmaline administration. (f) Purkinje cell from a mutant animal. (g) Purkinje cell from a mutant animal after harmaline administration (tremor not present). (h–j) Quantification of Purkinje cell simple spike firing properties including frequency (h), CV (i), and CV2 (j). (k–m) Quantification of Purkinje cell complex spike firing properties including frequency (k), CV (l), and CV2 (m). (n–p) Quantification of Purkinje cell simple spike and complex spike relationship including pre complex spike pause duration (n), post complex spike pause duration (o), and total simple spike to complex spike ratio (p). Source data for h–p are available in Figure 2—source data 1.
-
Figure 2—source data 1
Source data for representative graphs in Figure 2.
- https://cdn.elifesciences.org/articles/51928/elife-51928-fig2-data1-v1.xlsx
Figure 3
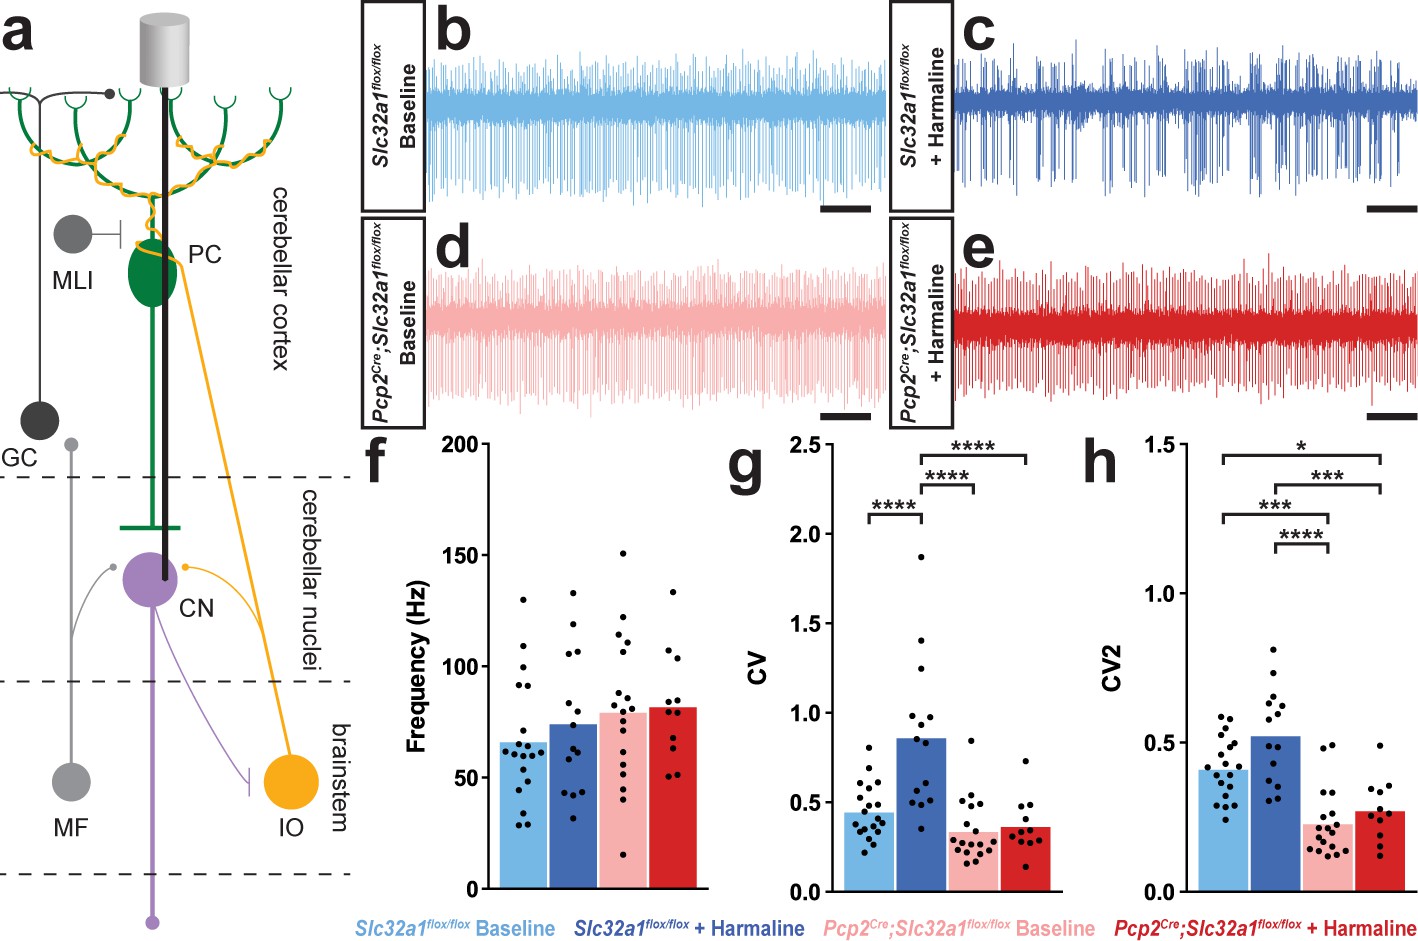
A burst pattern of cerebellar nuclei activity is associated with the tremor phenotype.
(a) Representation of an extracellular recording of the cerebellar nuclei. (b–e) Example raw traces from recordings of cerebellar nuclei cells. Scale = 250 ms. (b) Cerebellar nuclei cell from a control animal. (c) Cerebellar nuclei cell from a control animal during tremor, after harmaline administration. (d) Cerebellar nuclei cell from a mutant animal. (e) Cerebellar nuclei cell from a mutant animal after harmaline administration (tremor not present). (f) Quantification of population cerebellar nuclei firing frequency. (g) Quantification of population cerebellar nuclei CV. (h) Quantification of population cerebellar nuclei CV2. Source data for f–h are available in Figure 3—source data 1.
-
Figure 3—source data 1
Source data for representative graphs in Figure 3.
- https://cdn.elifesciences.org/articles/51928/elife-51928-fig3-data1-v1.xlsx
Figure 4 with 3 supplements
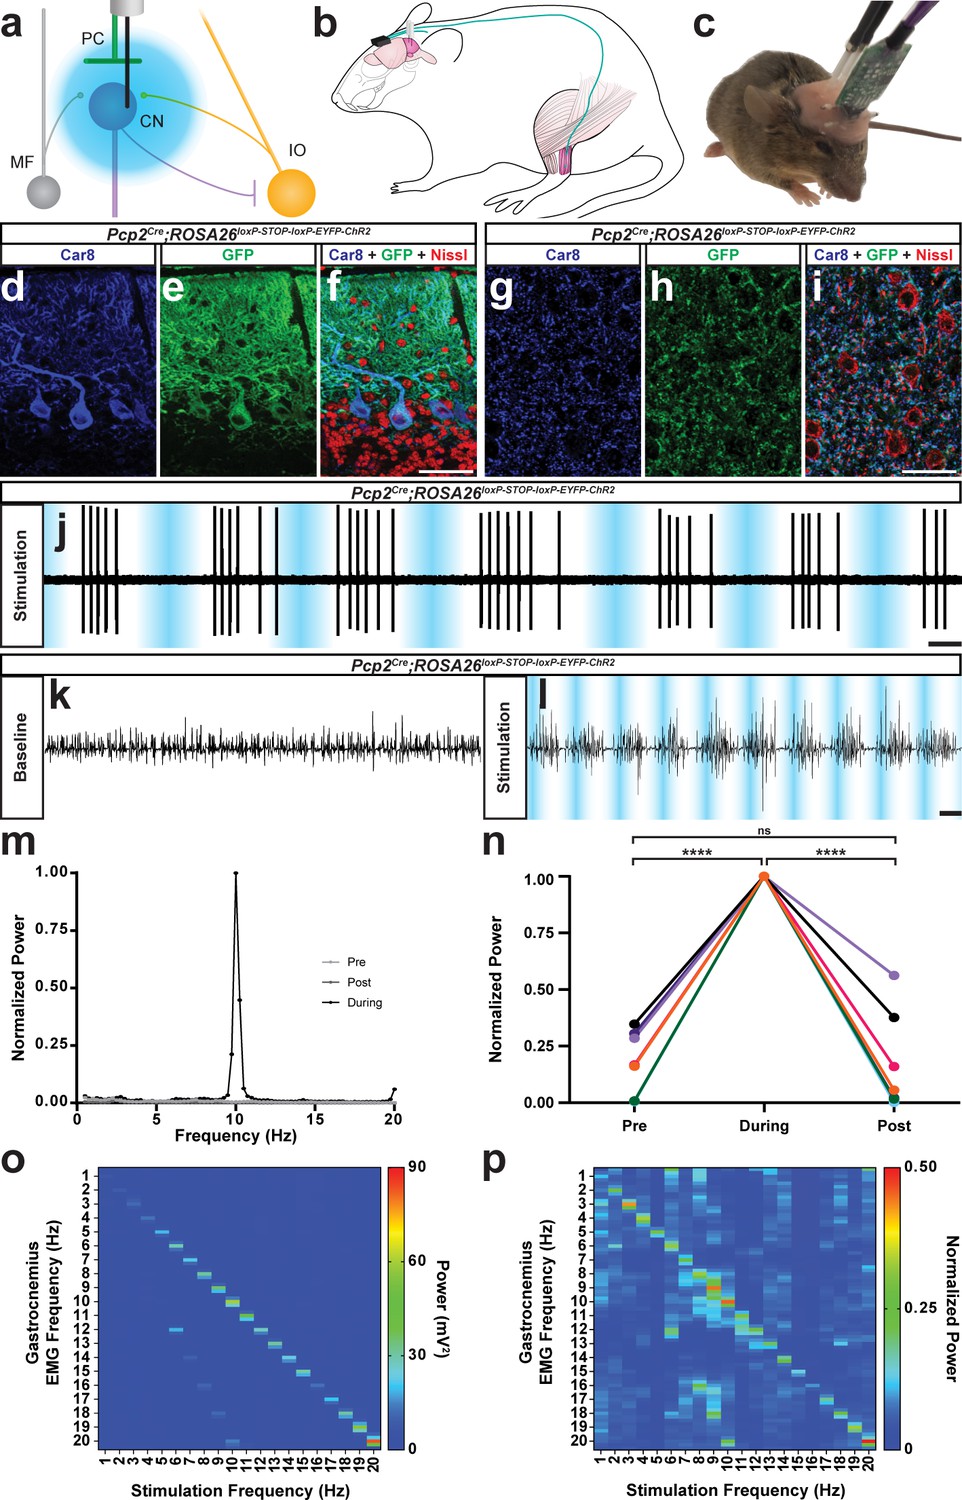
The burst pattern of cerebellar nuclei activity is sufficient to produce tremor at multiple frequencies.
(a) Representation of an optical fiber in the cerebellar nuclei. (b) Representation of EMG and optical fiber implant strategy. EMG electrodes are implanted into the gastrocnemius muscle (pink) of the left hindlimb and electrode wire (teal) is fed under the skin to a connector (black) fixed to the skull. An additional wire is fed from the connector to under the skin of the neck region as a ground. Two optical fibers (white) are implanted bilaterally targeting the interposed nucleus. (c) Image of a mouse during an EMG recording. A preamplifier (green) is placed in the connector and tethered to a passive commutator (not pictured). Fiber patch cables (black cables) are connected to the implanted optical fibers. (d–f) Triple-stained fluorescent micrographs of the cerebellar cortex. Scale = 50 µm. (d) CAR8 protein in Purkinje cells stained blue. (e) Membrane-bound ChR2 labeled with green fluorescent protein (GFP) stained green. (f) Composite of CAR8 (blue), GFP (green), and Nissl to label all cells (red). (g–i) Triple-stained fluorescent micrograph of cerebellar nuclei cells. Scale = 50 µm. (g) CAR8 protein in Purkinje cell terminals in the cerebellar nuclei (blue). (h) Membrane-bound ChR2 labeled with GFP (green). (d) Composite of CAR8 (blue), GFP (green), and Nissl to label all cells (red). (j) Example extracellular recording from a cerebellar nuclei cell during ChR2 stimulation of surrounding Purkinje cell terminals (blue bars). Scale = 250 ms. (k–l) Example raw EMG traces from a Pcp2Cre;ROSA26loxP-STOP-loxP-ChR2-EYFP mouse. Scale = 50 ms. (k) Baseline EMG trace before optogenetic stimulation. (l) EMG trace during tremor caused by optogenetic stimulation. Stimulation periods indicated by overlaid blue bars. (m) Example power spectrum analysis from an animal receiving optogenetic stimulation at 10 Hz, normalized to peak tremor power. Pre = pre stimulation period (baseline). Post = post stimulation period. During = during stimulation period. (n) EMG power at 10 Hz during 10 Hz stimulation for all mice tested, normalized to each individual’s overall maximum power in the pre, during, and post stimulation periods. Pre vs during stimulation period: p<0.0001. During vs post stimulation period: p=0.0001. Pre vs post stimulation period: p=0.9796, not significant (ns). N = 7. (o) Heat plot showing population average elicited EMG power for each optogenetic stimulation frequency tested. Heat scale = 0 to 90 mV2. (p) Heat plot showing population average of power normalized to individual peaks for each optogenetic stimulation frequency tested. Heat scale = 0 to 0.5. Source data for m–p are available in Figure 4—source data 1.
-
Figure 4—source data 1
Source data for representative graphs in Figure 4.
- https://cdn.elifesciences.org/articles/51928/elife-51928-fig4-data1-v1.xlsx
Figure 4—figure supplement 1
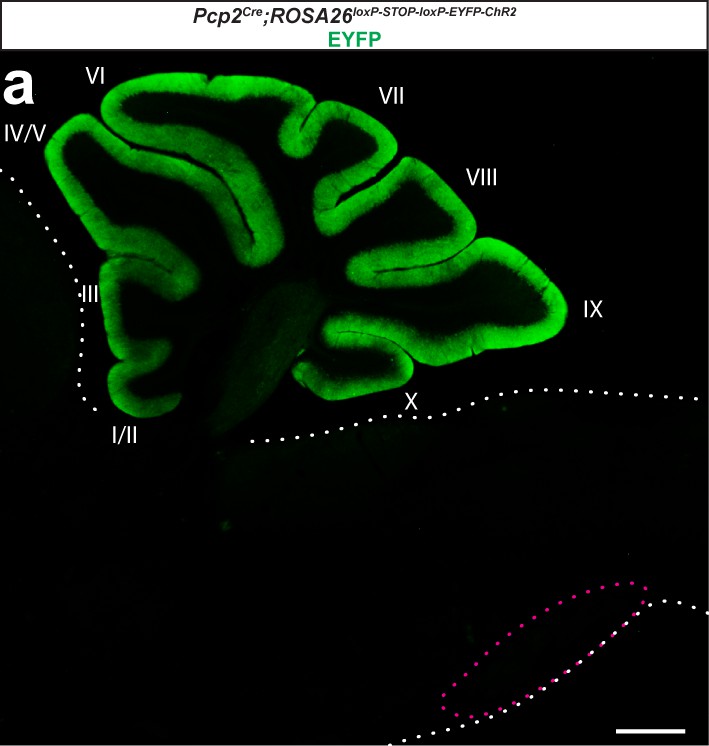
Expression of channelrhodopsin is limited to Purkinje cells when reporter expression is driven with a Pcp2Cre allele.
(a) Photomicrograph of a sagittal section of the cerebellum and brainstem from a Pcp2Cre;ROSA26loxP-STOP-loxP-ChR2-EYFP mouse after immunostaining with GFP to enhance the detection of EYFP fluorescence. Only Purkinje cells in the cerebellum (lobules indicated with roman numerals) and their terminals express GFP. White dotted lines outline non-cerebellar regions while magenta dotted lines encircle the region of the brainstem that houses the inferior olive. Scale = 500 µm.
Figure 4—figure supplement 2
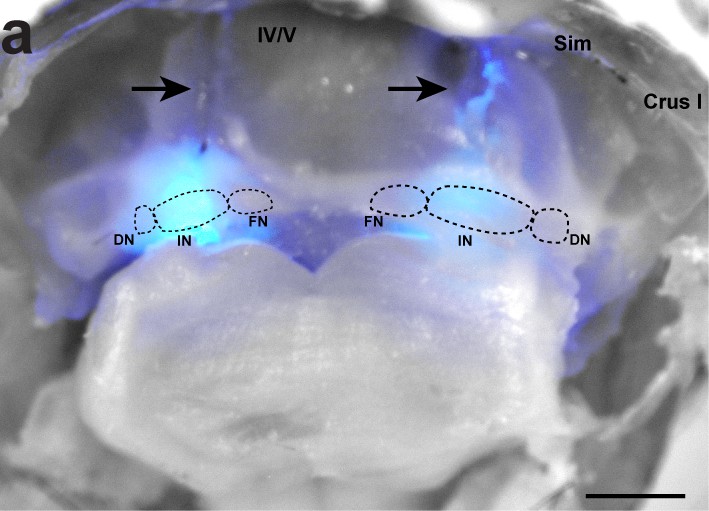
Targeting of optic fibers for optogenetic stimulation of Purkinje cell terminals in the cerebellar nuclei.
(a) Dissection of cerebellum within skull. Arrows indicate location of optical fibers penetrating the tissue. Dotted circles indicate the location of the dentate (DN), interposed (IN), and fastigial (FN) cerebellar nuclei. Cerebellar lobules are indicated with Roman numerals. Lobulus simplex (Sim). Crus I denoted by text. Blue light at maximum light power shines through the tissue. Scale = 1 mm.
Figure 4—figure supplement 3
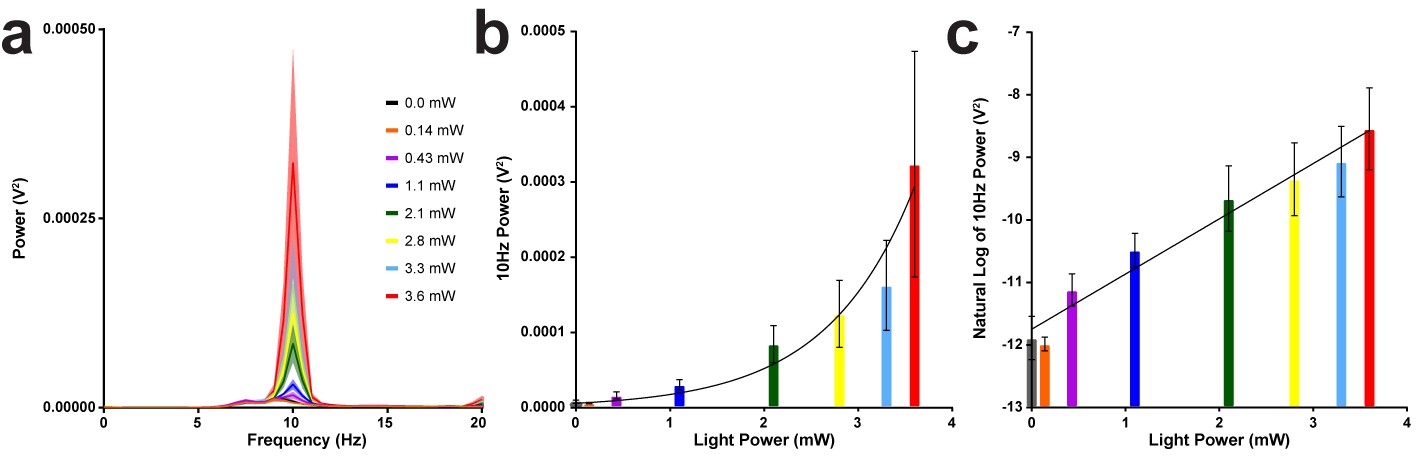
Tremor severity increases as optogenetic stimulation light power increases.
(a) Average tremor power for each of the LED light powers tested (solid lines) surrounded by the standard error of the mean (shaded regions). Stimulation always occurred at 10 Hz. (b) Average power at 10 Hz plotted against each of the light powers tested. Overlaid exponential growth curve created with least squares fit (Y0 = 5.971e-006, k = 1.083, tau = 0.9236, doubling time = 0.6402, R squared = 0.4677). (c) Natural log of the average power at 10 Hz plotted against each of the light powers tested. Overlaid linear regression line (slope = 0.1090, y-intercept = 0.2360, R square = 0.6861, p<0.0001). Source data for this figure are available in Figure 4—figure supplement 3—source data 1.
-
Figure 4—figure supplement 3—source data 1
Source data for representative graphs in Figure 4—figure supplement 3.
- https://cdn.elifesciences.org/articles/51928/elife-51928-fig4-figsupp3-data1-v1.xlsx
Figure 5 with 1 supplement
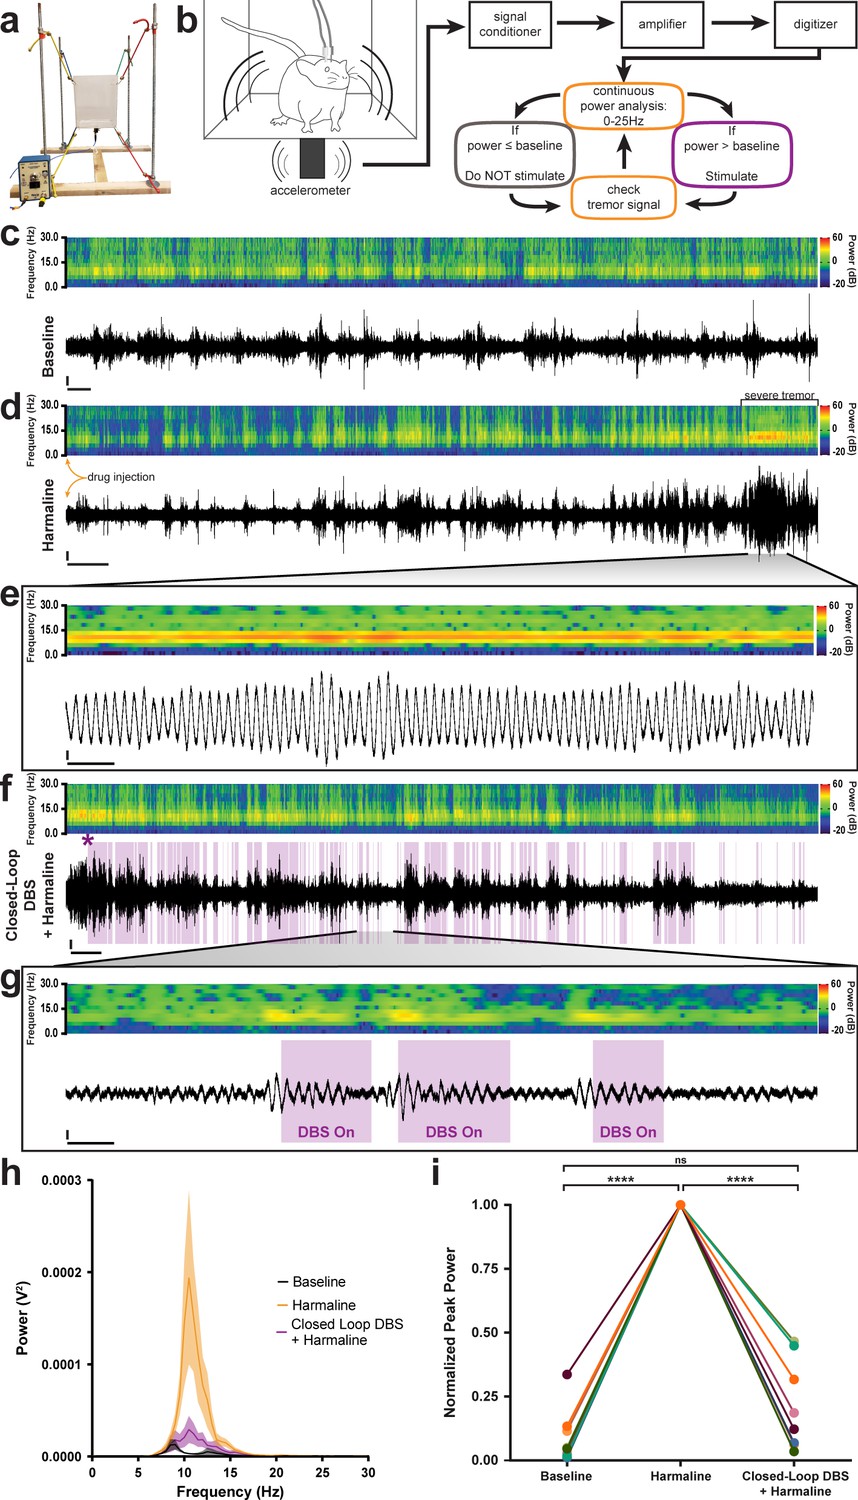
Closed-loop DBS targeted to the interposed nucleus reduces tremor severity.
(a) Picture of the custom-built tremor monitor. (b) Representation of the closed-loop design. Left: a mouse exhibiting tremor behavior shakes the tremor monitor chamber with an attached accelerometer (black rectangle). Accelerometer signals are passed through a signal conditioner, amplifier, and digitizer before a continuous power spectrum analysis is applied for frequencies from 0 Hz to 25 Hz. If tremor power exceeds a set threshold based on the individual’s baseline recording, stimulation is initiated for 36 ms before re-evaluation of tremor power. No stimulation is generated if tremor power is below threshold level. (c–g) Example tremor traces from a single animal. Top: sonogram view (continuous power spectrum) of raw tremor trace. All heat scales = −20 dB to 60 dB. Bottom: raw tremor traces. All vertical scales = 25 mV. (c) Baseline physiological tremor recording. Horizontal scale = 10 s. (d) Tremor recording beginning directly after harmaline injection (yellow arrows). Severe tremor develops as shown at the right of the recording (black bracket). Horizontal scale = 50 s. (e) Inset region from d (black lines) highlighting continuous, severe tremor. Horizontal scale = 0.5 s. (f) Tremor recording beginning directly after d and just before closed-loop DBS protocol is initiated. Initiation time indicated by purple asterisk. Stimulation periods indicated by overlaid purple bars. Horizontal scale = 50 s. (g) Inset region from f (black lines) highlighting bouts of tremor sufficient to cross threshold for stimulation. Stimulation periods indicated by overlaid purple bars. Horizontal scale = 0.5 s. (h) Population average tremor traces for baseline, harmaline tremor, and closed-loop DBS during harmaline tremor periods. Solid line = mean. Shaded region = SEM. N = 8. (i) Peak tremor power for each analyzed time period normalized to overall peak for all individuals. Power of tremor during harmaline period without closed-loop DBS stimulation was significantly greater than both baseline and the closed-loop DBS periods. There was no significant difference between baseline and the closed-loop DBS period. N = 8. Harmaline alone vs baseline: p<0.0001. Harmaline alone vs closed-loop DBS + harmaline: p<0.0001. Baseline vs closed-loop DBS + harmaline: p=0.3375. Source data for h–i are available in Figure 5—source data 1.
-
Figure 5—source data 1
Source data for representative graphs in Figure 5.
- https://cdn.elifesciences.org/articles/51928/elife-51928-fig5-data1-v1.xlsx
Figure 5—figure supplement 1
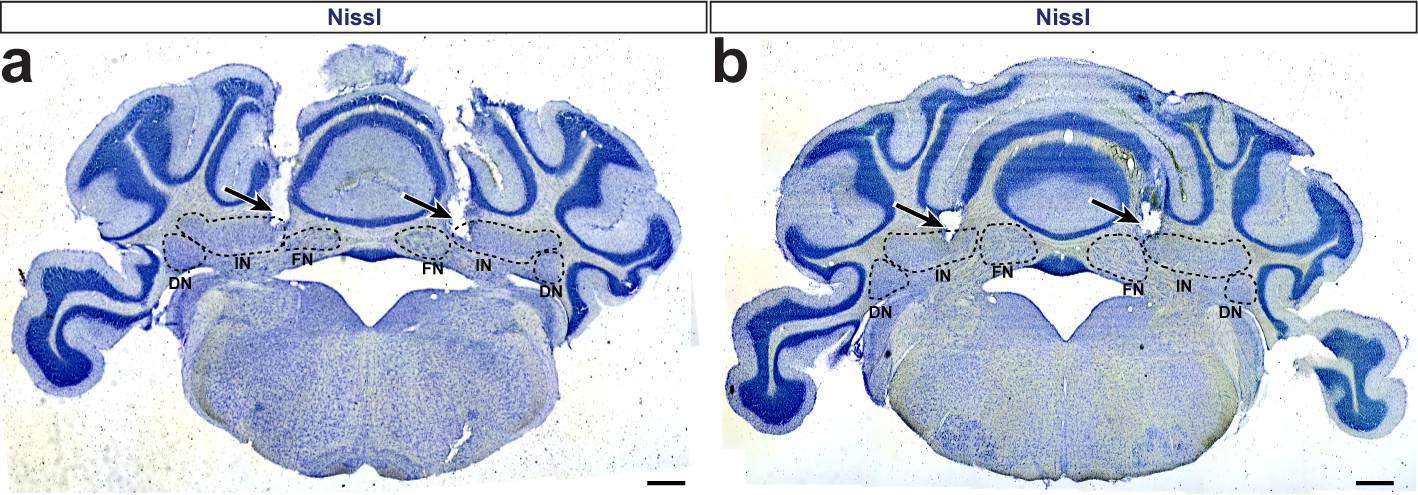
DBS electrodes targeted to the cerebellar interposed nucleus.
(a–b) Sample photomicrographs of Nissl stained neural tissue after removal of the DBS electrodes in two different mice. Arrows indicate the void where DBS electrodes penetrated the tissue. Dotted circles indicate the location of the dentate (DN), interposed (IN), and fastigial (FN) cerebellar nuclei. Bottom tips of the electrode tracts are observed in the interposed nuclei. Scale = 500 µm.
Videos
Video 1
Pcp2Cre;Slc32a1flox/flox mice exhibit ataxia and disequilibrium, but not pathological tremor.
Video 2
Harmaline induces a severe tremor in Slc32a1flox/flox mice but not in Pcp2Cre;Slc32a1flox/flox mice.
Video 3
Optogenetic stimulation of Purkinje cell terminals in the interposed nuclei of Pcp2Cre;ROSA26loxP-STOP-loxP-ChR2-EYFP mice using a 10 Hz sinusoidal stimulus induces a robust tremor.
Video 4
Closed-loop DBS of the interposed nucleus reduces harmaline-induced tremor.
Tables
Table 1
Precision measures, exact p-values, and replicate data relevant to Figure 1.
| Figure | Comparator 1 | Comparator 2 | Mean 1 | Mean 2 | SE of diff. | N 1 | N 2 | Summary | Adjusted P Value |
|---|---|---|---|---|---|---|---|---|---|
| Figure 1h | Slc32a1flox/flox baseline | Slc32a1flox/flox + harmaline | 0.002181 V2 | 0.02005 V2 | 0.005132 | 16 | 16 | * | 0.0190 |
| Slc32a1flox/flox baseline | Pcp2Cre;Slc32a1flox/flox baseline | 0.002181 V2 | 0.001438 V2 | 0.0003786 | 16 | 12 | ns | 0.2982 | |
| Slc32a1flox/flox baseline | Pcp2Cre;Slc32a1flox/flox + harmaline | 0.002181 V2 | 0.002787 V2 | 0.0007072 | 16 | 13 | ns | 0.9420 | |
| Slc32a1flox/flox + harmaline | Pcp2Cre;Slc32a1flox/flox baseline | 0.02005 V2 | 0.001438 V2 | 0.005133 | 16 | 12 | * | 0.0142 | |
| Slc32a1flox/flox + harmaline | Pcp2Cre;Slc32a1flox/flox + harmaline | 0.02005 V2 | 0.002787 V2 | 0.005168 | 16 | 13 | * | 0.0252 | |
| Pcp2Cre;Slc32a1flox/flox baseline | Pcp2Cre;Slc32a1flox/flox + harmaline | 0.001438 V2 | 0.002787 V2 | 0.0007151 | 12 | 13 | ns | 0.3550 | |
| Figure 1i | Slc32a1flox/flox baseline | Slc32a1flox/flox + harmaline | 0.001032 V2 | 0.001767 V2 | 0.0003403 | 16 | 16 | ns | 0.2224 |
| Slc32a1flox/flox baseline | Pcp2Cre;Slc32a1flox/flox baseline | 0.001032 V2 | 0.0005844 V2 | 0.0001552 | 16 | 12 | * | 0.0454 | |
| Slc32a1flox/flox baseline | Pcp2Cre;Slc32a1flox/flox + harmaline | 0.001032 V2 | 0.0008114 V2 | 0.0002104 | 16 | 13 | ns | 0.8693 | |
| Slc32a1flox/flox + harmaline | Pcp2Cre;Slc32a1flox/flox baseline | 0.001767 V2 | 0.0005844 V2 | 0.0003403 | 16 | 12 | * | 0.0155 | |
| Slc32a1flox/flox + harmaline | Pcp2Cre;Slc32a1flox/flox + harmaline | 0.001767 V2 | 0.0008114 V2 | 0.0003688 | 16 | 13 | ns | 0.0897 | |
| Pcp2Cre;Slc32a1flox/flox baseline | Pcp2Cre;Slc32a1flox/flox + harmaline | 0.0005844 V2 | 0.0008114 V2 | 0.0002104 | 12 | 13 | ns | 0.8543 |
Table 2
Precision measures, exact p-values, and replicate data relevant to Figure 2.
| Figure | Comparator 1 | Comparator 2 | Mean 1 | Mean 2 | SE of diff. | N 1 | N 2 | Summary | Adjusted P Value |
|---|---|---|---|---|---|---|---|---|---|
| Figure 2h | Slc32a1flox/flox baseline | Slc32a1flox/flox + harmaline | 77.63 Hz | 49.18 Hz | 7.497 | 18 | 14 | ** | 0.0020 |
| Slc32a1flox/flox baseline | Pcp2Cre;Slc32a1flox/flox baseline | 77.63 Hz | 55.97 Hz | 7.355 | 18 | 15 | * | 0.0238 | |
| Slc32a1flox/flox baseline | Pcp2Cre;Slc32a1flox/flox + harmaline | 77.63 Hz | 26.65 Hz | 7.840 | 18 | 12 | **** | <0.0001 | |
| Slc32a1flox/flox + harmaline | Pcp2Cre;Slc32a1flox/flox baseline | 49.18 Hz | 55.97 Hz | 7.818 | 14 | 15 | ns | 0.8208 | |
| Slc32a1flox/flox + harmaline | Pcp2Cre;Slc32a1flox/flox + harmaline | 49.18 Hz | 26.65 Hz | 8.276 | 14 | 12 | * | 0.0419 | |
| Pcp2Cre;Slc32a1flox/flox baseline | Pcp2Cre;Slc32a1flox/flox + harmaline | 55.97 Hz | 26.65 Hz | 8.148 | 15 | 12 | ** | 0.0037 | |
| Figure 2i | Slc32a1flox/flox baseline | Slc32a1flox/flox + harmaline | 0.4902 | 1.372 | 0.2017 | 18 | 14 | *** | 0.0003 |
| Slc32a1flox/flox baseline | Pcp2Cre;Slc32a1flox/flox baseline | 0.4902 | 1.152 | 0.1979 | 18 | 15 | ** | 0.0079 | |
| Slc32a1flox/flox baseline | Pcp2Cre;Slc32a1flox/flox + harmaline | 0.4902 | 1.953 | 0.2109 | 18 | 12 | **** | <0.0001 | |
| Slc32a1flox/flox + harmaline | Pcp2Cre;Slc32a1flox/flox baseline | 1.372 | 1.152 | 0.2103 | 14 | 15 | ns | 0.7229 | |
| Slc32a1flox/flox + harmaline | Pcp2Cre;Slc32a1flox/flox + harmaline | 1.372 | 1.953 | 0.2227 | 14 | 12 | ns | 0.0552 | |
| Pcp2Cre;Slc32a1flox/flox baseline | Pcp2Cre;Slc32a1flox/flox + harmaline | 1.152 | 1.953 | 0.2192 | 15 | 12 | ** | 0.0032 | |
| Figure 2j | Slc32a1flox/flox baseline | Slc32a1flox/flox + harmaline | 0.4443 | 0.6683 | 0.05314 | 18 | 14 | *** | 0.0005 |
| Slc32a1flox/flox baseline | Pcp2Cre;Slc32a1flox/flox baseline | 0.4443 | 0.5355 | 0.05214 | 18 | 15 | ns | 0.3088 | |
| Slc32a1flox/flox baseline | Pcp2Cre;Slc32a1flox/flox + harmaline | 0.4443 | 0.8396 | 0.05558 | 18 | 12 | **** | <0.0001 | |
| Slc32a1flox/flox + harmaline | Pcp2Cre;Slc32a1flox/flox baseline | 0.6683 | 0.5355 | 0.05542 | 14 | 15 | ns | 0.0897 | |
| Slc32a1flox/flox + harmaline | Pcp2Cre;Slc32a1flox/flox + harmaline | 0.6683 | 0.8396 | 0.05867 | 14 | 12 | * | 0.0253 | |
| Pcp2Cre;Slc32a1flox/flox baseline | Pcp2Cre;Slc32a1flox/flox + harmaline | 0.5355 | 0.8396 | 0.05776 | 15 | 12 | **** | <0.0001 | |
| Figure 2k | Slc32a1flox/flox baseline | Slc32a1flox/flox + harmaline | 1.289 Hz | 2.876 Hz | 0.3641 | 18 | 14 | *** | 0.0003 |
| Slc32a1flox/flox baseline | Pcp2Cre;Slc32a1flox/flox baseline | 1.289 Hz | 1.458 Hz | 0.3572 | 18 | 15 | ns | 0.9649 | |
| Slc32a1flox/flox baseline | Pcp2Cre;Slc32a1flox/flox + harmaline | 1.289 Hz | 5.338 Hz | 0.3807 | 18 | 12 | **** | <0.0001 | |
| Slc32a1flox/flox + harmaline | Pcp2Cre;Slc32a1flox/flox baseline | 2.876 Hz | 1.458 Hz | 0.3797 | 14 | 15 | ** | 0.0025 | |
| Slc32a1flox/flox + harmaline | Pcp2Cre;Slc32a1flox/flox + harmaline | 2.876 Hz | 5.338 Hz | 0.4019 | 14 | 12 | **** | <0.0001 | |
| Pcp2Cre;Slc32a1flox/flox baseline | Pcp2Cre;Slc32a1flox/flox + harmaline | 1.458 Hz | 5.338 Hz | 0.3957 | 15 | 12 | **** | <0.0001 | |
| Figure 2l | Slc32a1flox/flox baseline | Slc32a1flox/flox + harmaline | 0.7396 | 0.5753 | 0.07763 | 18 | 14 | ns | 0.1609 |
| Slc32a1flox/flox baseline | Pcp2Cre;Slc32a1flox/flox baseline | 0.7396 | 0.8631 | 0.07617 | 18 | 15 | ns | 0.3751 | |
| Slc32a1flox/flox baseline | Pcp2Cre;Slc32a1flox/flox + harmaline | 0.7396 | 0.4335 | 0.08119 | 18 | 12 | ** | 0.0022 | |
| Slc32a1flox/flox + harmaline | Pcp2Cre;Slc32a1flox/flox baseline | 0.5753 | 0.8631 | 0.08096 | 14 | 15 | ** | 0.0043 | |
| Slc32a1flox/flox + harmaline | Pcp2Cre;Slc32a1flox/flox + harmaline | 0.5753 | 0.4335 | 0.08571 | 14 | 12 | ns | 0.3572 | |
| Pcp2Cre;Slc32a1flox/flox baseline | Pcp2Cre;Slc32a1flox/flox + harmaline | 0.8631 | 0.4335 | 0.08438 | 15 | 12 | **** | <0.0001 | |
| Figure 2m | Slc32a1flox/flox baseline | Slc32a1flox/flox + harmaline | 0.8876 | 0.5399 | 0.05937 | 18 | 14 | **** | <0.0001 |
| Slc32a1flox/flox baseline | Pcp2Cre;Slc32a1flox/flox baseline | 0.8876 | 0.9082 | 0.05824 | 18 | 15 | ns | 0.9848 | |
| Slc32a1flox/flox baseline | Pcp2Cre;Slc32a1flox/flox + harmaline | 0.8876 | 0.3224 | 0.06209 | 18 | 12 | **** | <0.0001 | |
| Slc32a1flox/flox + harmaline | Pcp2Cre;Slc32a1flox/flox baseline | 0.5399 | 0.9082 | 0.06191 | 14 | 15 | **** | <0.0001 | |
| Slc32a1flox/flox + harmaline | Pcp2Cre;Slc32a1flox/flox + harmaline | 0.5399 | 0.3224 | 0.06554 | 14 | 12 | ** | 0.0085 | |
| Pcp2Cre;Slc32a1flox/flox baseline | Pcp2Cre;Slc32a1flox/flox + harmaline | 0.9082 | 0.3224 | 0.06453 | 15 | 12 | **** | <0.0001 | |
| Figure 2n | Slc32a1flox/flox baseline | Slc32a1flox/flox + harmaline | 0.008528 s | 0.04651 s | 0.009766 | 18 | 14 | ** | 0.0015 |
| Slc32a1flox/flox baseline | Pcp2Cre;Slc32a1flox/flox baseline | 0.008528 s | 0.02349 s | 0.009581 | 18 | 15 | ns | 0.4089 | |
| Slc32a1flox/flox baseline | Pcp2Cre;Slc32a1flox/flox + harmaline | 0.008528 s | 0.09622 s | 0.01021 | 18 | 12 | **** | <0.0001 | |
| Slc32a1flox/flox + harmaline | Pcp2Cre;Slc32a1flox/flox baseline | 0.04651 s | 0.02349 s | 0.01018 | 14 | 15 | ns | 0.1202 | |
| Slc32a1flox/flox + harmaline | Pcp2Cre;Slc32a1flox/flox + harmaline | 0.04651 s | 0.09622 s | 0.01078 | 14 | 12 | *** | 0.0001 | |
| Pcp2Cre;Slc32a1flox/flox baseline | Pcp2Cre;Slc32a1flox/flox + harmaline | 0.02349 s | 0.09622 s | 0.01061 | 15 | 12 | **** | <0.0001 | |
| Figure 2o | Slc32a1flox/flox baseline | Slc32a1flox/flox + harmaline | 0.01806 s | 0.01806 s | 0.006551 | 18 | 14 | ns | >0.9999 |
| Slc32a1flox/flox baseline | Pcp2Cre;Slc32a1flox/flox baseline | 0.01806 s | 0.03709 s | 0.006427 | 18 | 15 | * | 0.0228 | |
| Slc32a1flox/flox baseline | Pcp2Cre;Slc32a1flox/flox + harmaline | 0.01806 s | 0.02643 s | 0.006851 | 18 | 12 | ns | 0.6161 | |
| Slc32a1flox/flox + harmaline | Pcp2Cre;Slc32a1flox/flox baseline | 0.01806 s | 0.03709 s | 0.006831 | 14 | 15 | * | 0.0358 | |
| Slc32a1flox/flox + harmaline | Pcp2Cre;Slc32a1flox/flox + harmaline | 0.01806 s | 0.02643 s | 0.007232 | 14 | 12 | ns | 0.6560 | |
| Pcp2Cre;Slc32a1flox/flox baseline | Pcp2Cre;Slc32a1flox/flox + harmaline | 0.03709 s | 0.02643 s | 0.007120 | 15 | 12 | ns | 0.4462 | |
| Figure 2p | Slc32a1flox/flox baseline | Slc32a1flox/flox + harmaline | 59.78 | 17.71 | 11.71 | 18 | 17 | ** | 0.0035 |
| Slc32a1flox/flox baseline | Pcp2Cre;Slc32a1flox/flox baseline | 59.78 | 53.83 | 11.54 | 18 | 18 | ns | 0.9551 | |
| Slc32a1flox/flox baseline | Pcp2Cre;Slc32a1flox/flox + harmaline | 59.78 | 8.421 | 12.10 | 18 | 15 | *** | 0.0004 | |
| Slc32a1flox/flox + harmaline | Pcp2Cre;Slc32a1flox/flox baseline | 17.71 | 53.83 | 11.71 | 17 | 18 | * | 0.0155 | |
| Slc32a1flox/flox + harmaline | Pcp2Cre;Slc32a1flox/flox + harmaline | 17.71 | 8.421 | 12.26 | 17 | 15 | ns | 0.8730 | |
| Pcp2Cre;Slc32a1flox/flox baseline | Pcp2Cre;Slc32a1flox/flox + harmaline | 53.83 | 8.421 | 12.10 | 18 | 15 | ** | 0.0021 |
Table 3
Precision measures, exact p-values, and replicate data relevant to Figure 3.
| Figure | Comparator 1 | Comparator 2 | Mean 1 | Mean 2 | SE of diff. | N 1 | N 2 | Summary | Adjusted P Value |
|---|---|---|---|---|---|---|---|---|---|
| Figure 3f | Slc32a1flox/flox baseline | Slc32a1flox/flox + harmaline | 66.48 Hz | 74.56 Hz | 10.44 | 19 | 14 | ns | 0.8660 |
| Slc32a1flox/flox baseline | Pcp2Cre;Slc32a1flox/flox baseline | 66.48 Hz | 79.81 Hz | 9.753 | 19 | 18 | ns | 0.5246 | |
| Slc32a1flox/flox baseline | Pcp2Cre;Slc32a1flox/flox + harmaline | 66.48 Hz | 82.22 Hz | 11.23 | 19 | 11 | ns | 0.5035 | |
| Slc32a1flox/flox + harmaline | Pcp2Cre;Slc32a1flox/flox baseline | 74.56 Hz | 79.81 Hz | 10.57 | 14 | 18 | ns | 0.9593 | |
| Slc32a1flox/flox + harmaline | Pcp2Cre;Slc32a1flox/flox + harmaline | 74.56 Hz | 82.22 Hz | 11.95 | 14 | 11 | ns | 0.9180 | |
| Pcp2Cre;Slc32a1flox/flox baseline | Pcp2Cre;Slc32a1flox/flox + harmaline | 79.81 Hz | 82.22 Hz | 11.35 | 18 | 11 | ns | 0.9966 | |
| Figure 3g | Slc32a1flox/flox baseline | Slc32a1flox/flox + harmaline | 0.4511 | 0.8654 | 0.08621 | 19 | 14 | **** | <0.0001 |
| Slc32a1flox/flox baseline | Pcp2Cre;Slc32a1flox/flox baseline | 0.4511 | 0.3428 | 0.08050 | 19 | 18 | ns | 0.5379 | |
| Slc32a1flox/flox baseline | Pcp2Cre;Slc32a1flox/flox + harmaline | 0.4511 | 0.3695 | 0.09273 | 19 | 11 | ns | 0.8150 | |
| Slc32a1flox/flox + harmaline | Pcp2Cre;Slc32a1flox/flox baseline | 0.8654 | 0.3428 | 0.08722 | 14 | 18 | **** | <0.0001 | |
| Slc32a1flox/flox + harmaline | Pcp2Cre;Slc32a1flox/flox + harmaline | 0.8654 | 0.3695 | 0.09861 | 14 | 11 | **** | <0.0001 | |
| Pcp2Cre;Slc32a1flox/flox baseline | Pcp2Cre;Slc32a1flox/flox + harmaline | 0.3428 | 0.3695 | 0.09367 | 18 | 11 | ns | 0.9918 | |
| Figure 3h | Slc32a1flox/flox baseline | Slc32a1flox/flox + harmaline | 0.4141 | 0.5262 | 0.04266 | 19 | 14 | ns | 0.0520 |
| Slc32a1flox/flox baseline | Pcp2Cre;Slc32a1flox/flox baseline | 0.4141 | 0.2310 | 0.03984 | 19 | 18 | *** | 0.0001 | |
| Slc32a1flox/flox baseline | Pcp2Cre;Slc32a1flox/flox + harmaline | 0.4141 | 0.2743 | 0.04589 | 19 | 11 | * | 0.0179 | |
| Slc32a1flox/flox + harmaline | Pcp2Cre;Slc32a1flox/flox baseline | 0.5262 | 0.2310 | 0.04316 | 14 | 18 | **** | <0.0001 | |
| Slc32a1flox/flox + harmaline | Pcp2Cre;Slc32a1flox/flox + harmaline | 0.5262 | 0.2743 | 0.04880 | 14 | 11 | **** | <0.0001 | |
| Pcp2Cre;Slc32a1flox/flox baseline | Pcp2Cre;Slc32a1flox/flox + harmaline | 0.2310 | 0.2743 | 0.04636 | 18 | 11 | ns | 0.7864 |
Table 4
Table 5
Precision measures, exact p-values, and replicate data relevant to Figure 5.
| Figure | Comparator 1 | Comparator 2 | Mean 1 | Mean 2 | SE of diff. | N 1 | N 2 | Summary | Adjusted P Value |
|---|---|---|---|---|---|---|---|---|---|
| Figure 5i | baseline | harmaline | 0.09208 | 1.000 | 0.03831 | 8 | 8 | **** | <0.0001 |
| baseline | closed-loop DBS + harmaline | 0.09208 | 0.2129 | 0.07930 | 8 | 8 | ns | 0.3375 | |
| harmaline | closed-loop DBS + harmaline | 1.000 | 0.2129 | 0.06191 | 8 | 8 | **** | <0.0001 |
Additional files
Download links
A two-part list of links to download the article, or parts of the article, in various formats.
Downloads (link to download the article as PDF)
Open citations (links to open the citations from this article in various online reference manager services)
Cite this article (links to download the citations from this article in formats compatible with various reference manager tools)
Purkinje cell misfiring generates high-amplitude action tremors that are corrected by cerebellar deep brain stimulation
eLife 9:e51928.
https://doi.org/10.7554/eLife.51928


