Derivation of trophoblast stem cells from naïve human pluripotent stem cells
- Department of Developmental Biology, Washington University School of Medicine, United States
- Center of Regenerative Medicine, Washington University School of Medicine, United States
- Department of Obstetrics and Gynecology, Center for Reproductive Health Sciences, Washington University School of Medicine, United States
- Department of Genetics, Center for Genome Sciences & Systems Biology, Washington University School of Medicine, United States
Figures
Figure 1 with 2 supplements
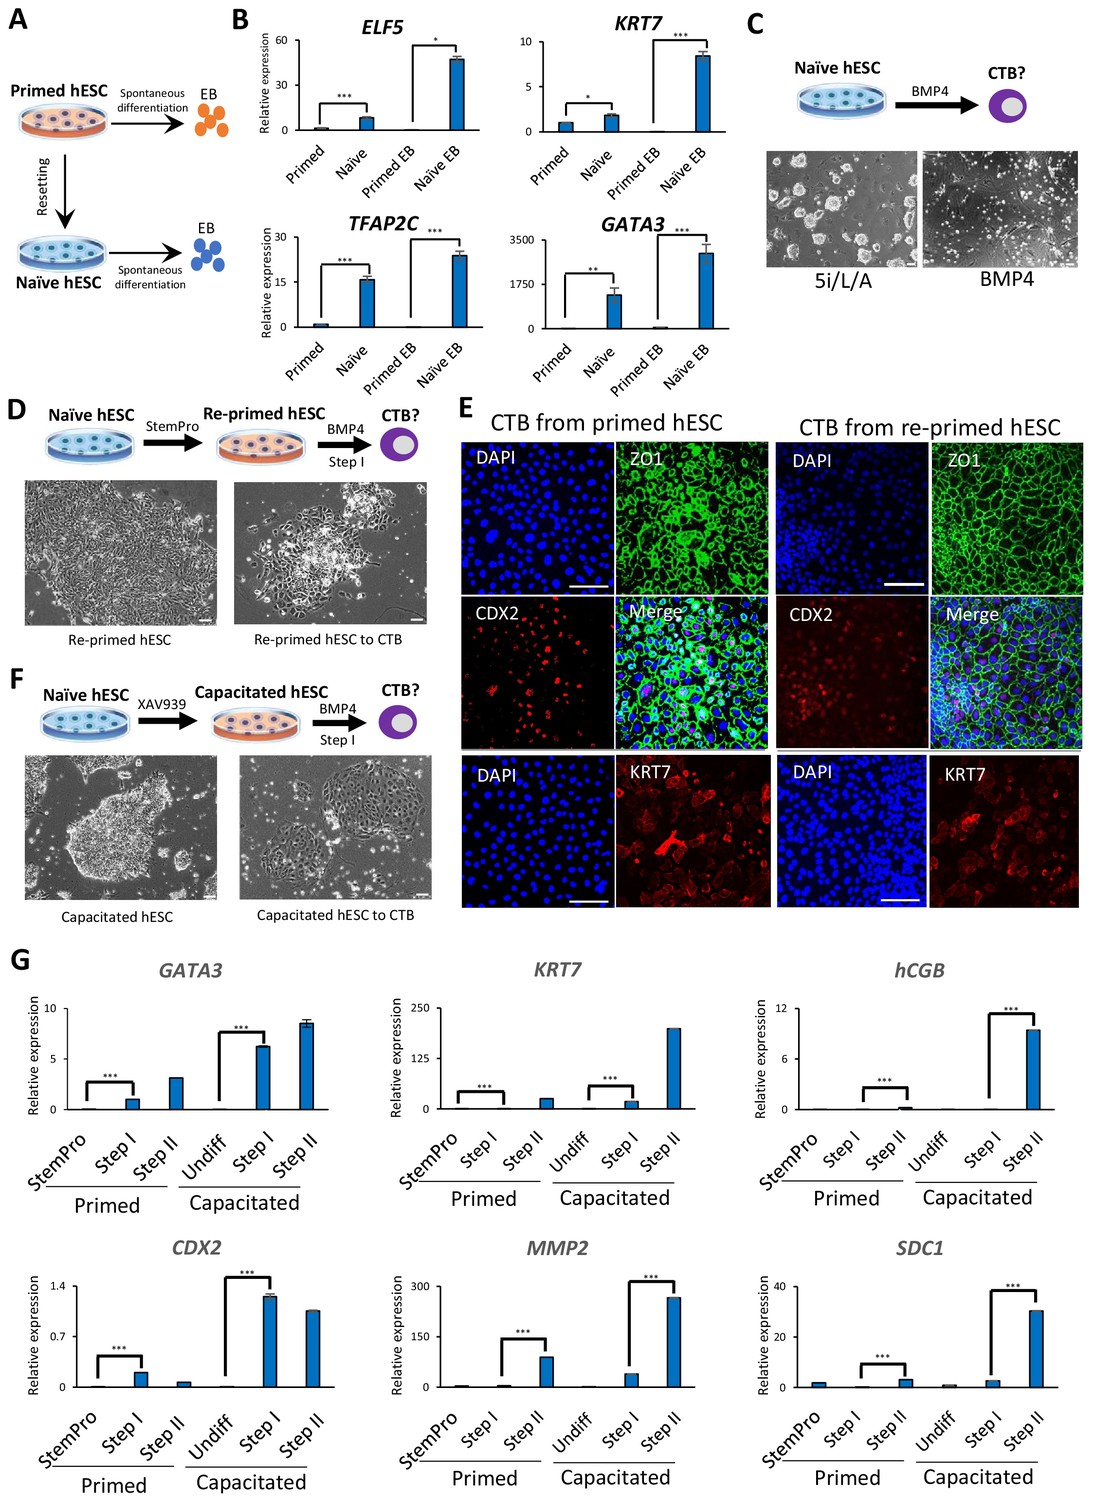
Trophoblast potential of different hPSC states under spontaneous and BMP4-mediated differentiation conditions.
(A) The experimental scheme for assessing spontaneous trophoblast differentiation potential of primed and naïve hPSCs by using EB formation assay. (B) Quantitative gene expression analysis for trophoblast marker genes ELF5, KRT7, TFAP2C, and GATA3 in H9 primed and naïve hPSCs and EBs generated from the respective hPSCs. Error bars indicate ±1 SD of technical replicates. ‘*' indicates a p-value<0.05, ‘**' indicates a p-value<0.01, and ‘***' indicates a p-value<0.001. (C) The experimental scheme for assessing BMP4-mediated trophoblast differentiation potential of naive hESCs (top). Phase contrast image of H9 naïve hESCs and H9 naïve hESCs following the 6 day step I protocol for BMP4-mediated CTB differentiation (bottom). The scale bars indicate 75 μm. (D) The experimental scheme of re-priming naïve hESCs and assessing their BMP4-mediated trophoblast differentiation potential (top). Phase contrast images of H9 re-primed hESCs and H9 re-primed hESCs following the 6 day step I protocol for BMP4-mediated CTB differentiation (bottom). The scale bars indicate 75 μm. (E) Immunofluorescence staining for CDX2, ZO1, and KRT7 in CTBs generated from H9 primed and re-primed hESCs. The scale bars indicate 75 μm. (F) The experimental scheme of capacitating naïve hESCs and assessing their BMP4-mediated trophoblast differentiation potential (top). Phase contrast images of H9 capacitated hESCs and H9 capacitated hESCs following the 6 day step I protocol for BMP4-mediated CTB differentiation (bottom). The scale bars indicate 75 μm. (G) Quantitative gene expression analysis for trophoblast marker genes GATA3, CDX2, KRT7, MMP2, hCGB, and SDC1 in H9 primed and capacitated hESCs and trophoblasts differentiated from the respective hPSCs. Error bars indicate ± 1 SD of technical replicates. ‘***' indicates a p-value<0.001.
Figure 1—figure supplement 1
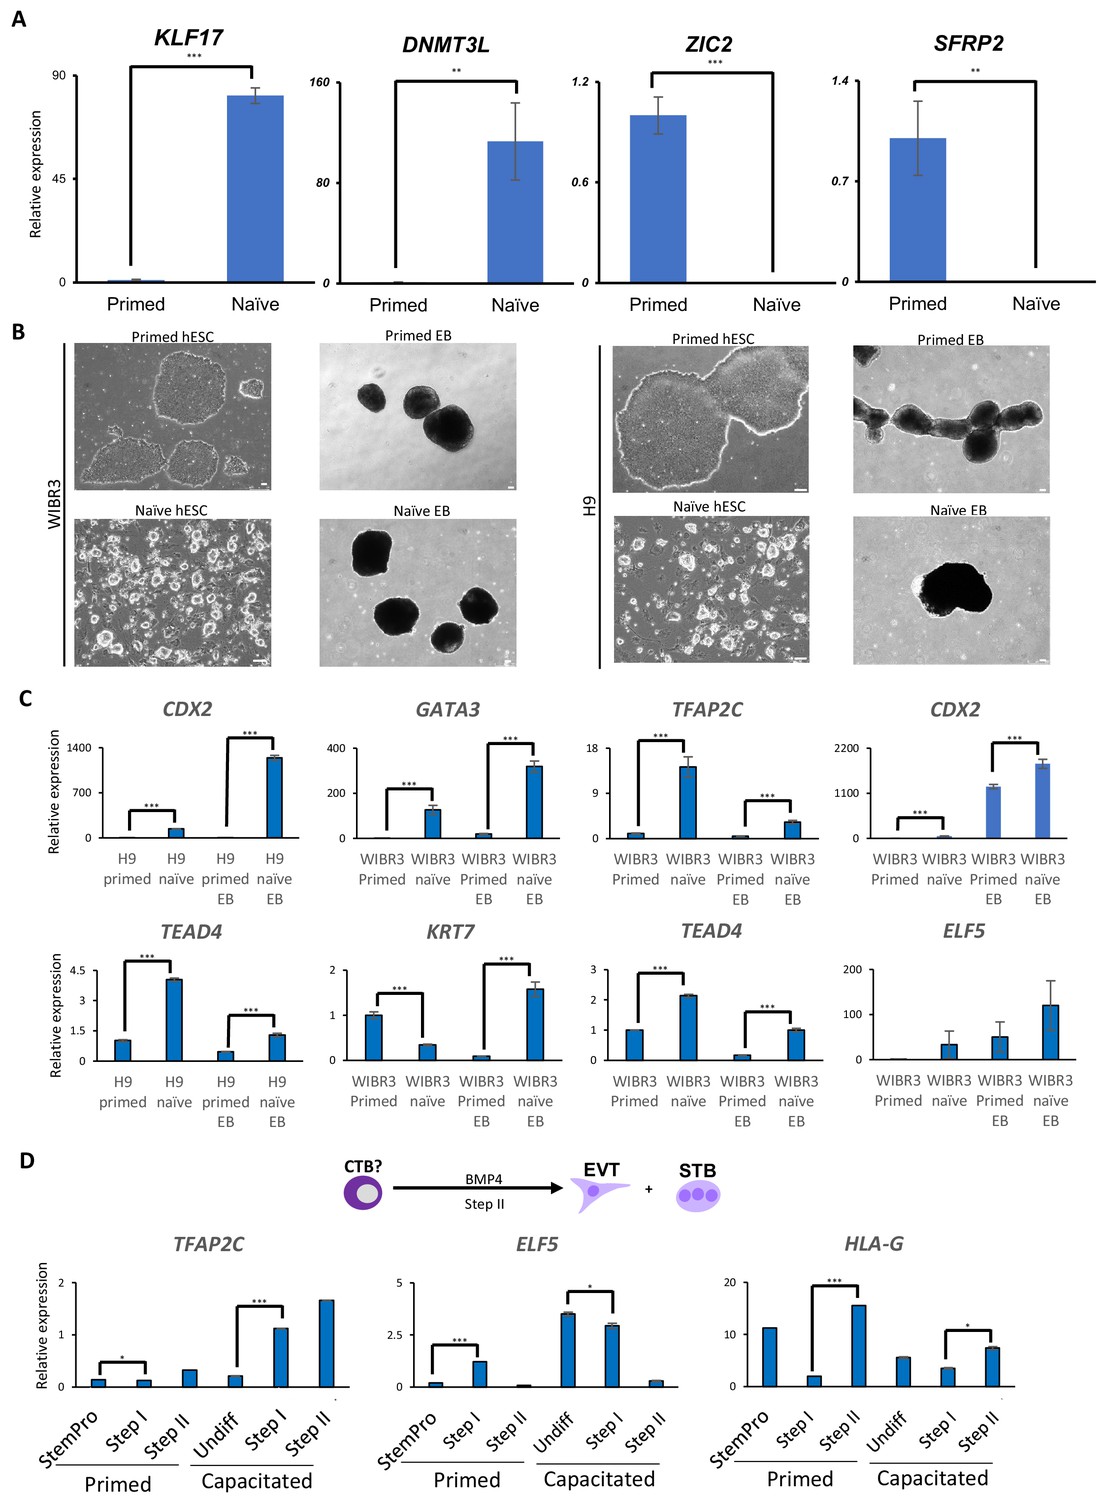
Trophoblast potential of different hPSC states under spontaneous and BMP4-mediated differentiation conditions.
(A) Quantitative gene expression analysis for naïve marker genes KLF17 and DNMT3L, and primed marker genes ZIC2 and SFRP2 in H9 primed and naïve hESCs. Error bars indicate ±1 SD of technical replicates. ‘**' indicates a p-value<0.01, and ‘***' indicates a p-value<0.001. (B) Phase contrast images of H9 and WIBR3 primed and naïve hESCs, and EBs generated from the respective hESCs. The scale bars indicate 75 μm. (C) Quantitative gene expression analysis for trophoblast marker genes ELF5, KRT7, TFAP2C, GATA3, CDX2, and TEAD4 in H9 and WIBR3 primed and naïve hESCs, and EBs generated from the respective hESCs. Error bars indicate ±1 SD of technical replicates. ‘***' indicates a p-value<0.001. (D) The experimental scheme of step II protocol for BMP4-mediated terminal EVT and STB differentiation from CTBs (top). Quantitative gene expression analysis for trophoblast marker genes TFAP2C, ELF5, and HLA-G in H9 primed and capacitated hPSCs and trophoblasts differentiated from the respective hESCs. Error bars indicate ± 1 SD of technical replicates. ‘*' indicates a p-value<0.05, and ‘***' indicates a p-value<0.001.
Figure 1—figure supplement 2
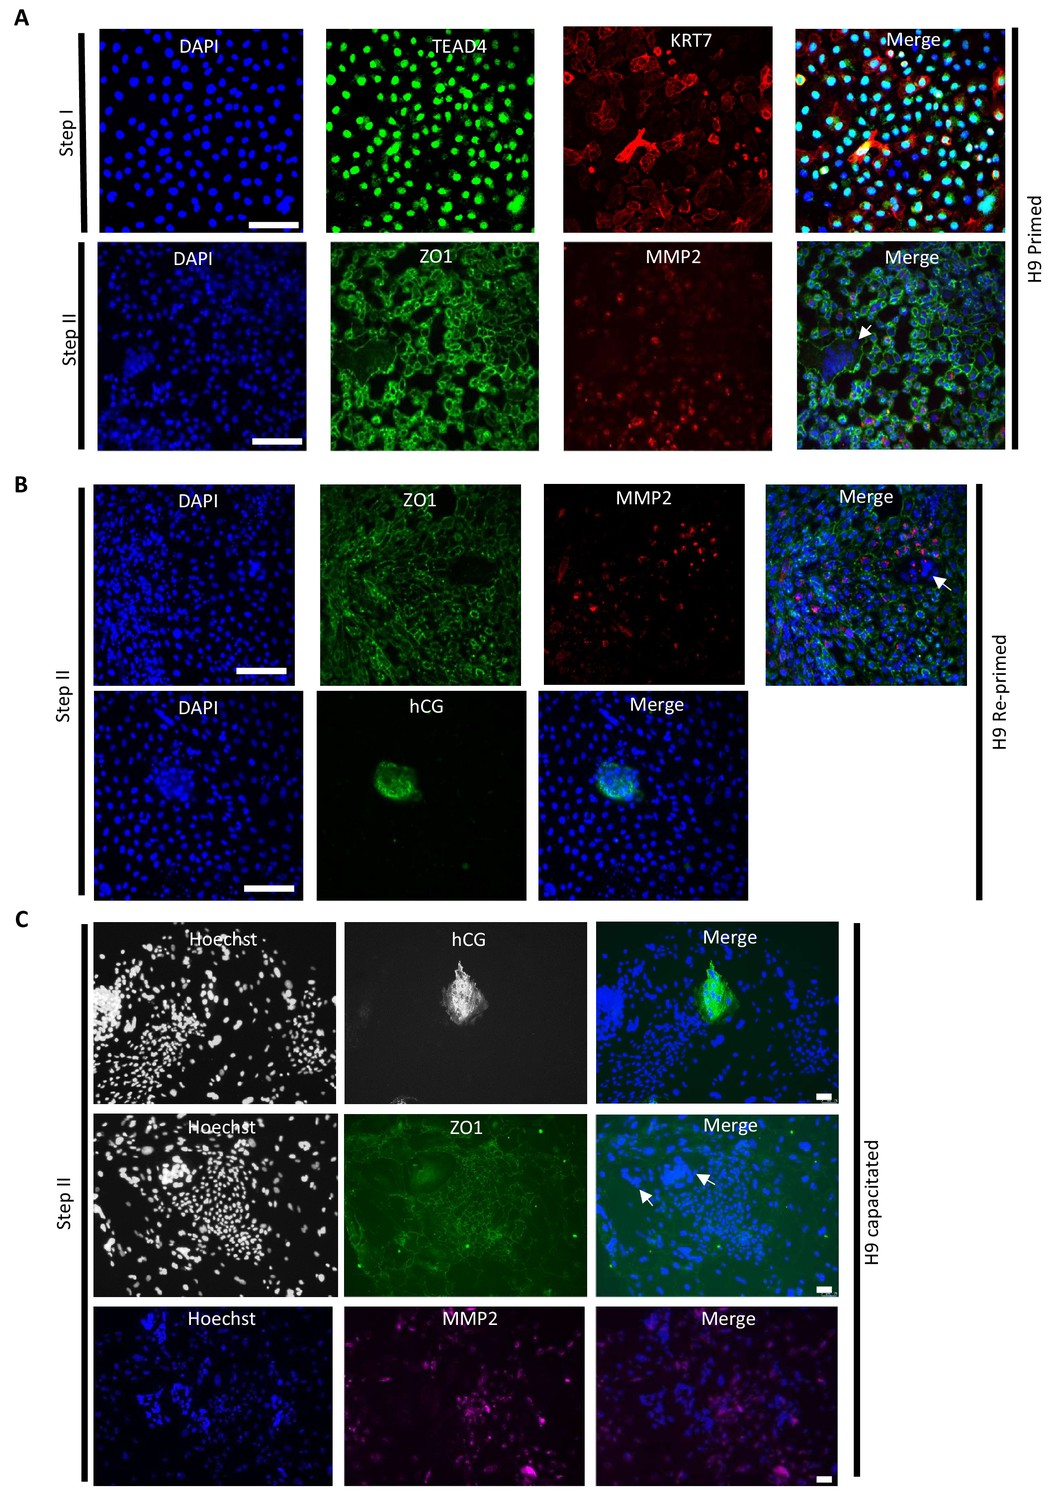
Immunofluorescence staining of trophoblast markers.
(A) Immunofluorescence staining for TEAD4 and KRT7 in CTBs, and ZO1 and MMP2 in terminally differentiated trophoblasts derived from H9 primed hESCs. The scale bars indicate 75 μm. The white arrow indicates multinucleation. (B) Immunofluorescence staining for ZO1, MMP2, and hCG in terminally differentiated trophoblasts derived from H9 re-primed hESCs. The scale bars indicate 75 μm. The white arrow indicates multinucleation. (C) Immunofluorescence staining for hCG, ZO1, and MMP2 in terminally differentiated trophoblasts derived from H9 capacitated hPSCs. The scale bars indicate 75 μm. The white arrow indicates multinucleation.
Figure 2 with 2 supplements
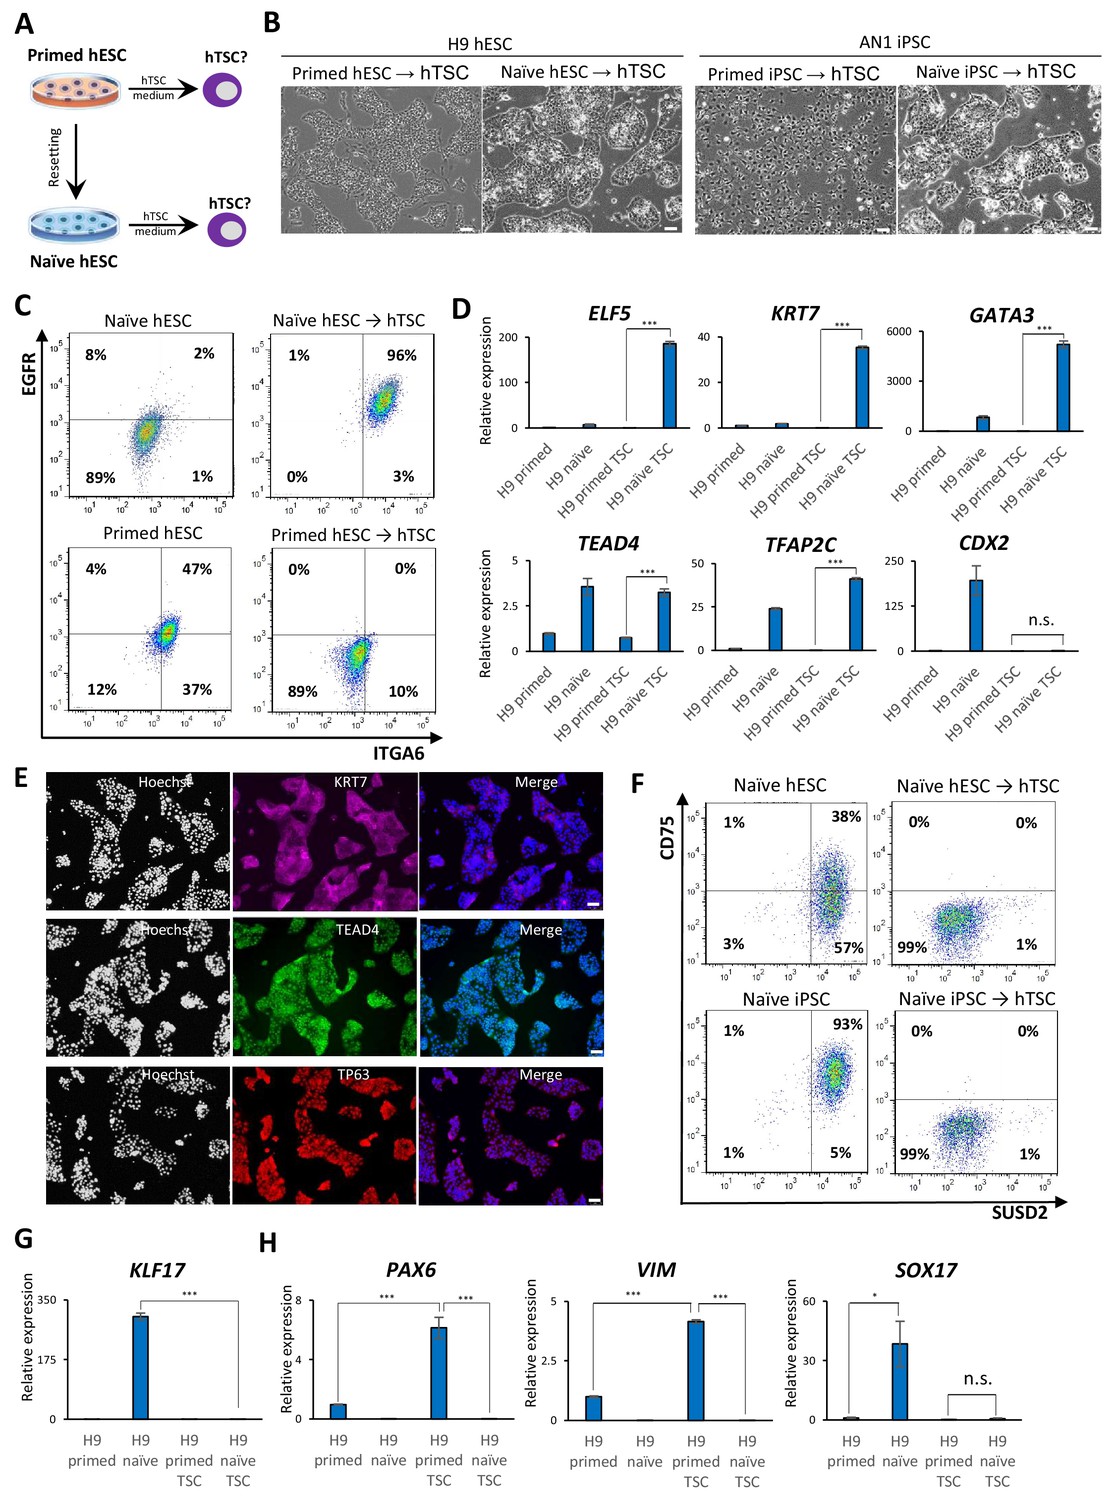
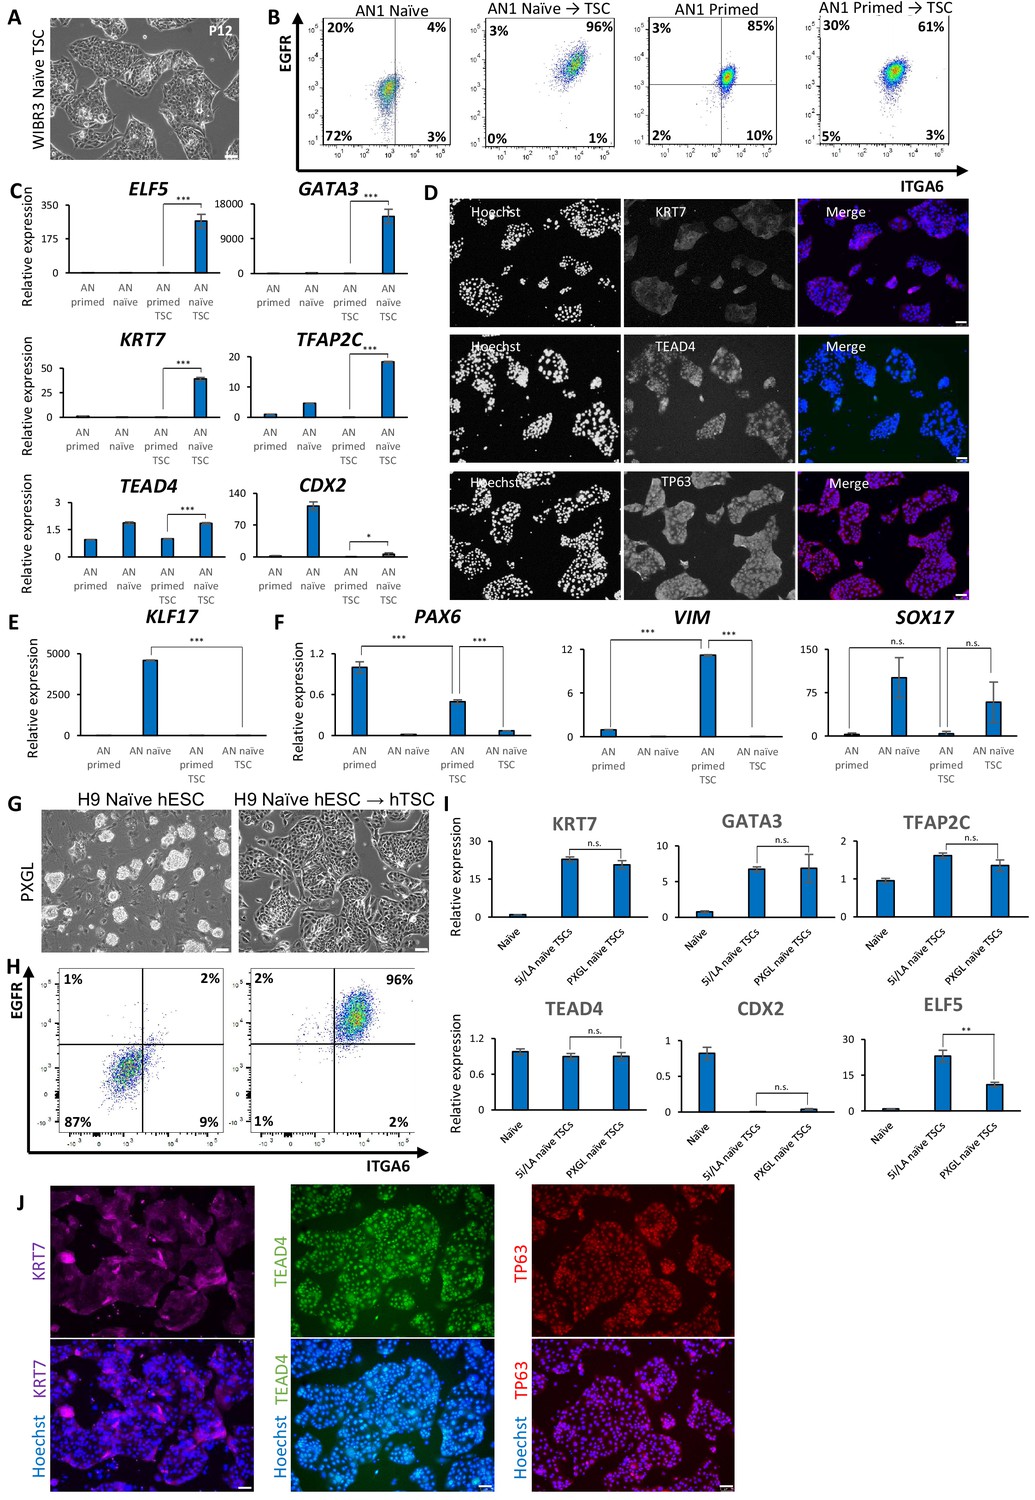
Examining the response of naïve and primed hPSCs to conditions for hTSC derivation.
(A) The experimental scheme for deriving hTSCs from primed and naïve hPSCs. (B) Phase contrast images of H9 and AN_1.1 hTSC-like cells derived from naïve hPSCs, as well as H9 and AN_1.1 primed hPSCs following culture in hTSC medium. All H9 cells were at passage 8, and all AN_1.1 cells were at passage 10. The scale bars indicate 75 μm. (C) Flow cytometry analysis for TSC markers ITGA6 and EGFR in H9 naïve hPSCs, H9 hTSC-like cells derived from naïve hPSCs, H9 primed hPSCs, and H9 primed hPSCs cultured in hTSC medium. (D) Quantitative gene expression analysis for trophoblast marker genes ELF5, KRT7, GATA3, TFAP2C, TEAD4, and CDX2 in H9 primed and naïve hPSCs, H9 hTSC-like cells derived from naïve hPSCs, and H9 primed hPSCs cultured in hTSC medium. Error bars indicate ±1 SD of technical replicates. ‘***' indicates a p-value<0.001. (E) Immunofluorescence staining for TSC markers KRT7, TEAD4, and TP63 in H9 hTSC-like cells derived from naïve hPSCs. The scale bars indicate 75 μm. (F) Flow cytometry analysis for naïve hPSC markers SUSD2 and CD75 in H9 and AN_1.1 naïve hPSCs and hTSC-like cells derived from naïve hPSCs. (G) Quantitative gene expression analysis for naïve hPSC marker KLF17 in H9 primed and naïve hPSCs, hTSC-like cells derived from naïve hPSCs, and primed hPSCs cultured in hTSC medium. Error bars indicate ±1 SD of technical replicates. ‘***' indicates a p-value<0.001. (H) Quantitative gene expression analysis for the embryonic germ layer markers PAX6, VIM, and SOX17 in H9 primed and naïve hPSCs, hTSC-like cells derived from naïve hPSCs, and primed hPSCs cultured in hTSC medium. Error bars indicate ± 1 SD of technical replicates. ‘*' indicates a p-value<0.05, ‘***' indicates a p-value<0.001, and ‘n.s.’ indicates a p-value>0.05.
Figure 2—figure supplement 1
Derivation of hTSCs from naïve hPSCs.
(A) Phase contrast images of WIBR3 hTSC-like cells derived from naïve hPSCs. The scale bars indicate 75 μm. (B) Flow cytometry analysis for TSC markers ITGA6 and EGFR in AN_1.1 naïve hPSCs, hTSC-like cells derived from naïve hPSCs, primed hPSCs, and primed hPSCs cultured in hTSC medium. (C) Quantitative gene expression analysis for trophoblast marker genes ELF5, KRT7, GATA3, TFAP2C, TEAD4, and CDX2 in AN_1.1 primed and naïve hPSCs, hTSC-like cells derived from naïve hPSCs, and primed hPSCs cultured in hTSC medium. Error bars indicate ±1 SD of technical replicates. ‘*' indicates a p-value<0.05, and ‘***' indicates a p-value<0.001. (D) Immunofluorescence staining for TSC markers KRT7, TEAD4, and TP63 in AN_1.1 hTSC-like cells derived from naïve hPSCs. The scale bars indicate 75 μm. (E) Quantitative gene expression analysis for naïve hPSC marker KLF17 in AN_1.1 primed and naïve hPSCs, hTSC-like cells derived from naïve hPSCs, and primed hPSCs cultured in hTSC medium. Error bars indicate ±1 SD of technical replicates. ‘***' indicates a p-value<0.001. (F) Quantitative gene expression analysis for the three embryonic germ layer markers PAX6, VIM, and SOX17 in AN_1.1 primed and naïve hPSCs, hTSC-like cells derived from naïve hPSCs, and primed hPSCs cultured in hTSC medium. Error bars indicate ±1 SD of technical replicates. ‘**' indicates a p-value<0.01, ‘***' indicates a p-value<0.001, and ‘n.s.’ indicates a p-value>0.05. (G) Phase contrast images of H9 naïve hPSCs cultured in PXGL (left) and H9 hTSC-like cells derived from naïve hPSCs cultured in PXGL (right). The scale bars indicate 75 μm. (H) Flow cytometry analysis for TSC markers ITGA6 and EGFR in H9 naïve hPSCs cultured in PXGL (left) and H9 hTSC-like cells derived from naïve hPSCs cultured in PXGL (right). (I) Quantitative gene expression analysis for trophoblast marker genes KRT7, GATA3, TFAP2C, TEAD4, CDX2, and ELF5 in H9 naïve hPSCs, H9 hTSC-like cells derived from naïve hPSCs cultured in 5i/L/A, and H9 hTSC-like cells derived from naïve hPSCs cultured in PXGL. Error bars indicate ±1 SD of technical replicates. ‘**' indicates a p-value<0.01, and ‘n.s.’ indicates a p-value>0.05. (J) Immunofluorescence staining for TSC markers KRT7, TEAD4, and TP63 in H9 hTSC-like cells derived from naïve hPSCs cultured in PXGL. The scale bars indicate 75 μm.
Figure 2—figure supplement 2
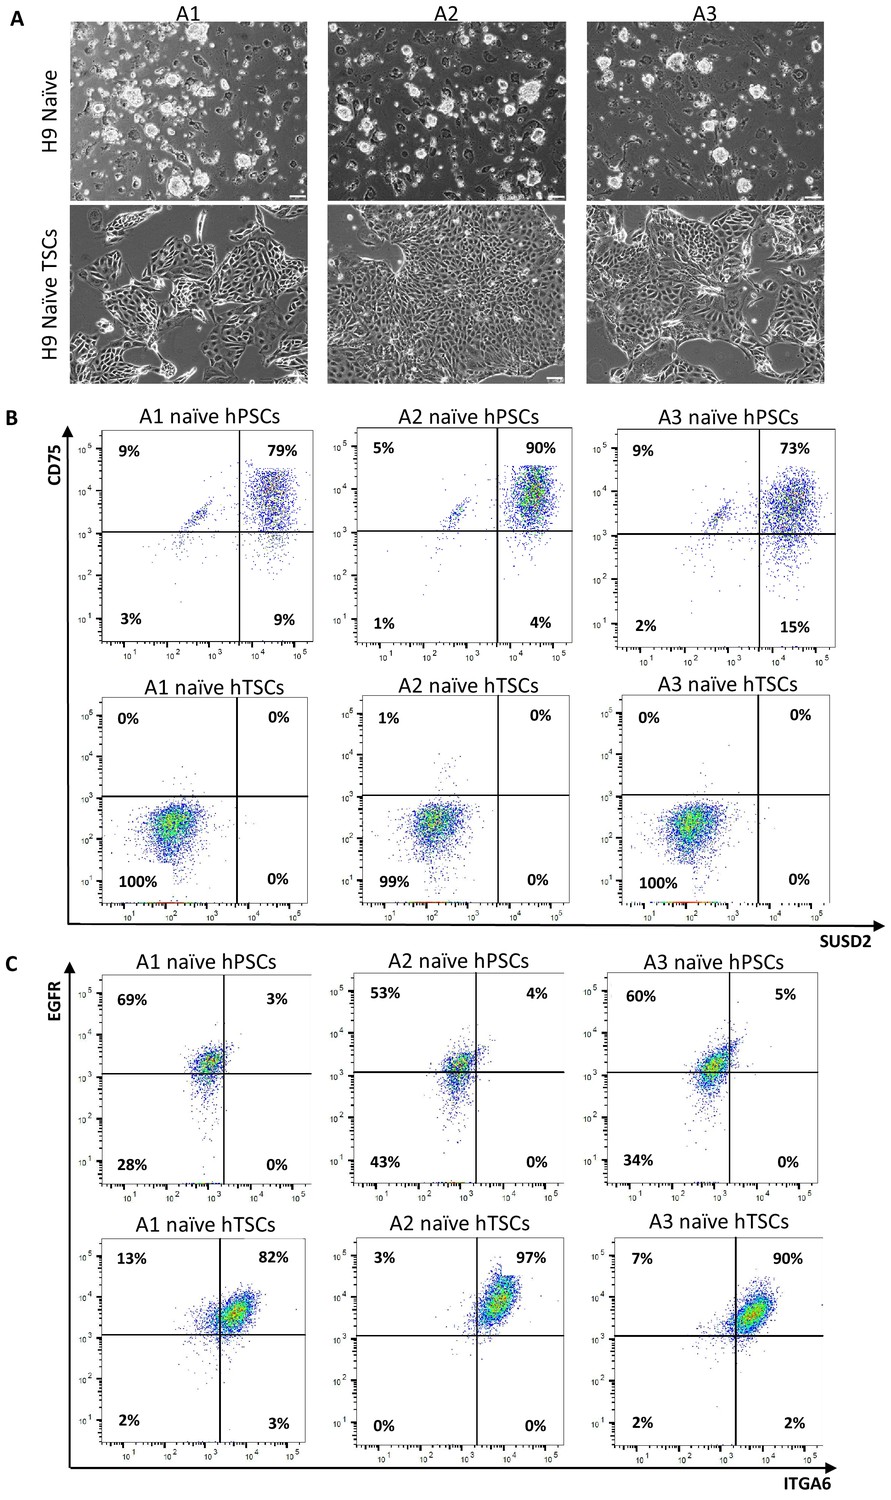
Derivation of naïve hTSCs from clonally expanded naïve hPSCs.
(A) Phase contrast images of single-cell expanded H9 naïve hPSC clones A1, A2, and A3 (top), and naïve hTSCs derived from A1, A2, and A3 naïve hPSCs (bottom). The scale bars indicate 75 μm. (B) Flow cytometry analysis for naïve hPSC markers SUSD2 and CD75 in A1, A2, and A3 naïve hPSCs (top) and A1, A2, and A3 naïve hTSCs (bottom). (C) Flow cytometry analysis for TSC markers ITGA6 and EGFR in A1, A2, and A3 naïve hPSCs (top) and A1, A2, and A3 naïve hTSCs (bottom).
Figure 3 with 1 supplement
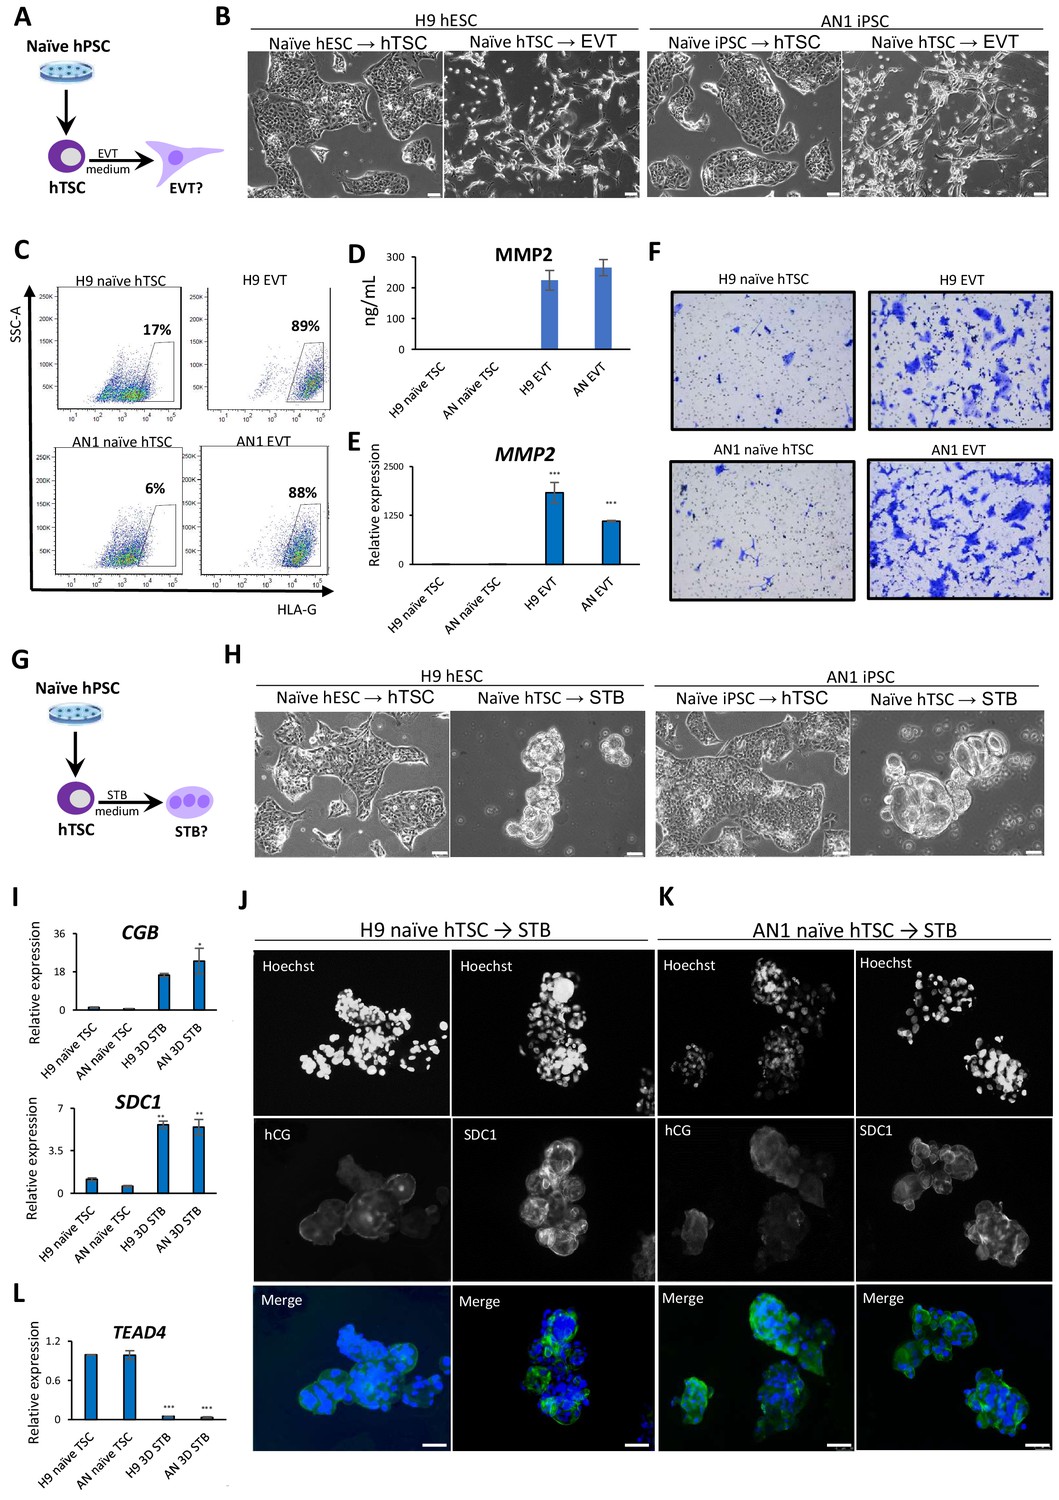
Directed differentiation of EVTs and STBs from naïve hPSC-derived hTSCs.
(A) The experimental scheme for EVT differentiation from naïve hPSC-derived hTSCs. (B) Phase contrast image of H9 and AN_1.1 hTSC-like and EVT-like cells. The scale bars indicate 75 μm. (C) Flow cytometry analysis for EVT marker HLA-G in H9 and AN_1.1 hTSC-like cells and EVT-like cells. (D) Levels of MMP2 secreted by H9 and AN_1.1 hTSC-like cells and EVT-like cells as measured by ELISA. Error bars indicate ±1 SD of technical replicates. (E) Quantitative gene expression analysis for EVT marker gene MMP2 in H9 and AN_1.1 hTSC-like cells and EVT-like cells. Error bars indicate ± 1 SD of technical replicates. ‘***' indicates a p-value<0.001. (F) Matrigel invasion assay of H9 and AN_1.1 hTSC-like cells and EVT-like cells. (G) The experimental scheme for STB differentiation from naïve hPSC-derived hTSCs. (H) Phase contrast image of H9 and AN_1.1 hTSC-like and 3D STB-like cells. The scale bars indicate 75 μm. (I) Quantitative gene expression analysis for STB marker genes CGB and SDC1 in H9 and AN_1.1 hTSC-like cells and 3D STB-like cells. Error bars indicate ±1 SD of technical replicates. ‘*' indicates a p-value<0.05, and ‘**' indicates a p-value<0.01. (J) Immunofluorescence staining for STB markers hCG and SDC1 in H9 3D STB-like cells. The scale bars indicate 75 μm. (K) Immunofluorescence staining for STB markers hCG and SDC1 in AN_1.1 3D STB-like cells. The scale bars indicate 75 μm. (L) Quantitative gene expression analysis for TSC marker gene TEAD4 in H9 and AN_1.1 hTSC-like cells and 3D STB-like cells. Error bars indicate ± 1 SD of technical replicates. ‘***' indicates a p-value<0.001.
Figure 3—figure supplement 1
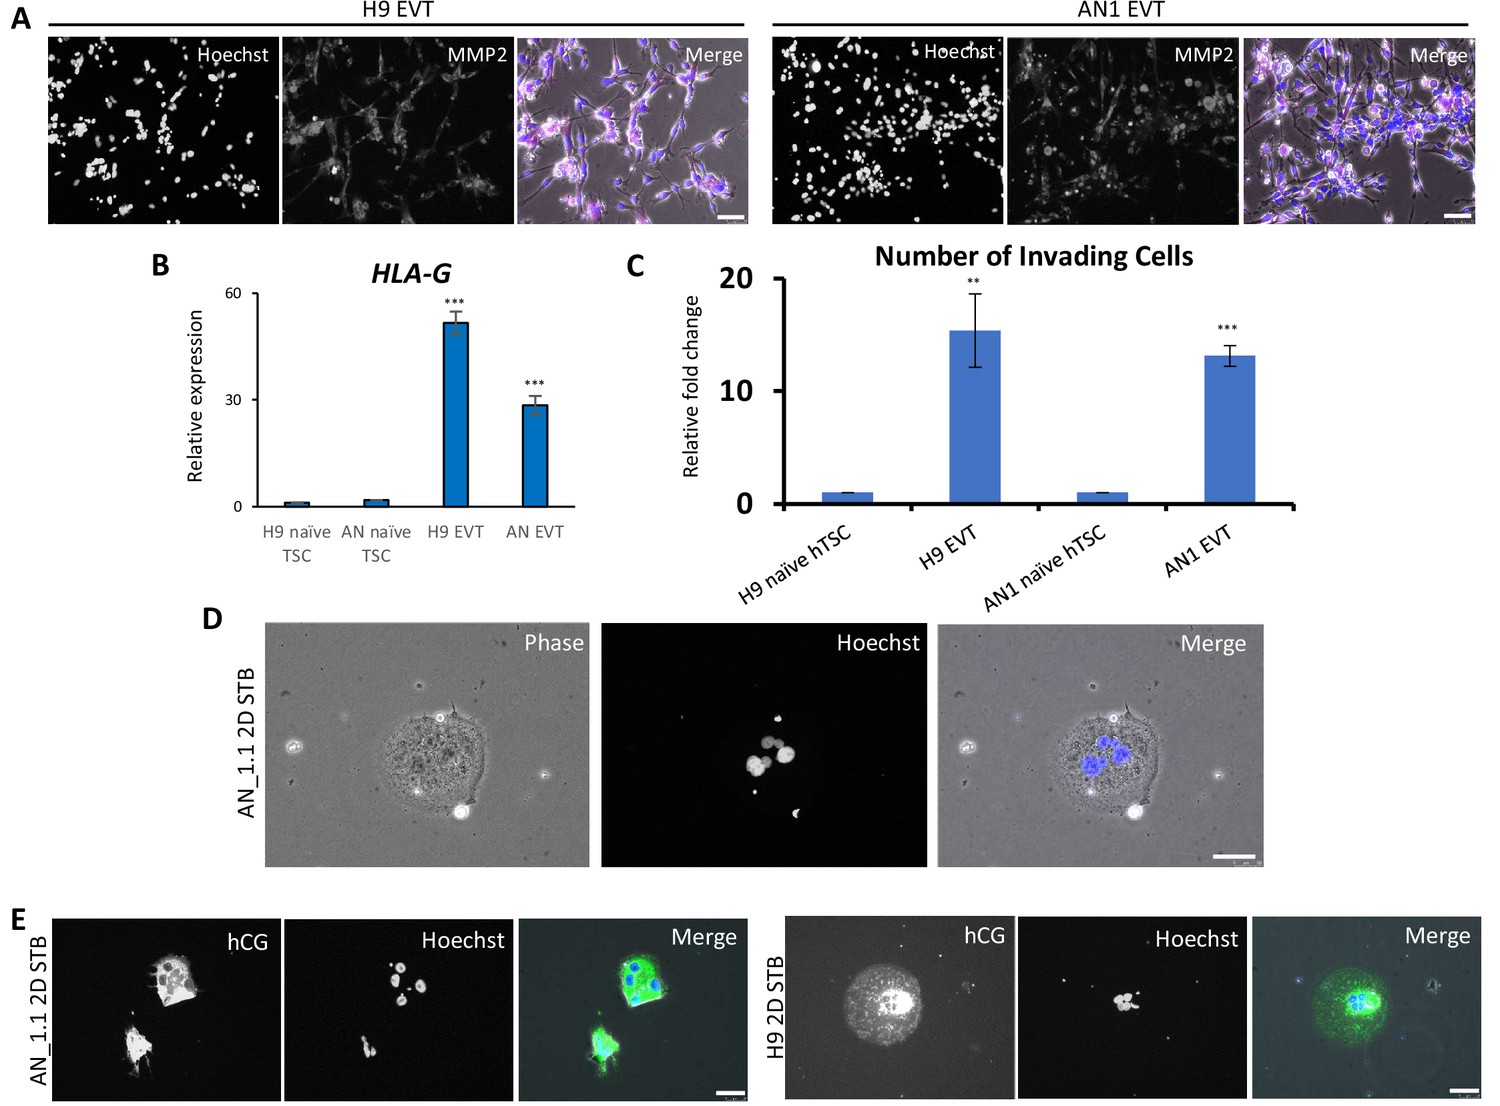
Directed differentiation of EVTs and STBs from naïve hPSC-derived hTSCs.
(A) Immunofluorescence staining for EVT marker MMP2 in H9 and AN_1.1 EVT-like cells. The scale bars indicate 75 μm. (B) Quantitative gene expression analysis for EVT marker gene HLA-G in H9 and AN_1.1 hTSC-like cells and EVT-like cells. Error bars indicate ±1 SD of technical replicates. ‘***' indicates a p-value<0.001. (C) The relative fold change of the number of invading cells following Matrigel invasion assay of H9 and AN_1.1 hTSC-like cells and EVT-like cells. Error bars indicate ±1 standard error of technical replicates. ‘**' indicates a p-value<0.01, and ‘***' indicates a p-value<0.001. (D) Phase contrast and fluorescence image of AN_1.1 2D STB-like cells, which exhibit multinucleation. The scale bars indicate 75 μm. (E) Immunofluorescence staining for STB marker hCG in H9 and AN_1.1 2D STB-like cells. The scale bars indicate 75 μm.
Figure 4 with 2 supplements
Transcriptomic and chromatin accessibility profiling of naïve hPSC-derived hTSCs.
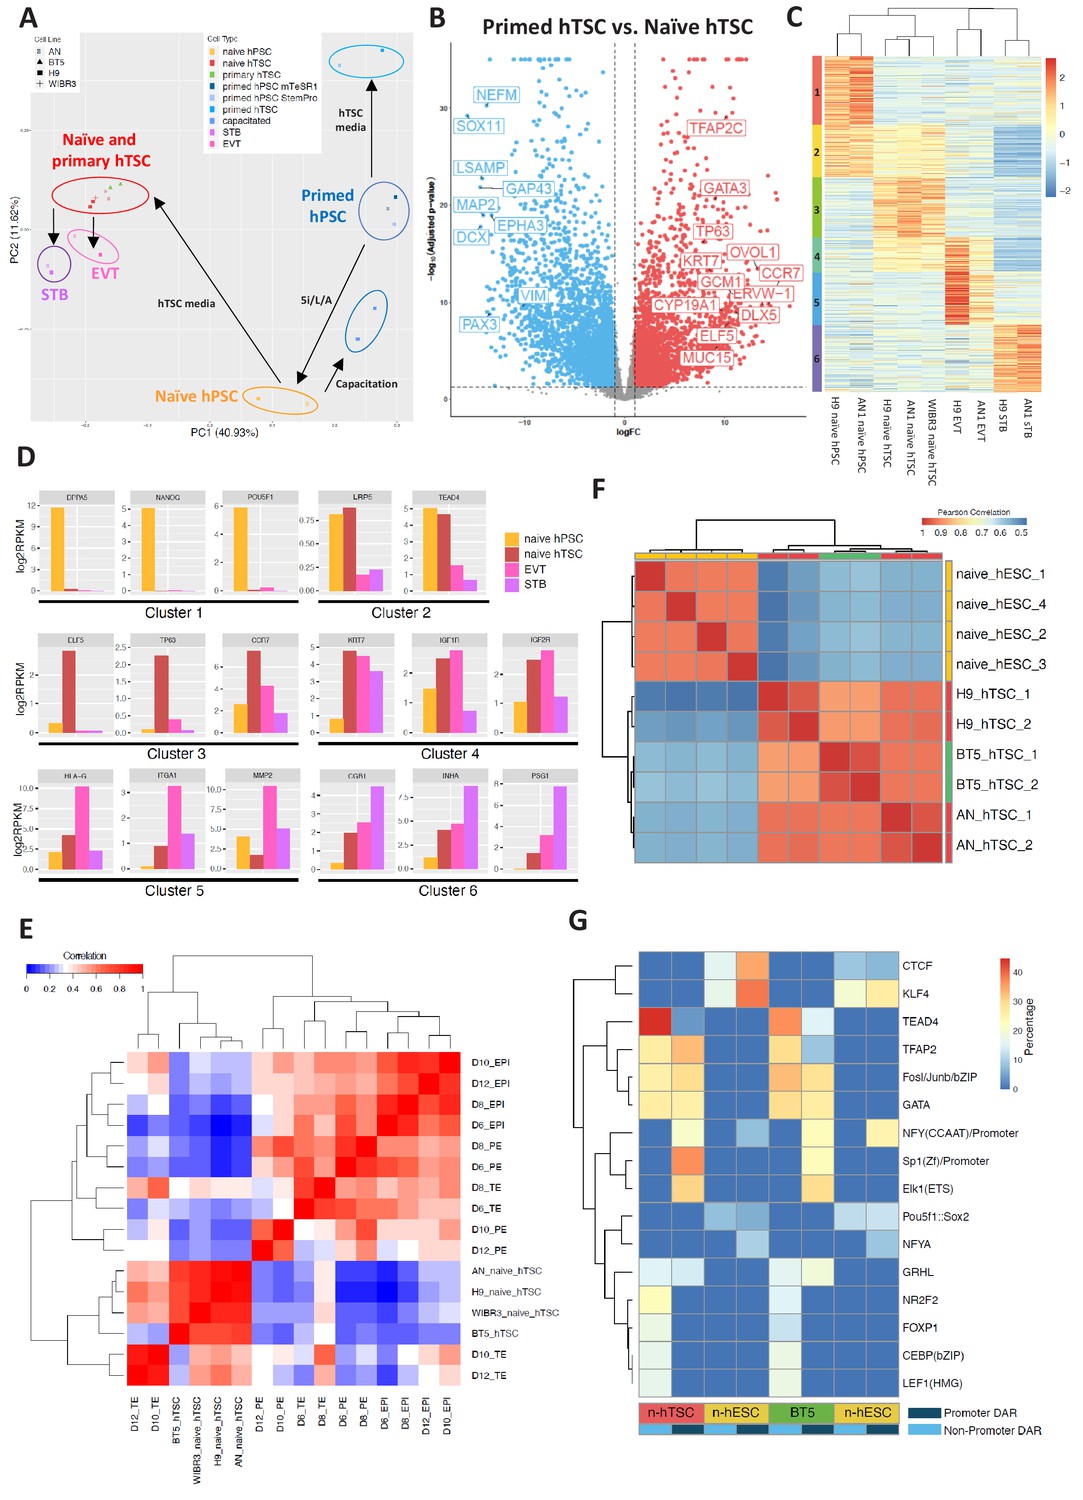
(A) Principal component analysis (PCA) of primed, capacitated, and naïve hPSCs, BT5 hTSCs, naïve hTSCs, EVTs, STBs, and primed hPSCs cultured in hTSC medium based on RNA-seq data. Circles were drawn around samples cultured in the same media. (B) Volcano plots showing fold change (X axis) between naïve hTSCs and primed hPSCs cultured in hTSC medium. The light blue dots represent genes that are the most significantly upregulated in primed hTSCs (defined as those that have a log fold change < −1 and wherein p<0.05). The red dots represent genes that are the most significantly upregulated in naïve hPSCs cultured in hTSC medium (defined as those that have a log fold change >1 and wherein p<0.05). (C) Heatmap of RNA-seq data from naïve hPSCs, naïve hTSCs, EVTs, and STBs (DEGs with more than 2X fold change and p-adj < 0.05 are analyzed). Cluster one represents genes highly expressed in naïve hPSCs only. Cluster two represents genes highly expressed in both naïve hPSCs and naïve hTSCs. Cluster three represents genes highly expressed in naïve hTSCs only. Cluster four represents genes highly expressed in both naïve hTSCs and EVTs. Cluster five represents genes highly expressed in EVTs only. Cluster six represents genes highly expressed in STBs only. (D) Expression levels of key marker genes associated with clusters 1–6. (E) Heatmap indicating the correlation among scRNA-seq data from published day 6, day 8, day 10, and day 12 TE, EPI, and PE (Zhou et al., 2019), as well as RNA-seq data from naïve and BT5 hTSCs. Genes specifically expressed in the TE, EPI, or PE lineages were analyzed (Zhou et al., 2019). (F) Heatmap of ATAC-seq data from naïve hESCs and naïve hTSCs (Pearson correlations were calculated based on genome-wise ATAC-seq signal). Naïve hESC ATAC-seq data were retrieved from a published dataset (Pastor et al., 2018). (G) Transcription factor binding motifs enriched in the promoter and non-promoter regions of the DARs specific to naïve hESCs vs. naïve hTSCs and naïve hESCs vs. BT5 hTSCs.
Figure 4—figure supplement 1
Transcriptomic profiling of naïve hPSC-derived hTSCs.
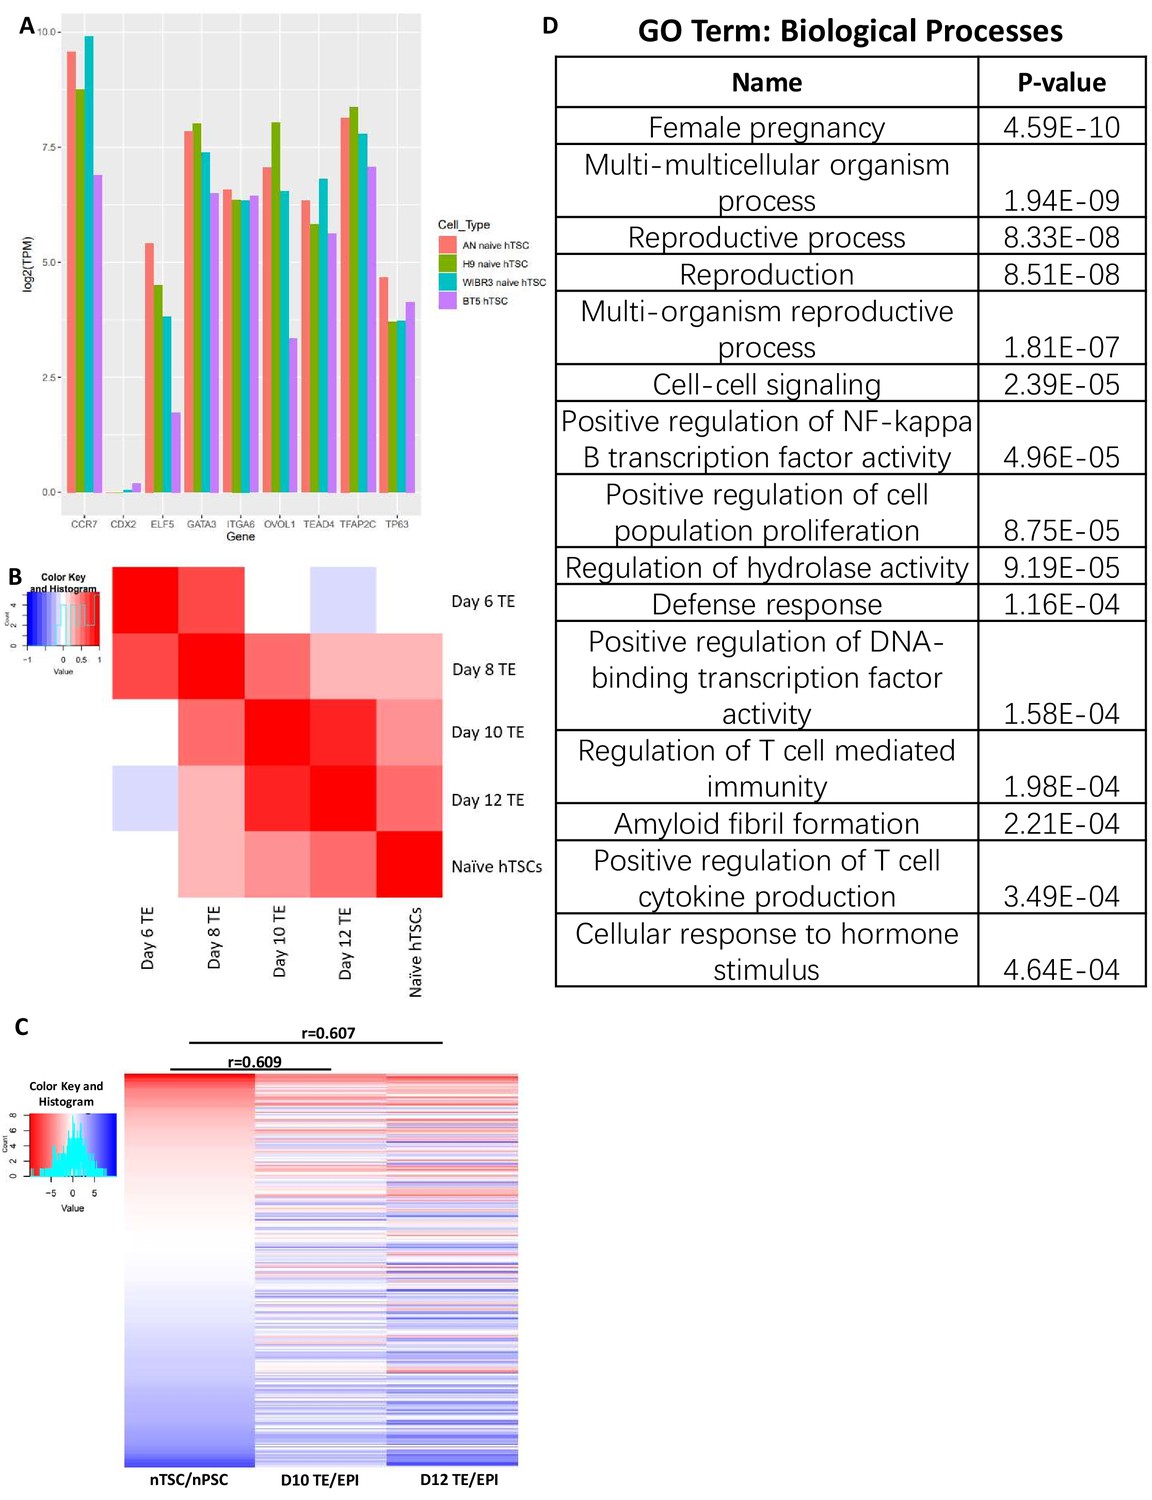
(A) Expression levels of known trophoblast markers genes in H9 naïve hTSCs, AN_1.1 naïve hTSCs, WIBR3 naïve hTSCs, and BT5 hTSCs. (B) Heatmap indicating the correlation among scRNA-seq data from published day 6, day 8, day 10, and day 12 TE (Zhou et al., 2019), as well as RNA-seq data from naïve hTSCs. TE genes with stage-specific expression patterns were analyzed (Zhou et al., 2019). (C) Heatmap of scRNA-seq data from published day 10 and day 12 Epiblast (EPI) and Trophectoderm (TE) (Zhou et al., 2019), as well as RNA-seq data from naïve hPSCs and naïve hTSCs. Genes specifically expressed in the TE or EPI lineage at day 10 or 12 were analyzed (Zhou et al., 2019). (D) Complete list of GO terms (biological processes) and their p-values. The top 10% most upregulated genes in naïve hTSC relative to naïve hPSC in C were analyzed.
Figure 4—figure supplement 2
Chromatin accessibility profiling of naïve hPSC-derived hTSCs.
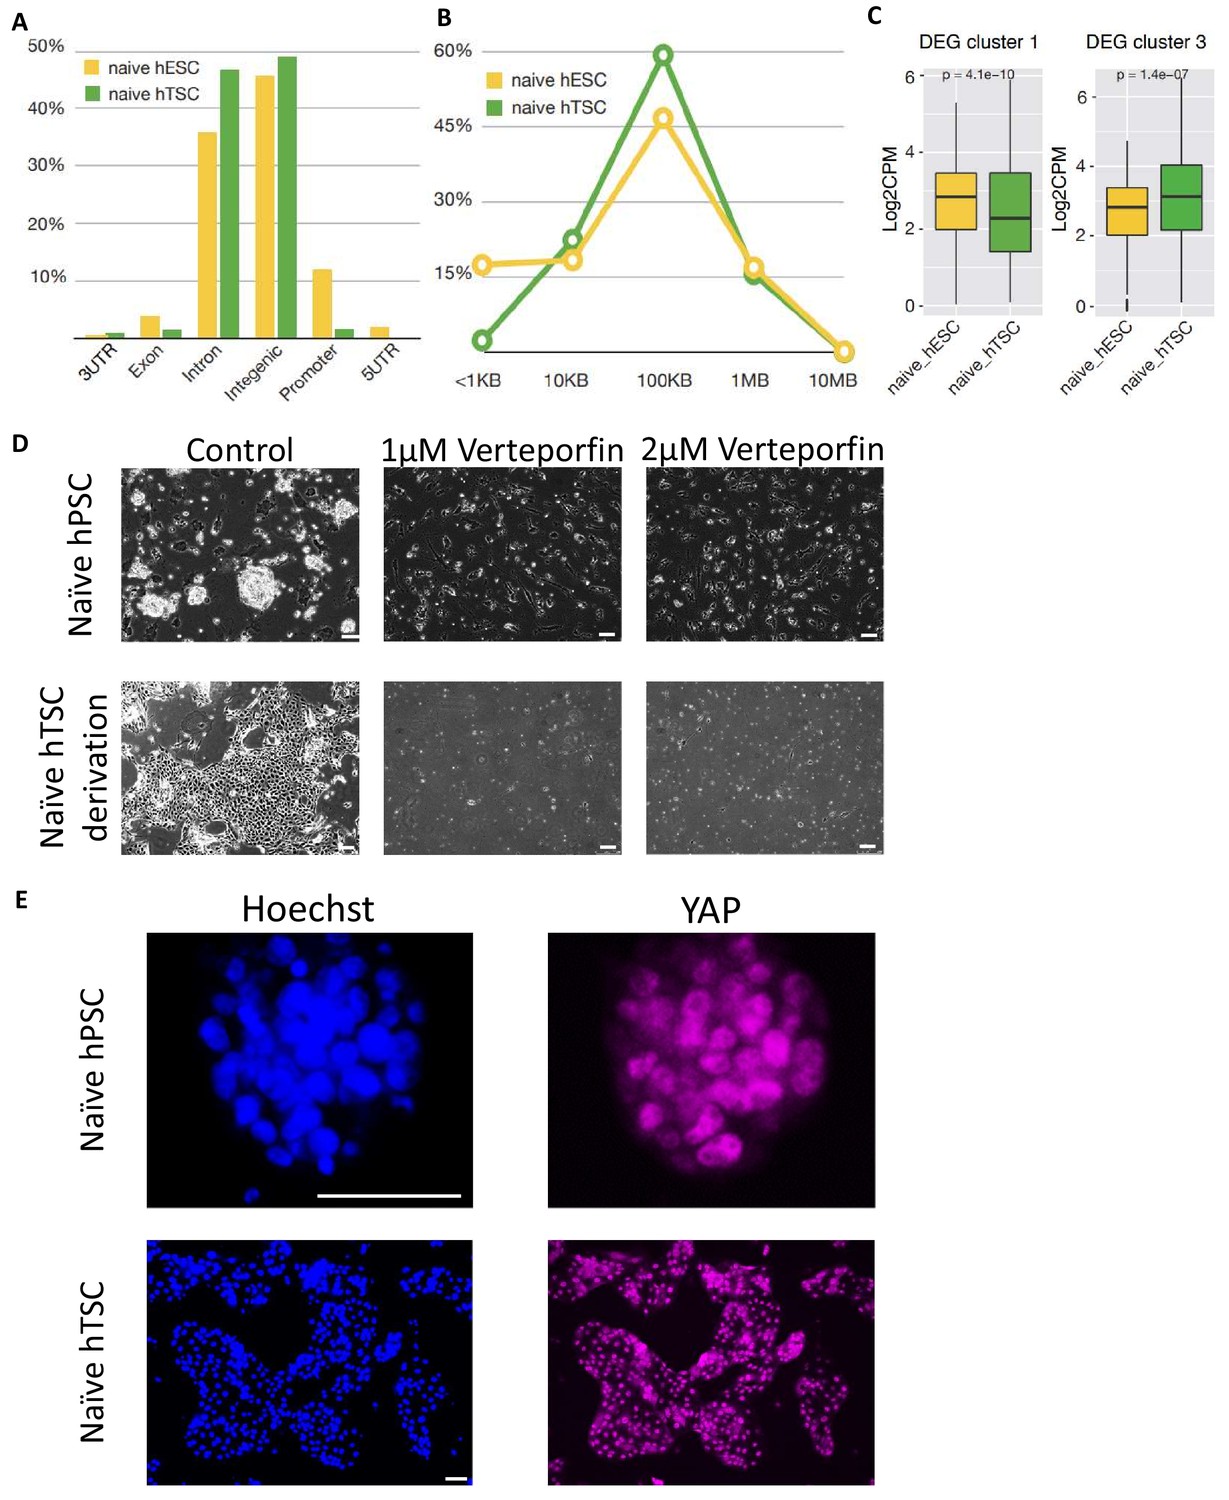
(A) The genomic distribution of DARs specific to naïve hESCs and naïve hTSCs. (B) The distribution of distance from the transcriptional start site (TSS) to the DARs specific to naïve hESCs and naïve hTSCs. (C) ATAC-seq signal at promoter regions of genes within cluster 1 (enriched in naïve hESCs) and cluster 3 (enriched in naïve hTSCs) in naïve hESCs and naïve hTSCs (Mann-Whitney U test). (D) Phase contrast images of the maintenance of H9 naïve hPSCs (top) and the derivation of H9 naïve hTSCs (bottom). 5i/L/A (top) and hTSC media (bottom) were supplemented with Verteporfin at the indicated concentration. The scale bars indicate 75 μm. (E) Immunofluorescence staining for YAP in H9 naïve hPSCs and H9 naïve hTSCs. The scale bars indicate 75 μm.
Tables
Key resources table
| Reagent type (species) or resource | Designation | Source or reference | Identifiers | Additional information |
|---|---|---|---|---|
| Antibody | anti-KRT7 (Rabbit monoclonal) | Cell signaling | 4465 | 1:100 |
| Antibody | anti-TP63 (Goat monoclonal) | R and D system | AF1916 | 1:20 |
| Antibody | anti-TEAD4 (Mouse monoclonal) | Abcam | ab58310 | 1:400 |
| Antibody | anti-SDC1 (Mouse monoclonal) | Abcam | ab34164 | 1:100 |
| Antibody | anti-ZO1 (Mouse monoclonal) | Invitrogen | 33–9100 | 1:100 |
| Antibody | anti-hCG (Mouse monoclonal) | Invitrogen | 14650882 | 1:100 |
| Antibody | anti-MMP2 (Rabbit monoclonal) | Cell Signaling | 40994 | 1:800 |
| Antibody | anti-SUSD2-PE | BioLegend | 327406 | 1:100 |
| Antibody | anti-CD75-eFluor 660 | Thermo Fisher | 50-0759-42 | 1:100 |
| Antibody | anti-ITG6-FITC | Miltenyi | 130-097-245 | 1:100 |
| Antibody | anti-EGFR-APC | BioLegend | 352905 | 1:20 |
| Antibody | anti-HLA-G-PE | Abcam | ab24384 | 1:100 |
| Antibody | anti-YAP (Rabbit monoclonal) | Cell Signaling | 14074 | 1:100 |
| Antibody | anti-mouse-Alexa 488 | Invitrogen | A-21202 | 1:500 |
| Antibody | anti-rabbit-Alexa 647 | Invitrogen | A-31573 | 1:500 |
| Antibody | anti-goat-Alexa 555 | Invitrogen | A-21432 | 1:500 |
| Cell line (Human) | H9 hESC | WashU GEiC | ||
| Cell line (Human) | AN_1.1 iPSC | WashU GEiC | ||
| Cell line (Human) | WIBR3 hESC | Whitehead Institute | Dr. Jaenisch | |
| Cell line (Human) | BT5 hTSC | (Okae et al., 2018) | Drs. Okae, Arima, and Pastor | |
| Recombinant protein | EGF | Rockland | 009–001 C26 | |
| Recombinant protein | NRG1 | Cell signaling | 5218SC | |
| Recombinant protein | Activin A | Peprotech | 120–14 | |
| Recombinant protein | BMP4 | R and D Systems | 314 BP | |
| Chemical compound | CHIR99021 | Stemgent | 04–0004 | |
| Chemical compound | A83-01 | BioVision | 1725 | |
| Chemical compound | SB431542 | BioVision | 1674 | |
| Chemical compound | VPA | Tocris | 2815 | |
| Chemical compound | Forskolin | Sigma-Aldrich | F3917 | |
| Chemical compound | Y-27632 | Stemgent | 04–0012 | |
| Chemical compound | PD0325901 | Stemgent | 04–0006 | |
| Chemical compound | IM-12 | Enzo | BML-WN102 | |
| Chemical compound | SB590885 | Tocris | 2650 | |
| Chemical compound | WH4-023 | A Chemtek | H620061 | |
| Chemical compound | XAV939 | Selleckchem | S1180 | |
| Chemical compound | Gö6983 | Tocris | 2285 | |
| Chemical compound | Verteporfin | Tocris | 5305 | |
| Commercial assay, kit | MMP2 ELISA kit | Abcam | ab100606 |
Additional files
-
Supplementary file 1
DEGs between naïve hTSCs and primed hPSCs cultured in hTSC media.
- https://cdn.elifesciences.org/articles/52504/elife-52504-supp1-v2.csv
-
Supplementary file 2
DEG clusters of naïve hPSCs, naïve hTSCs, EVTs, and STBs.
- https://cdn.elifesciences.org/articles/52504/elife-52504-supp2-v2.csv
-
Supplementary file 3
GO term analysis of DEG clusters of naïve hPSCs, naïve hTSCs, EVTs, and STBs.
- https://cdn.elifesciences.org/articles/52504/elife-52504-supp3-v2.xlsx
-
Supplementary file 4
GO term analysis of the most upregulated genes in naïve hTSC relative to naïve hPSC (Figure 4—figure supplement 1C).
- https://cdn.elifesciences.org/articles/52504/elife-52504-supp4-v2.xlsx
-
Supplementary file 5
DEG cluster one genes that contain naïve hESC ATAC-seq peaks with TEAD4 transcription factor binding motif.
- https://cdn.elifesciences.org/articles/52504/elife-52504-supp5-v2.xlsx
-
Supplementary file 6
DEG cluster 1 to 6 genes that contain naïve hTSC-specific ATAC-seq peaks with TEAD4 transcription factor binding motif.
- https://cdn.elifesciences.org/articles/52504/elife-52504-supp6-v2.xlsx
-
Transparent reporting form
- https://cdn.elifesciences.org/articles/52504/elife-52504-transrepform-v2.pdf
Download links
A two-part list of links to download the article, or parts of the article, in various formats.
Downloads (link to download the article as PDF)
Open citations (links to open the citations from this article in various online reference manager services)
Cite this article (links to download the citations from this article in formats compatible with various reference manager tools)
Derivation of trophoblast stem cells from naïve human pluripotent stem cells
eLife 9:e52504.
https://doi.org/10.7554/eLife.52504


