FMRP promotes RNA localization to neuronal projections through interactions between its RGG domain and G-quadruplex RNA sequences
- Department of Biochemistry and Molecular Genetics, University of Colorado Anschutz Medical Campus, United States
- Barbara Davis Center for Diabetes, University of Colorado Anschutz Medical Campus, United States
- Department of Pharmacology, University of North Carolina at Chapel Hill, United States
- Departments of Cell Biology and Neurology, Emory University School of Medicine, Georgia
- RNA Bioscience Initiative, University of Colorado Anschutz Medical Campus, United States
Figures
Figure 1 with 11 supplements
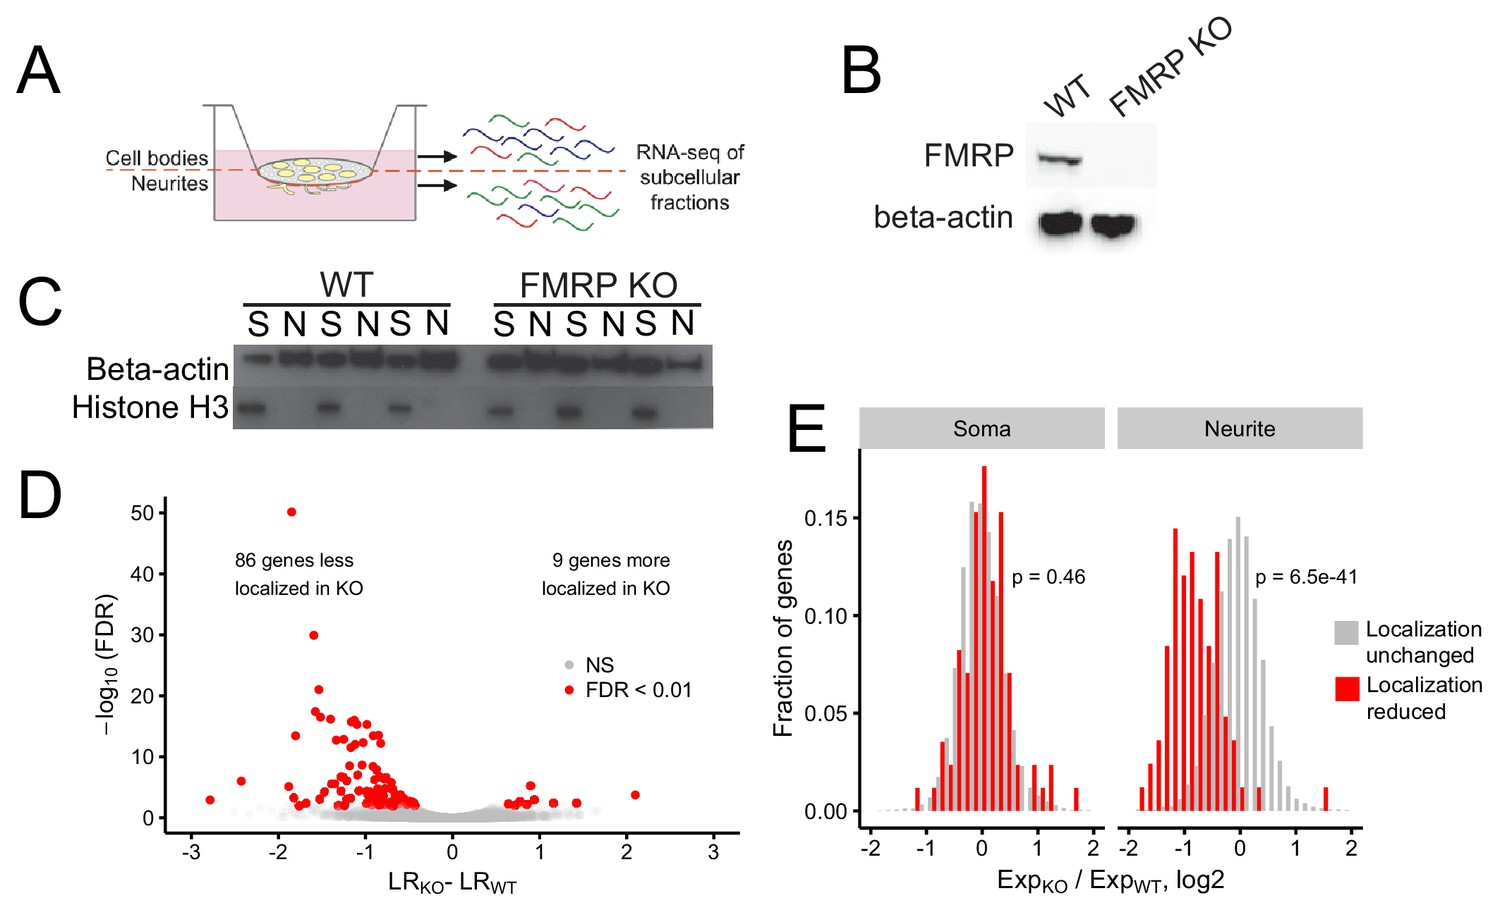
Identification of FMRP localization targets.
(A) Schematic of soma/neurite fractionation. Cells are plated on porous membranes. Neurites grow down through the pores, and cells are then mechanically fractionated by scraping. (B) Western blot of wildtype and CAD FMRP knockout cells. (C) Western blot of fractionated soma (S) and neurite (N) samples. Beta-actin is a marker of both soma and neurite fractions while Histone H3, being restricted to the nucleus, is a marker of soma fractions. (D) Localization ratio (LR) comparison for all expressed genes in wildtype and FMRP-null cells. Changes in LR values and FDR values were calculated using Xtail. (E) Expression changes across genotypes in the soma and neurite fractions for FMRP localization targets (red) and nontargets (gray). P-values were calculated using a Wilcoxon rank-sum test.
Figure 1—figure supplement 1
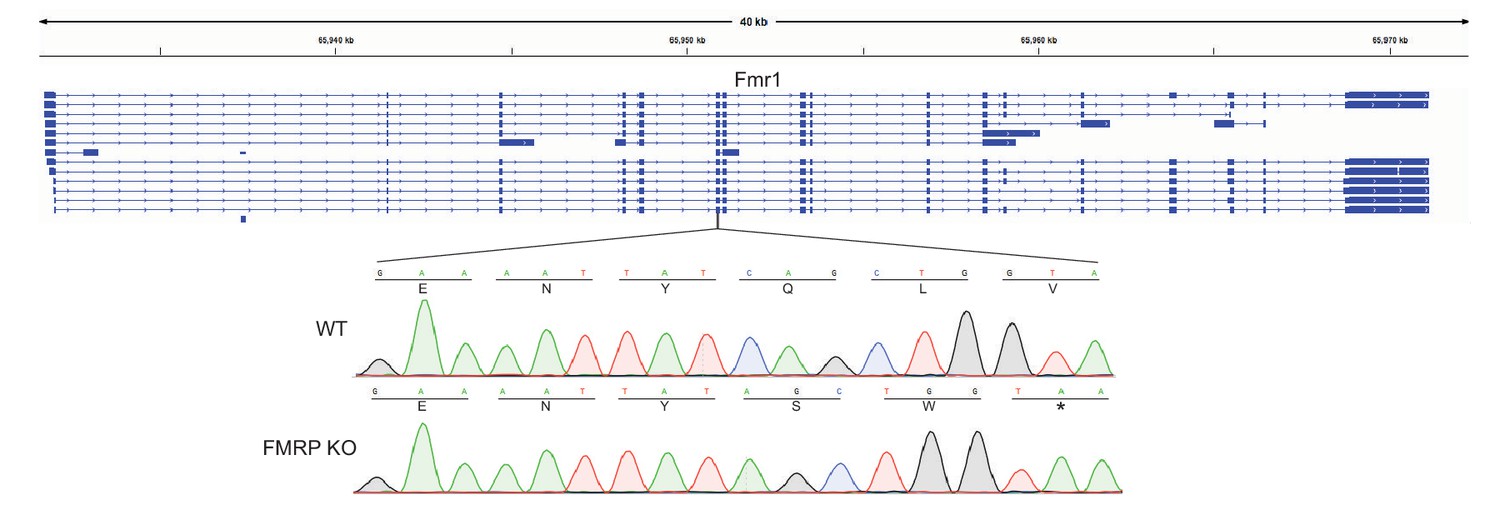
Location of guide RNA directed against Fmr1.
Sanger sequencing tracks of wildtype and knockout CAD cells are shown. In all alleles of the knockout cells, a single basepair deletion was created, leading to the creation of a premature stop codon two codons later.
Figure 1—figure supplement 2
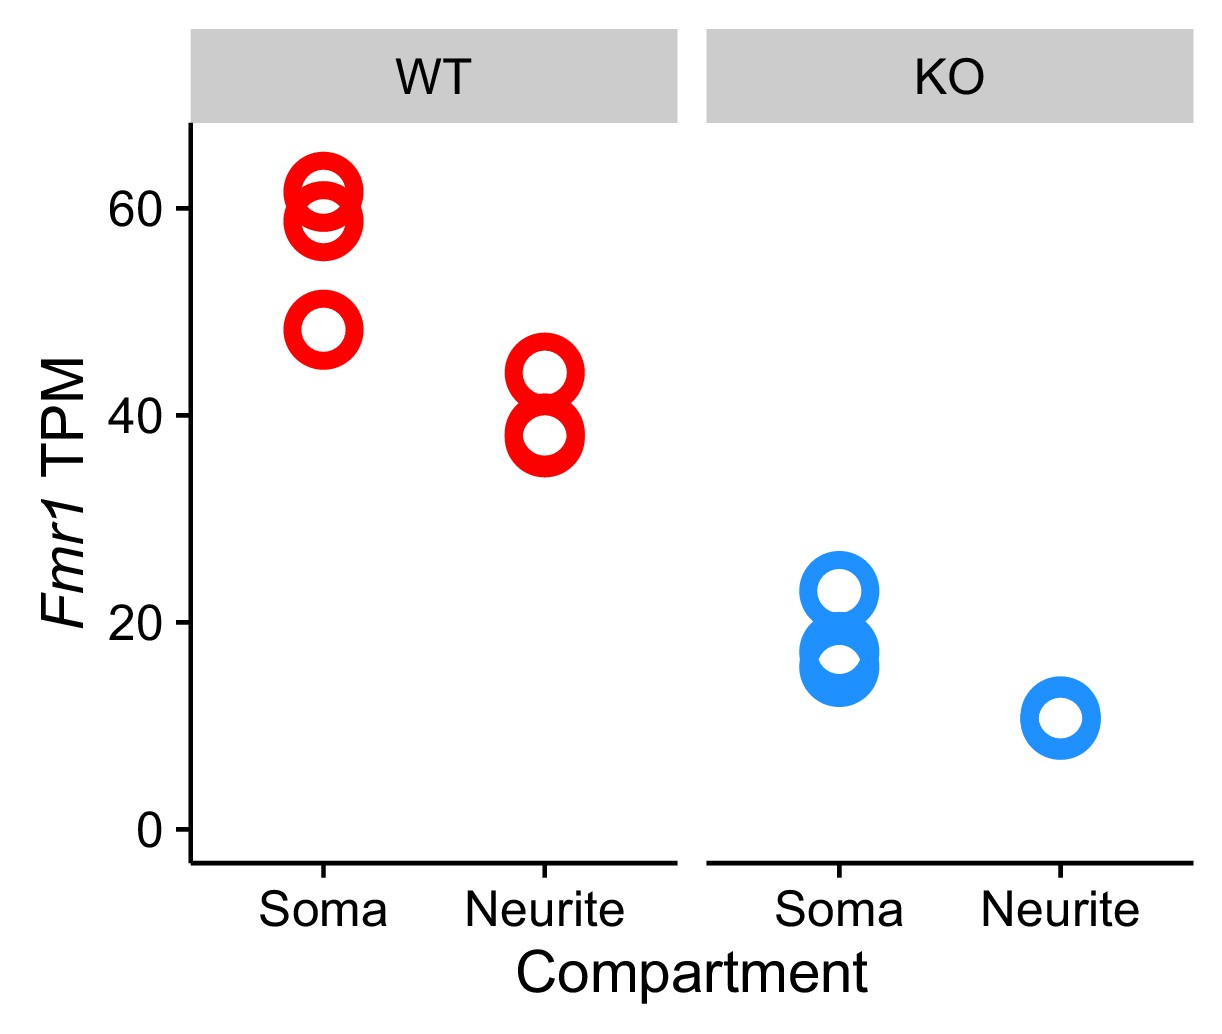
RNA expression levels of Fmr1 in the wildtype and FMRP null cells.
Figure 1—figure supplement 3
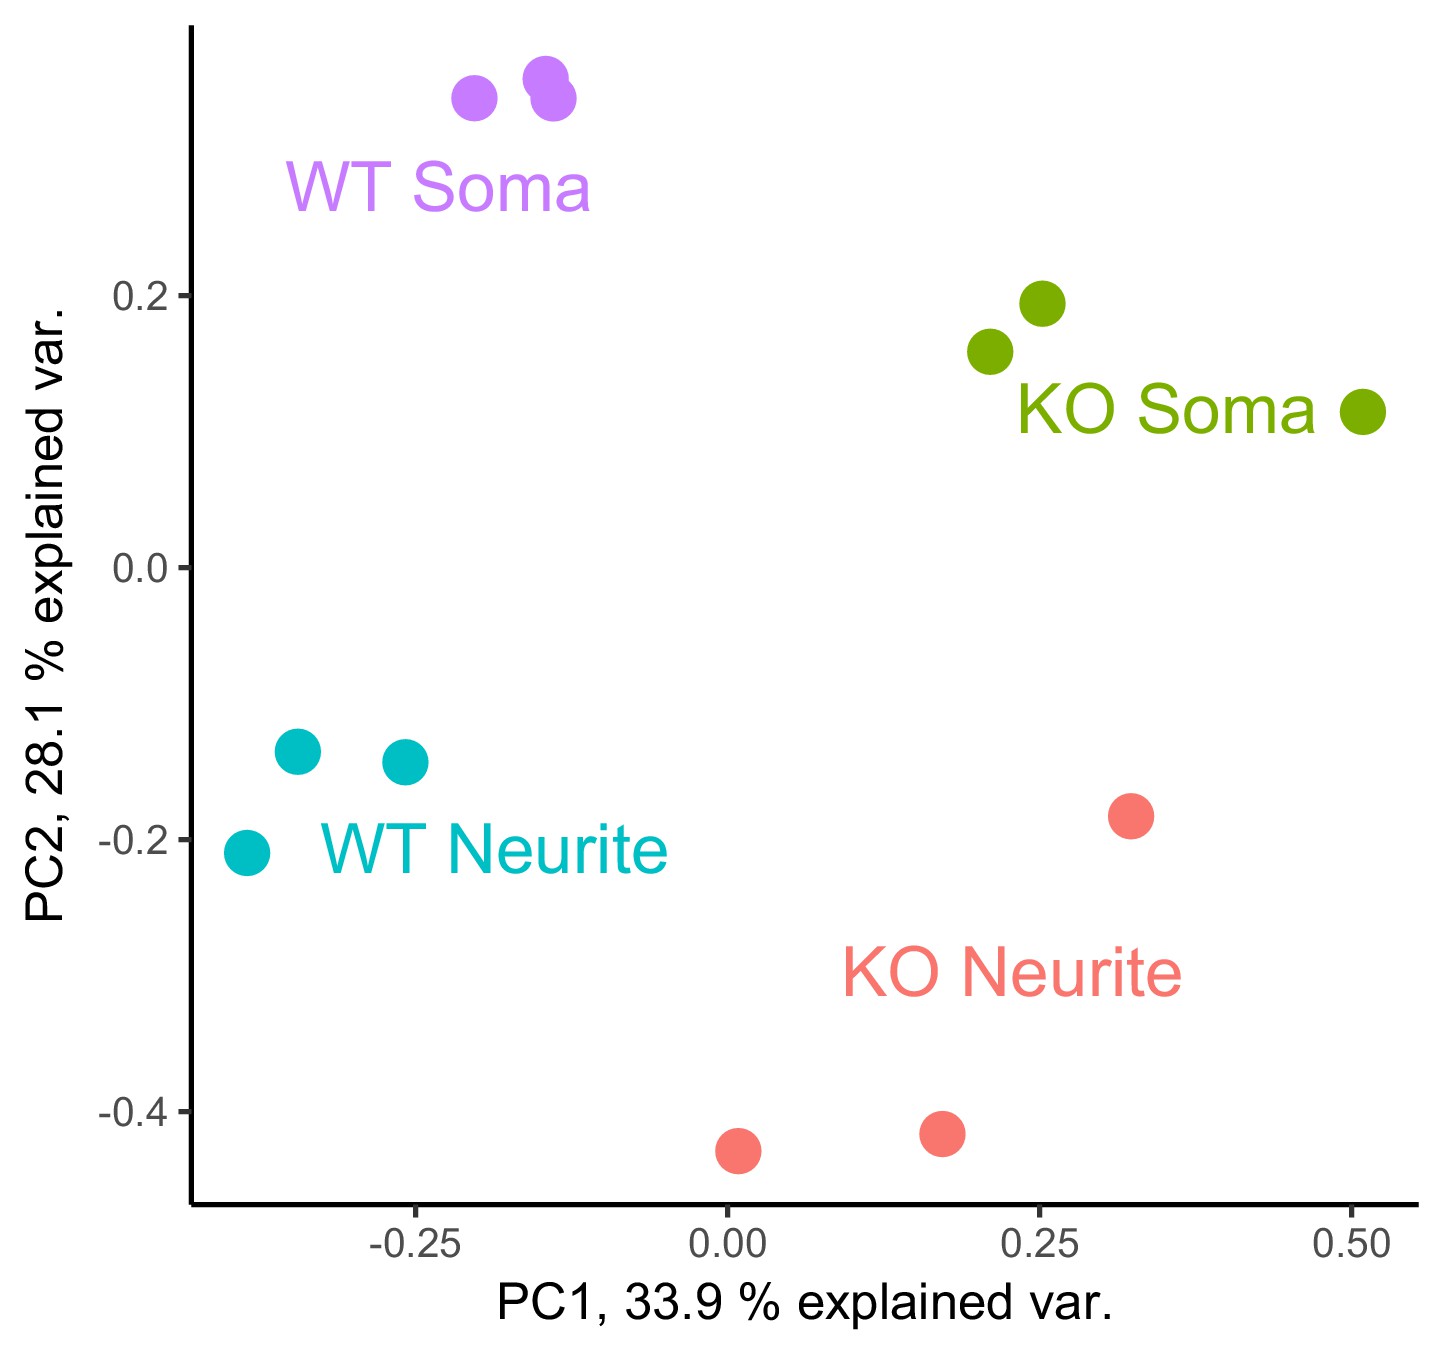
PCA analysis of gene expression values from the soma and neurite compartments of wildtype and FMRP null cells.
Figure 1—figure supplement 4
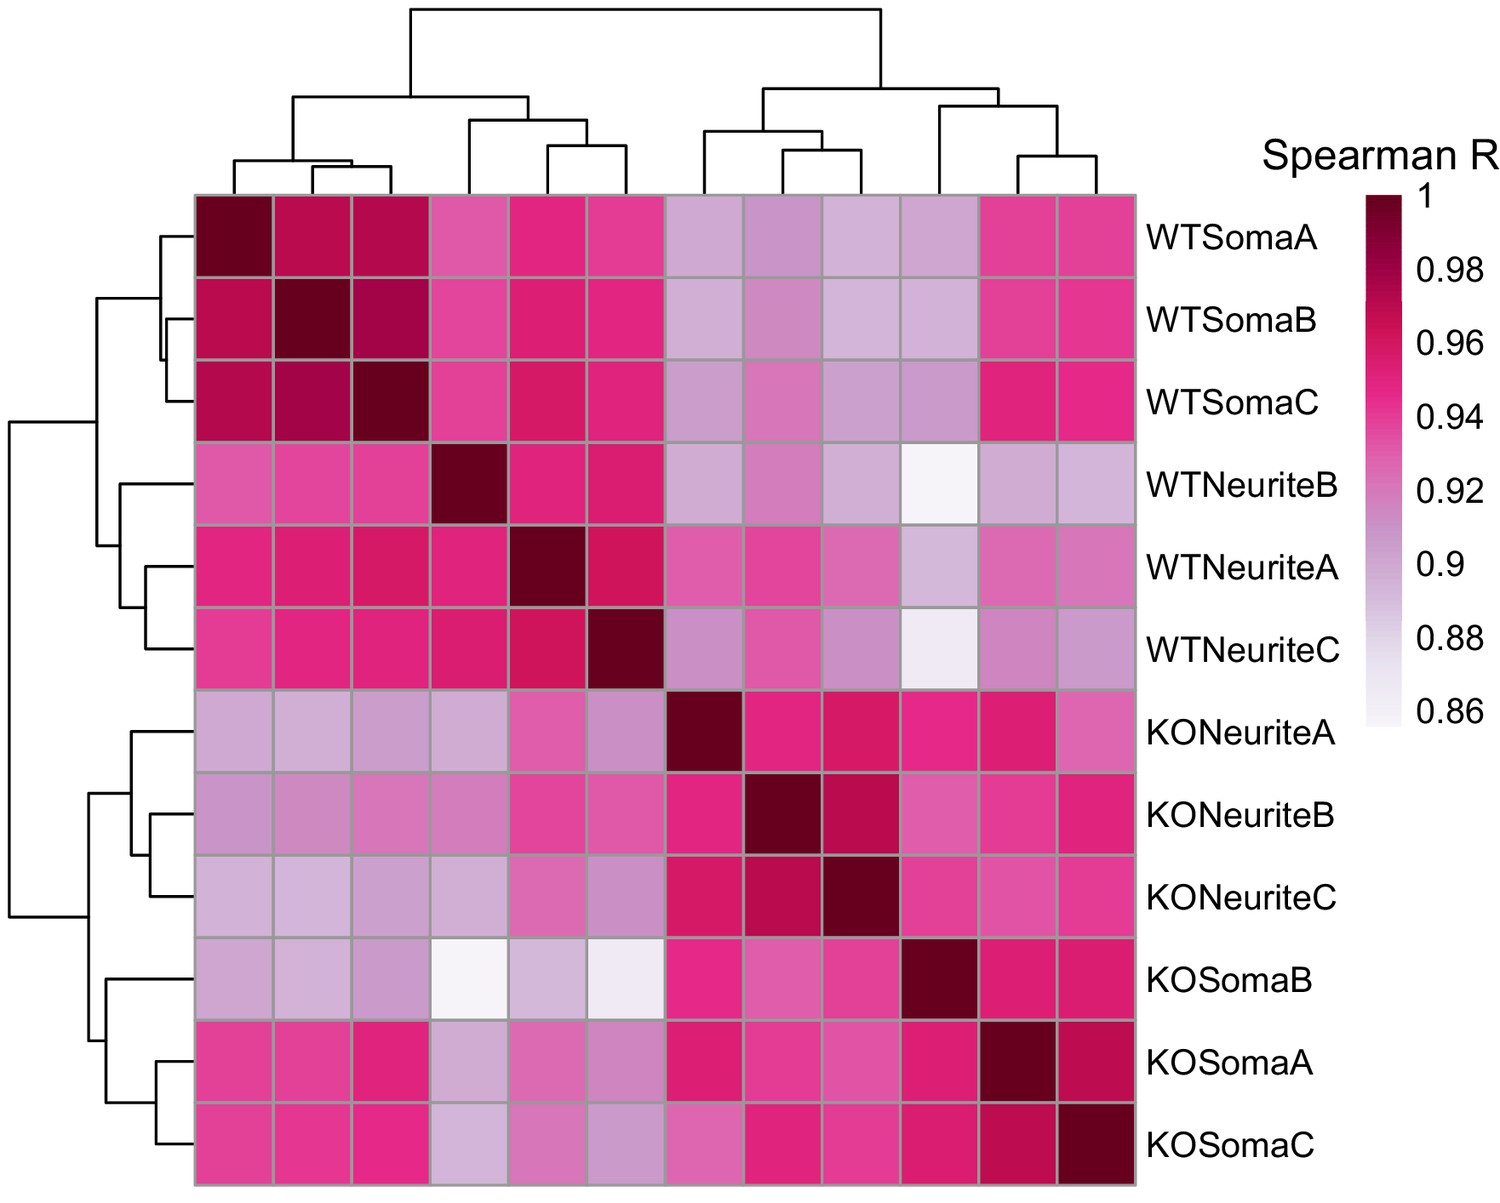
Correlation and clustering analysis of gene expression values from the soma and neurite compartments of wildtype and FMRP null cells.
Figure 1—figure supplement 5
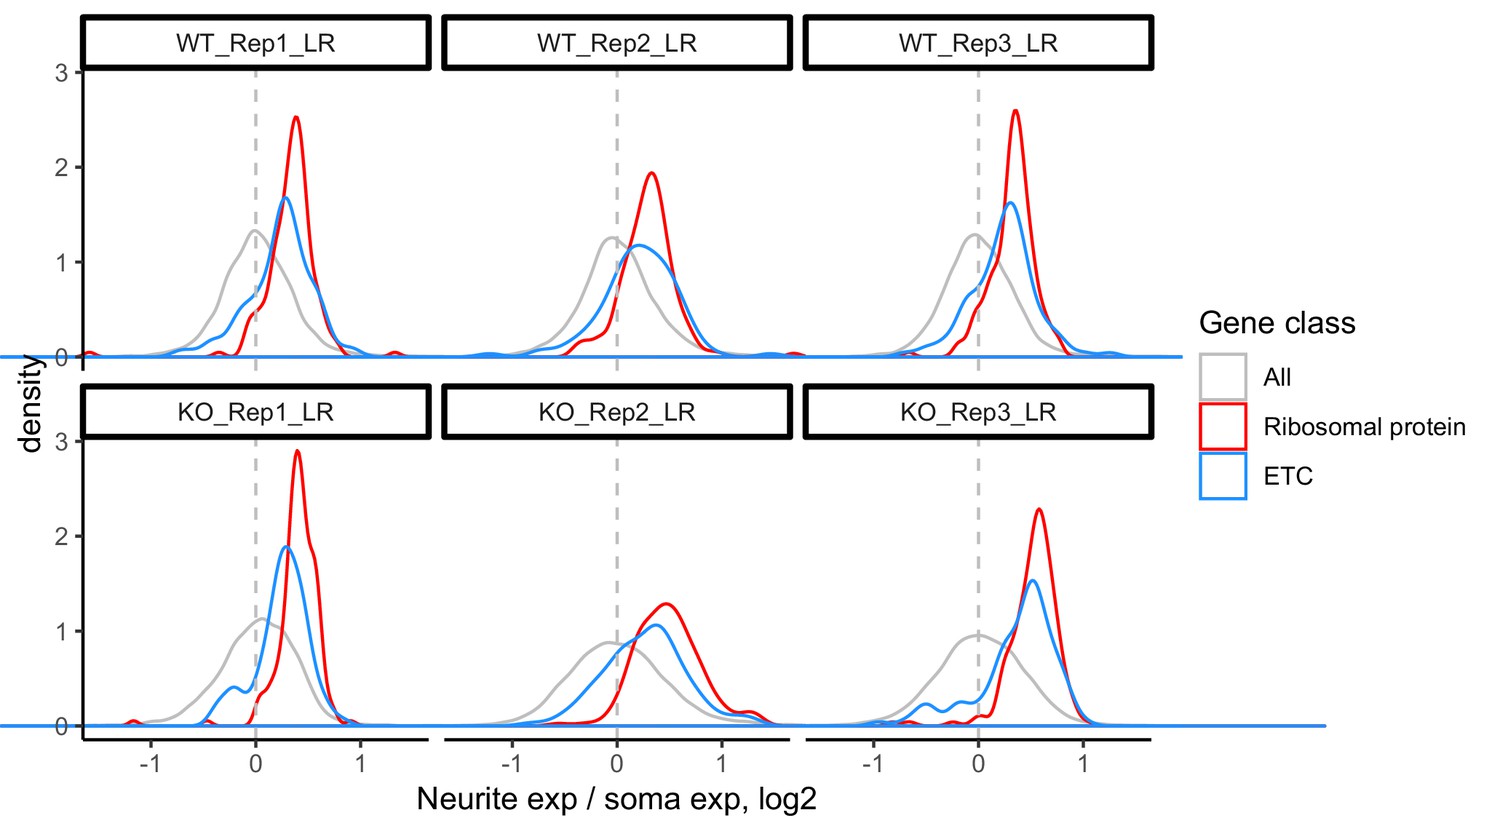
LR values for all genes (gray), ribosomal protein genes (red), and genes that are part of the electron transport chain (blue).
We have observed that RNAs encoding ribosomal protein genes and components of the electron transport chain are consistently neurite-enriched and therefore use them as markers to assess whether the soma/neurite fractionation was successful.
Figure 1—figure supplement 6
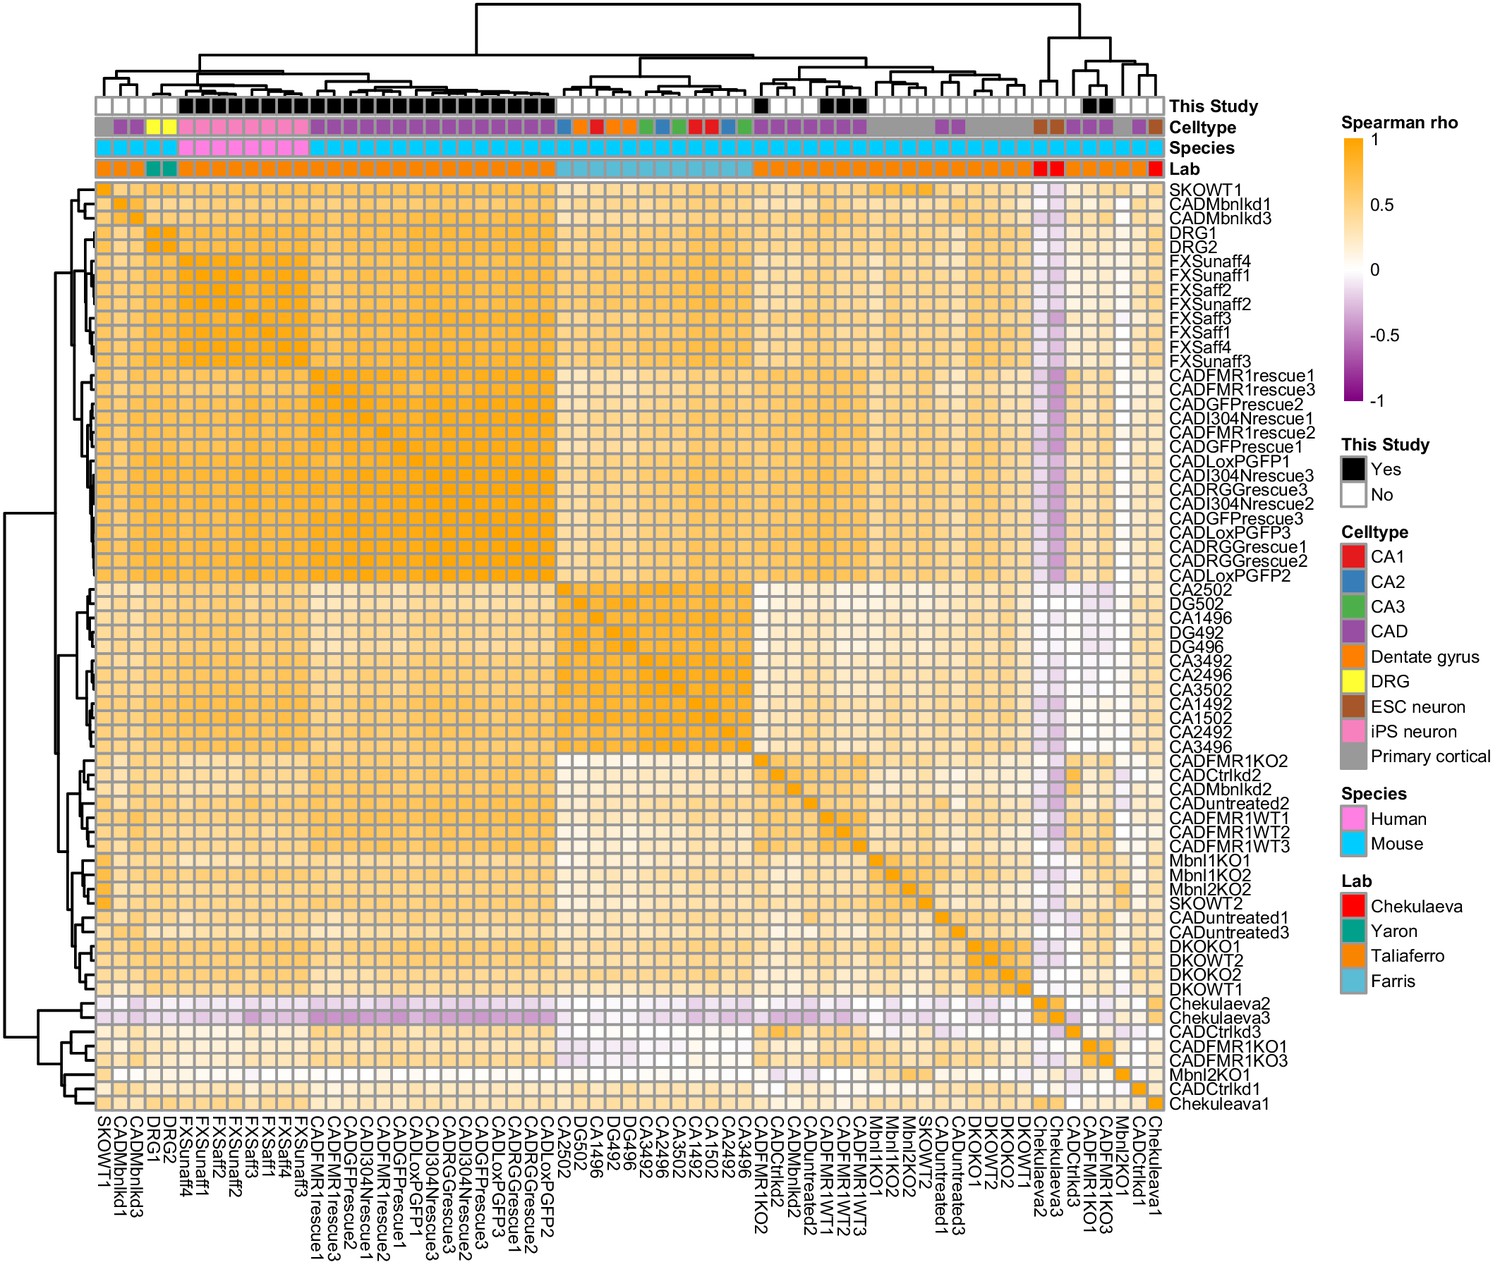
Clustering of LR values from 65 neuronal subcellular transcriptomic experiments.
Figure 1—figure supplement 7
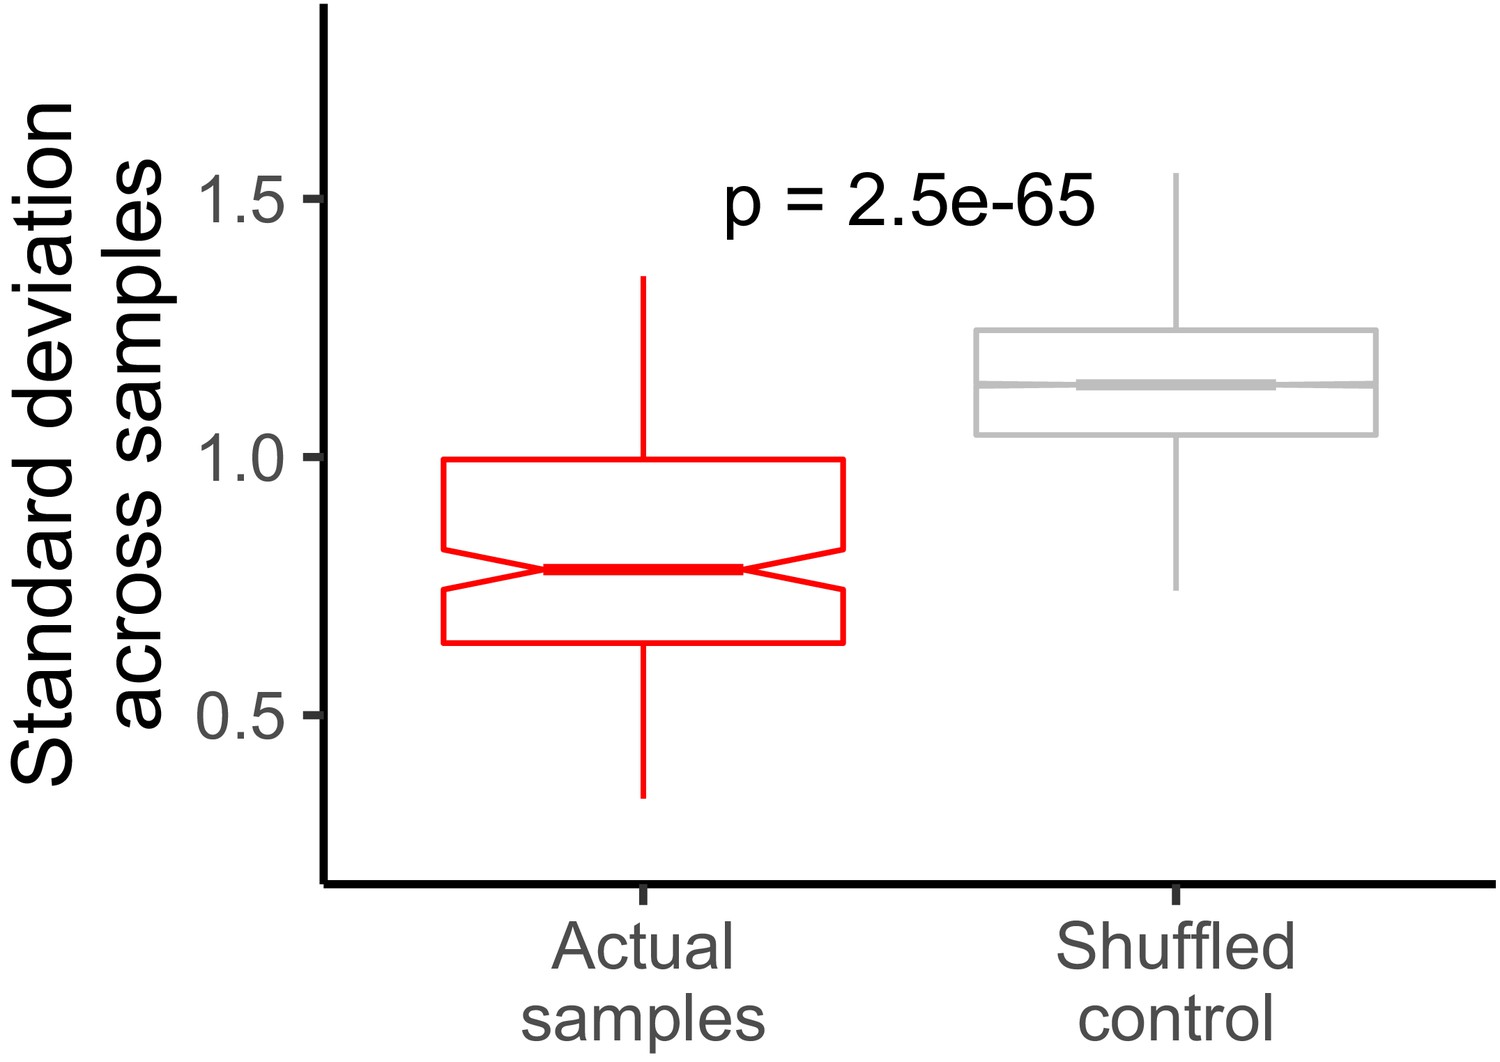
Standard deviation of LR values for each gene across all samples.
The control distribution was constructed by shuffling gene/LR relationships. The P value was calculated using a Wilcoxon rank-sum test.
Figure 1—figure supplement 8
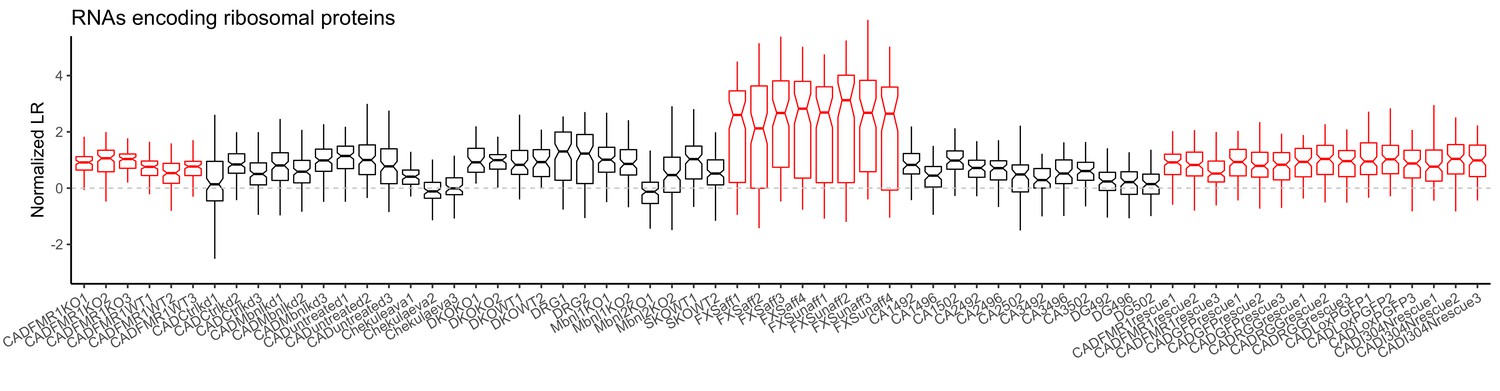
LR values for genes encoding ribosomal proteins for all samples.
Red samples are those generated in the current study.
Figure 1—figure supplement 9
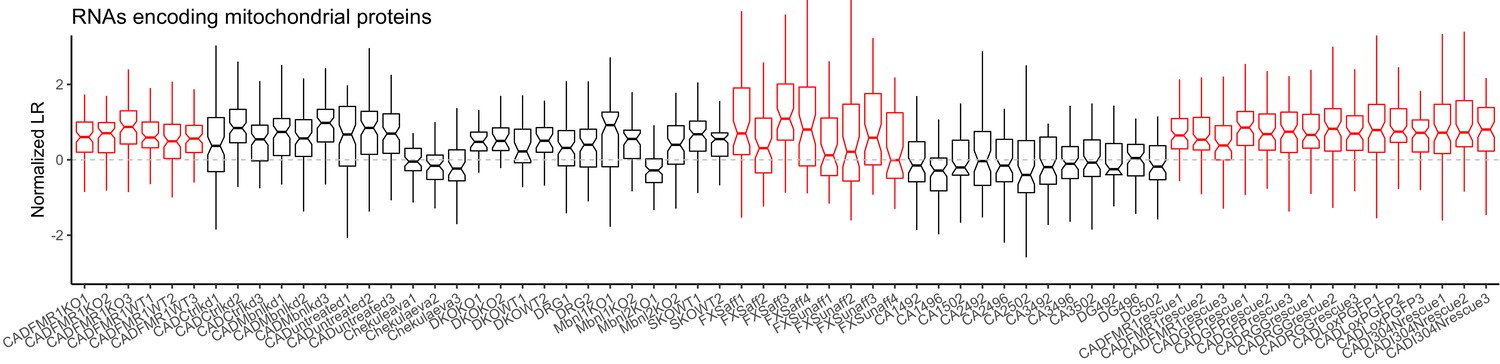
LR values for genes encoding members of the electron transport chain for all samples.
Red samples are those generated in the current study.
Figure 1—figure supplement 10
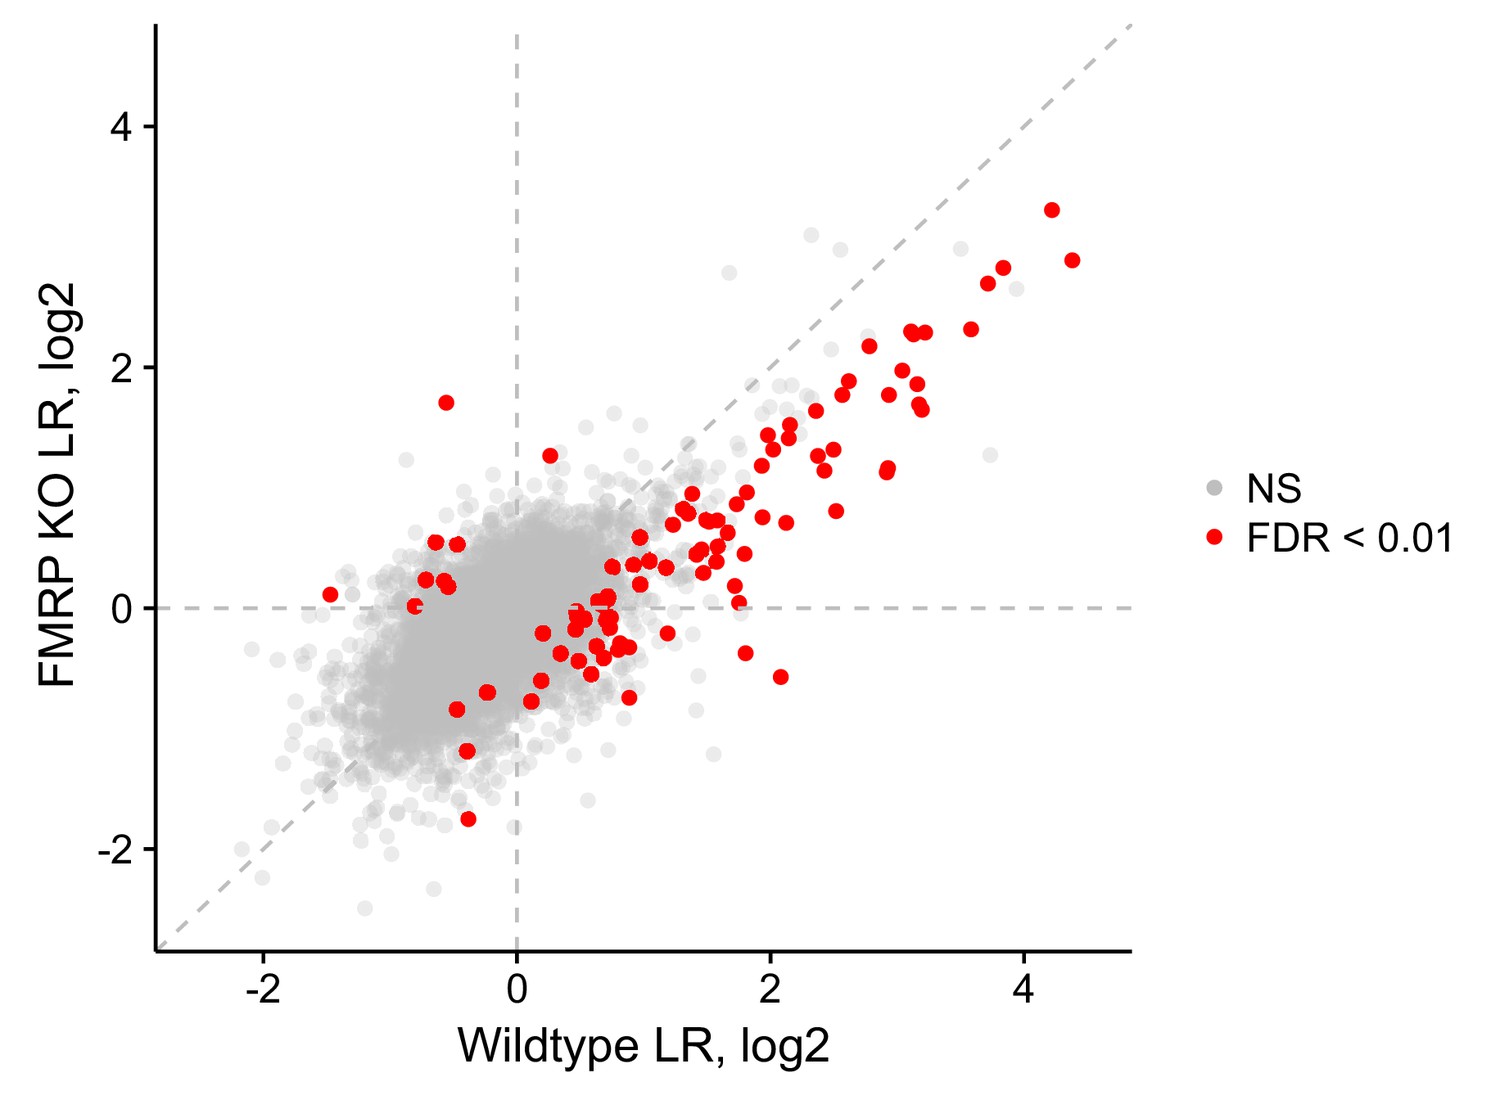
LR values for genes in wildtype and FMRP null cells.
Those that met an FDR cutoff of 0.01, as determined by Xtail, are shown in red.
Figure 1—figure supplement 11
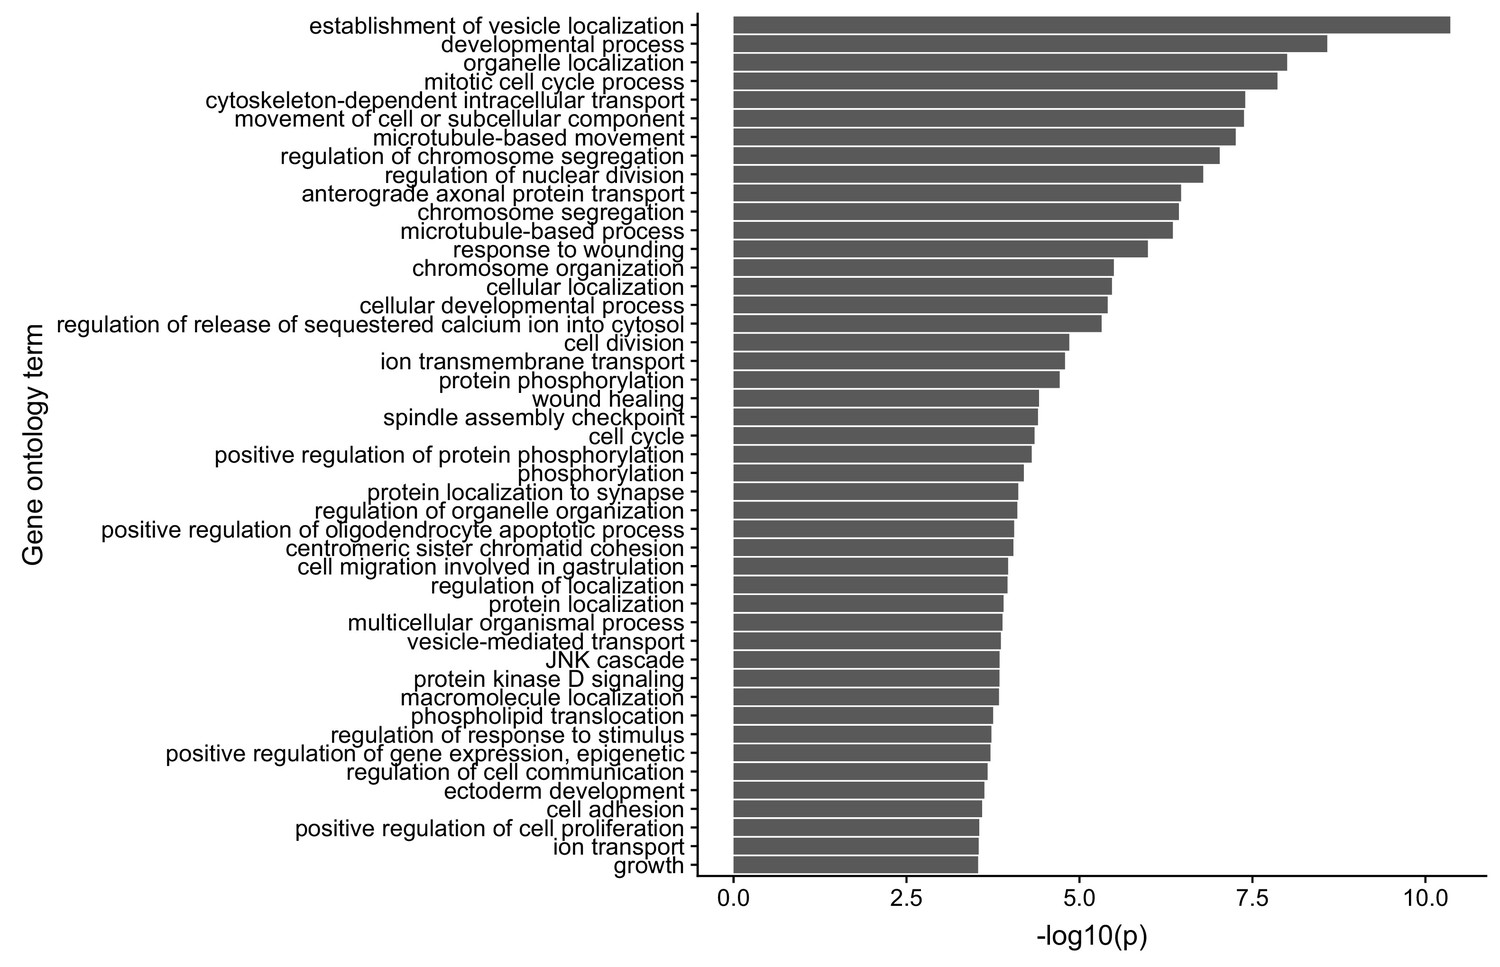
Gene ontology enrichments for genes with reduced neurite localization in FMRP knockout CAD cells.
Figure 2 with 10 supplements
Identification of transcript features associated with the regulation of localization by FMRP.
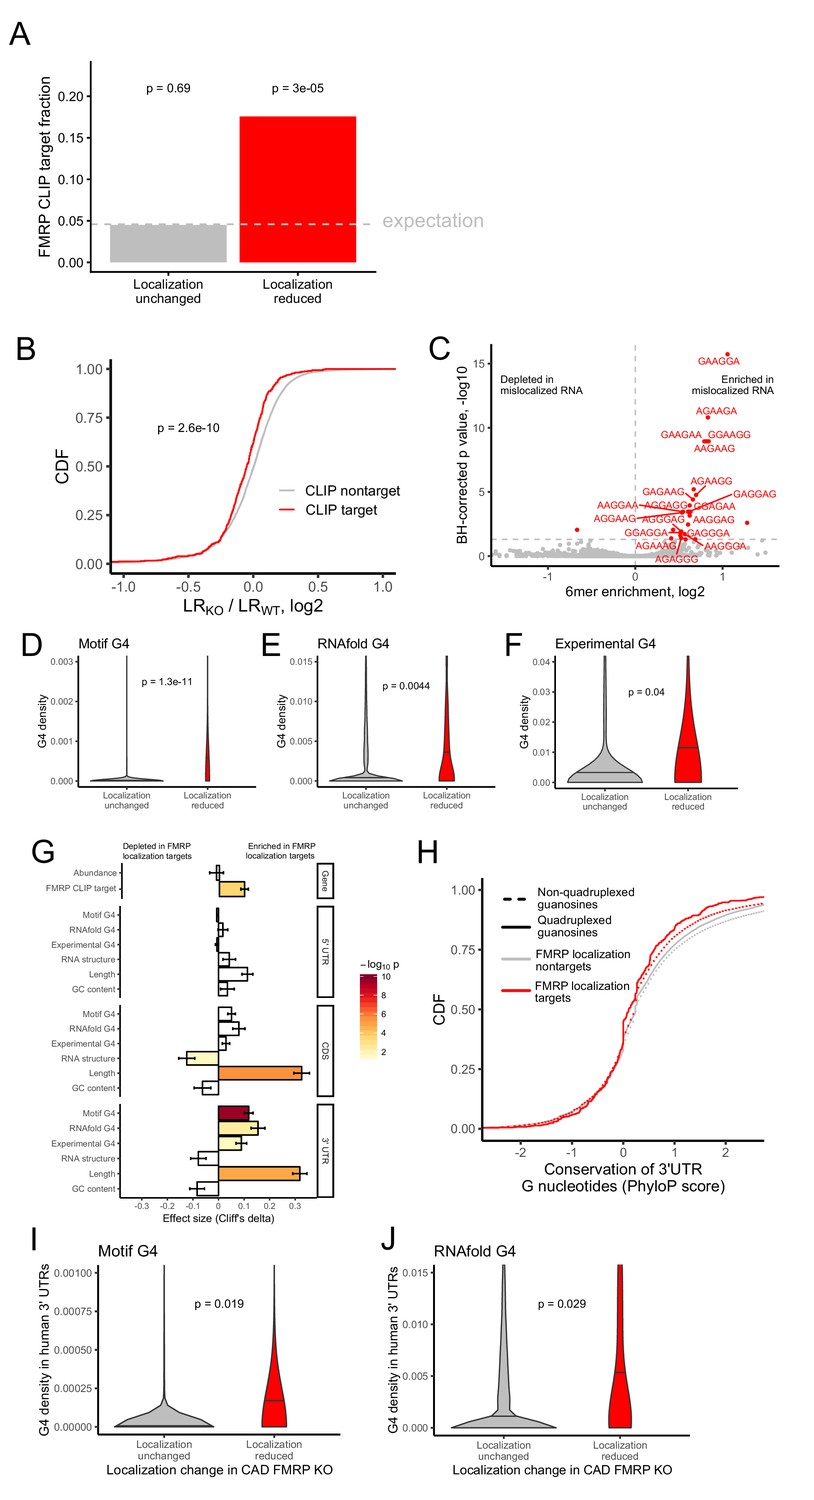
(A) Fraction of FMRP localization targets (red) and nontargets (gray) that were previously identified as directly bound by FMRP in cells. FMRP-bound RNAs were defined as the intersection between three previously published datasets (Ascano et al., 2012; Darnell et al., 2011; Maurin et al., 2018). The null, expected fraction is represented by a gray dotted line. P values were calculated using a binomial test. (B) Change in RNA localization (knockout - wildtype) for RNAs identified as CLIP targets (red) and CLIP nontargets (gray). P values were calculated using a Wilcoxon rank-sum test. (C) Sixmer enrichments in the 3′ UTRs of FMRP localization targets vs nontargets. Significantly enriched 6mers (BH-adjusted p<0.05, Fisher’s exact test) are represented in red. (D-F) G-quadruplex sequence densities in the 3′ UTRs of FMRP localization targets (red) and nontargets (gray). P values are calculated using a Wilcoxon rank-sum test. In (D), G-quadruplex sequences were defined by a regular expression that contained four WGGA sequences separated by linkers of length 0–7 nt. Values represent sequence matches per nt. In (E), RNAfold was used to identify G-quadruplex sequences. Values represent the number of guanosine residues participating in quadruplex sequences per nt. In (F), experimentally defined G-quadruplex sequences were used. Values represent the number of basepairs that overlap with an experimentally defined G-quadruplex sequence per nt of UTR sequence. (G) Effect sizes and significance of the relationships between transcript features and whether or not a transcript’s localization was regulated by FMRP. (H) Conservation of guanosine residues in 3′ UTRs as defined by PhyloP scores. Guanosines were separated based on whether or not they were predicted by RNAfold to participate in quadruplexes and by whether or not they were contained in FMRP localization targets. (I) G-quadruplex sequence density in the 3′ UTRs of the human orthologs of FMRP targets. G-quadruplexes were defined by the regular expression used in (D), and values represent quadruplex sequences per nt. (J) G-quadruplex sequence density in the 3′ UTRs of the human orthologs of FMRP targets. G-quadruplex sequences were defined by RNAfold as in (E), and values represent the number of guanosine residues participating in quadruplex sequences per nt.
Figure 2—figure supplement 1
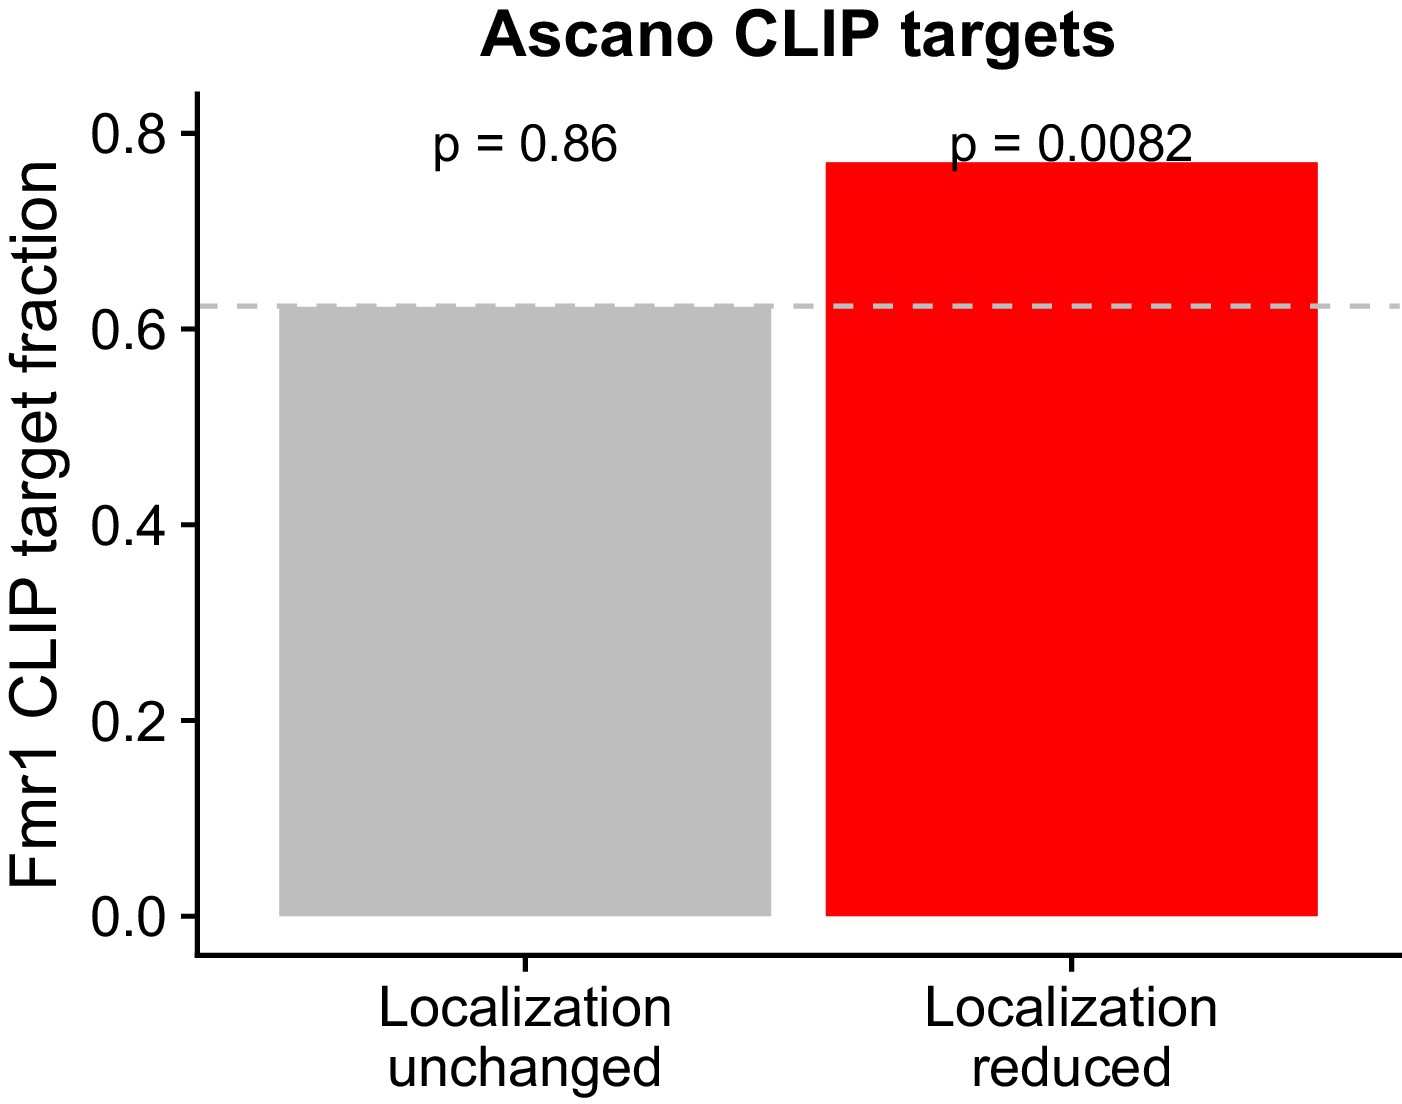
Overlap between FMRP functional localization targets and FMRP CLIP-seq targets as identified in Ascano et al.
P values were calculated using a binomial test.
Figure 2—figure supplement 2
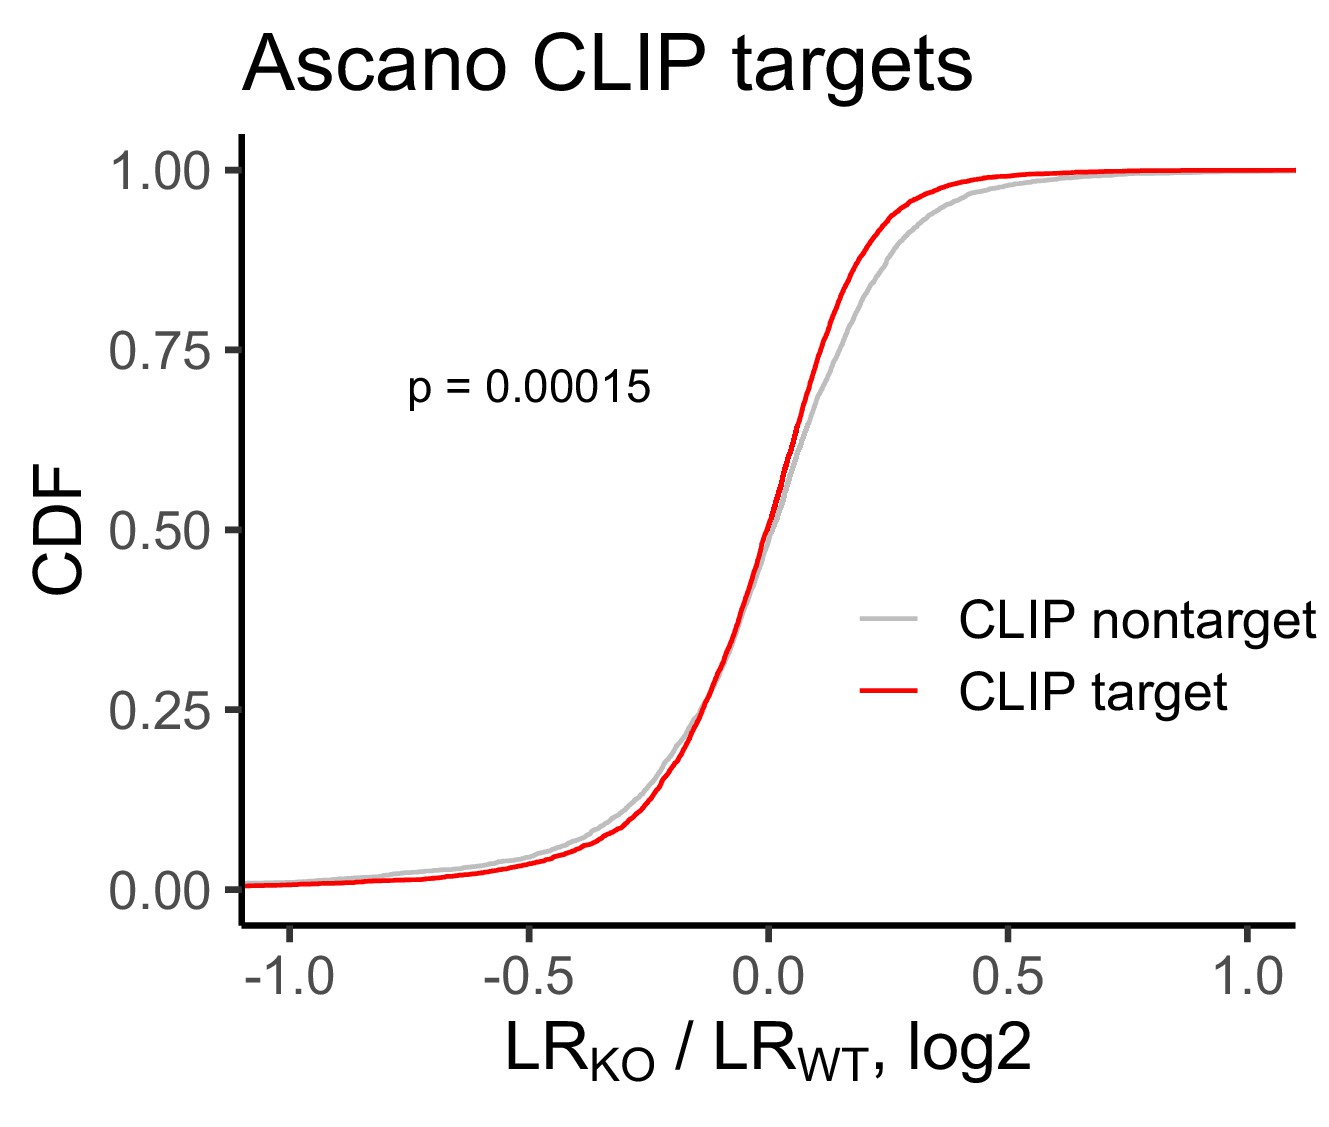
Change in RNA localization in FMRP knockout cells compared to wildtype for FMRP CLIP-seq targets (red) and non-targets (gray) as identified by Ascano et al.
P values were calculated using a Wilcoxon rank-sum test.
Figure 2—figure supplement 3
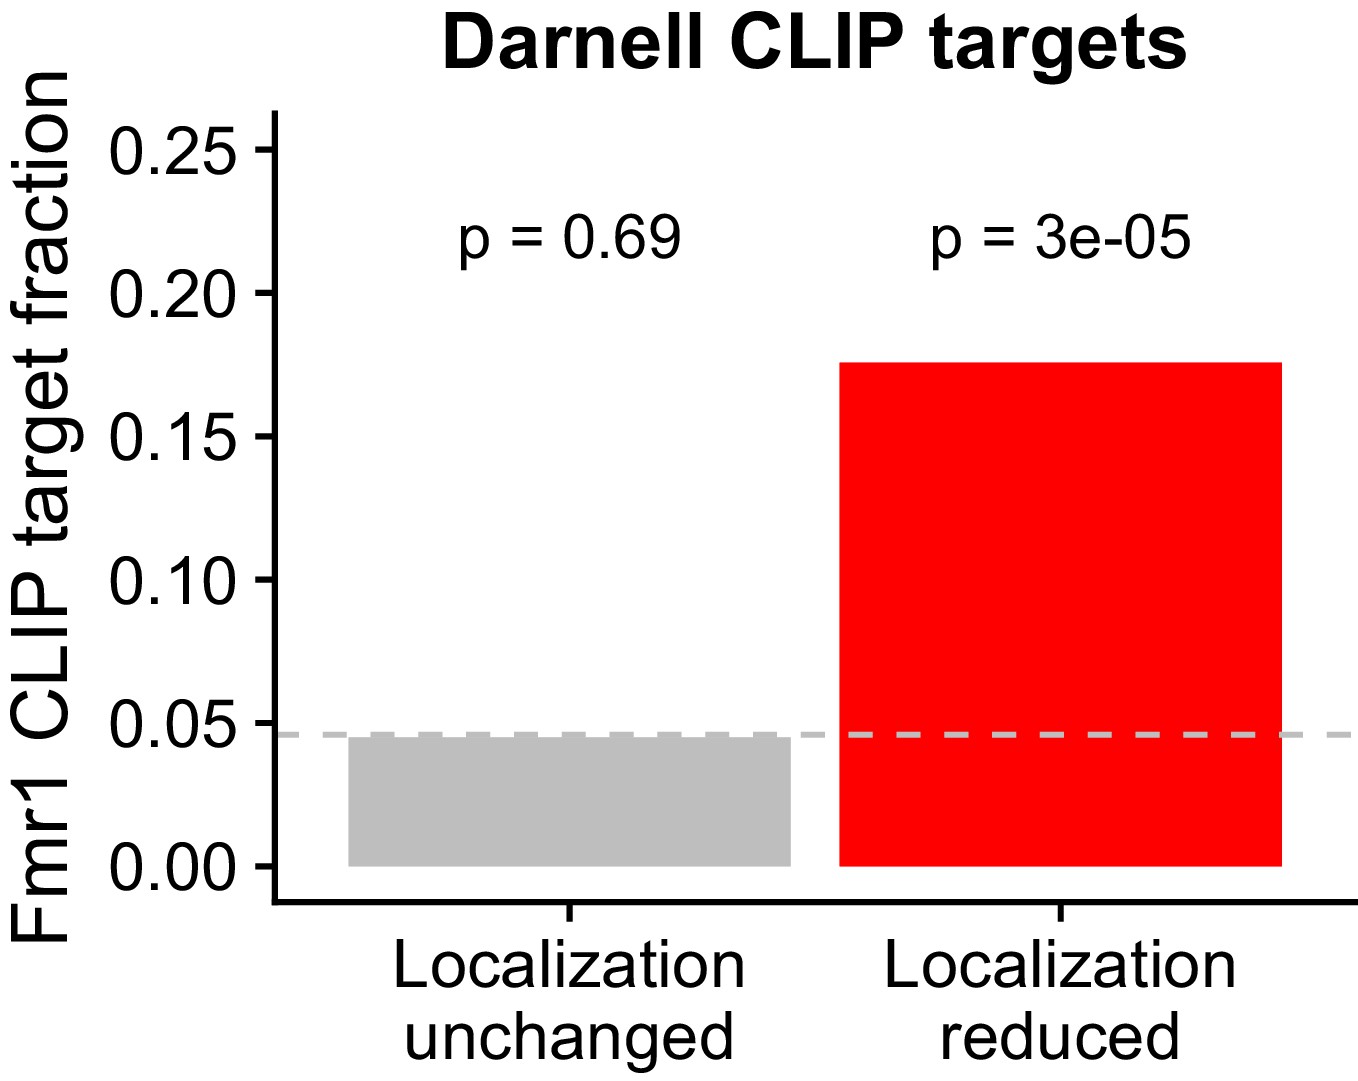
Overlap between FMRP functional localization targets and FMRP CLIP-seq targets as identified in Darnell et al.
P values were calculated using a binomial test.
Figure 2—figure supplement 4
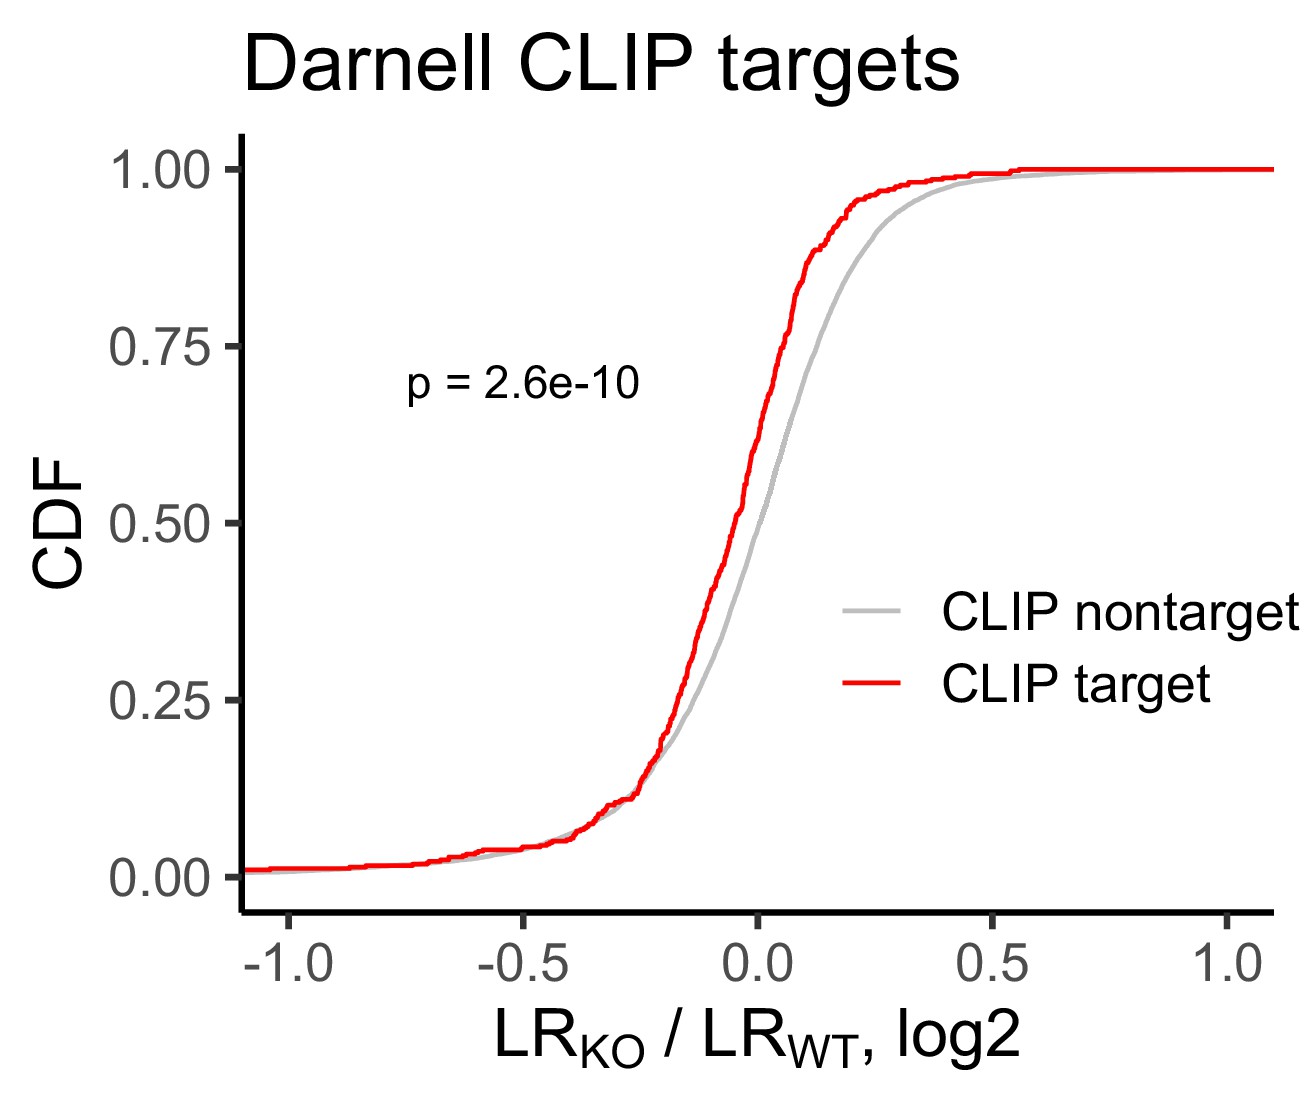
Change in RNA localization in FMRP knockout cells compared to wildtype for FMRP CLIP-seq targets (red) and non-targets (gray) as identified by Darnell et al.
P values were calculated using a Wilcoxon rank-sum test.
Figure 2—figure supplement 5
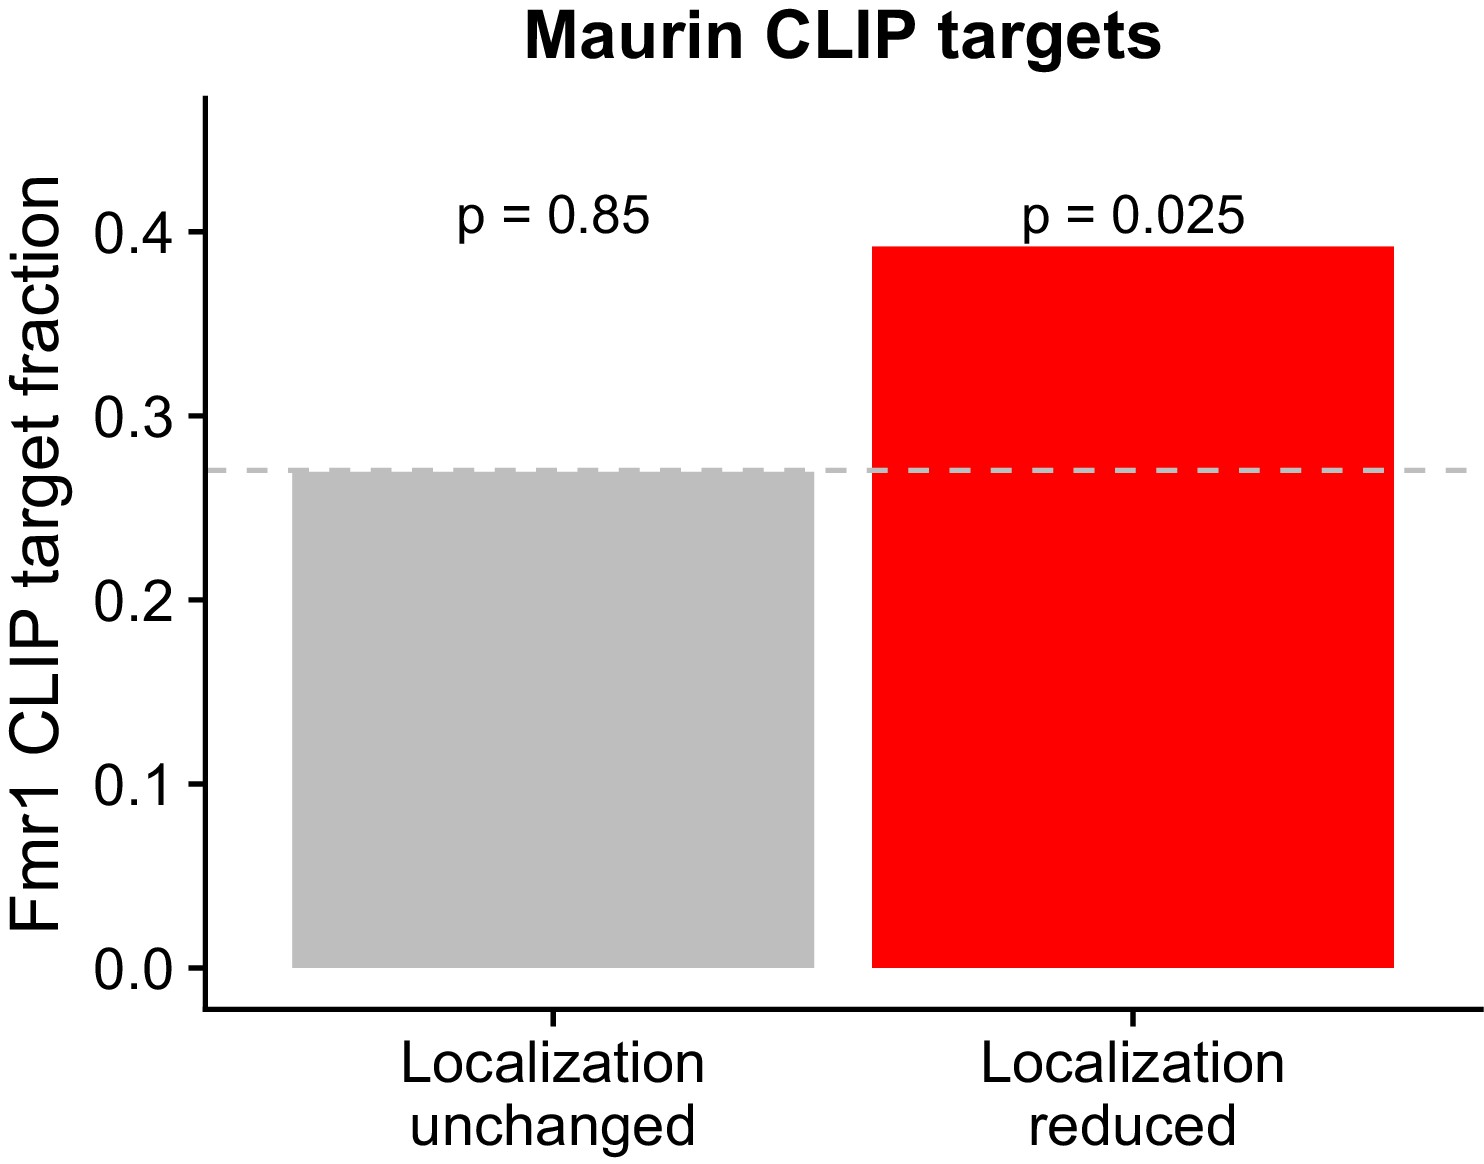
Overlap between FMRP functional localization targets and FMRP CLIP-seq targets as identified in Maurin et al.
P values were calculated using a binomial test.
Figure 2—figure supplement 6
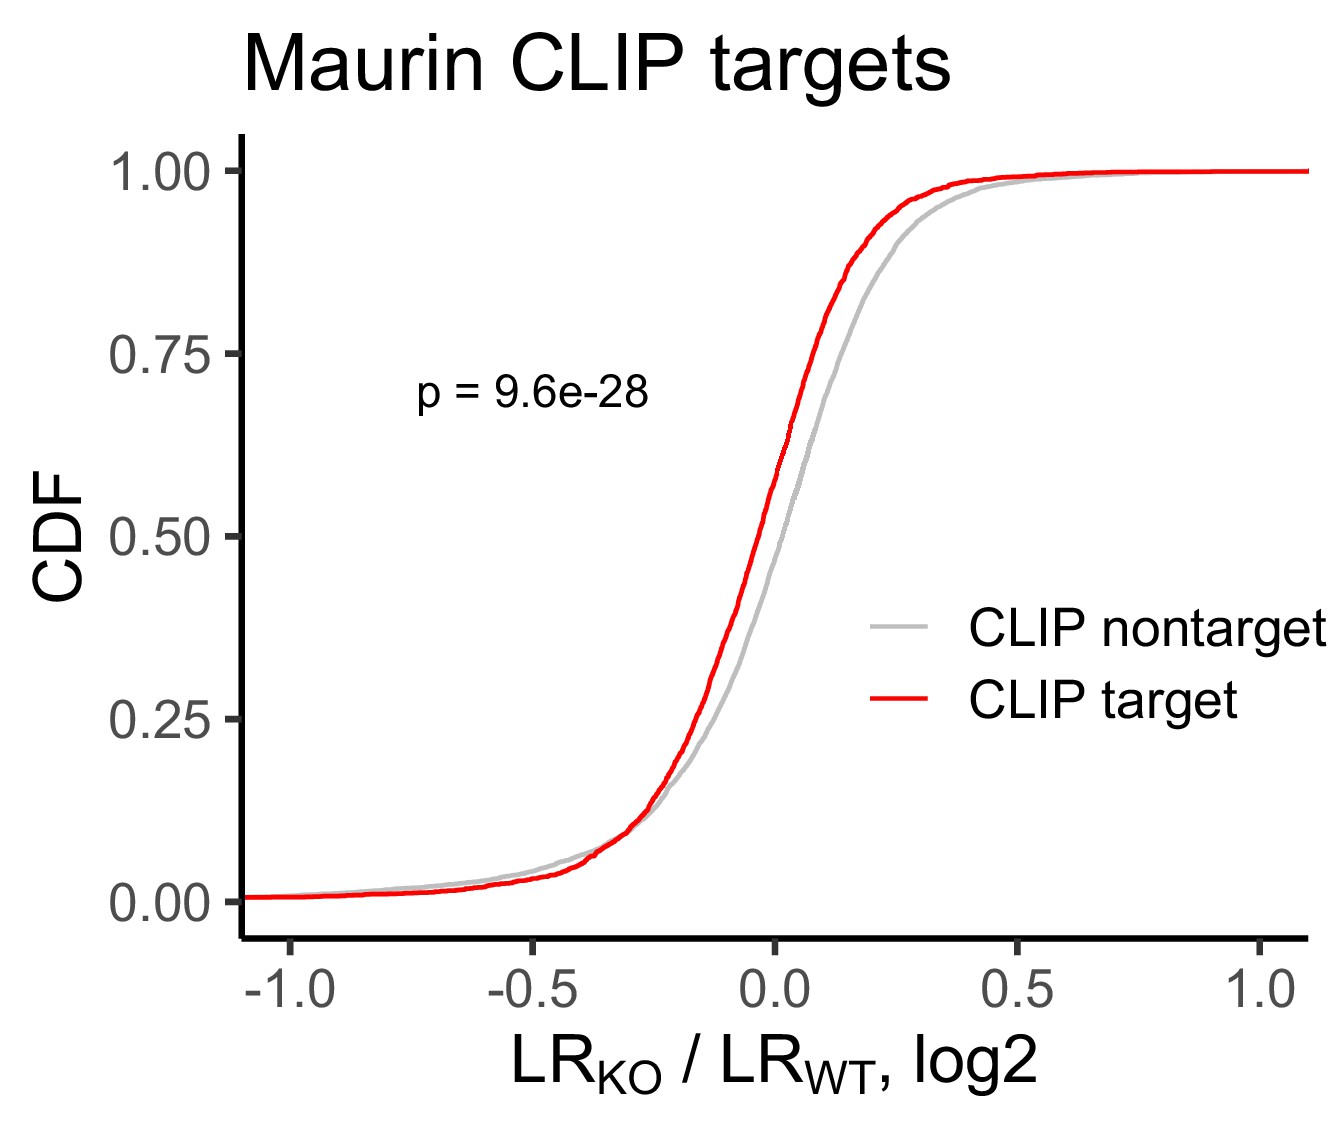
Change in RNA localization in FMRP knockout cells compared to wildtype for FMRP CLIP-seq targets (red) and non-targets (gray) as identified by Maurin et al.
P values were calculated using a Wilcoxon rank-sum test.
Figure 2—figure supplement 7
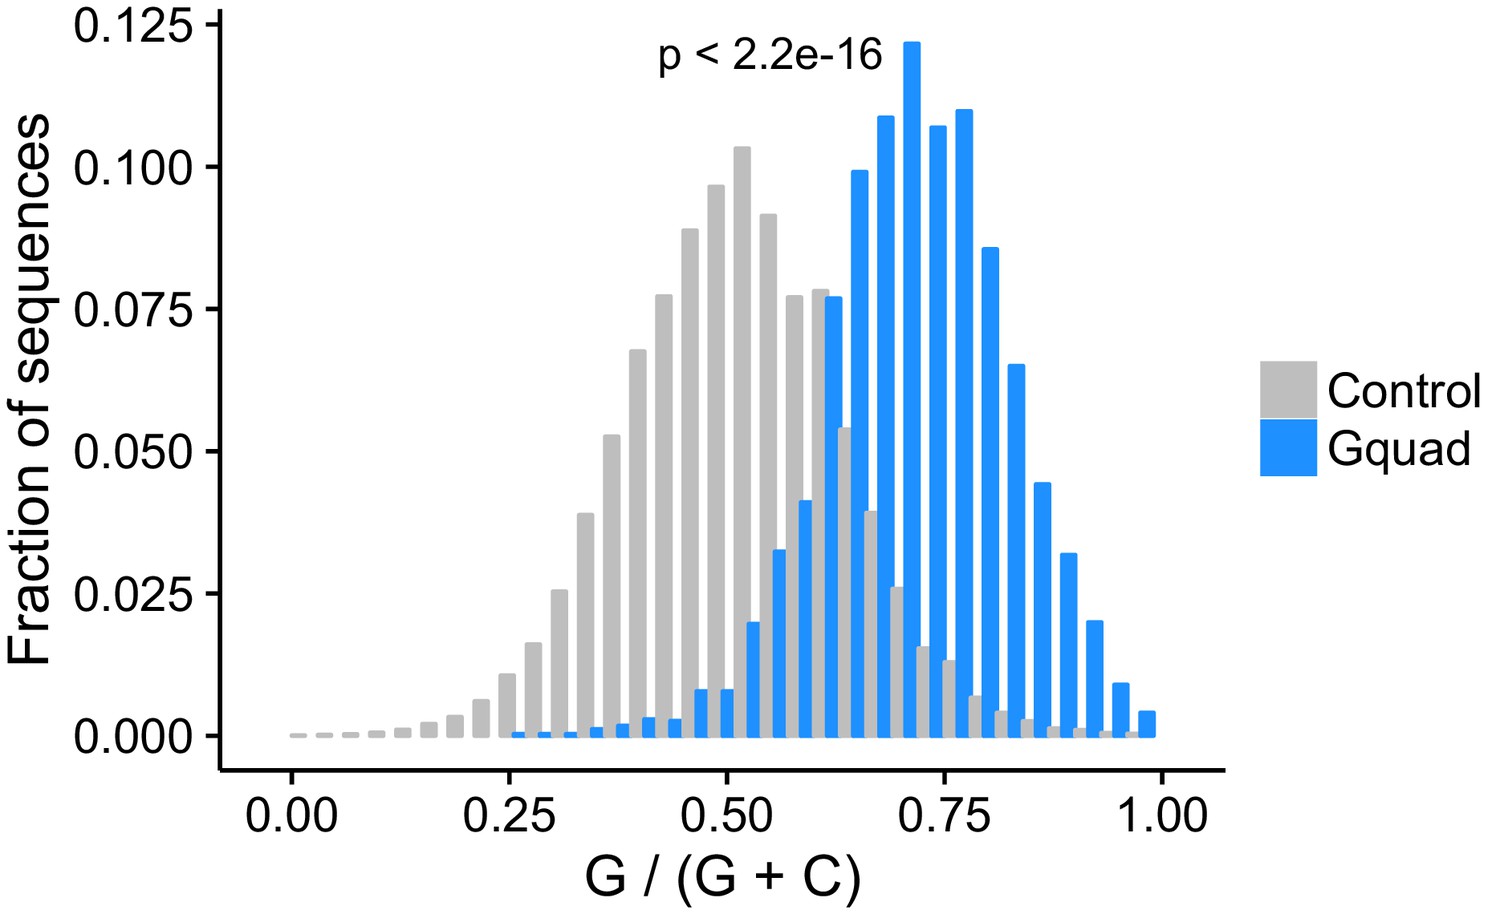
Experimentally-defined G-quadruplex sequences contain more guanosine residues than control sequences drawn from the same genes.
Figure 2—figure supplement 8
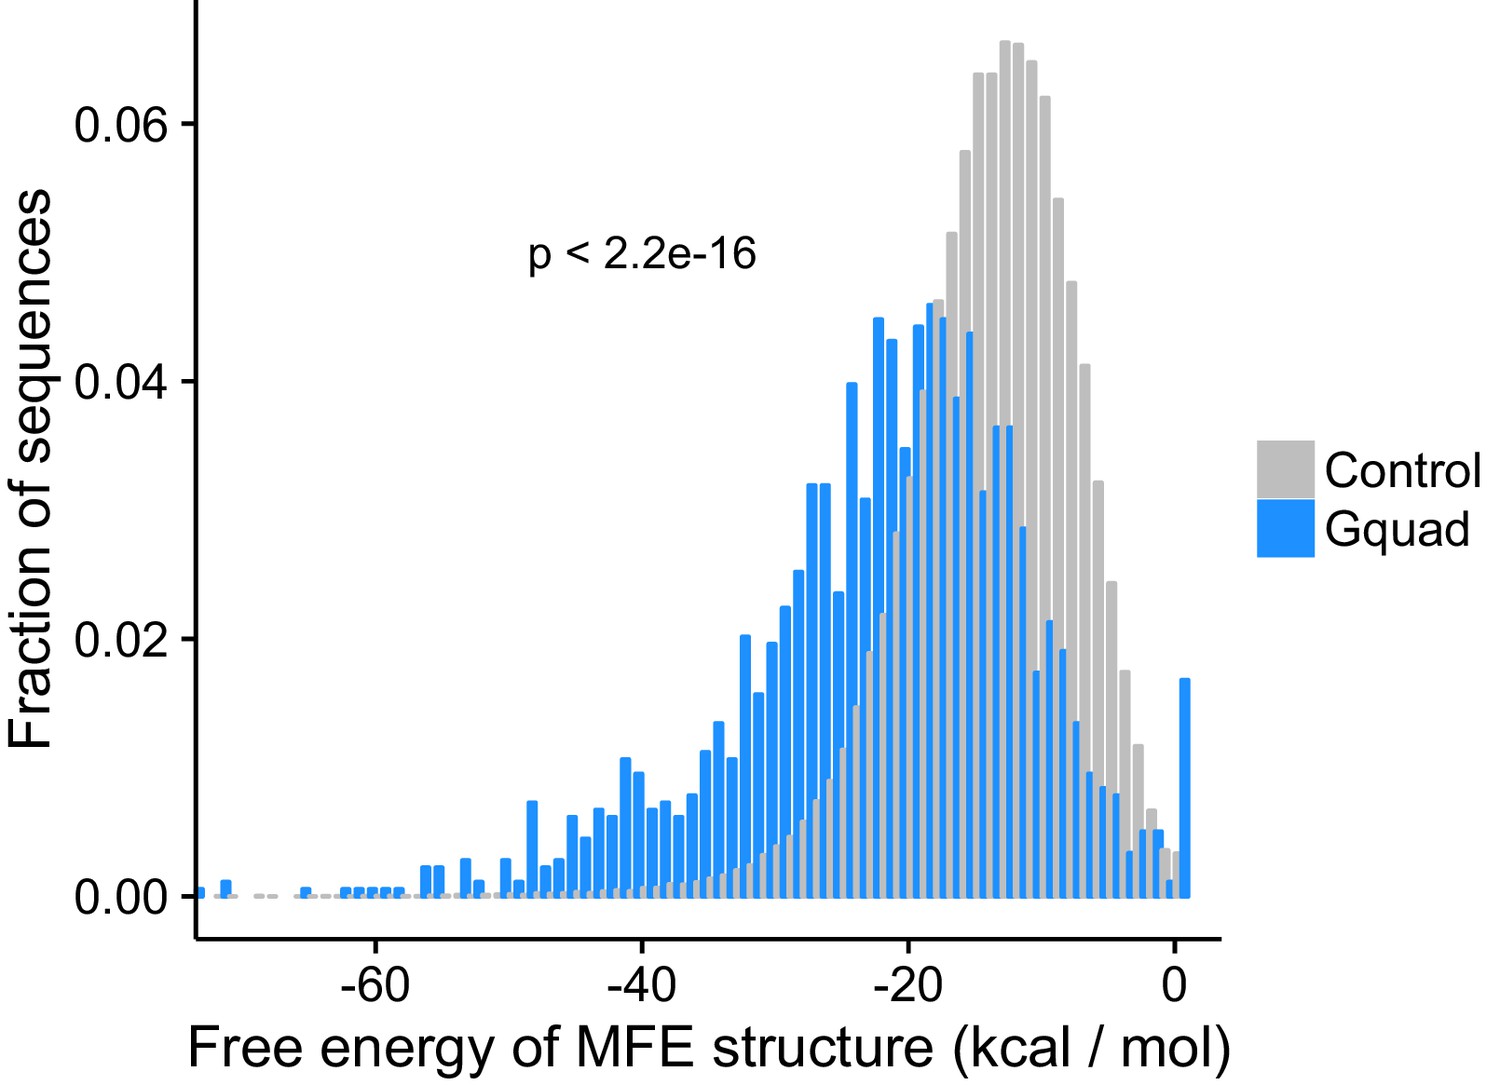
Minimum free energy structures calculated using RNAfold show the G-quadruplex structures are significantly more stable than control sequences drawn from the same genes.
Figure 2—figure supplement 9
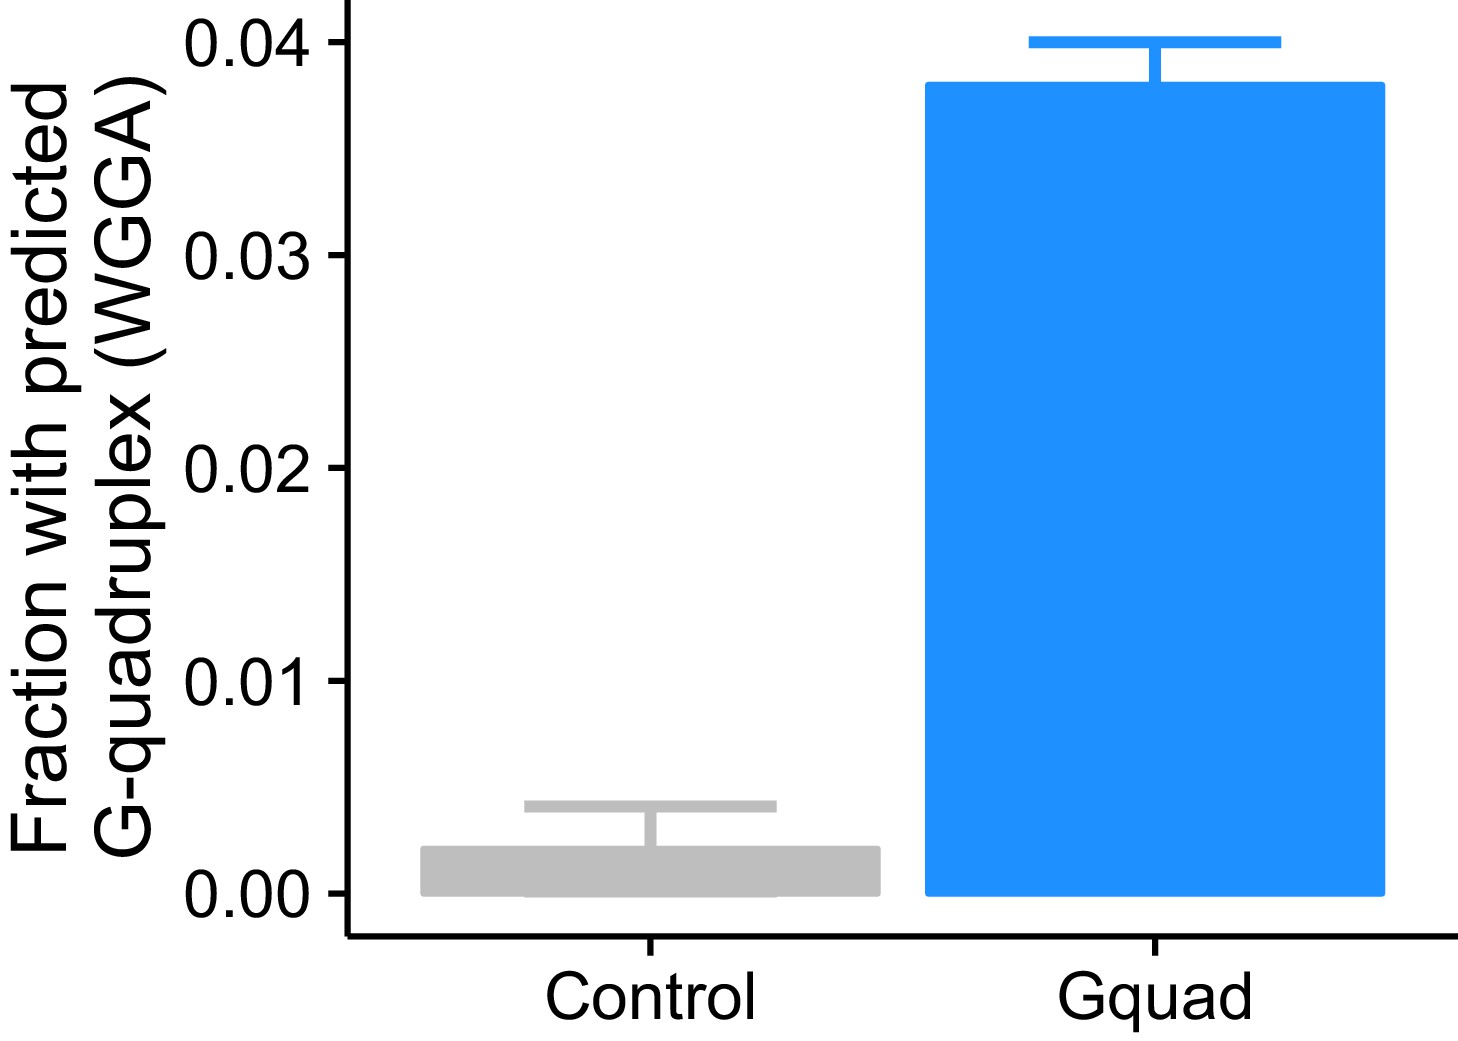
Experimentally defined G-quadruplex sequences contain many more regular expression-defined G-quadruplex sequences than controls.
Figure 2—figure supplement 10
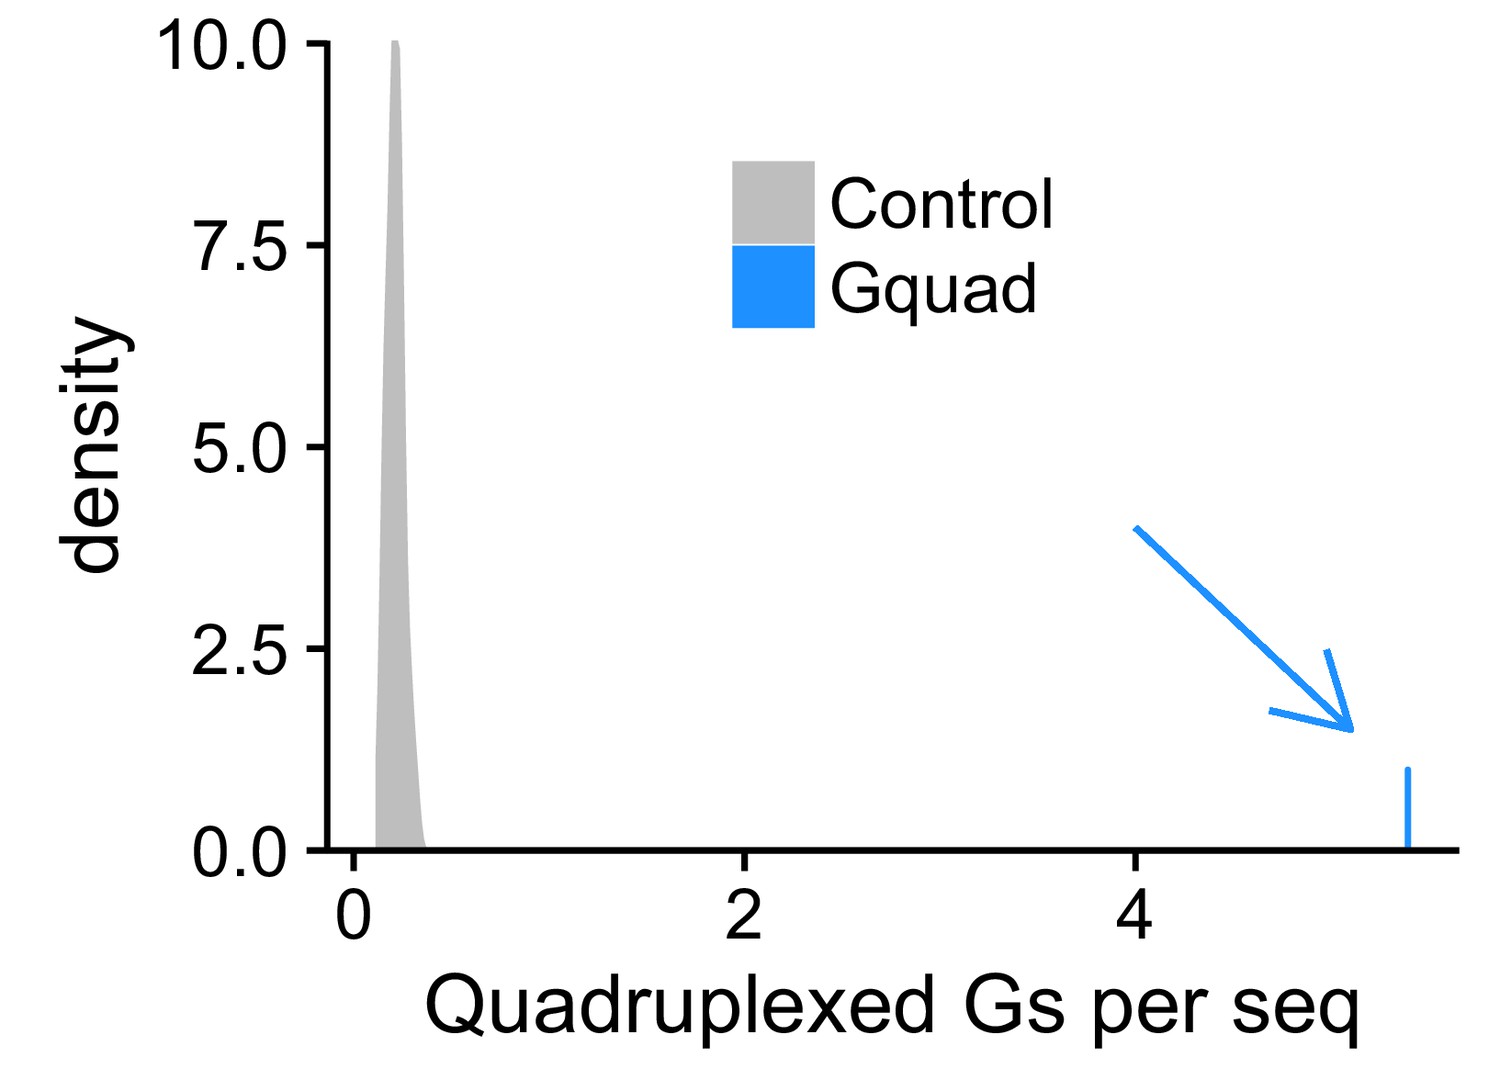
Experimentally defined G-quadruplex sequences contain many more RNAfold-defined quadruplexed guanosine residues than control sequences.
Figure 3 with 6 supplements
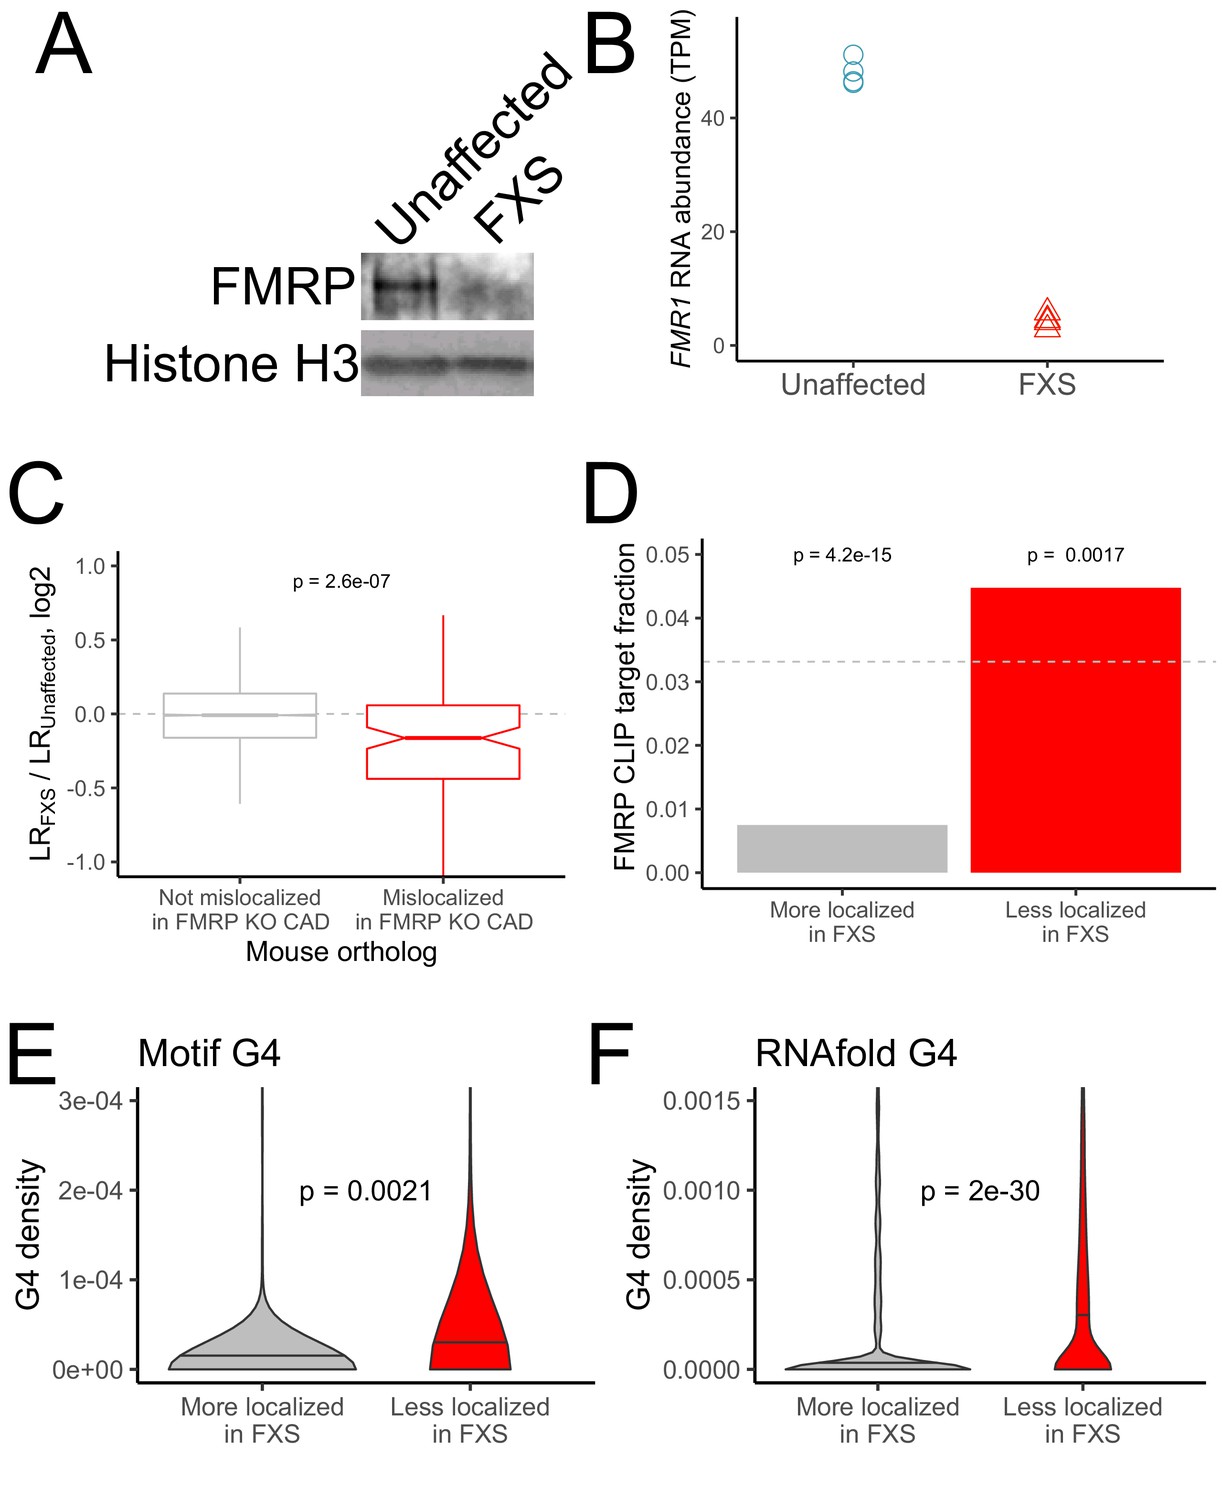
RNA mislocalization in FXS neurons.
(A) FMRP protein expression in motor neurons differentiated from iPS cells derived from unaffected and FXS patients. (B) FMR1 transcript abundance in motor neurons differentiated from iPS cells derived from unaffected and FXS patients. (C) Relative LR values comparing unaffected and FXS motor neurons. Human genes were binned based on whether or not their mouse orthologs were defined as FMRP localization targets (red) or nontargets (gray) in mouse CAD cells. (D) Fraction of human FMRP localization targets (red) and nontargets (gray), as defined in iPS-derived motor neurons, that were previously identified as bound by FMRP in cells (Ascano et al., 2012; Darnell et al., 2011). The null, expected fraction is represented by a gray dotted line (E-F) G-quadruplex densities in the 3′ UTRs of human FMRP localization targets (red) and nontargets (gray) as defined using a regular expression (E) and RNAfold (F). Y-axis values depict densities as in Figure 2C and D. P values were calculated using a Wilcoxon rank-sum test.
Figure 3—figure supplement 1
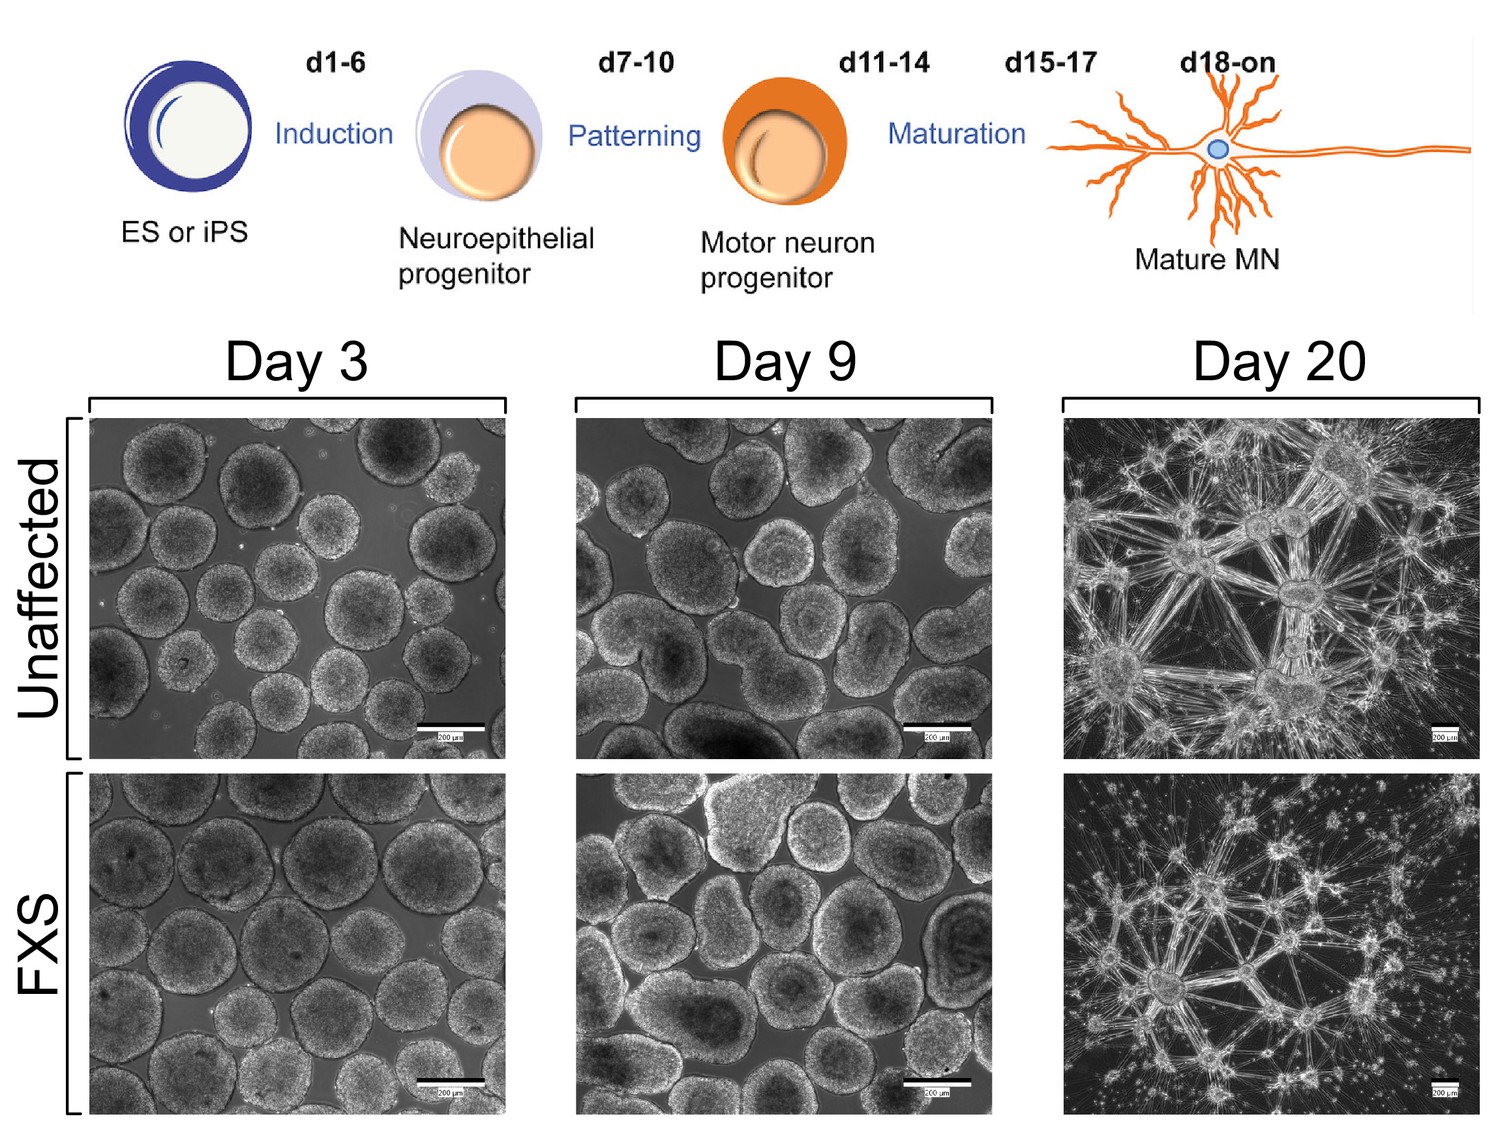
Schematic overview of motor neuron differentiation (top) and representative cell images (bottom).
Figure 3—figure supplement 2
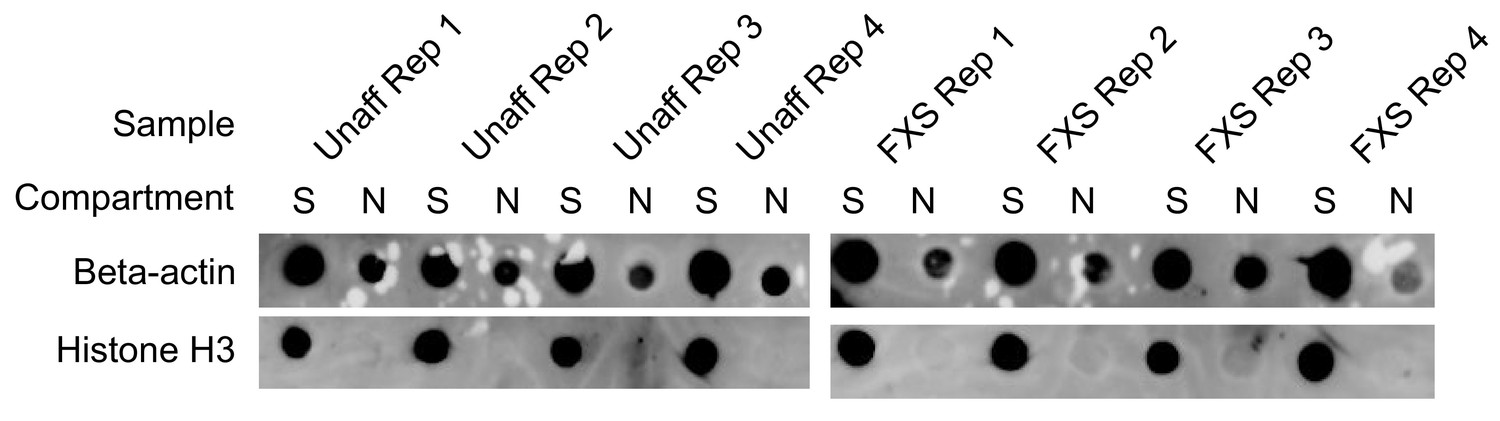
Protein dot blot assaying the efficiency of motor neuron fractionations.
Beta-actin is a marker of both soma (S) and neurite (N) fractions while Histone H3, being restricted to the nucleus, is a marker of soma fractions.
Figure 3—figure supplement 3
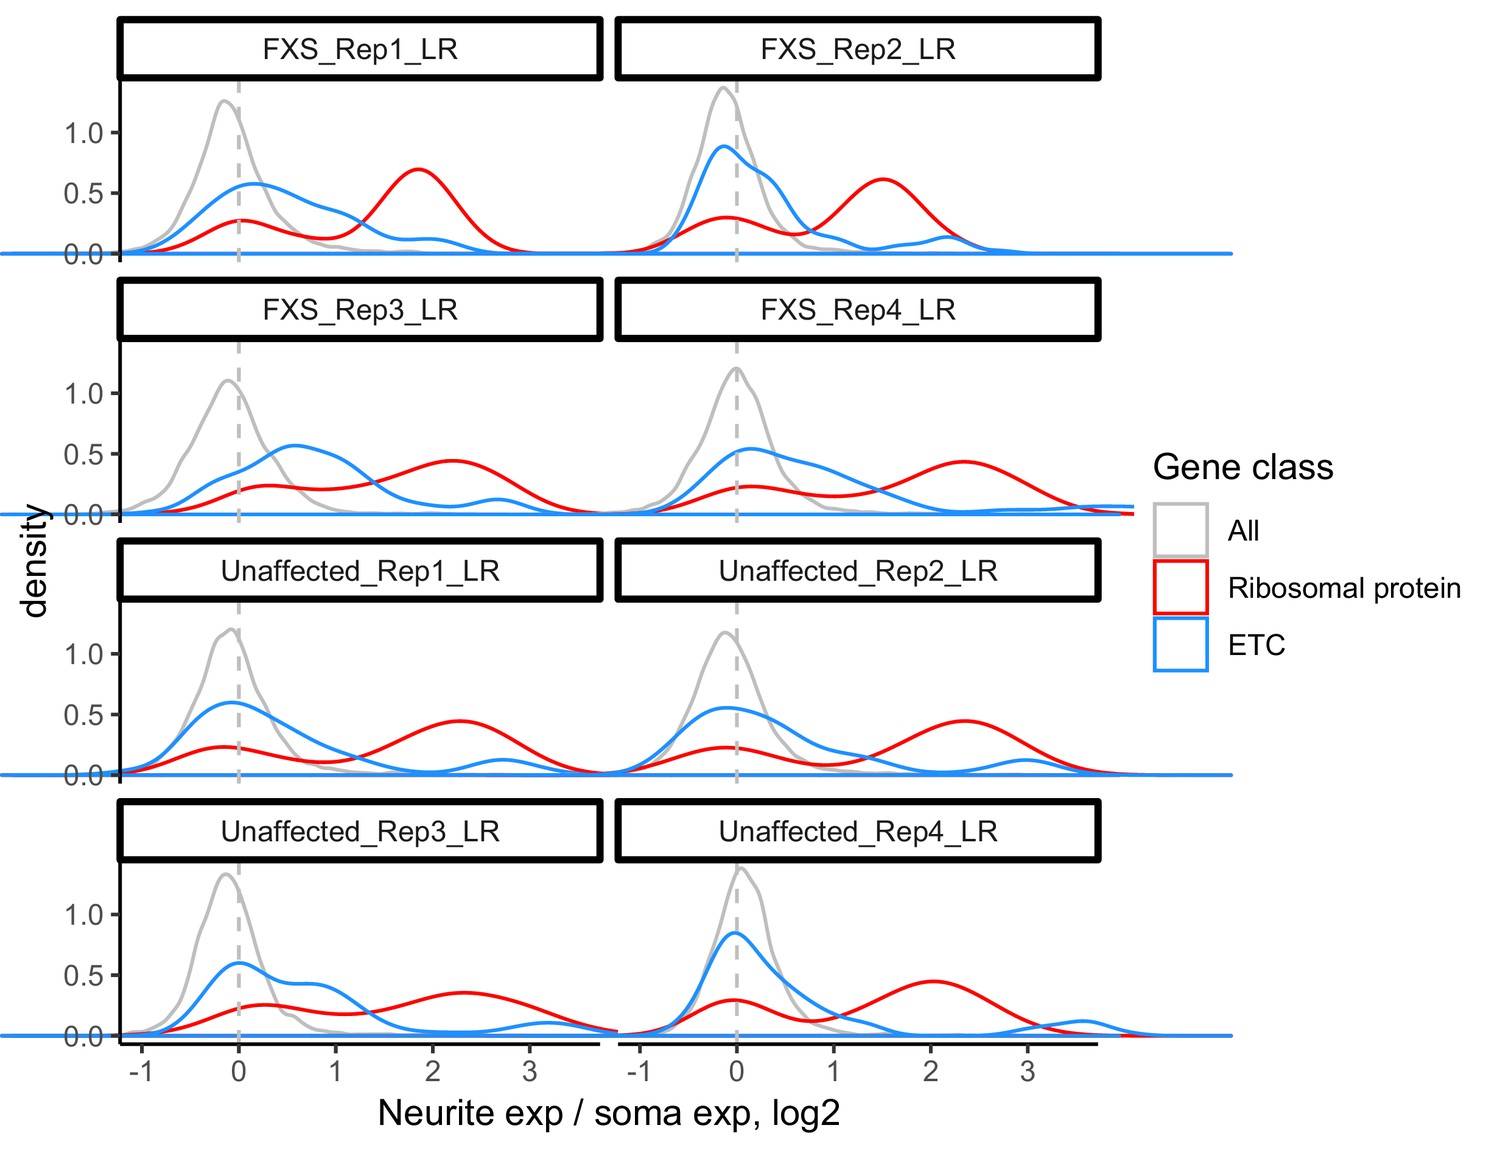
LR values for all genes (gray), ribosomal protein genes (red), and genes that are part of the electron transport chain (blue).
Figure 3—figure supplement 4
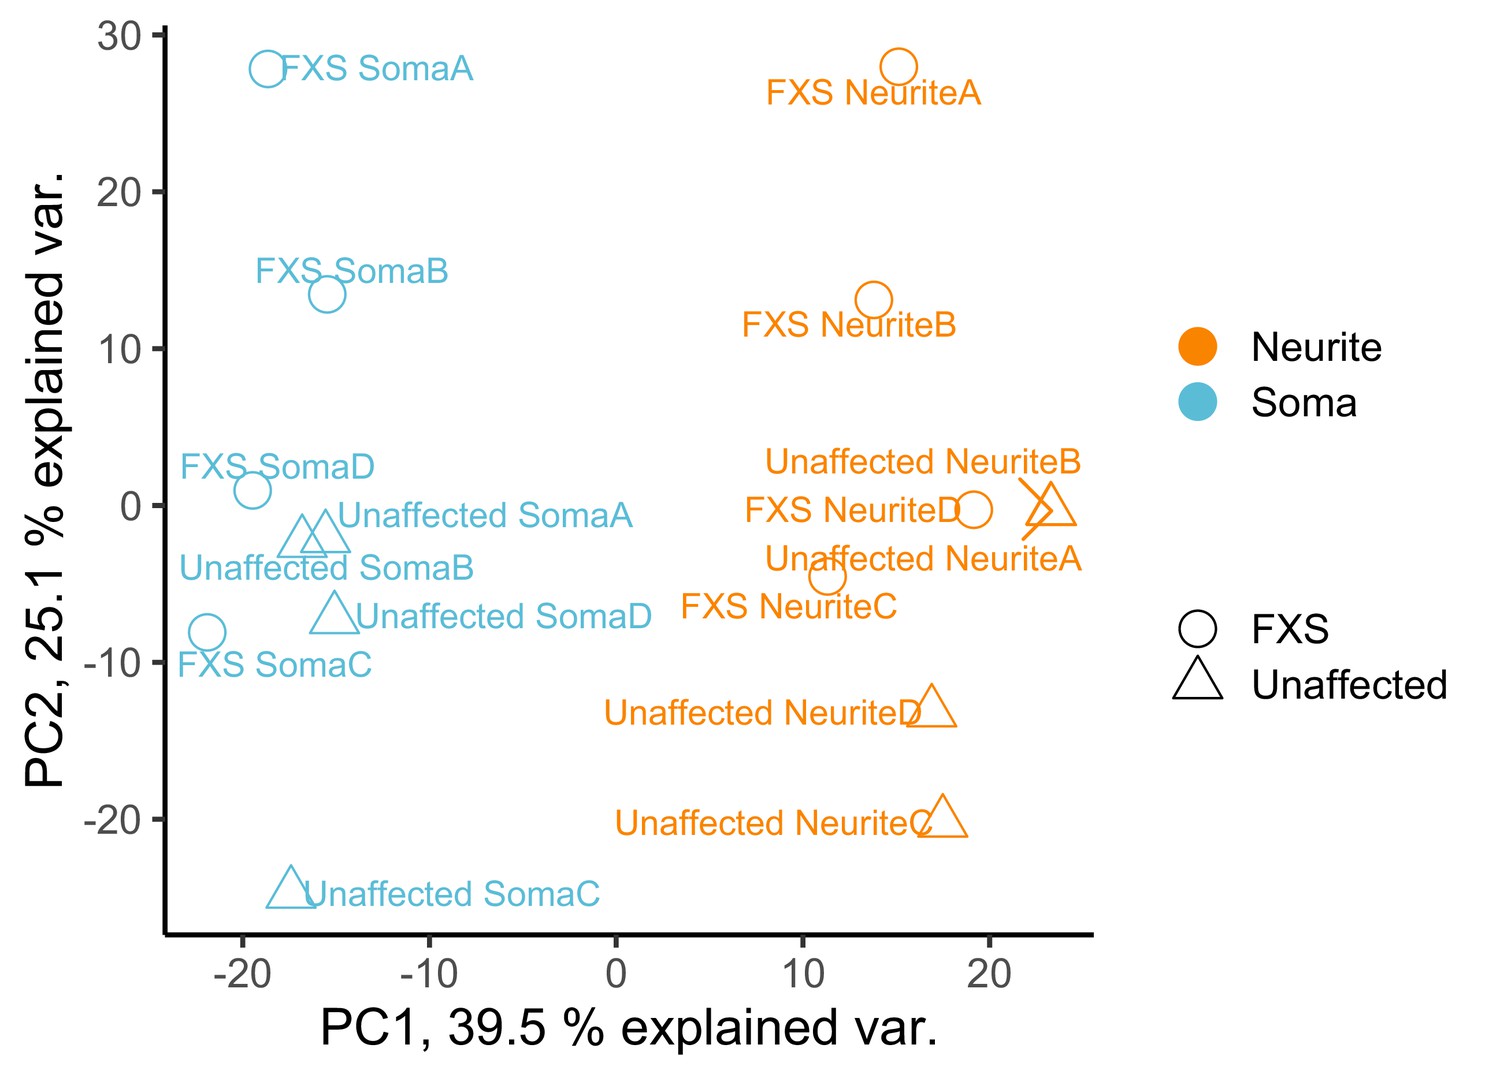
PCA analysis of gene expression values from the soma and neurite compartments of wildtype and FXS motor neurons.
Figure 3—figure supplement 5
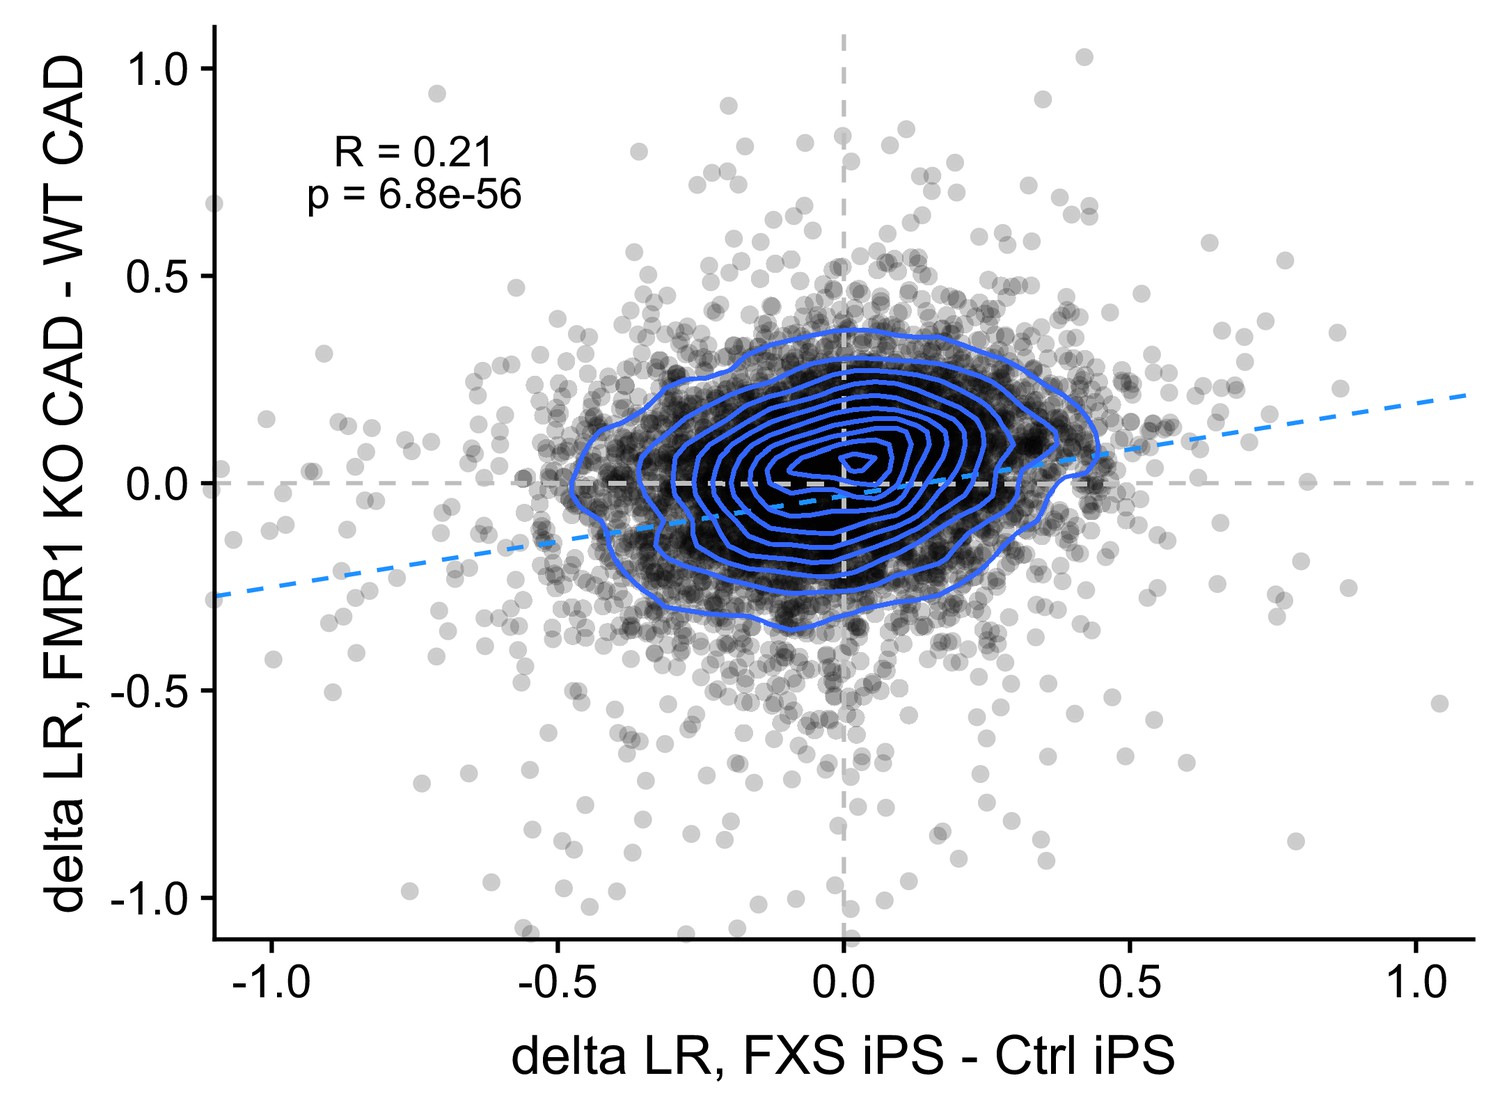
Correlation between FMRP-dependent changes in LR values observed in mouse (FMRP-null CAD - wildtype CAD) and human (FXS motor neurons - unaffected motor neurons) neuronal cells.
Figure 3—figure supplement 6
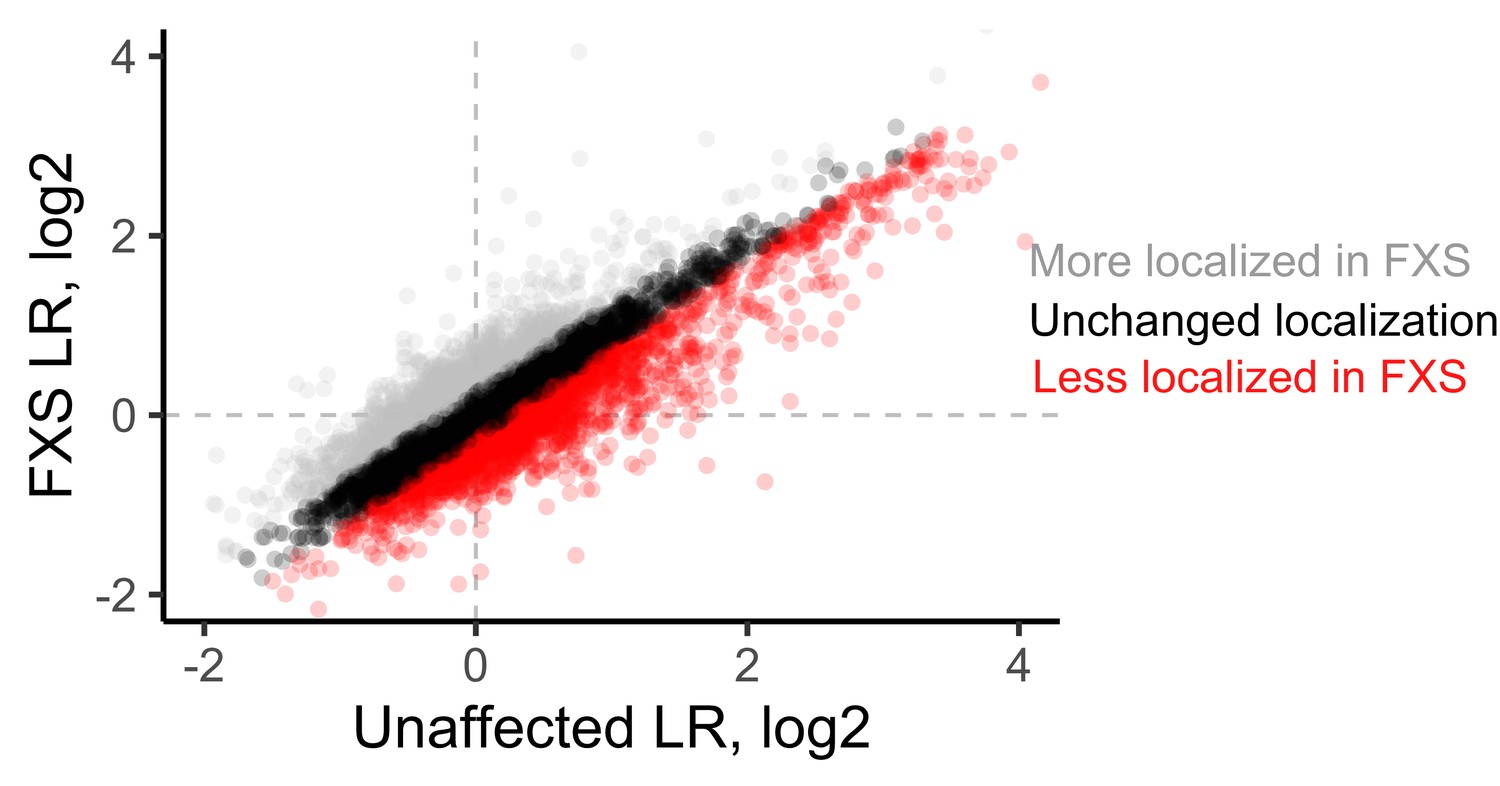
LR values for genes observed in unaffected and FXS motor neurons.
Genes whose log2 LR value changed by more than 0.25 were designated as either more localized in FXS (gray) or less localized in FXS (red).
Figure 4 with 1 supplement
RNA Bind-n-Seq (RBNS) of FMRP domains.
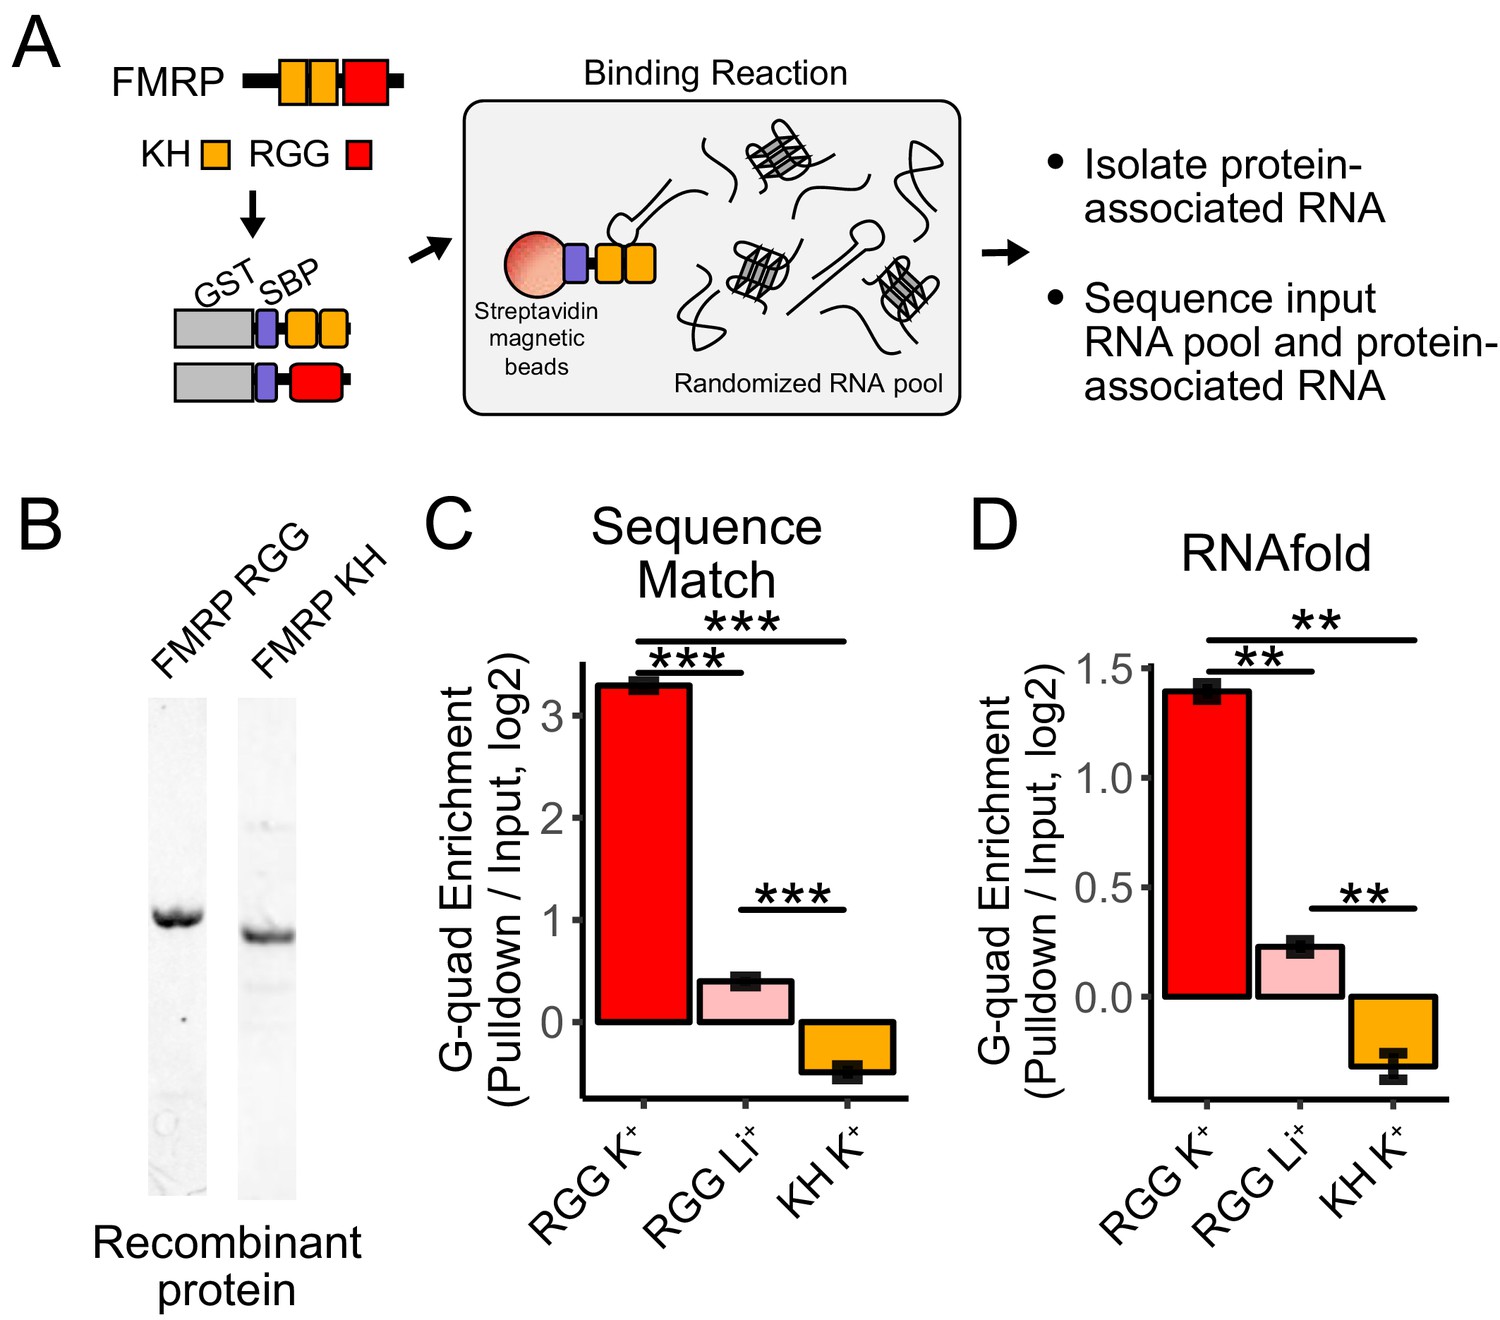
(A) Schematic representation of RBNS assay and domain architecture of FMRP. (B) Coomassie stain of purified recombinant FMRP fragments used for RBNS experiments. (C) Enrichments for G-quadruplex RNA sequence motifs in the protein-associated RNA relative to input RNA in the presence of potassium (red) and lithium (blue). Bars represent means of bootstrapped subsets. Error bars represent the standard deviation across subsets. (D) As in C, enrichments for G-quadruplex RNA sequences as predicted by computational RNA folding in protein-associated RNA relative to input RNA. Wilcoxon rank-sum p values < 0.01 are represented as (**), and p values less than 0.001 are represented as (***).
Figure 4—figure supplement 1
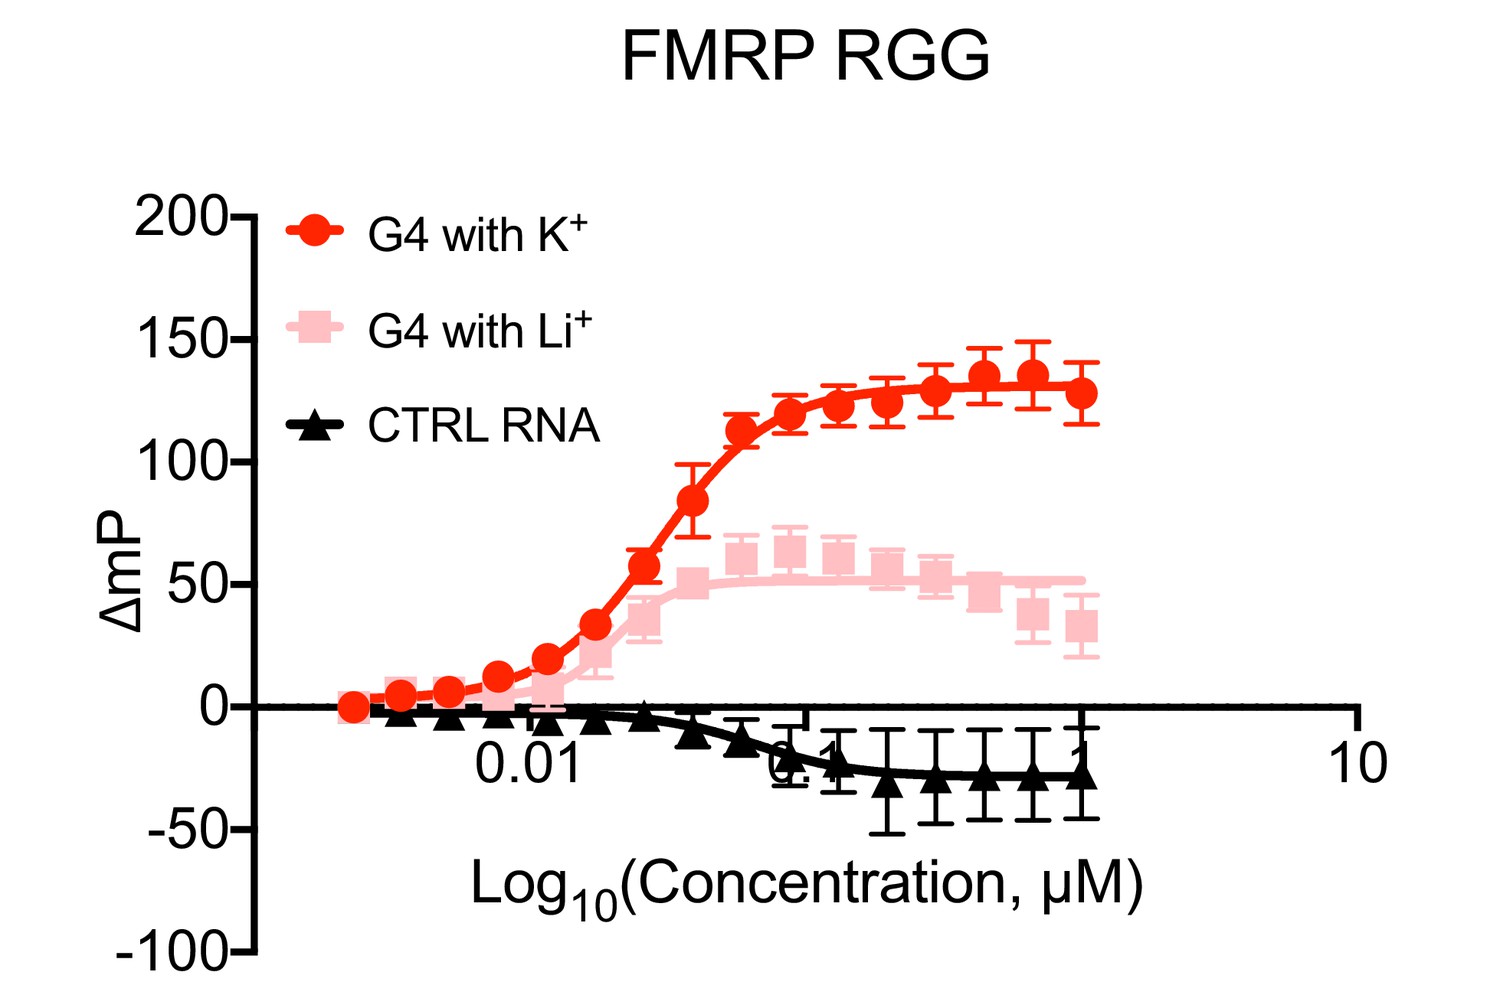
Fluorescence polarization values from FMRP RGG/RNA interaction assays.
Figure 5 with 2 supplements
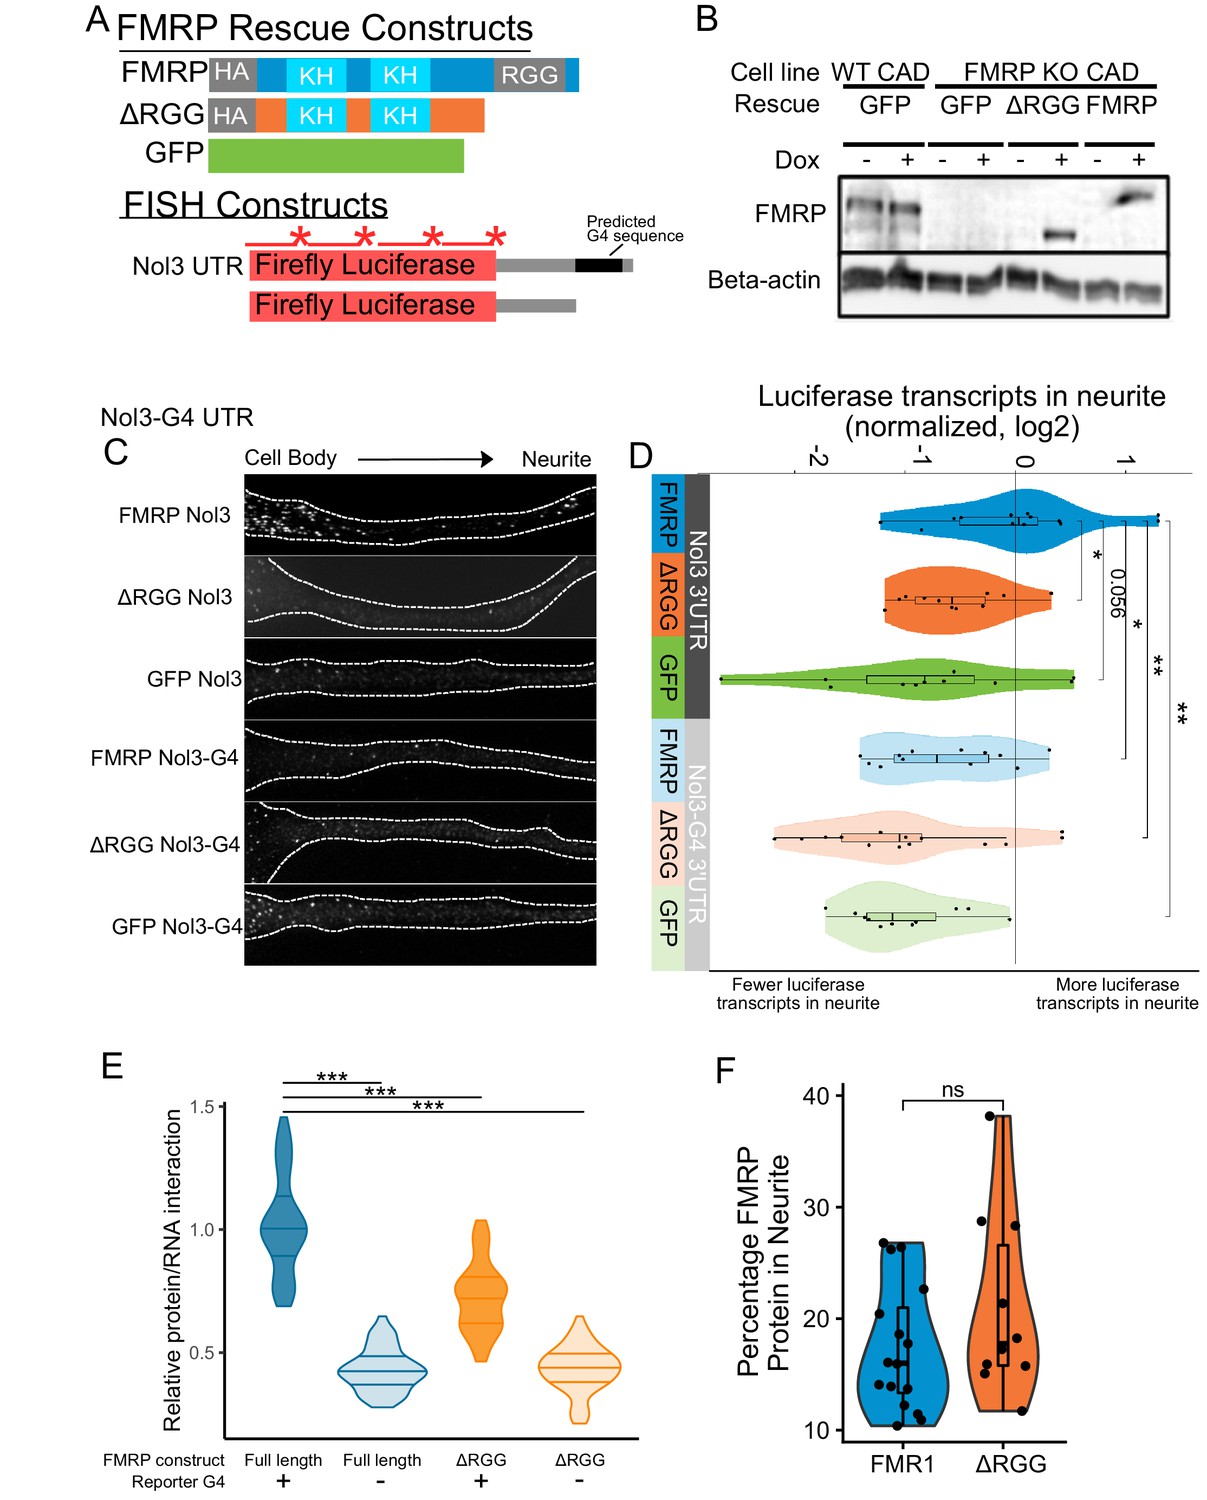
Efficient localization of a reporter transcript requires both a G-quadruplex sequence and the RGG domain of FMRP.
(A) FMRP rescue constructs and smFISH reporter constructs used. smFISH probes, represented by red bars with asterisks, hybridize to the ORF of both reporter constructs. (B) Expression of FMRP rescue constructs in FMRP knockout-rescue CAD cells. (C) Representative Firefly luciferase transcript smFISH images. Images are oriented such that the cell body is toward the left. (D) Quantification of smFISH images. For all conditions, the number of reporter transcripts in the neurite was calculated using FISH-quant. Each dot in each condition represents a single cell. Transcript counts were normalized to those observed in the full length FMRP, Nol3 UTR condition. P values were calculated using a Wilcoxon rank-sum test. (E) Quantification of FMRP/Firefly luciferase RNA interaction using CLIP-qPCR. Wilcoxon rank-sum P values of less than 0.001 are represented by three asterisks. (F) Quantification of FMRP trafficking using immunofluorescence. For each cell, the proportion of fluorescence present in the neurite was quantified and normalized to total fluorescence in the entire cell. P values were calculated using a Wilcoxon rank-sum test.
Figure 5—figure supplement 1
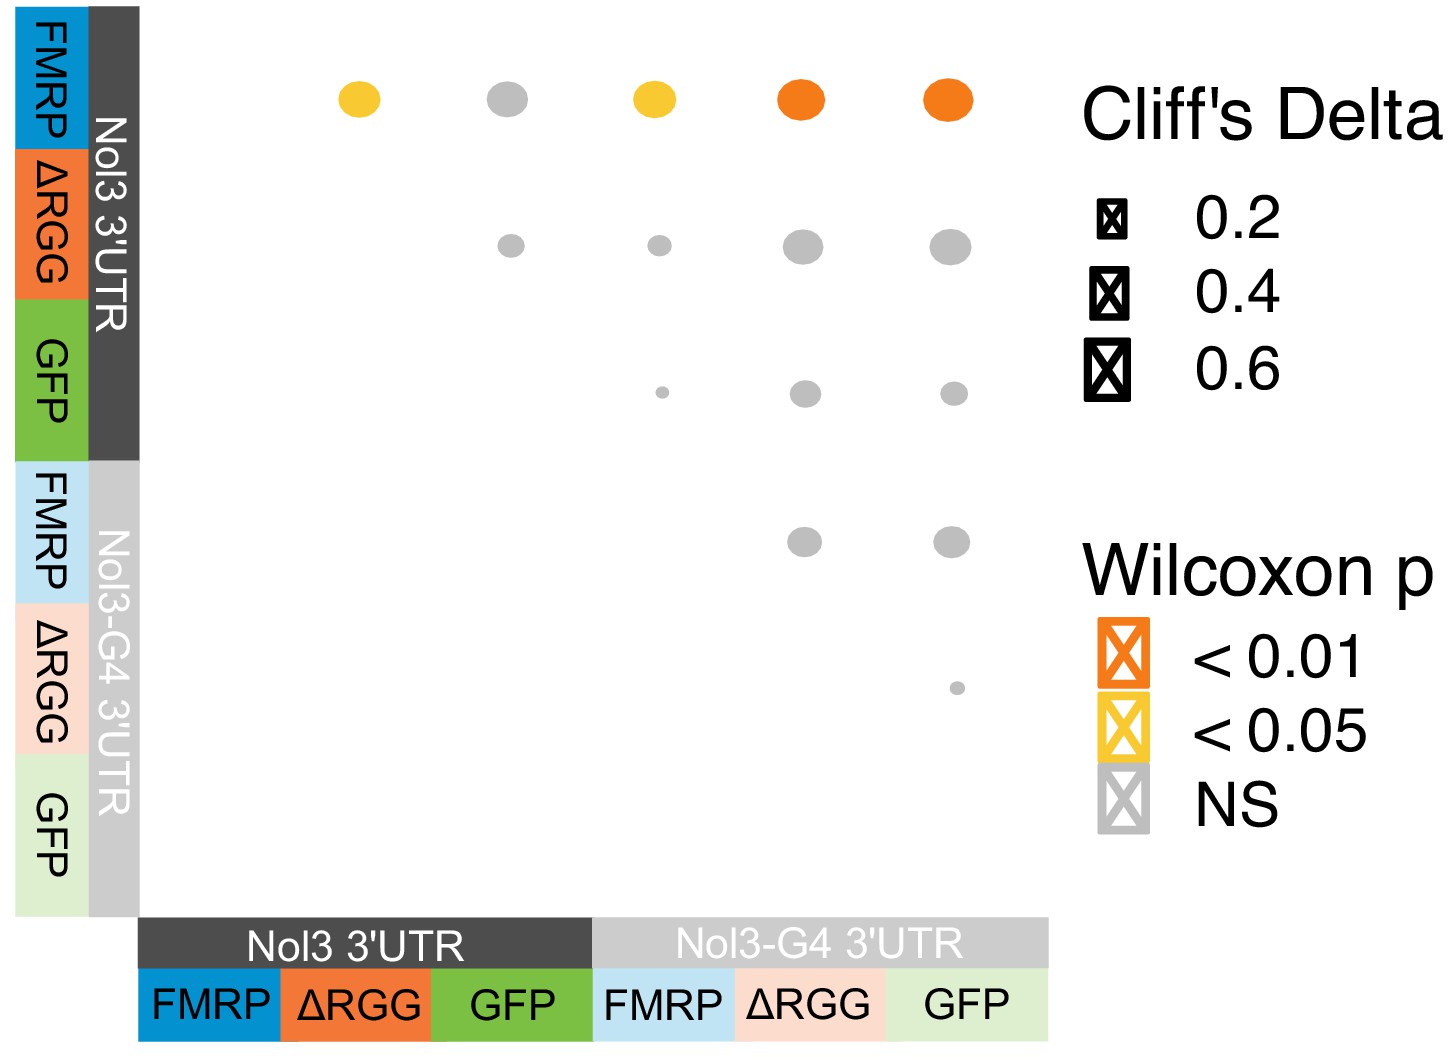
Summary of smFISH results.
Effect sizes and p values are reported.
Figure 5—figure supplement 2
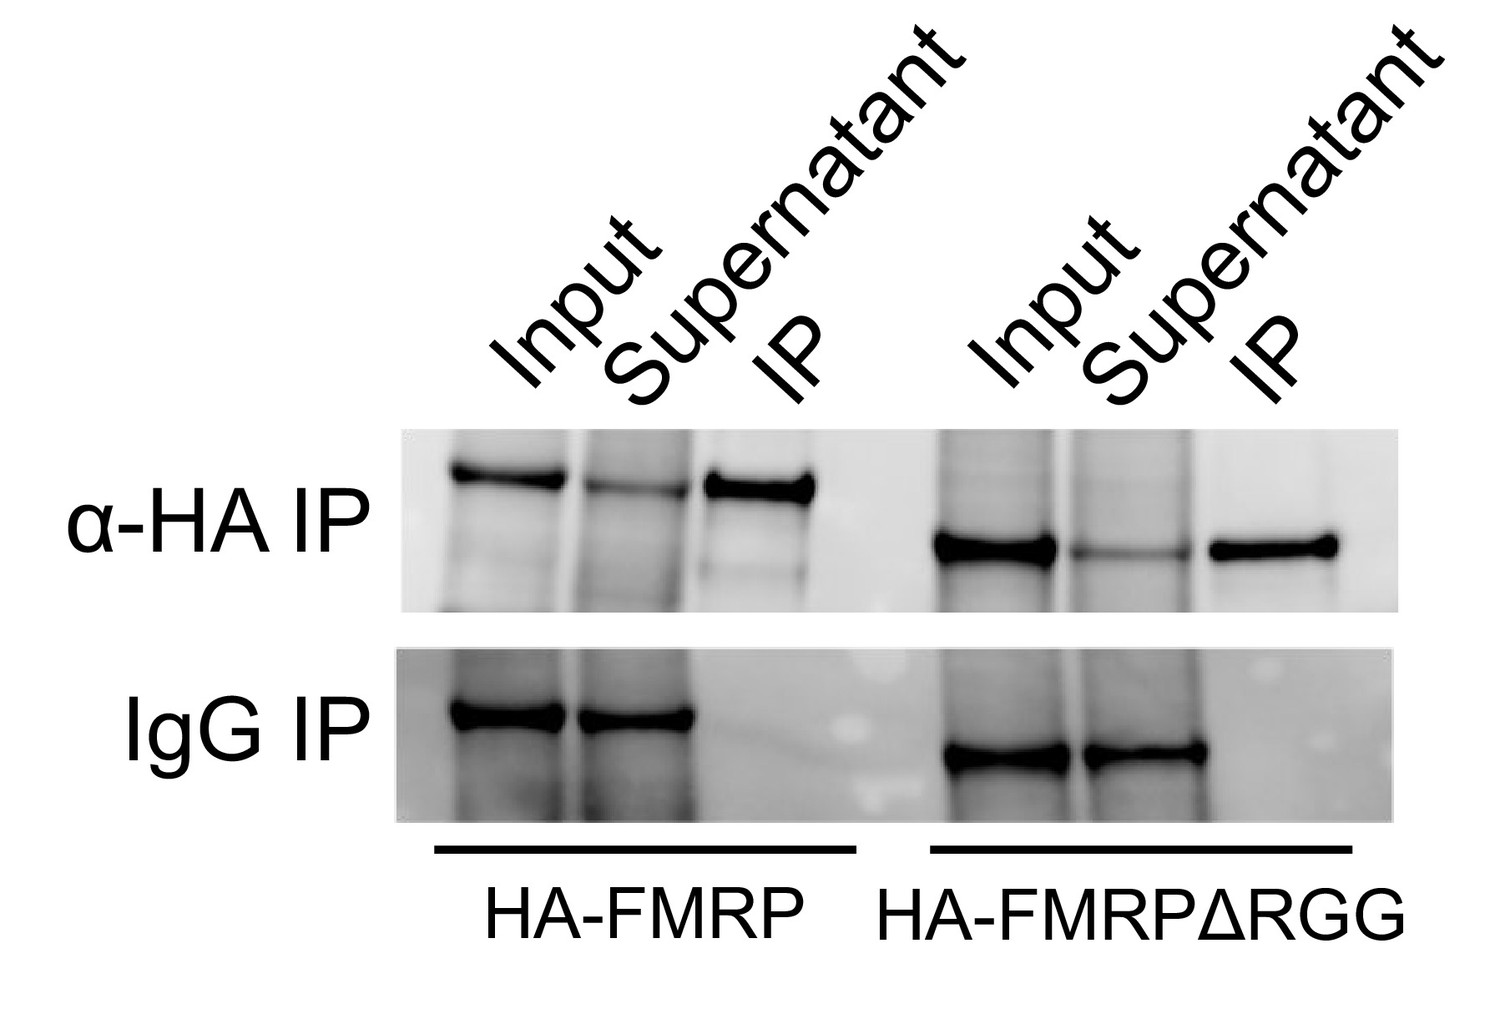
Western blotting of IP samples from the CLIP-seq qPCR experiments.
Figure 6 with 3 supplements
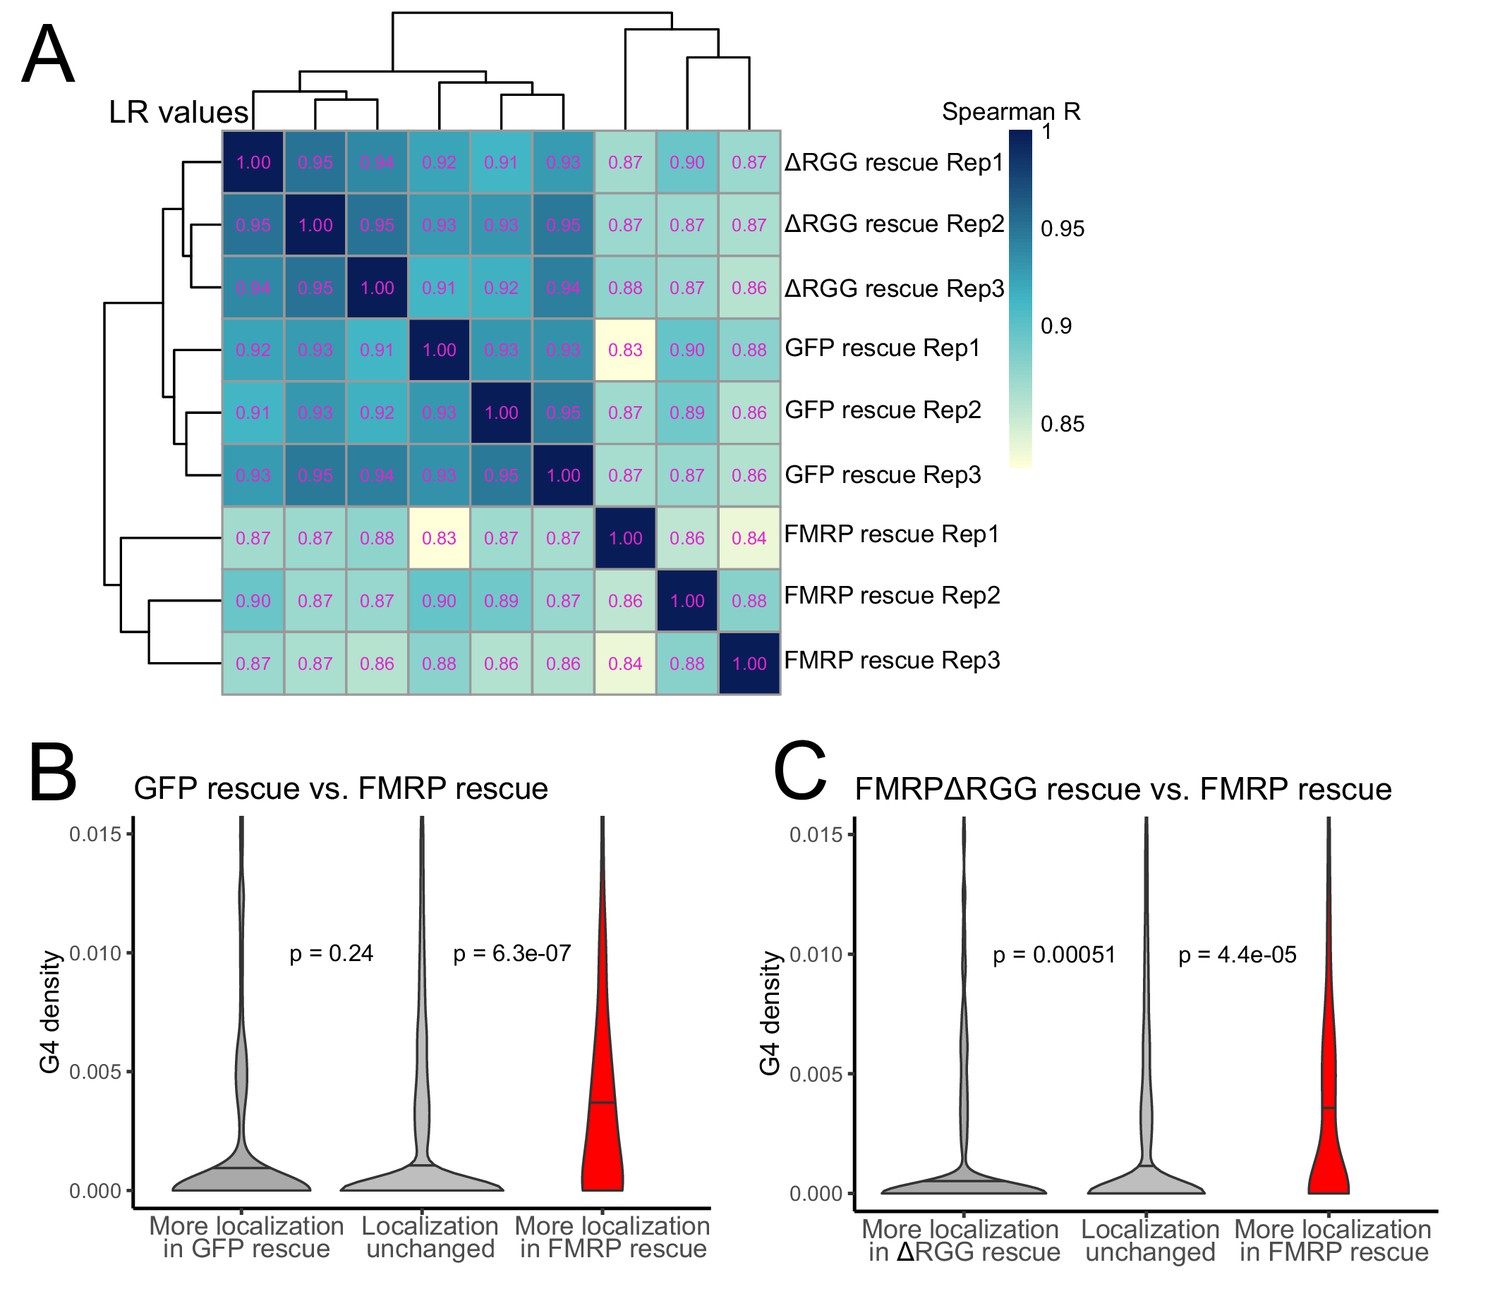
The RGG domain of FMRP is required for the localization of G-quadruplex-containing transcripts transcriptome-wide.
(A) Correlation of LR values for all expressed genes in FMRP rescue samples. (B) G-quadruplex density, as measured by RNAfold, in the 3′ UTRs of transcripts that were more localized in the GFP rescue cells (dark gray, left) or full-length FMRP rescue cells (red, right). P values were calculated using Wilcoxon rank-sum tests. As in Figure 2D, values represent the number of guanosine residues participating in quadruplex sequences per nt. (C) As in (B), but comparing transcripts that were more localized in the FMRP RGG truncation rescue (dark gray, left) or the full length FMRP rescue (red, right).
Figure 6—figure supplement 1
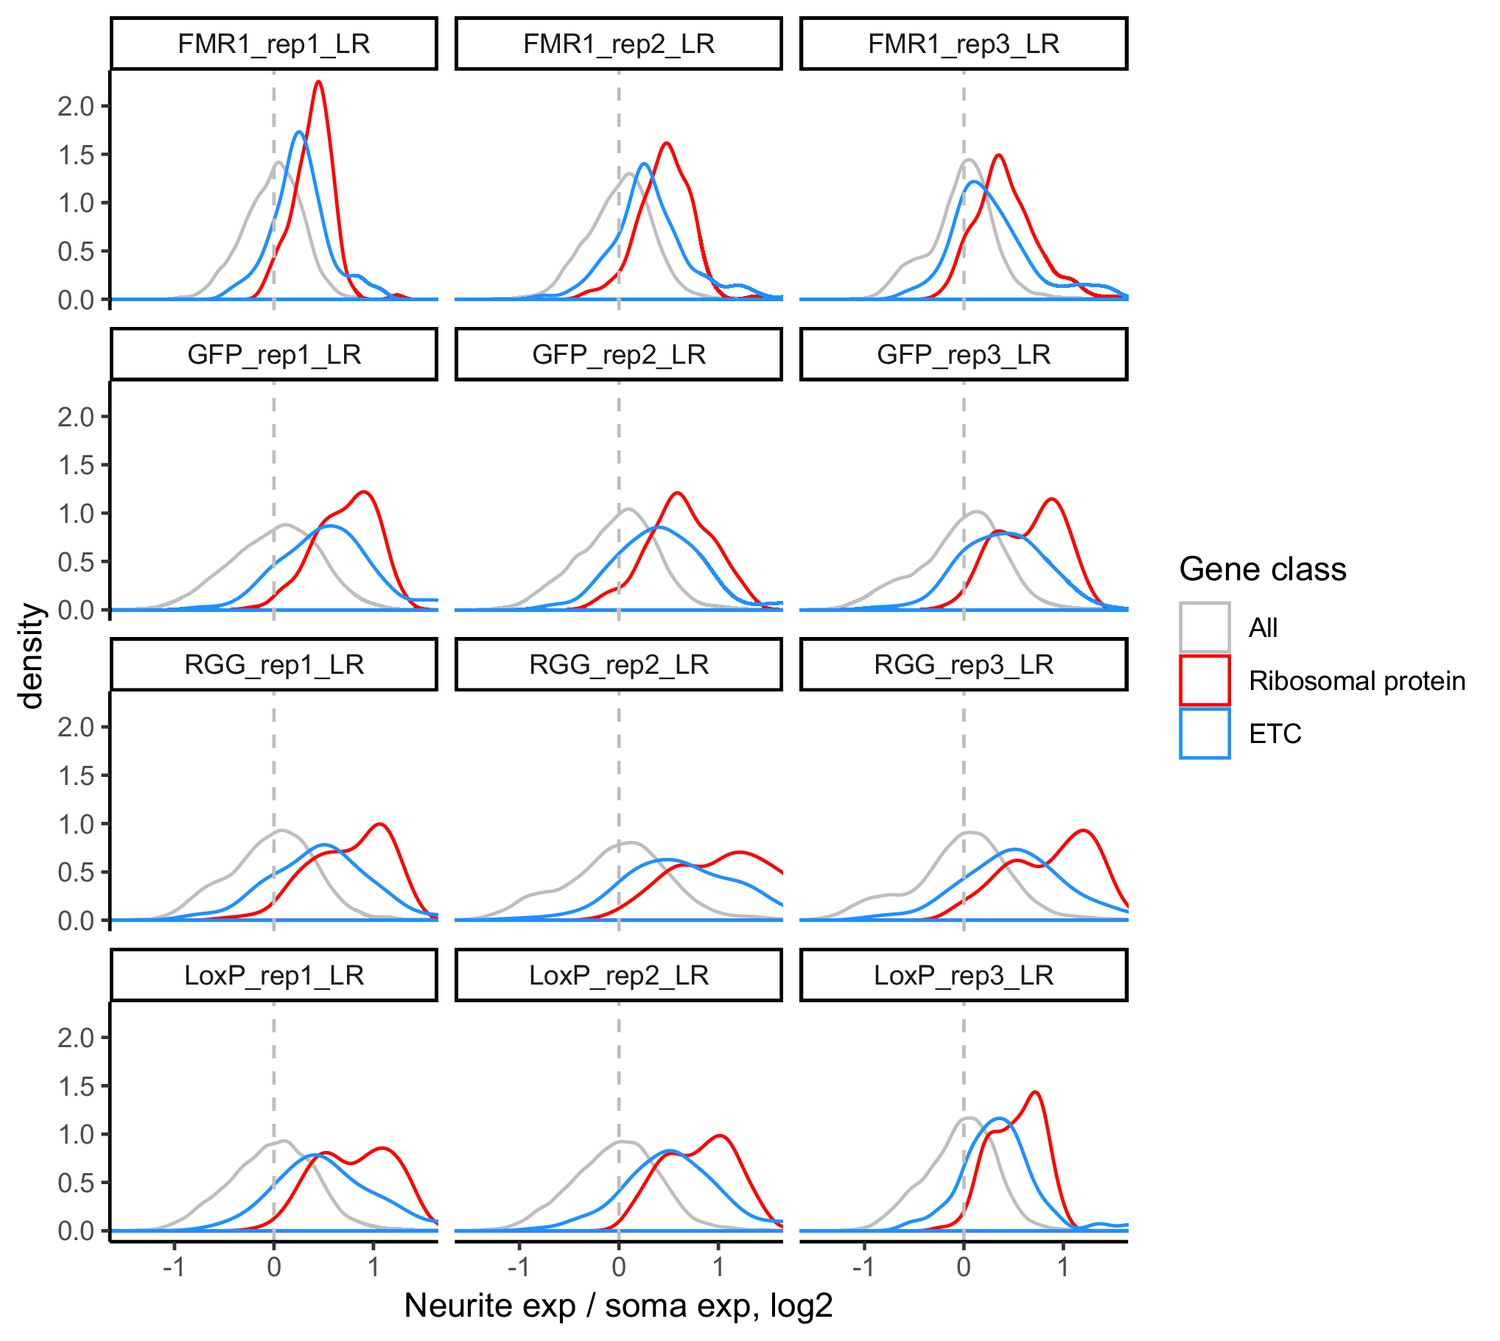
LR values for all genes (gray), ribosomal protein genes (red), and genes that are part of the electron transport chain (blue).
Figure 6—figure supplement 2
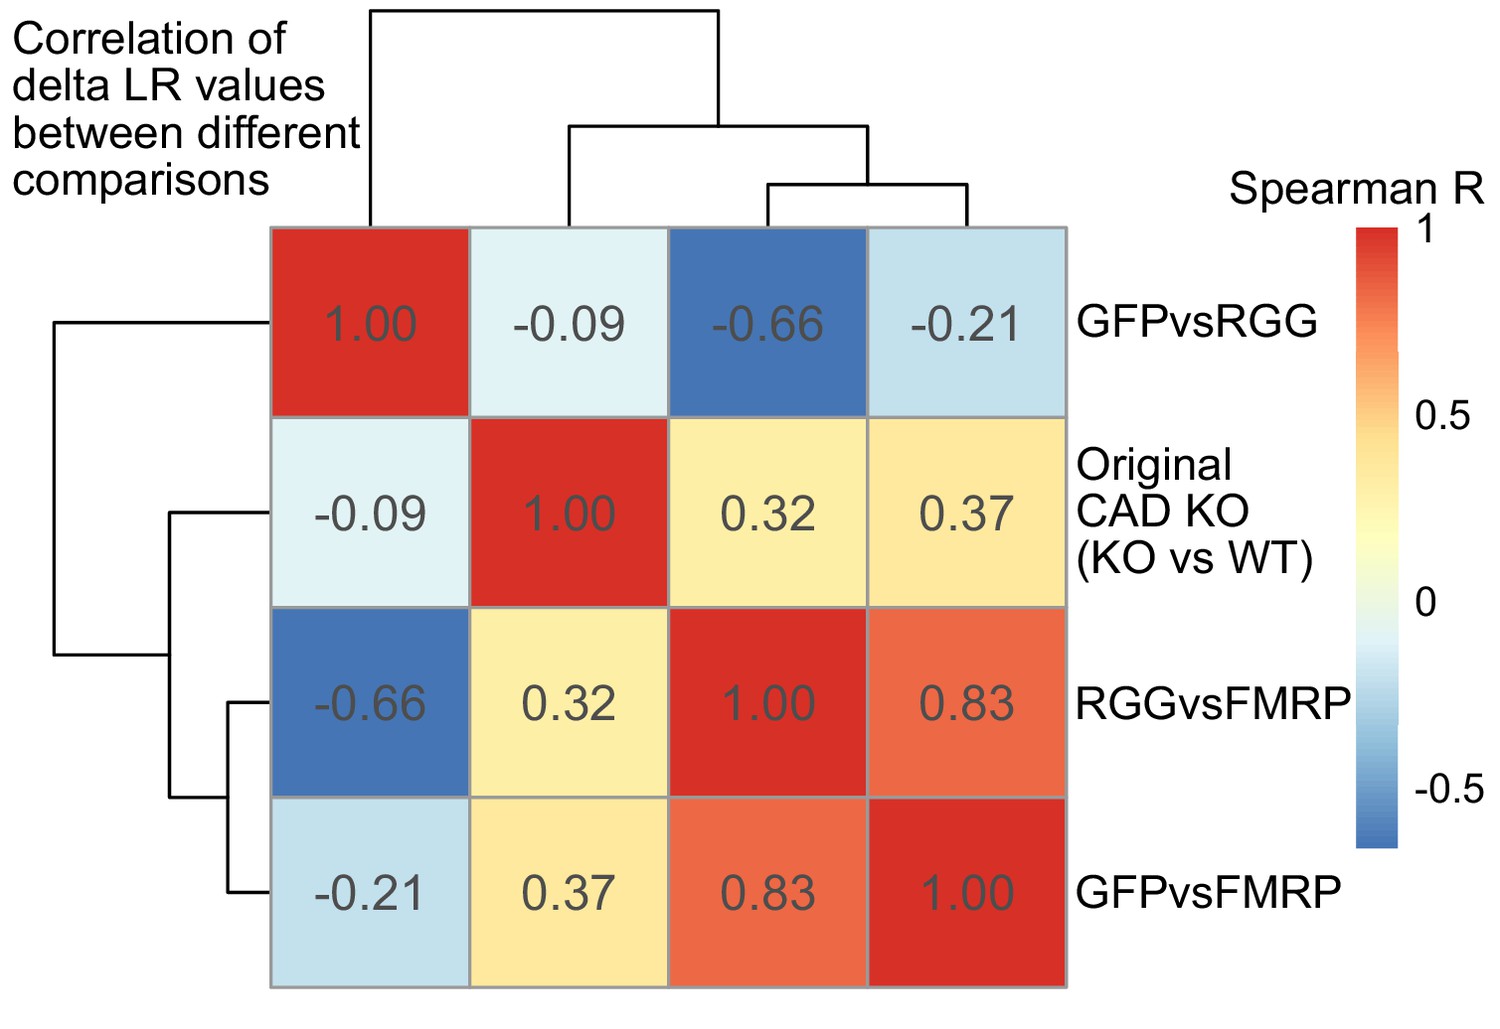
Correlation of delta LR values (nonfunctional FMRP condition [GFP, RGG, or KO] - functional FMRP condition [WT or FMRP]) between experiments.
Figure 6—figure supplement 3
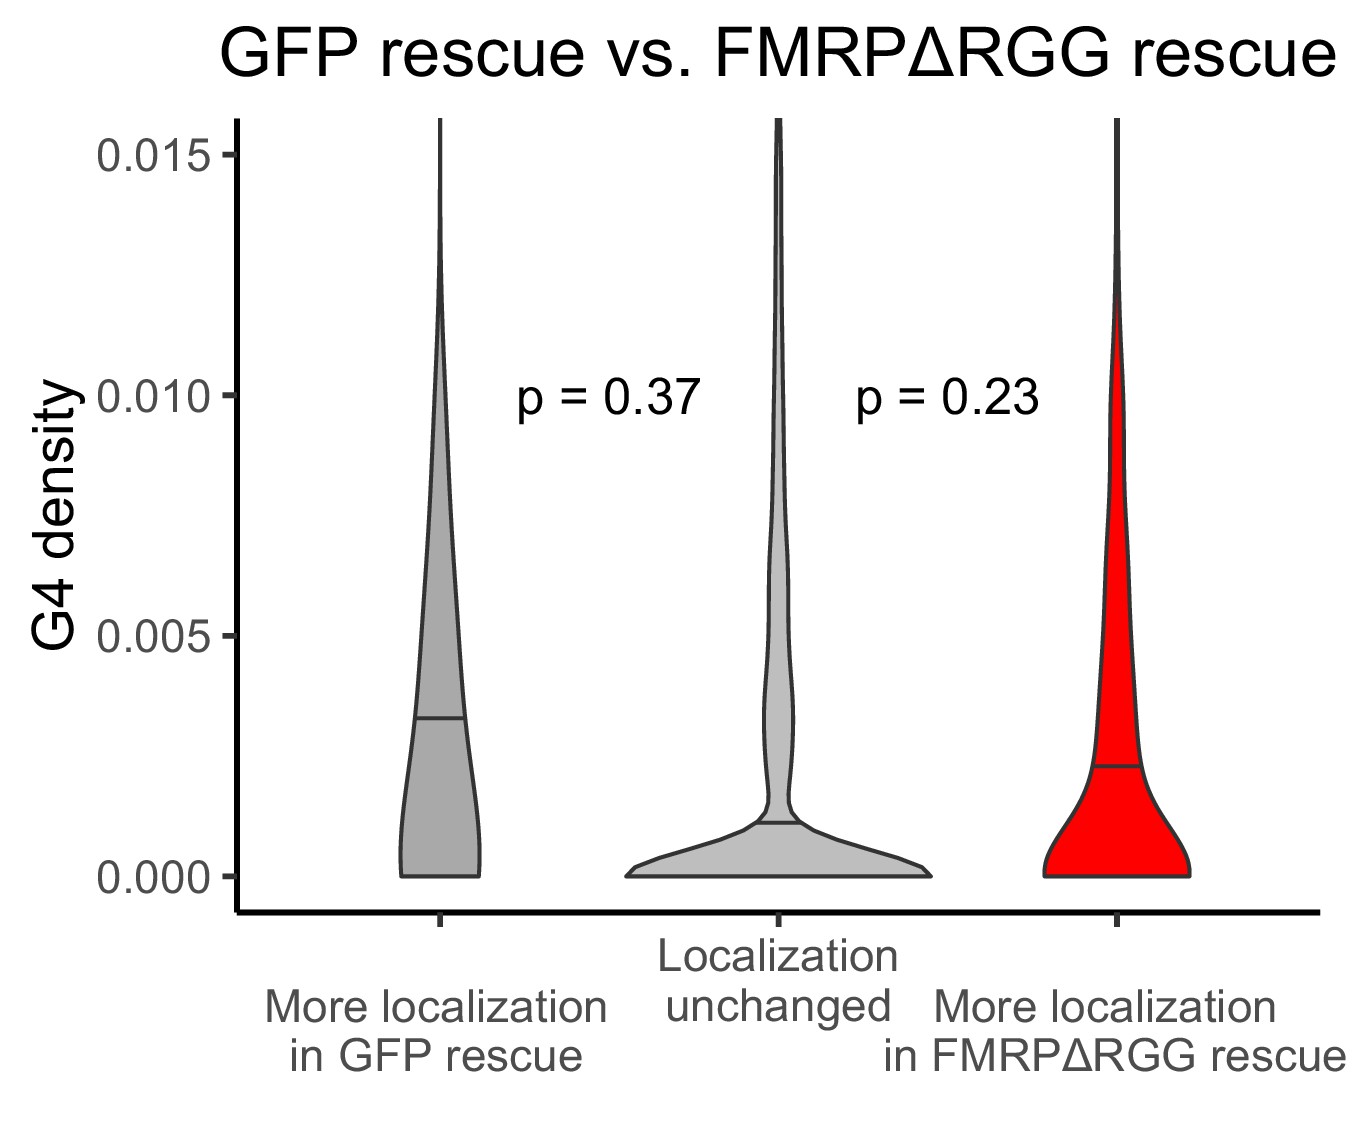
G-quadruplex density, as measured by RNAfold, in the 3′ UTRs of transcripts that were more localized in the GFP rescue cells (dark gray, left) or FMRP-RGG rescue cells (red, right).
P values were calculated using Wilcoxon rank-sum tests. As in Figure 2D, values represent the number of guanosine residues participating in quadruplex sequences per nt.
Figure 7 with 11 supplements
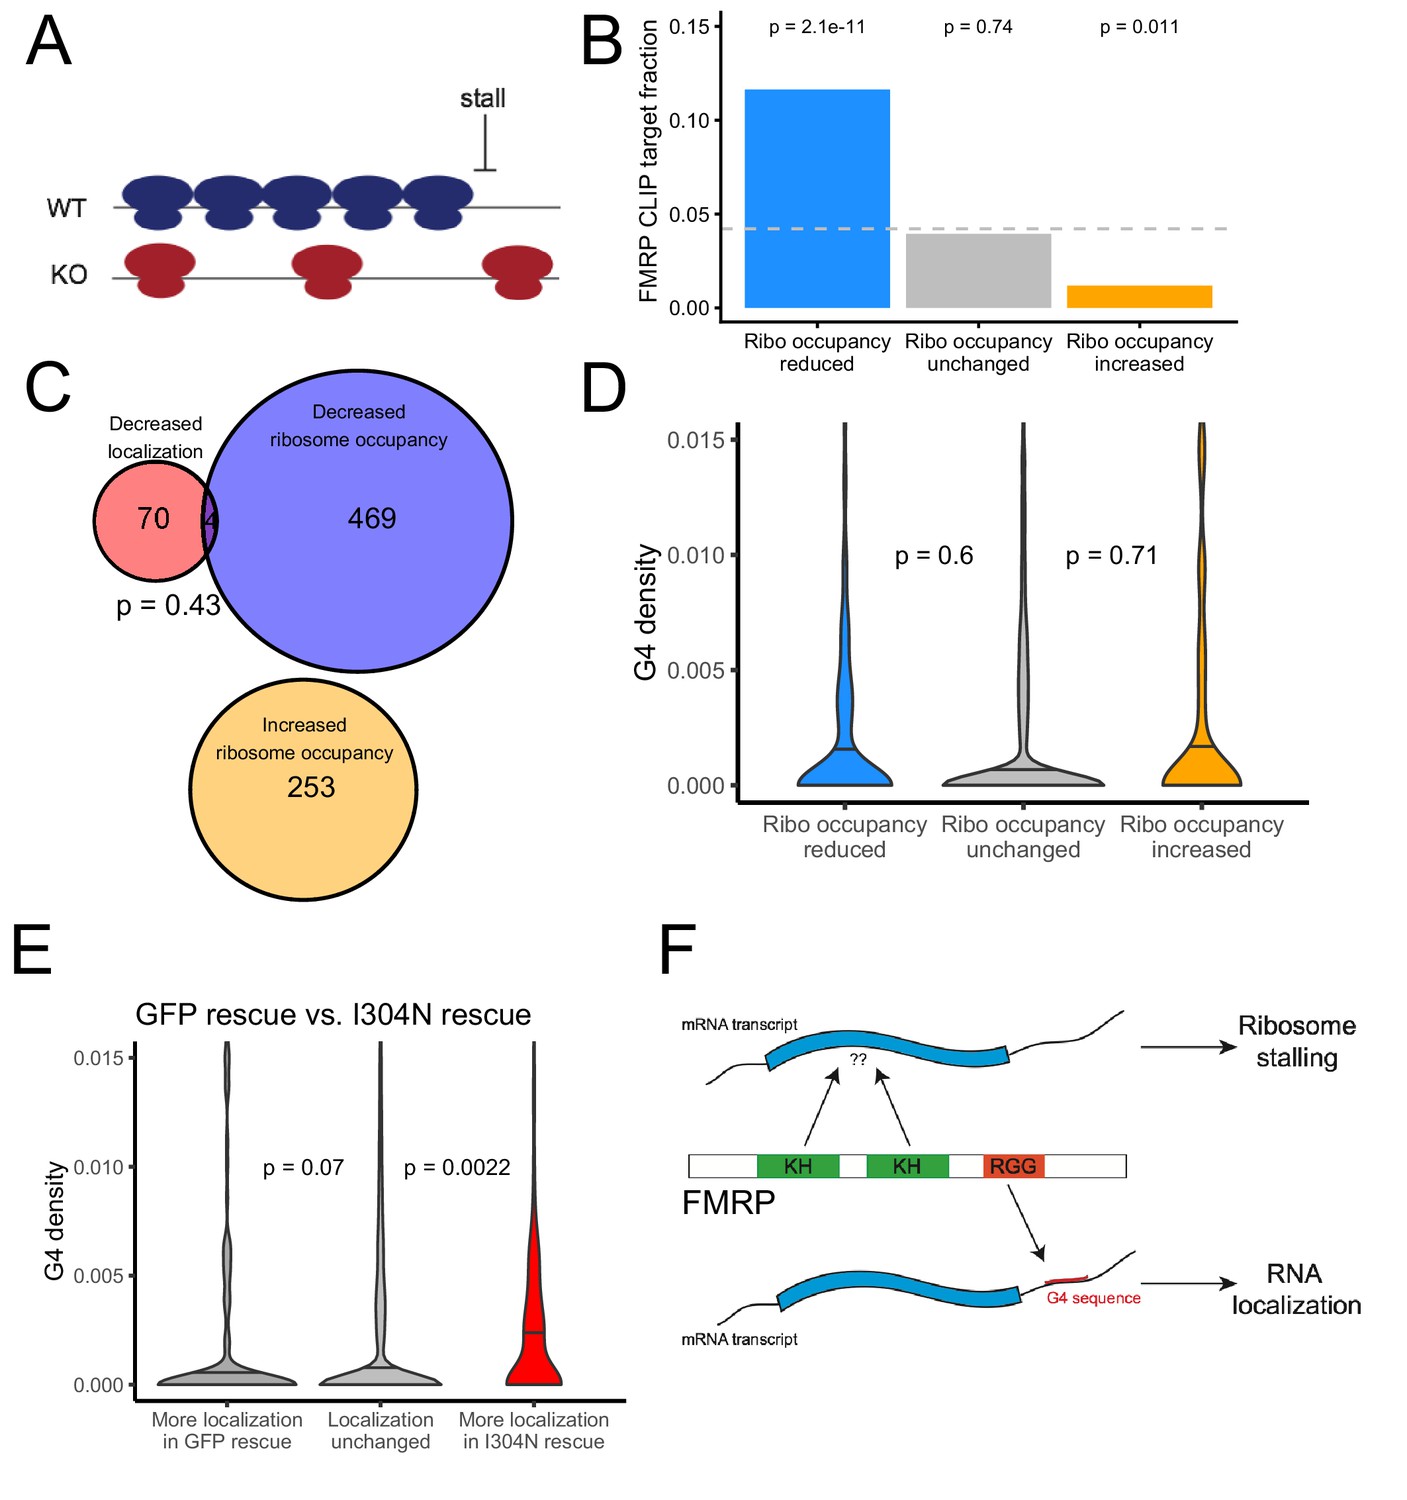
The translational regulation targets of FMRP are distinct from its RNA localization targets and have no relationship to G-quadruplex sequence density.
(A) Schematic of how the removal of FMRP, which is known to cause ribosome stalls, may affect overall ribosome density on a transcript. (B) Fraction of genes whose ribosome occupancy significantly decreased (blue) or increased (orange) in the FMRP null samples that were previously identified as bound by FMRP in cells. The null expectation is represented by a gray dotted line. P values were calculated using a binomial test. (C) Overlap of FMRP localization targets (red) and translational repression targets (blue). P values were calculated using a Binomial test. (D) G-quadruplex density, as determined by RNAfold, for the 3′ UTRs of transcripts whose ribosome occupancy was decreased (blue) or increased (orange) in the FMRP-null samples. P values were calculated using a Wilcoxon rank-sum test. (E) G-quadruplex density, as measured by RNAfold, in the 3′ UTRs of transcripts that were more localized in GFP rescue cells (dark gray, left) or FMRP I304N rescue cells (red, right). P values were calculated using Wilcoxon rank-sum tests. (F) Model for how FMRP recognizes its targets. RNA localization targets are recognized through the interaction of the RGG domain and a G-quadruplex sequence in the 3′ UTR of the transcript. Translational regulation targets are recognized through the interaction of one or both KH domains with an unknown transcript feature, or perhaps through interaction with ribosomes.
Figure 7—figure supplement 1
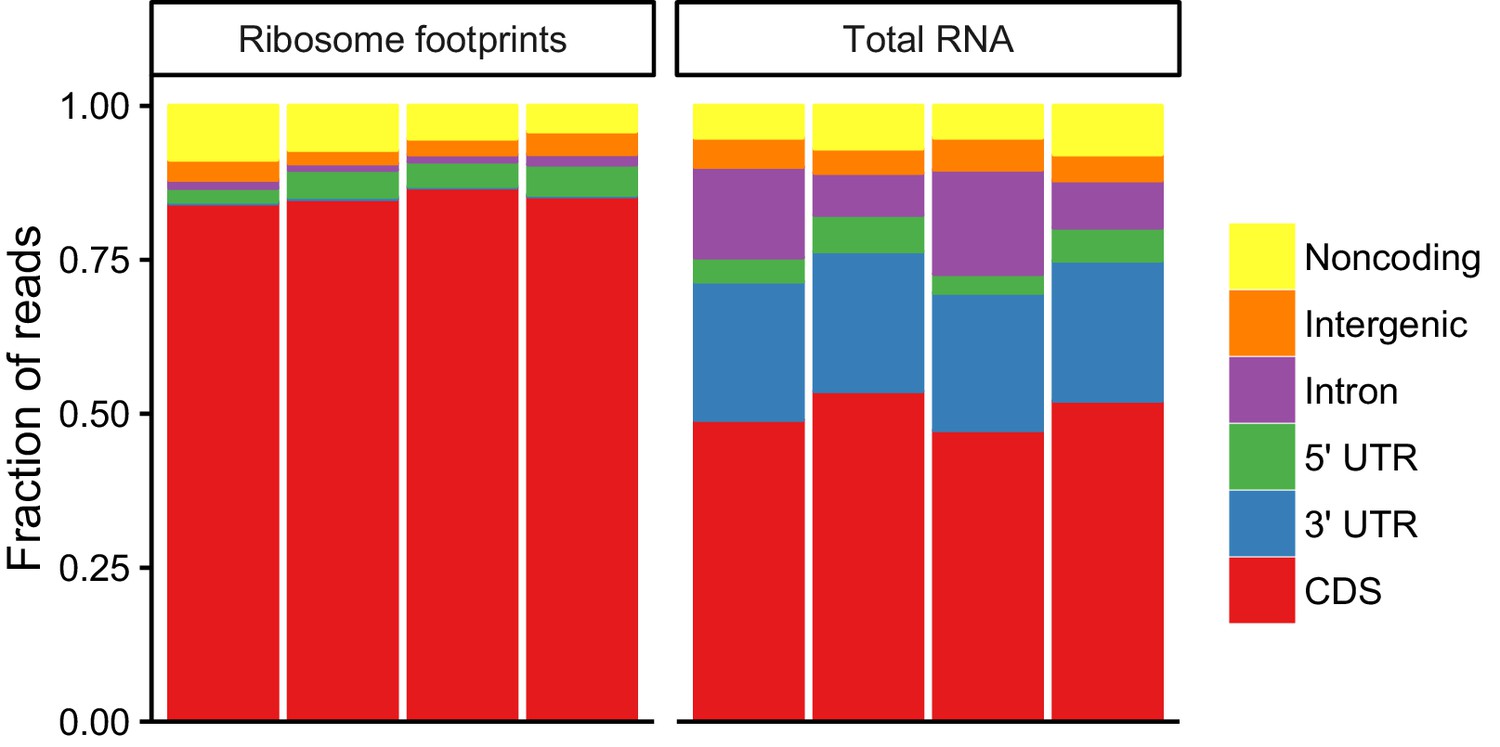
Fraction of reads that map to the indicated genomic regions.
Figure 7—figure supplement 2
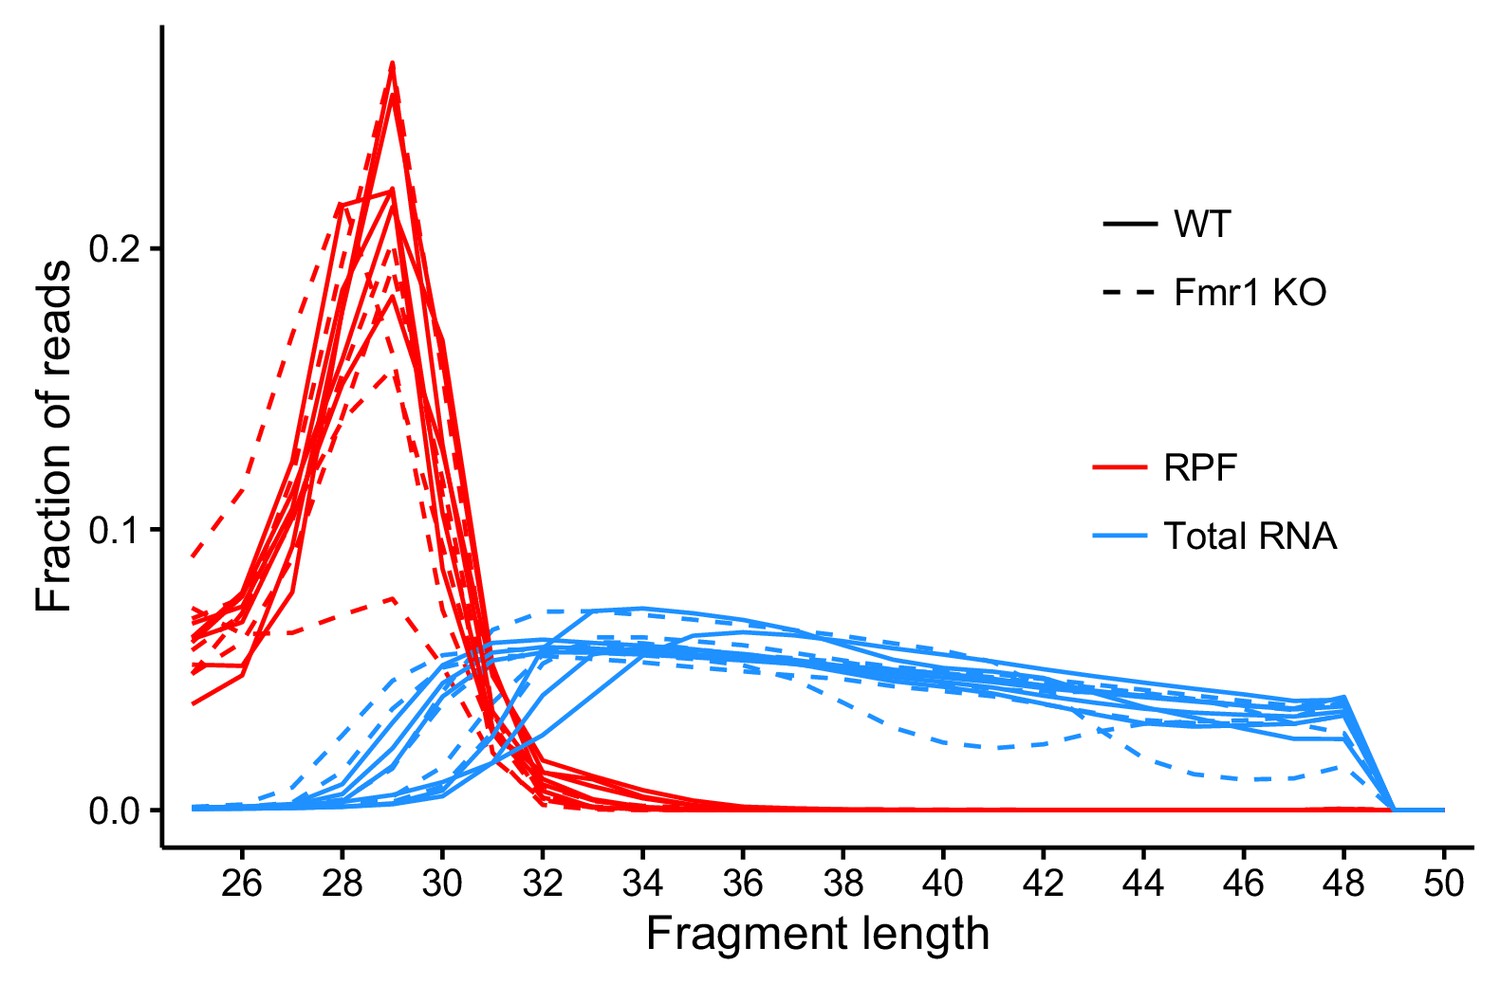
Fraction of reads of that are the indicated lengths.
Figure 7—figure supplement 3
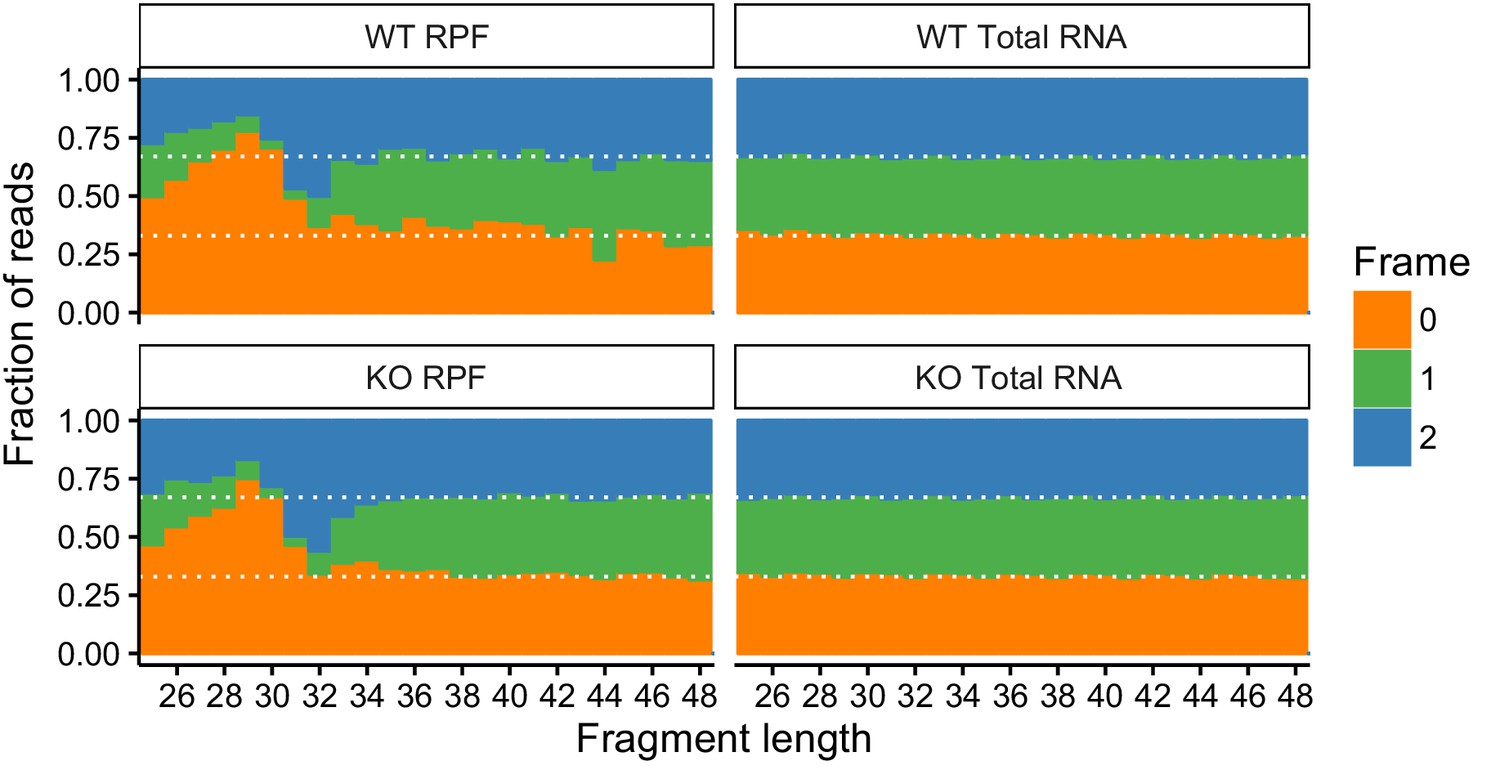
Fraction of reads that map to the indicated reading frames.
Figure 7—figure supplement 4
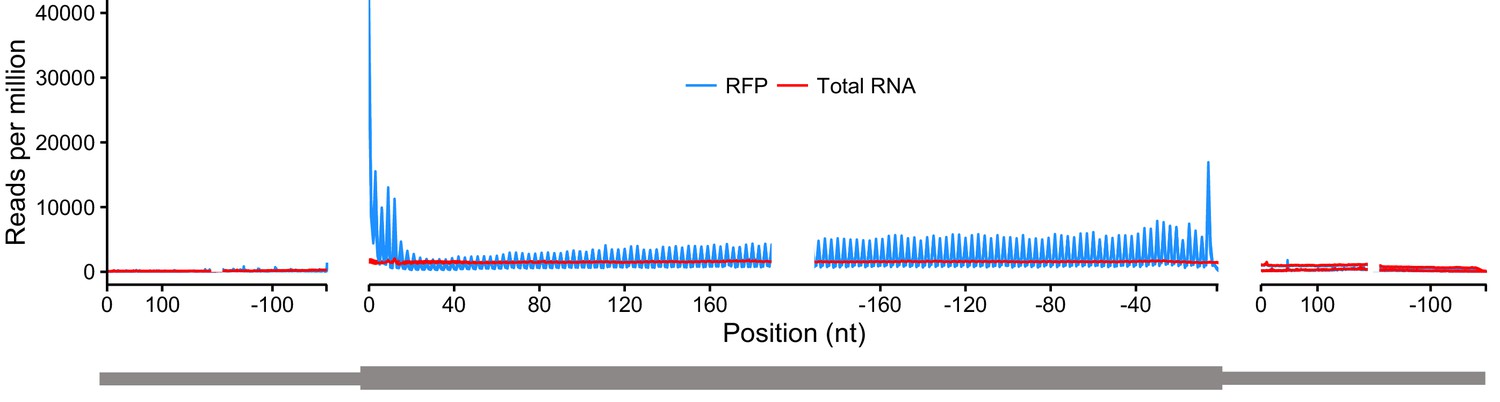
Metagene analysis of read densities across transcripts.
Reads from ribosome protected fragments display a characteristic three nucleotide periodicity.
Figure 7—figure supplement 5
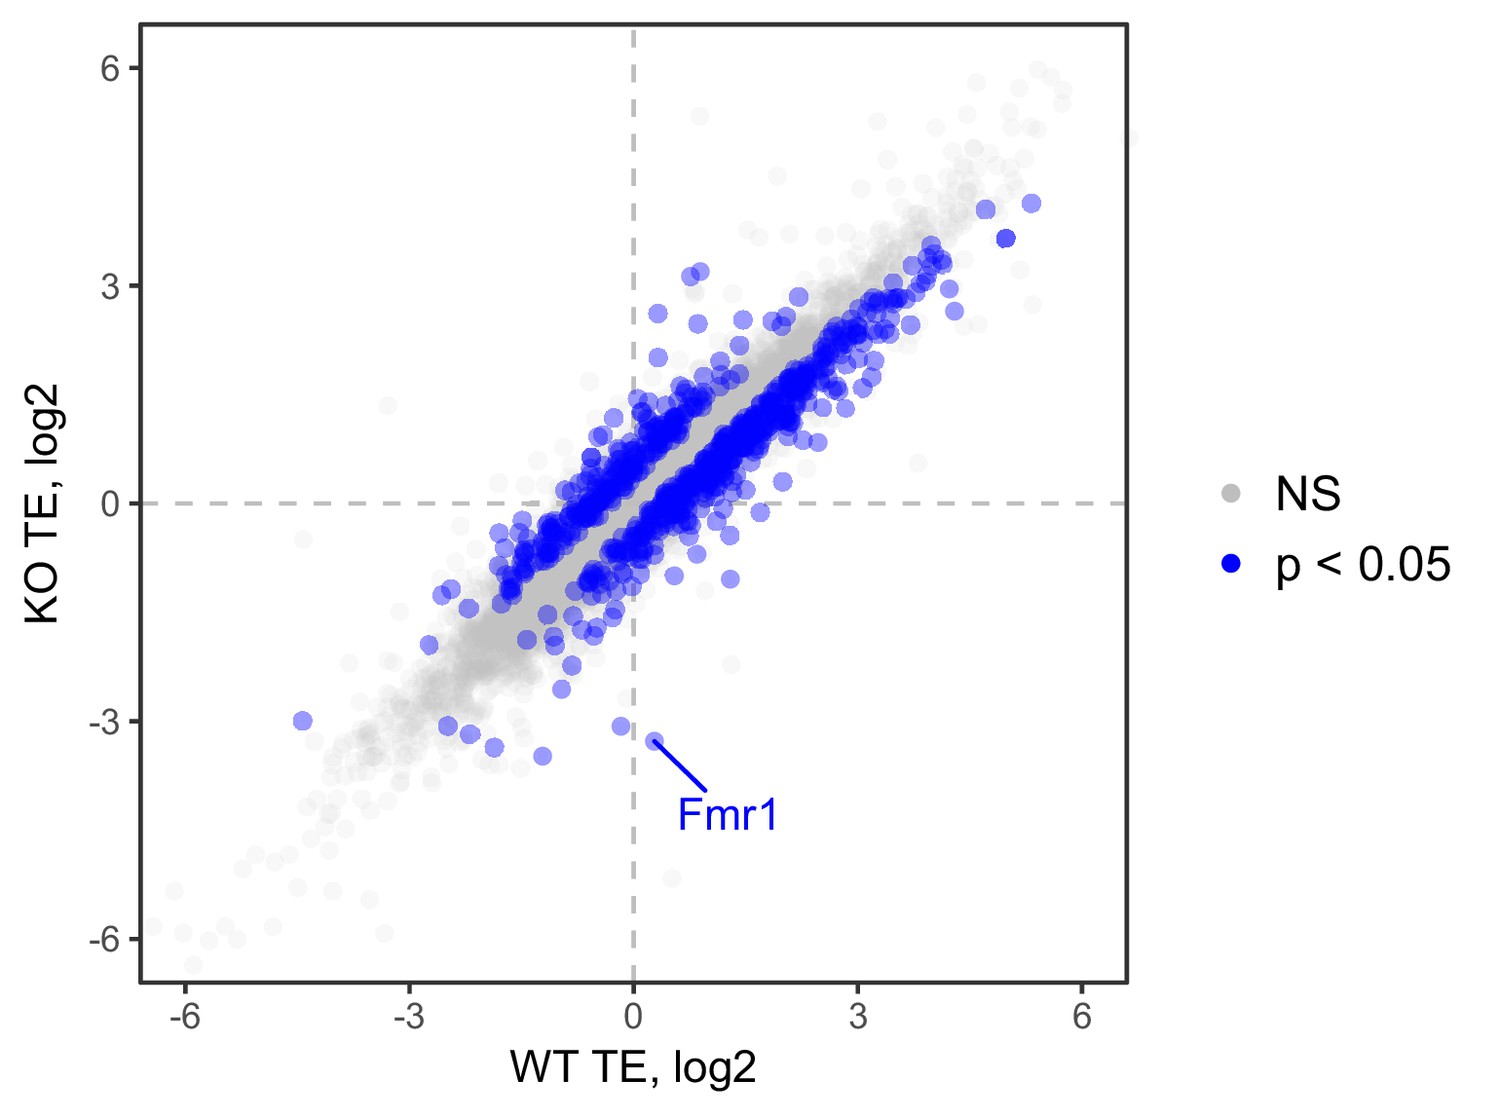
Ribosome occupancy values, as calculated by Xtail, in wildtype and FMRP null CAD cells.
Figure 7—figure supplement 6
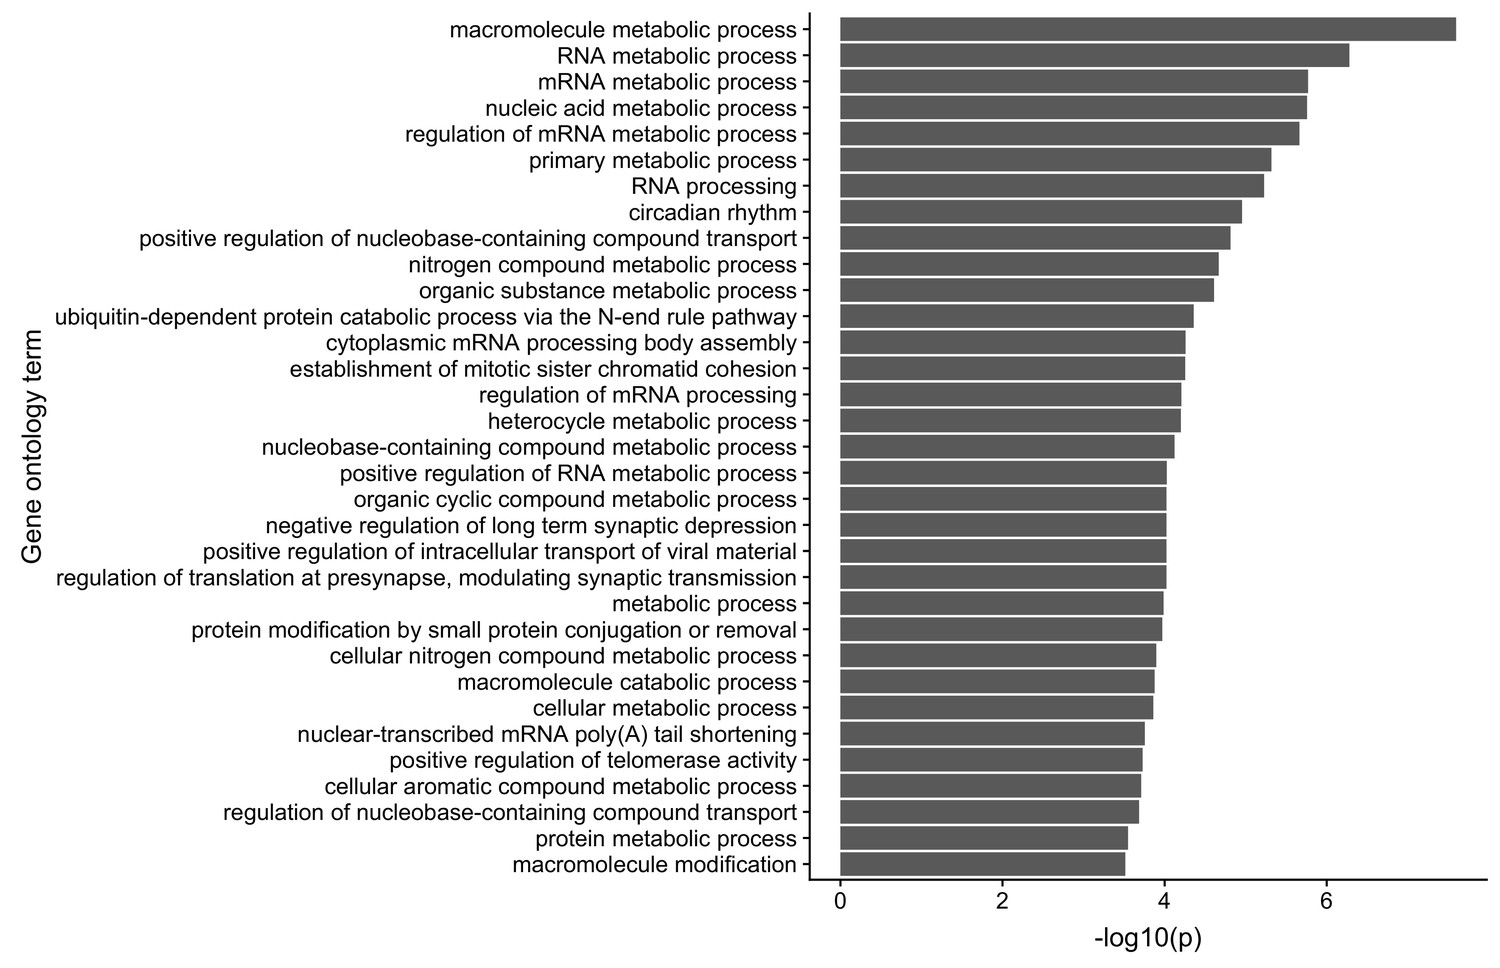
Gene ontology analysis of the translational regulatory targets of FMRP in CAD cells.
Figure 7—figure supplement 7
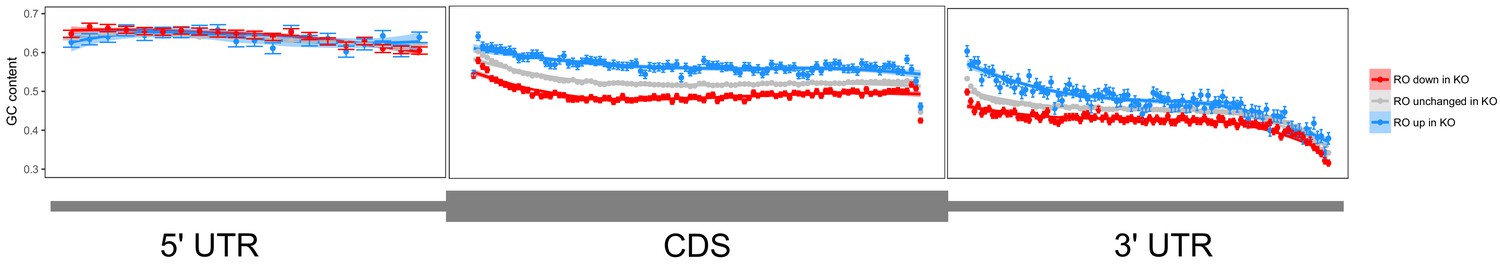
Metagene analysis of GC content across transcripts whose ribosome occupancy increases (blue) or decreases (red) in FMRP null CAD cells compared to wildtype cells.
Figure 7—figure supplement 8
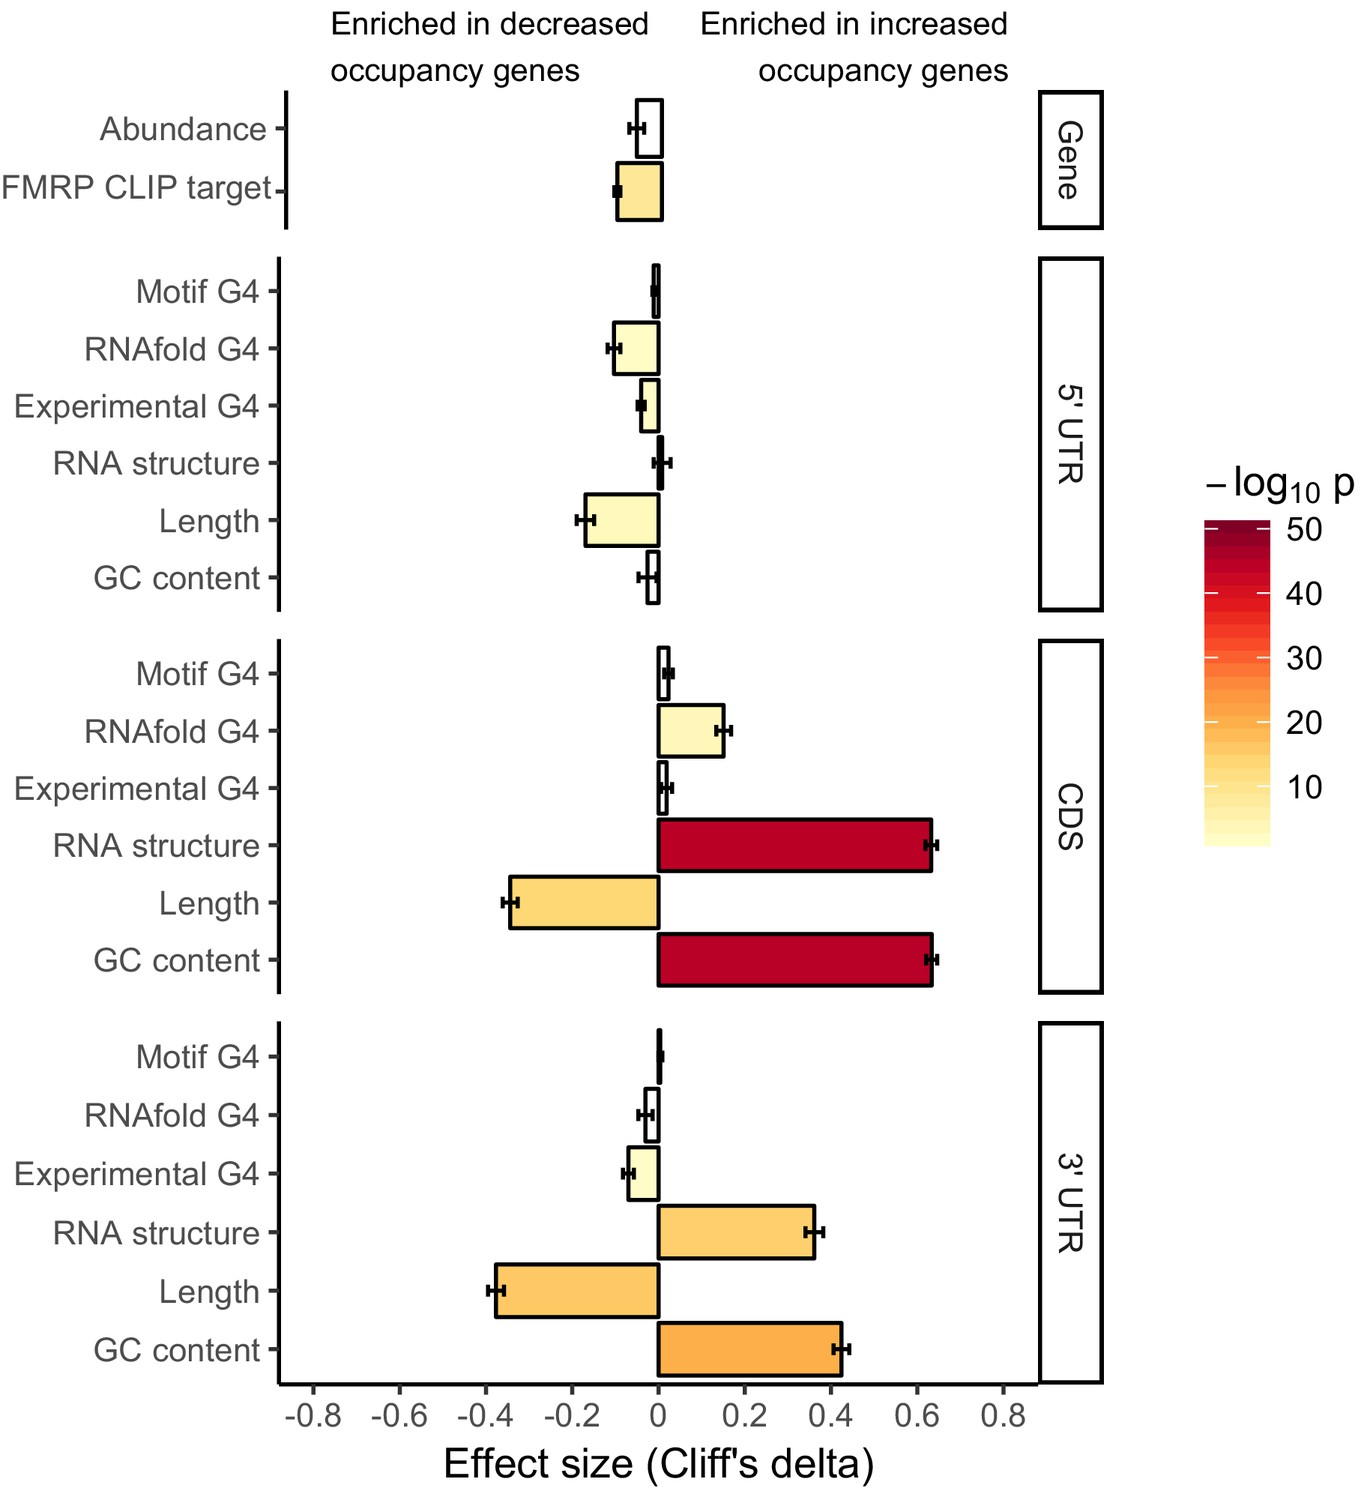
Effect sizes and significance of the relationships between transcript features and whether or not a transcript’s ribosome occupancy was increased or decreased by FMRP.
Figure 7—figure supplement 9
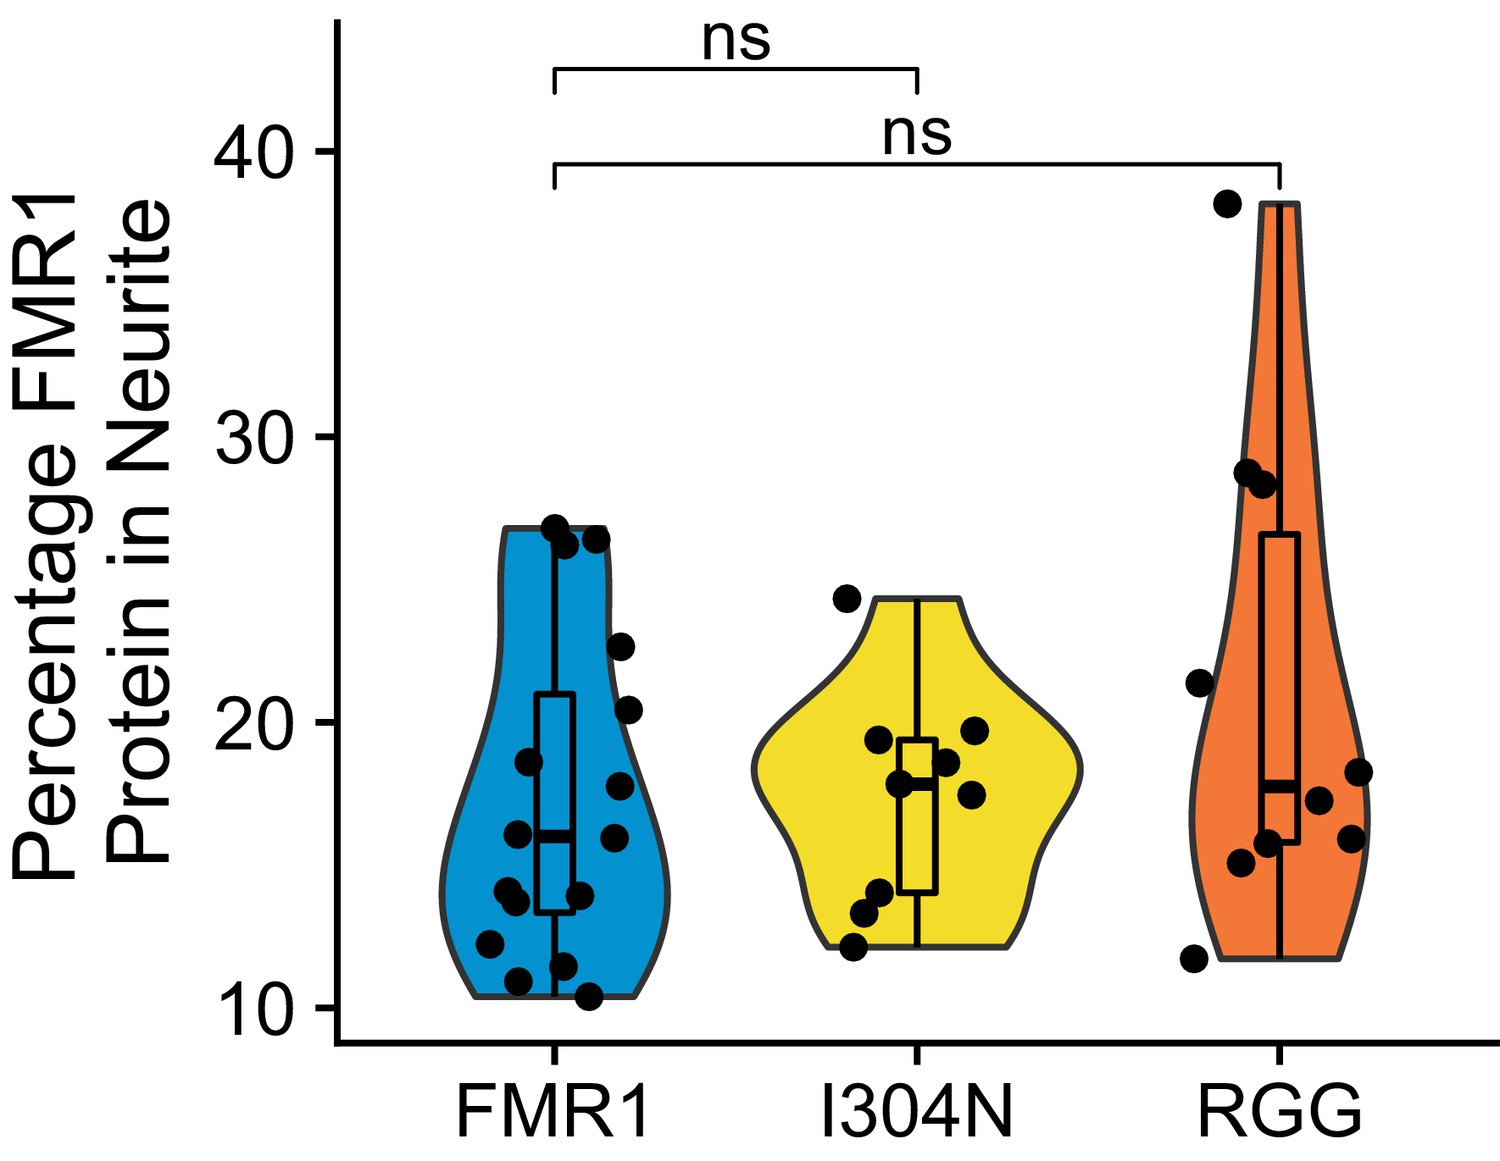
Quantification of FMRP trafficking using immunofluorescence.
For each cell, the proportion of the total cellular fluorescence that was present in the neurite was quantified. P values were calculated using a Wilcoxon rank-sum test.
Figure 7—figure supplement 10
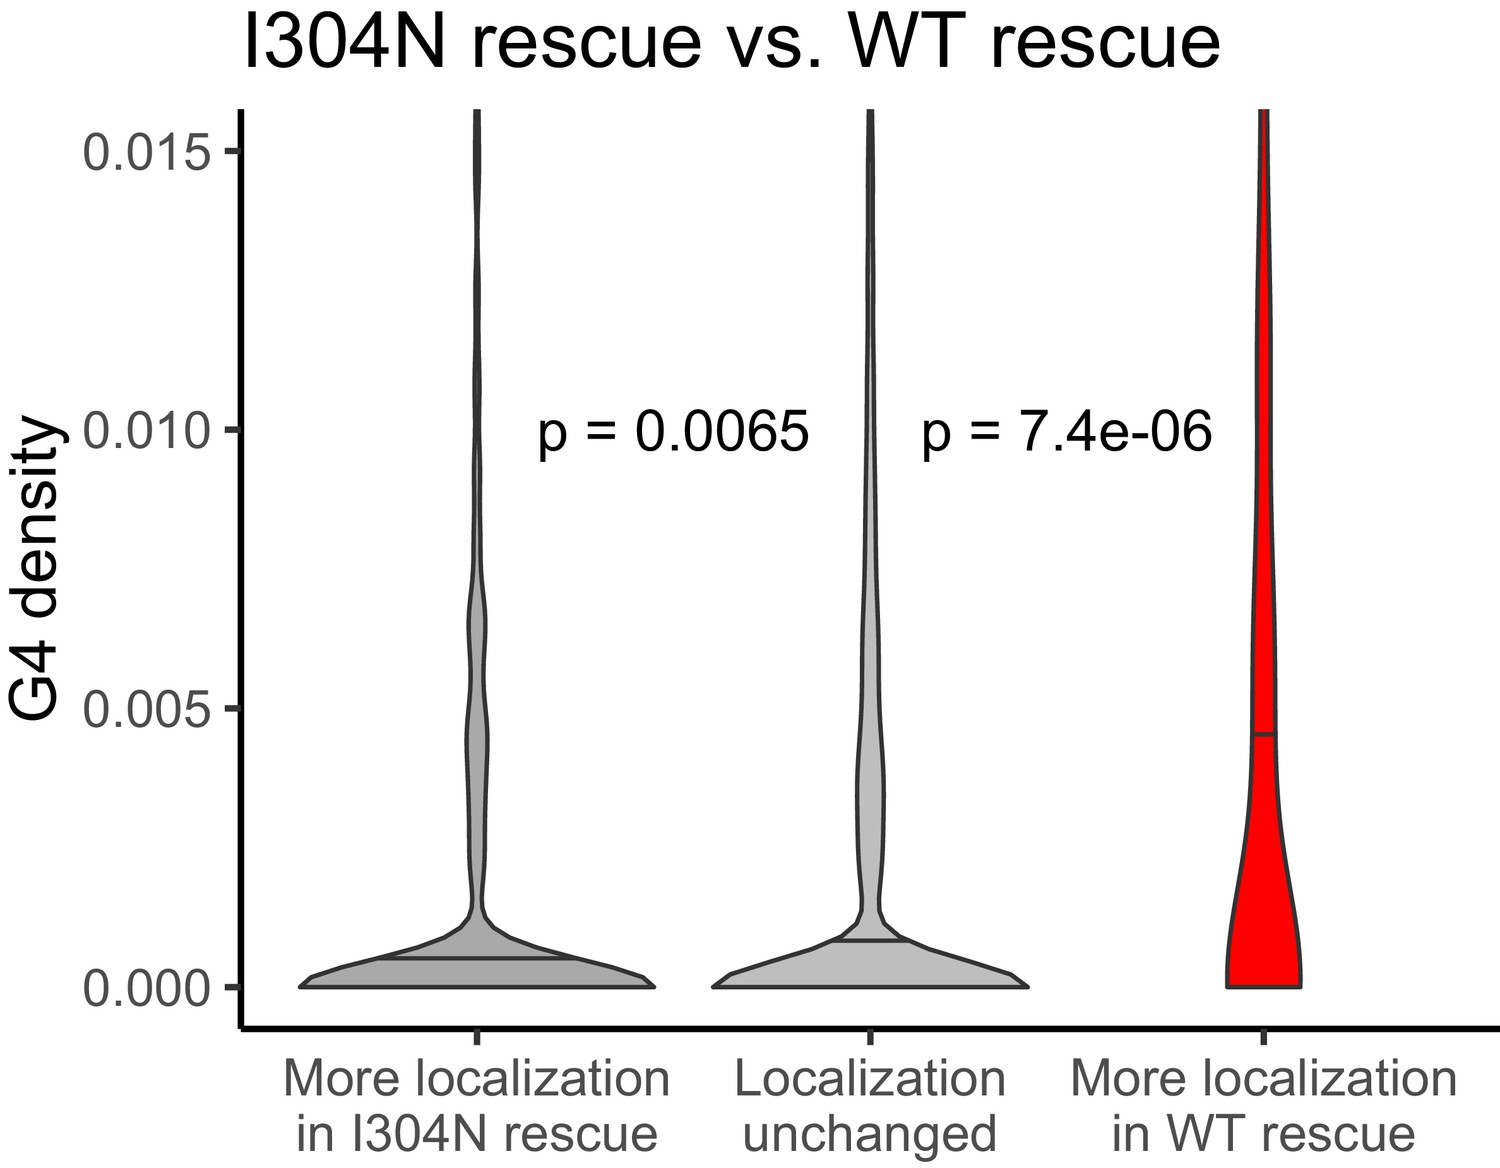
G-quadruplex density, as measured by RNAfold, in the 3′ UTRs of transcripts that were more localized in the I304N rescue cells (dark gray, left) or wildtype FMRP rescue cells (red, right).
P values were calculated using Wilcoxon rank-sum tests.
Figure 7—figure supplement 11
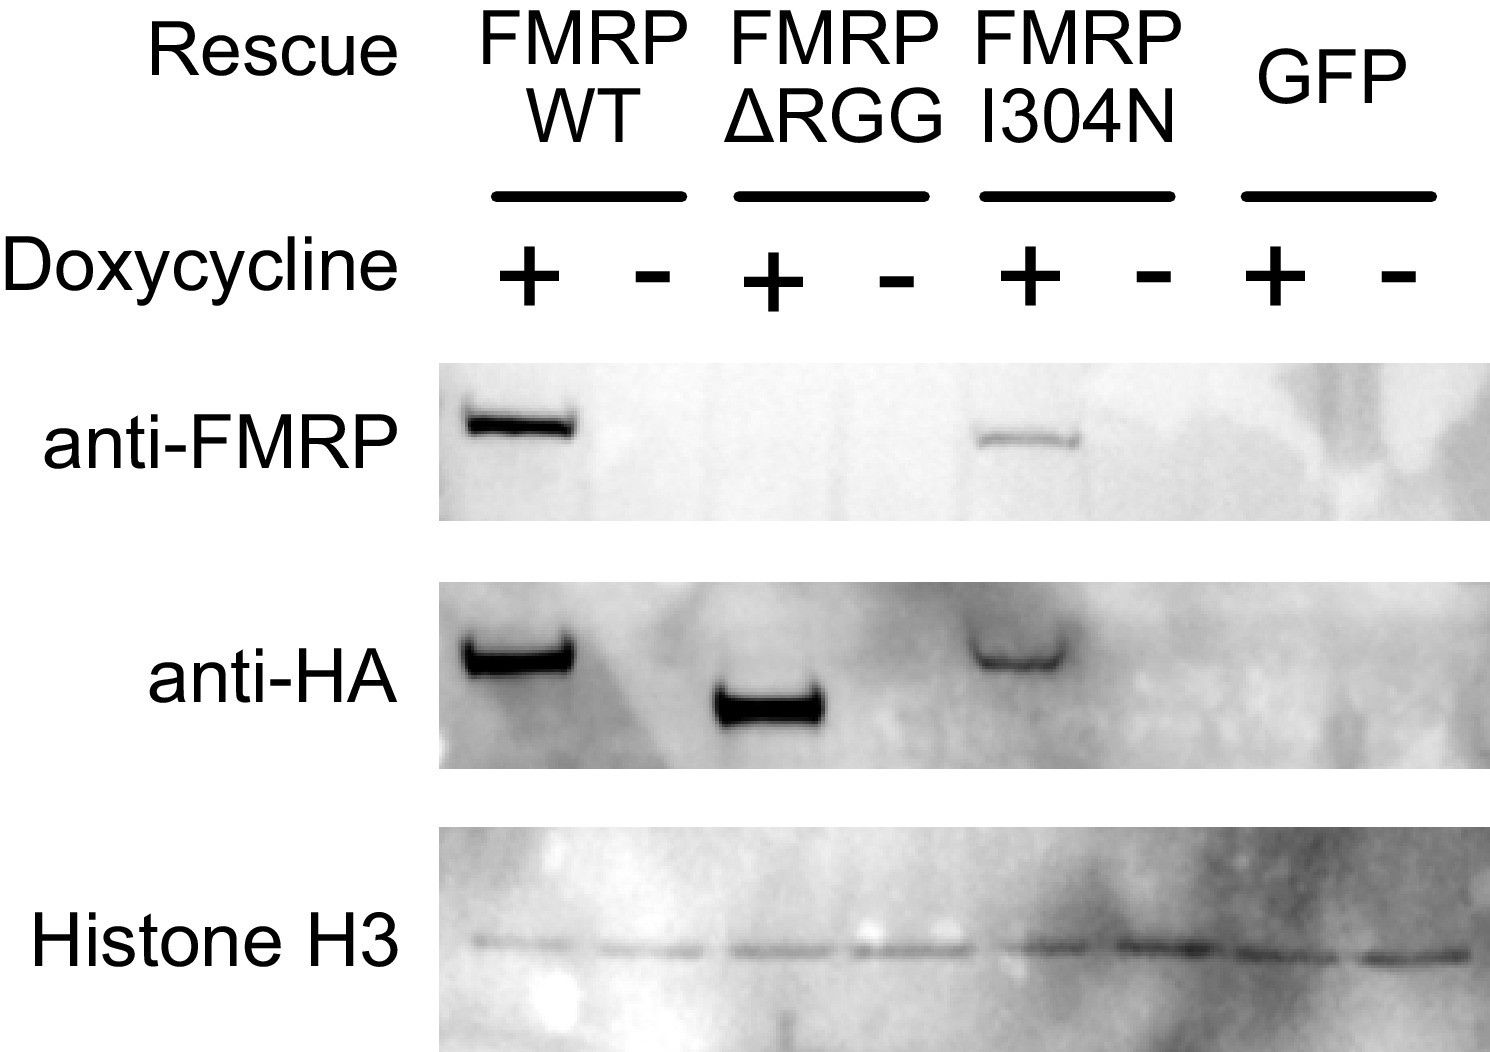
Expression of the different HA-tagged FMRP rescue constructs used in the FMRP null CAD line.
The FMRP antibody used was raised against the C-terminus, and therefore does not react with the ΔRGG truncation.
Tables
Key resources table
| Reagent type (species) or resource | Designation | Source or reference | Identifiers | Additional information |
|---|---|---|---|---|
| Gene (Mus musculus) | Fmr1 | ENSMUSG00000000838 | ||
| Sequence-based reagent | Fmr1 guide RNA | Used to create mouse FMR1-null cells, cloned into pX330 AAATTATCAGCTGGTAATTT | ||
| Cell line (Mus musculus) | CAD | Sigma | 08100805-1VL, RRID:CVCL_0199 | |
| Cell line (Mus musculus) | CAD/loxP | Khandelia et al., 2011 | Contains single integration of loxP cassette | |
| Transfected construct (Mus musculus) | Fmr1 cDNA | Dharmacon | BC079671.1 | |
| Antibody | Mouse anti FMR1, monoclonal | Proteintech | 66548 | 1:5000 dilution for immunoblotting |
| Antibody | Mouse anti HA, monoclonal | Genscript | GenScript Cat# A01244, RRID:AB_1289306 | 1:2000 for immunofluorescence |
| Sequence-based reagent | smFISH probes against Firefly luciferase | BioSearch | VSMF-1006–5 | |
| Commercial assay or kit | Zymo Quick-RNA Microprep kit | Zymo Research | R1050 | |
| Other | Cell culture inserts for fractionatoin | Corning | 353102 |
Additional files
-
Supplementary file 1
Xtail outputs for differential localization or ribosome occupancy of transcripts between two different conditions.
(a) Xtail output for the differential localization of transcripts in wildtype and FMRP null CAD cells. All log2 fold change values are knockout/wildtype. (b) Xtail output for the differential localization of transcripts in unaffected and FXS motor neurons. All log2 fold change values are FXS/unaffected. (c) Xtail output for the differential localization of transcripts in FMRP null CAD cells rescued with either GFP or full length FMRP. (d) Xtail output for the differential localization of transcripts in FMRP null CAD cells rescued with either FMRP-RGG or full length FMRP. (e) Xtail output for the differential localization of transcripts in FMRP null CAD cells rescued with either FMRP-RGG or GFP. (f) Xtail output for the differential ribosome occupancy of genes in wildtype and FMRP null CAD cells. (g) Xtail output for the differential localization of transcripts in FMRP null CAD cells rescued with either GFP or I304N FMRP. (h) Xtail output for the differential localization of transcripts in FMRP null CAD cells rescued with either I304N or wildtype FMRP.
- https://cdn.elifesciences.org/articles/52621/elife-52621-supp1-v1.xlsx
-
Transparent reporting form
- https://cdn.elifesciences.org/articles/52621/elife-52621-transrepform-v1.docx
Download links
A two-part list of links to download the article, or parts of the article, in various formats.
Downloads (link to download the article as PDF)
Open citations (links to open the citations from this article in various online reference manager services)
Cite this article (links to download the citations from this article in formats compatible with various reference manager tools)
FMRP promotes RNA localization to neuronal projections through interactions between its RGG domain and G-quadruplex RNA sequences
eLife 9:e52621.
https://doi.org/10.7554/eLife.52621


