Cdc13 is predominant over Stn1 and Ten1 in preventing chromosome end fusions
- The State Key Laboratory of Molecular Biology, CAS Center for Excellence in Molecular Cell Science, Shanghai Institute of Biochemistry and Cell Biology, Chinese Academy of Sciences; University of Chinese Academy of Sciences, China
- School of Life Science and Technology, ShanghaiTech University, China
- Key Laboratory of Synthetic Biology, CAS Center for Excellence in Molecular Plant Sciences, Shanghai Institute of Plant Physiology and Ecology, Chinese Academy of Sciences; University of Chinese Academy of Sciences, China
Figures
Figure 1 with 1 supplement
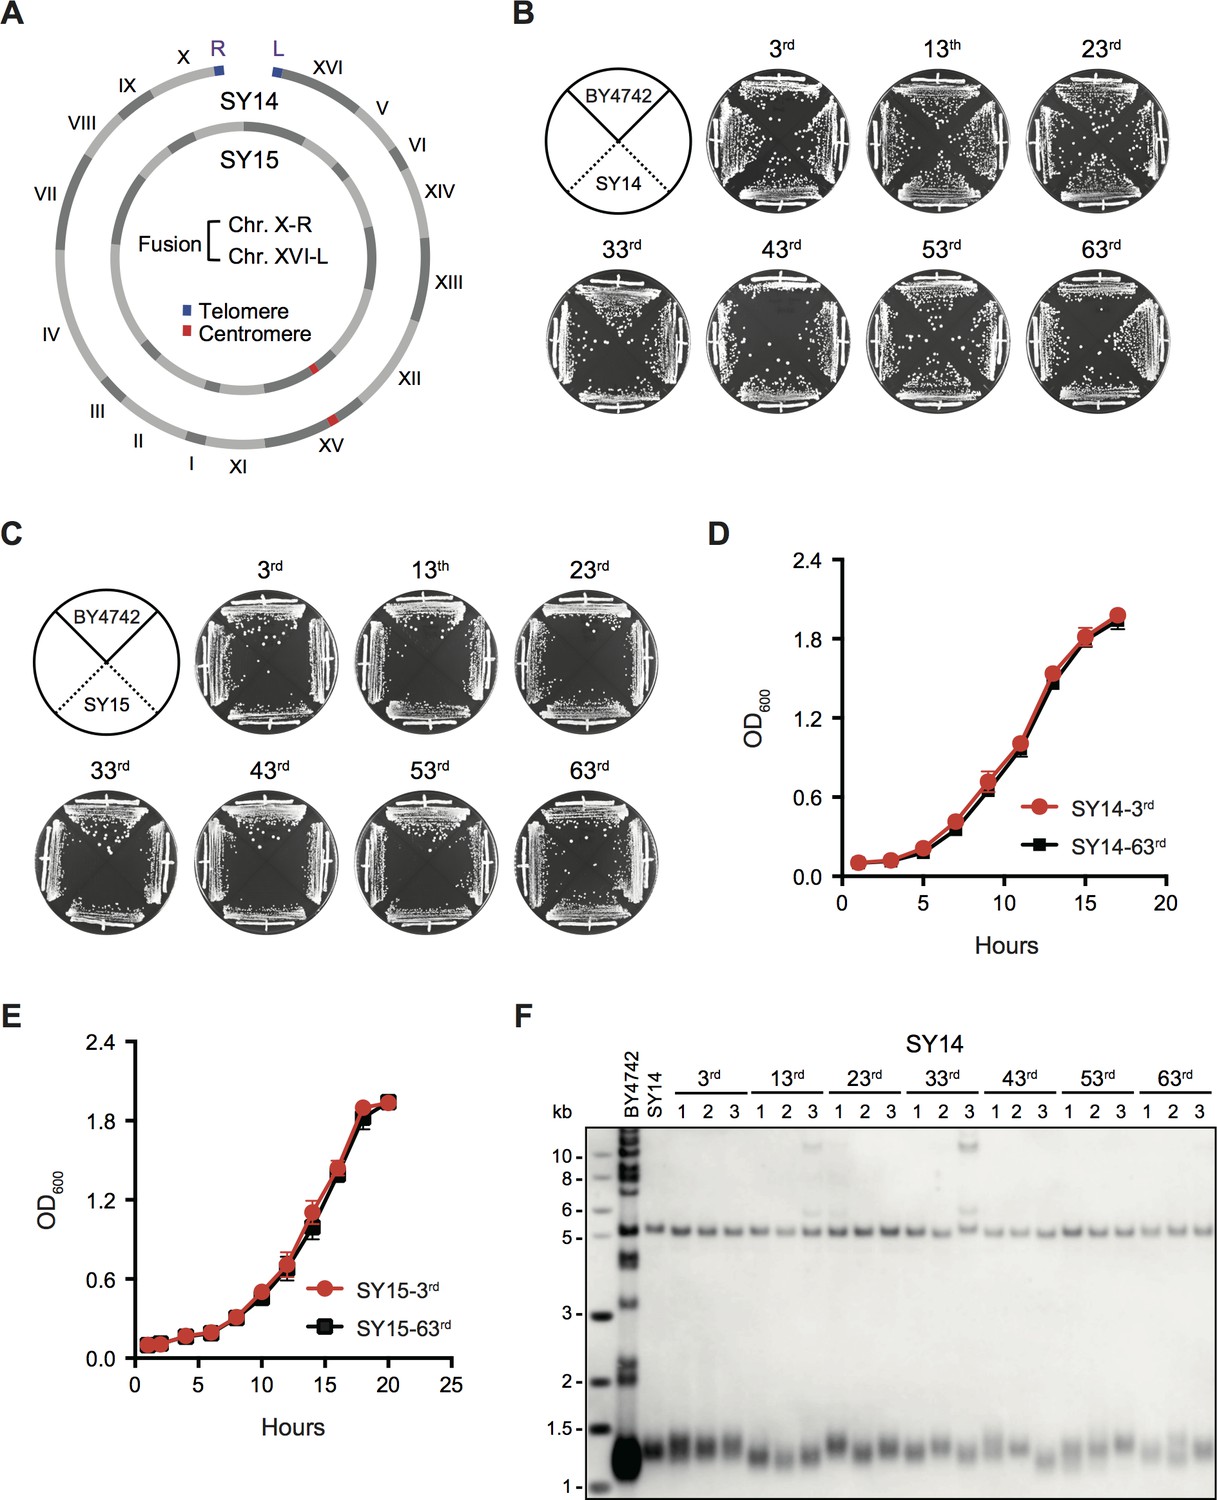
Successive passages of single-chromosome yeast strains SY14 and SY15 do not display growth change.
(A) Schematic of single chromosome structure in yeast strains SY14 and SY15. Single linear and circular chromosomes of the SY14 and SY15 strains are respectively aligned in the outer and inner rings. The single circular chromosome of SY15 lacks telomeres of Chr X-R and Chr XVI-L in SY14. (B,C) Growth analysis of the SY14 (B) and SY15 (C) strains. Several clones of the SY14 and SY15 strains were re-streaked on YPD plates 63 times at intervals of two days. (D,E) Growth curves of the SY14 (D) and SY15 (E) clones at the 3rd and 63rd re-streaks. Error bars represent standard deviation (s.d.), n = 3. (F) Telomere southern blotting assay of the SY14 cells at different passages (labeled on top). At each passage, three independent clones were examined. The genomic DNA of the SY14 cells was digested by XhoI and subjected to Southern hybridization with a telomere-specific TG1–3 probe.
-
Figure 1—source data 1
Growth analysis of the SY14 and SY15 clones at the 3rd and 63rd re-streaks.
- https://cdn.elifesciences.org/articles/53144/elife-53144-fig1-data1-v1.xlsx
Figure 1—figure supplement 1
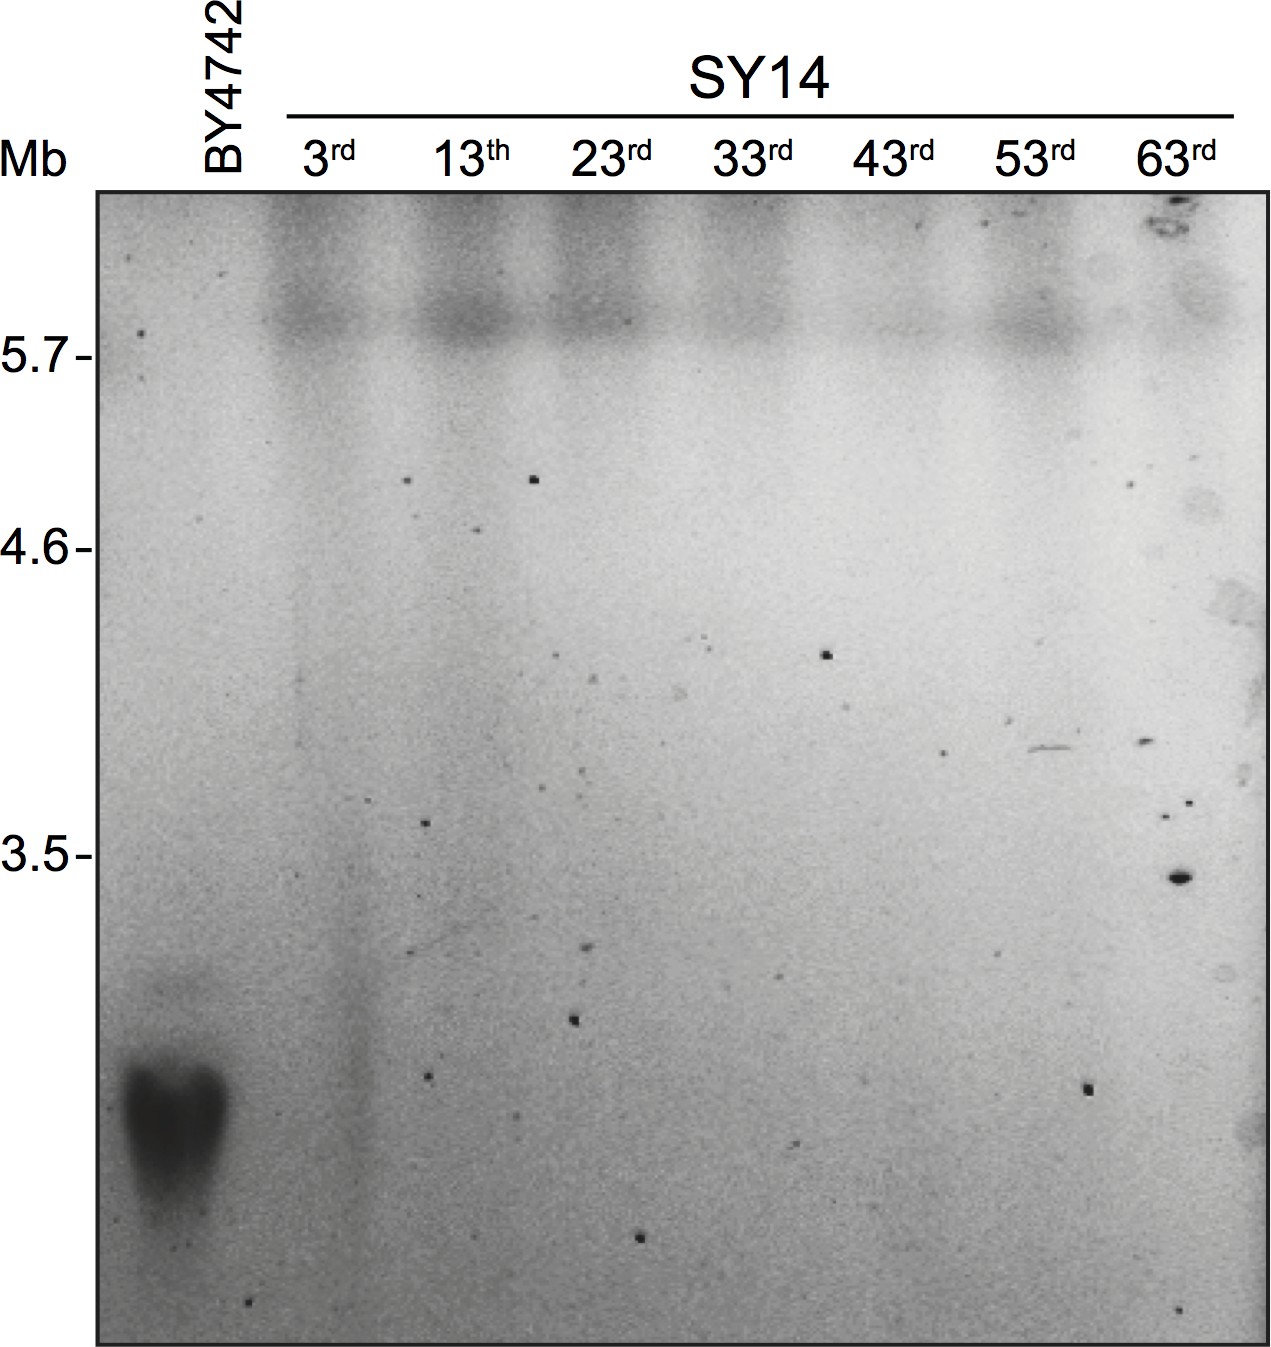
The single chromosome in SY14 remains intact during the passages.
Fresh clones of the SY14 strain at different re-streaks (labeled on top) were inoculated into YPD and cultured overnight at 30°C, and pulsed-field gel electrophoresis (PFGE) analysis was performed. Wild-type strain BY4742 is a control.
Figure 2 with 2 supplements
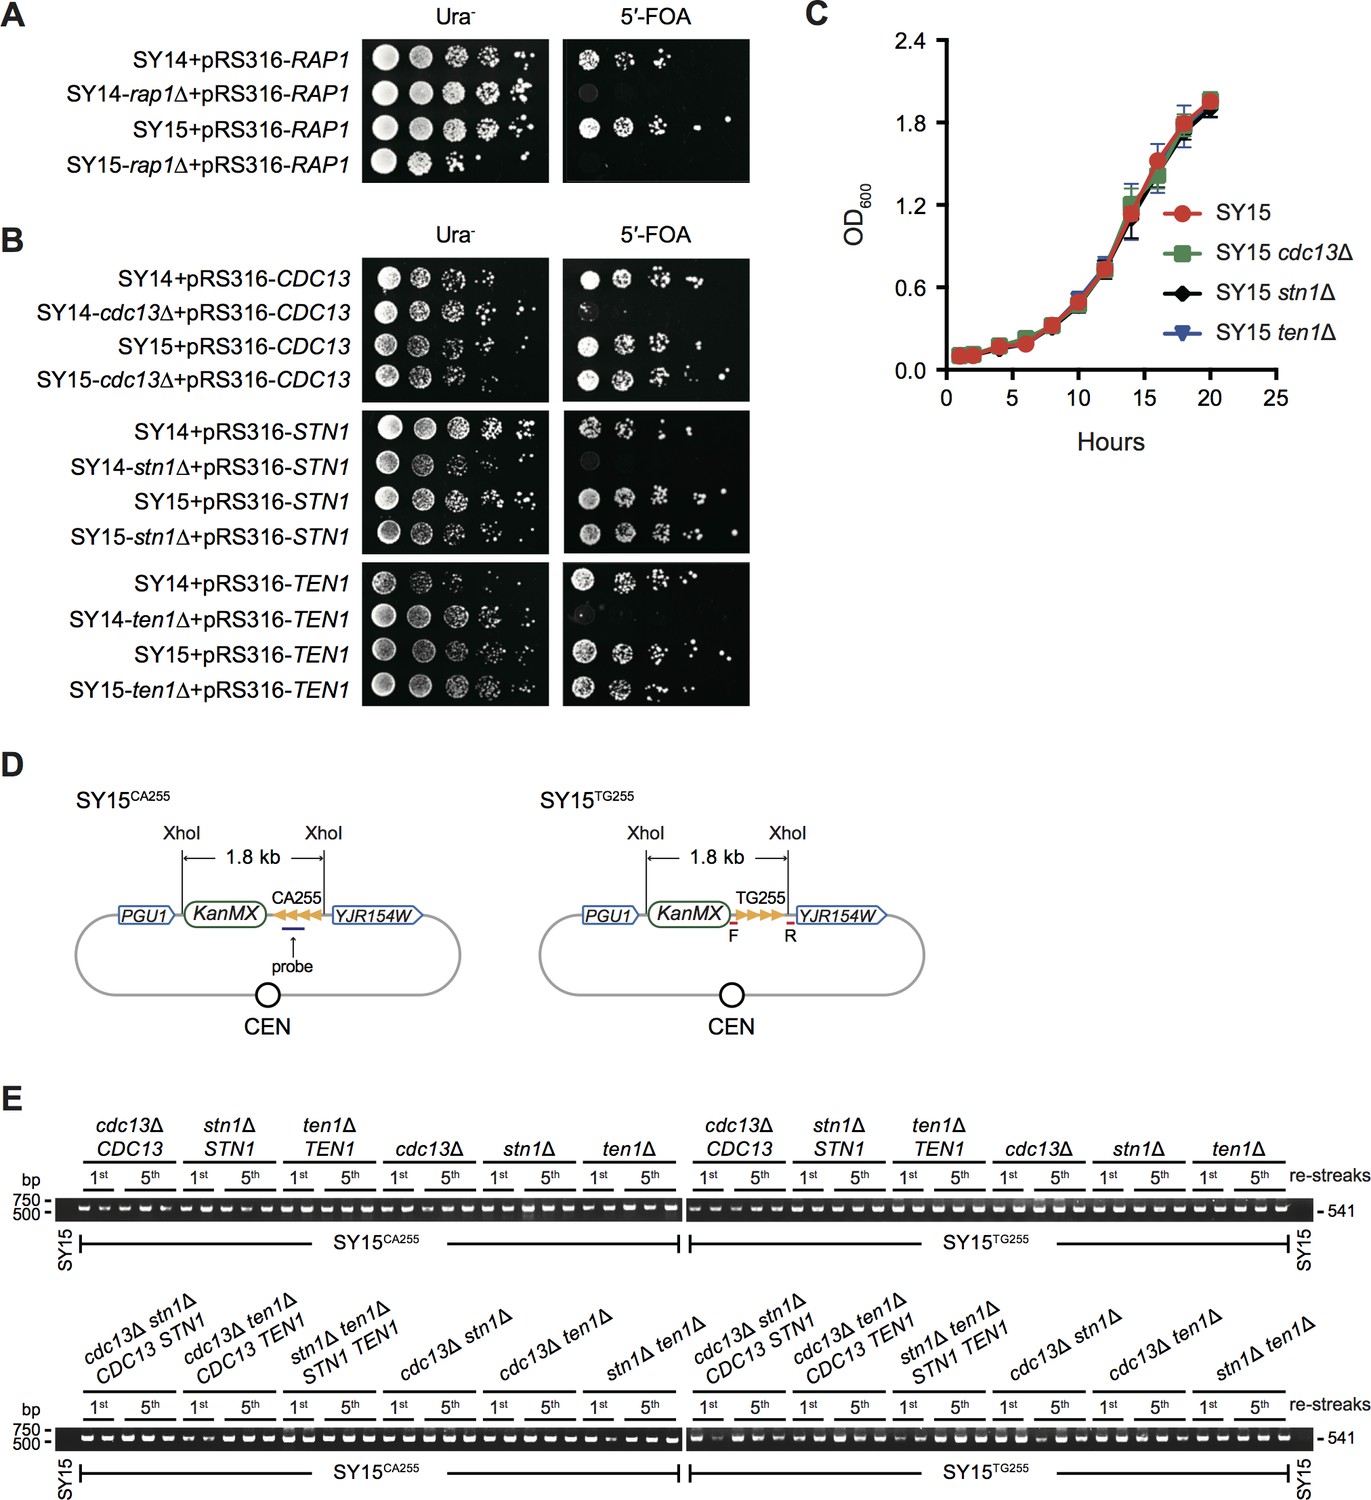
CST complex is not essential in single-circular-chromosome yeast strain SY15.
(A) Growth analysis of rap1Δ mutants. SY14 rap1Δ RAP1 and SY15 rap1Δ RAP1 cells were spotted with five-fold dilutions on Ura- medium (left panel) to select for the presence of pRS316-RAP1 plasmid, and on 5′-FOA medium (right panel) to select for eviction of pRS316-RAP1 plasmid. (B) Cell growth assay of cdc13Δ, stn1Δ and ten1Δ cells. SY14 cdc13Δ CDC13, SY15 cdc13Δ CDC13, SY14 stn1Δ STN1, SY15 stn1Δ STN1, SY14 ten1Δ TEN1 and SY15 ten1Δ TEN1 cells were spotted with five-fold dilutions on Ura- medium (left panel) to select for the presence of pRS316 plasmids that contained a wild-type CST gene, and on 5′-FOA medium (right panel) to select for eviction of pRS316 plasmids. (C) Growth analysis of SY15 cdc13Δ, SY15 stn1Δ and SY15 ten1Δ cells. Three clones of each strain were examined. Error bars represent standard deviation (s.d.), n = 3. (D) Schematic representation of TG255/CA255 sequence insertion in the genomic loci of SY15CA255 and SY15TG255 strains. In single-circular-chromosome yeast SY15, a 255 bp telomeric sequence in both orientations (named CA255 or TG255, tandem orange triangles) is inserted between the PGU1 and YJR154W genes. The TG probe for Southern blotting (Figure 2—figure supplement 1) and primer pairs for PCR-sequencing (E) are indicated in purple and red, respectively. The KanMX gene serves as a genetic marker for the integration of the telomeric tracts. The XhoI sites are used for restriction digestion in Southern blotting examining the insertions, which were ~1.8 kb in both SY15CA255 and SY15TG255 strains. This figure is not precisely drawn to scale. (E) Analysis of non-terminal telomere sequences by PCR. SY15CA255 and SY15TG255 strains (indicated at the bottom of each panel) were passaged on plates five times at intervals of two days. The genomic DNA was isolated from the 1st and 5th re-streaks (labeled at the top of each panel). Primers (5’-TCGACATCATCTGCCCAGAT-3’ and 5’-AGTTCGAACTAGGGTAATTG-3’) were used to amplify the DNA fragments flanking inserted telomeric sequence, and the PCR products were examined on agarose gels. Two or three independent clones of each genotype were examined.
-
Figure 2—source data 1
Growth analysis of the SY15 cdc13Δ, SY15 stn1Δ and SY15 ten1Δ cells.
- https://cdn.elifesciences.org/articles/53144/elife-53144-fig2-data1-v1.xlsx
Figure 2—figure supplement 1
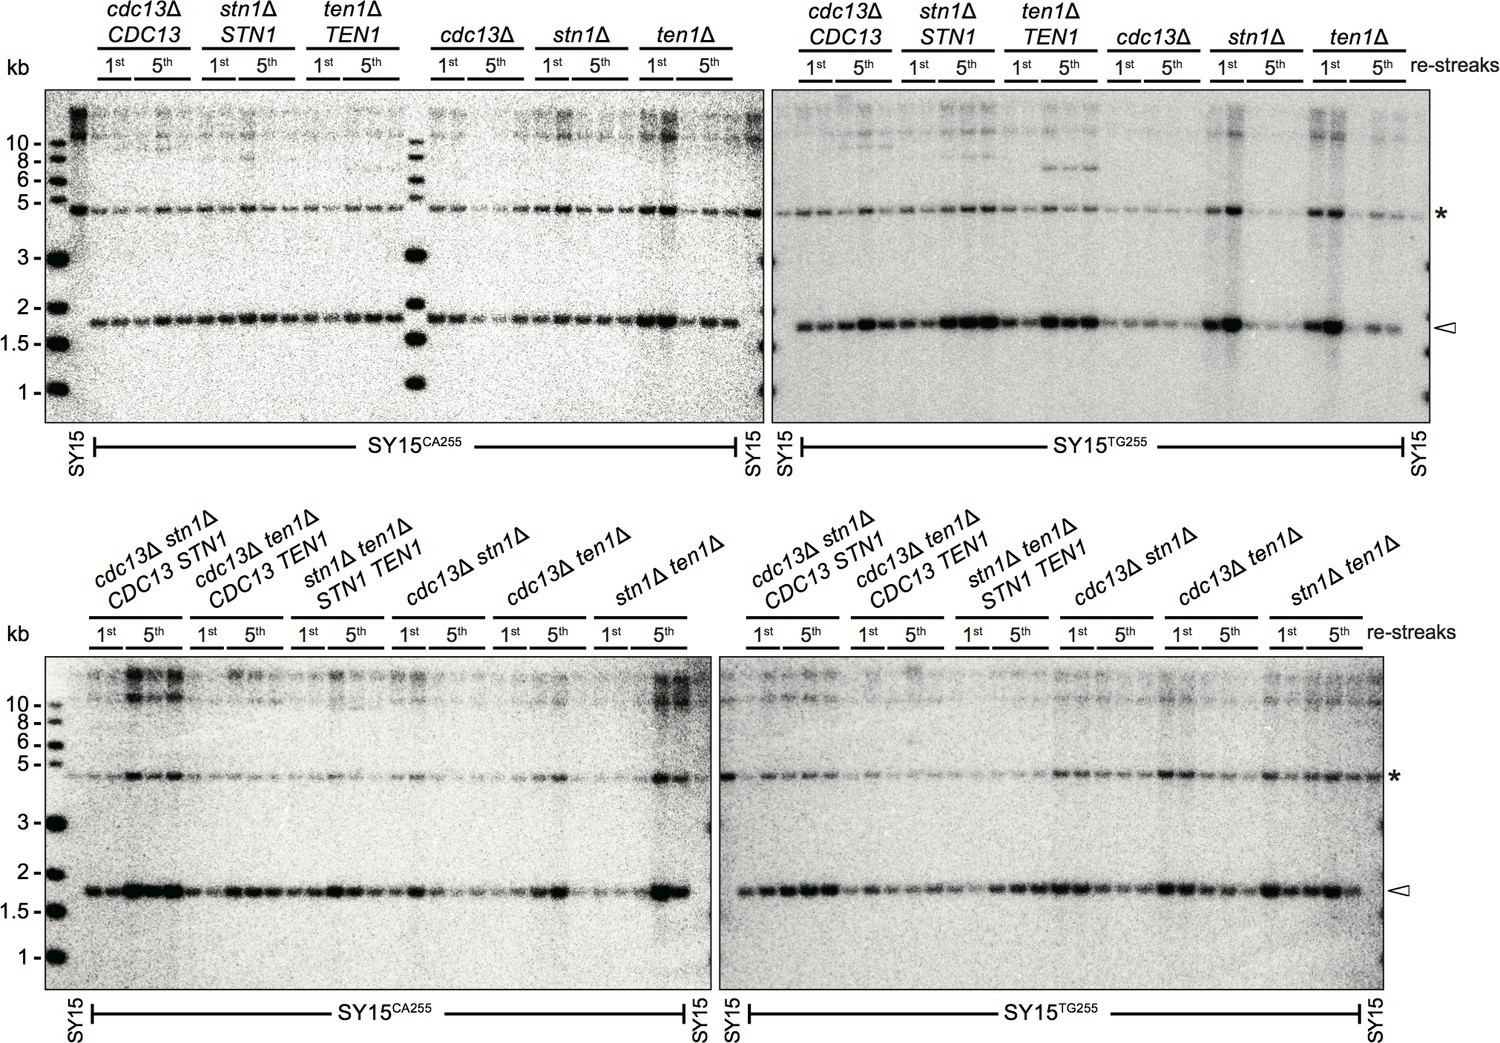
Southern blotting to determine the insertion of TG255/CA255 sequence in SY15CA255 and SY15TG255 strains.
SY15CA255 and SY15TG255 strains (labeled at the top of each panel) were passaged on plates five times at intervals of two days. The genomic DNA was isolated from the 1st and 5th re-streaks (labeled at the top of each panel), and digested by XhoI and subjected to a Southern blotting analysis using a TG1-3 probe. At each passage, two or three independent clones were examined. The arrow at right indicates insertion and asterisk marks a non-specific band.
Figure 2—figure supplement 2
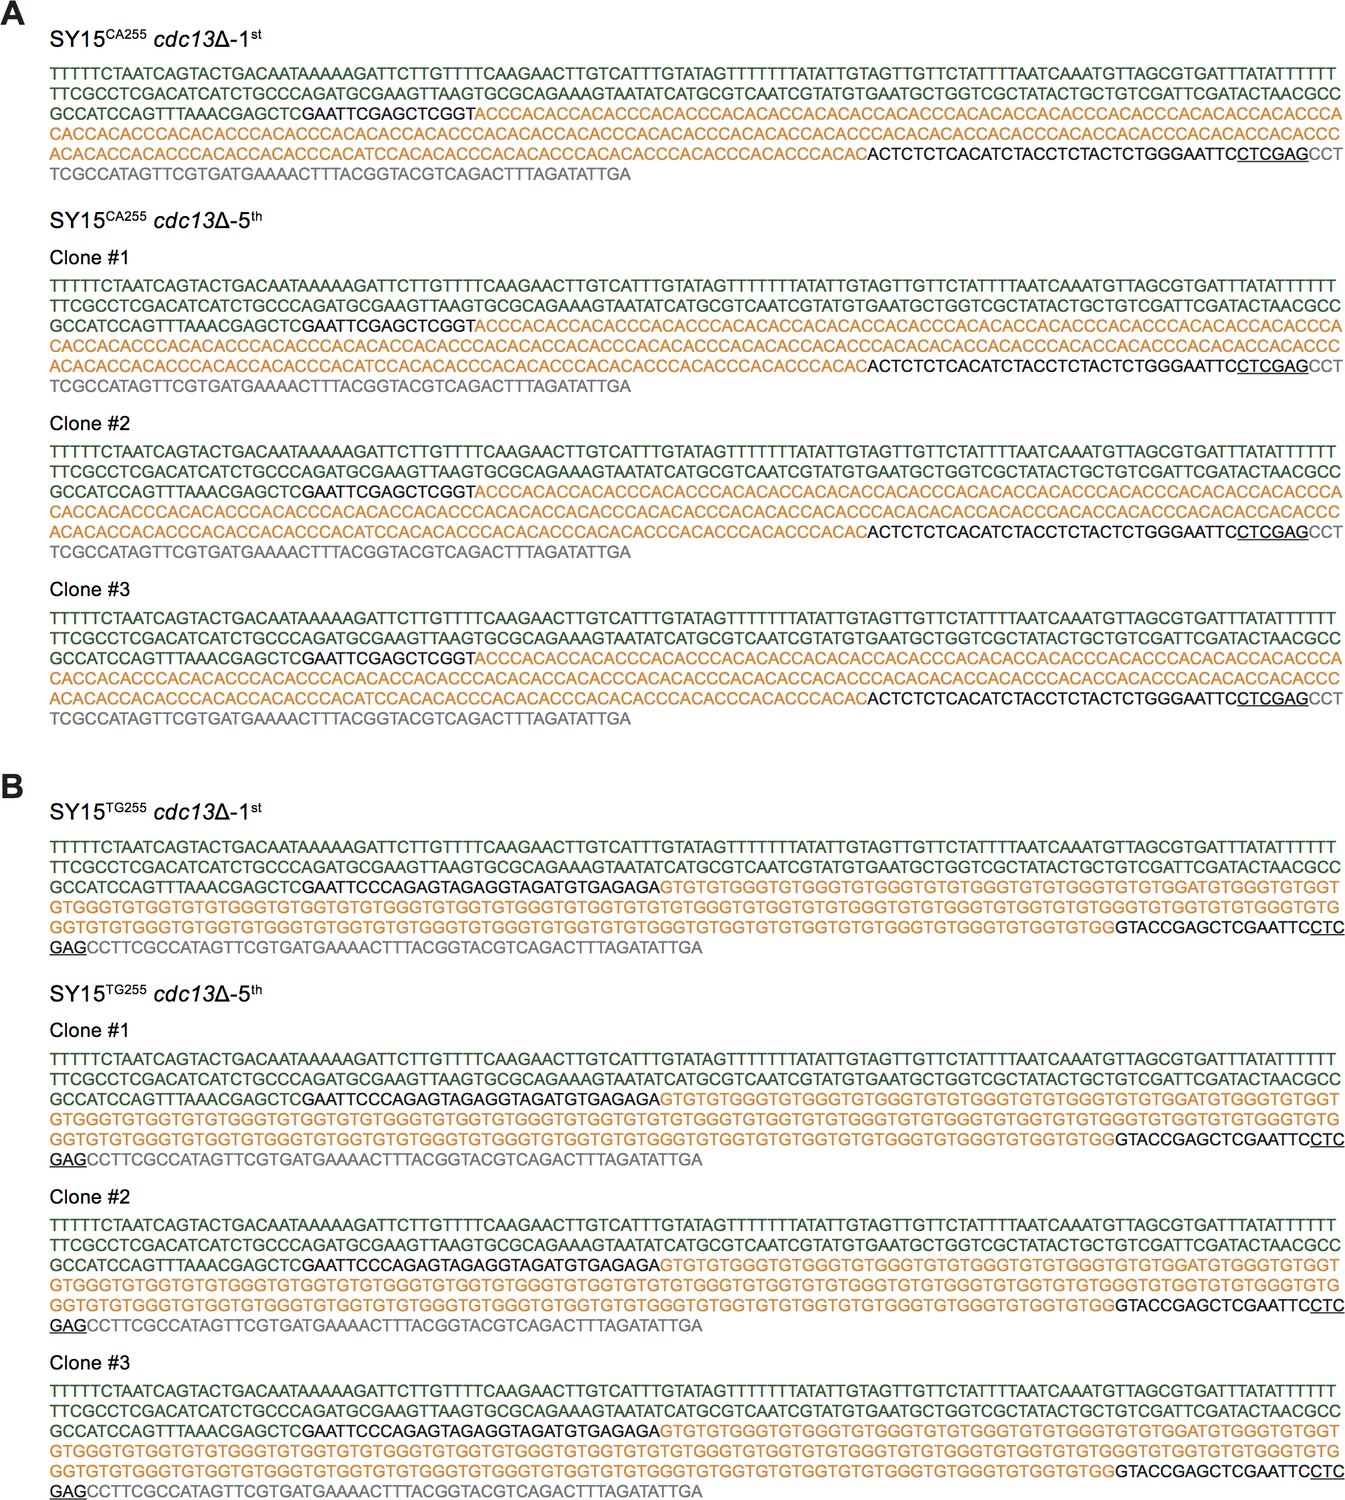
The full sequences of the clones of SY15CA255 cdc13Δ (A) and SY15TG255 cdc13Δ (B) cells at different passages were shown as representatives.
The sequences comprise part of the KanMX marker (in green), a 255 bp telomeric tracts (in orange) and the upstream sequence of gene YJR154W (in grey). The XhoI restriction site is underlined. All the sequences of insertions in the progenies of either SY15CA255 cstΔ or SY15TG255cstΔ mutants are the same, indicating that they are very stable. Thus other results are omitted.
Figure 3 with 4 supplements
Survivors of SY14 cdc13Δ mutant contain a circularized chromosome.
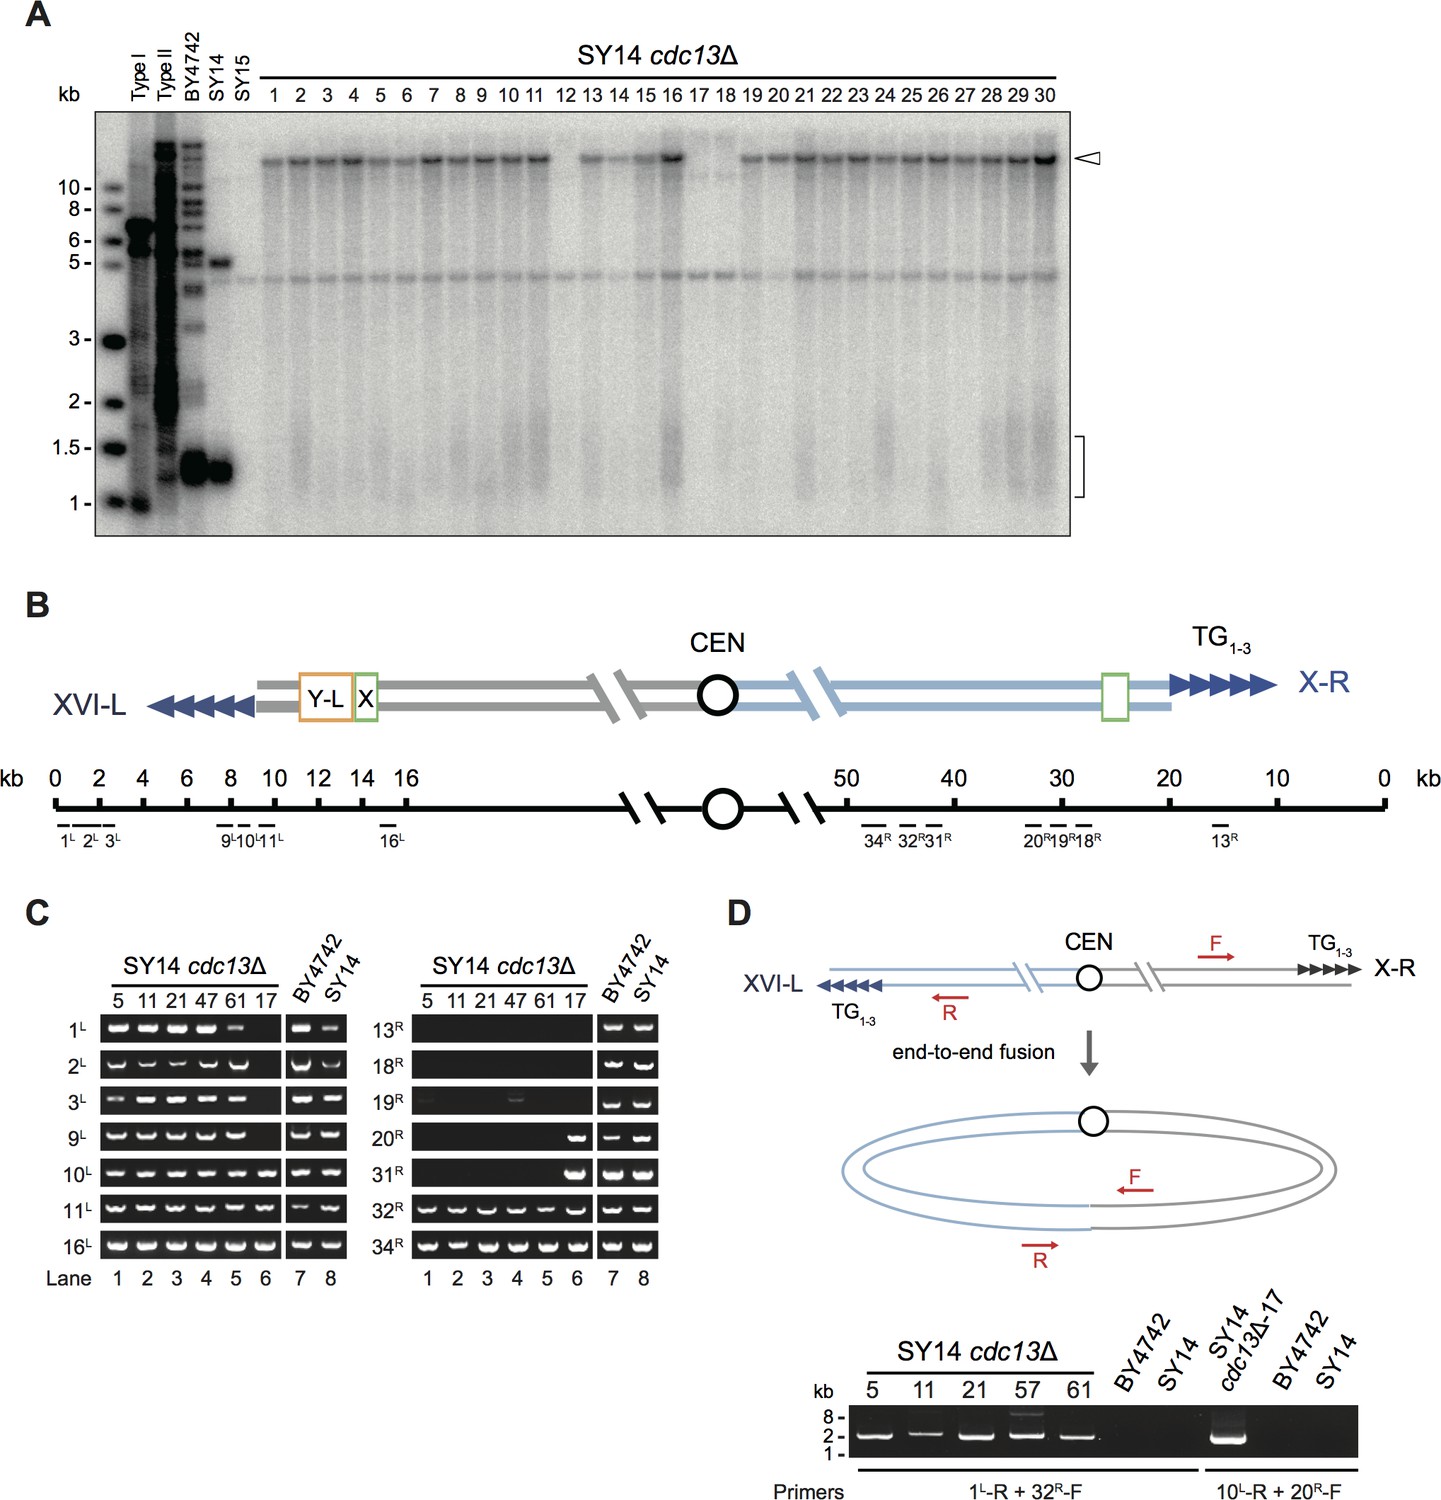
(A) Telomere Southern blotting analysis. 30 independent SY14 cdc13Δ colonies (labeled on top) were randomly picked, and their DNA was subjected to a telomere Southern blotting analysis to examine telomere structure. The bracket indicates Y′ telomere signals and the open arrowhead indicates the band of ~15 kb emerged in most of the clones except clones 12, 17 and 18. (B) Schematic representation of two chromosome arms of XVI-L and X-R in SY14 strain. Boxes in light green and yellow adjacent to telomeres (tandem blue triangles) represent subtelomeric X element and Y′-L element respectively. The numbers above the schematic line (chromosome) indicate the distance to the corresponding telomeric TG1-3 sequences of XVI-L and X-R (not in precise scale). Black bars labeled 1 L-16L or 13 R-34R (under the schematic line) indicate the position of PCR primers that were used to examine either chromosomal end erosion. (C) Examples of PCR mapping results that define the borders of telomere erosion in SY14 cdc13Δ survivors. The primer pairs (shown in (B)) are indicated on left in each panel. The clone numbers of SY14 cdc13Δ are indicated on top in each panel. Primer sequences are listed in Supplementary file 1. (D) PCR examination of chromosome end-to-end fusion. Different pairs of primers (indicated at the bottom) were used to amplify the DNA fragments flanking the fusion points. The clone numbers of SY14 cdc13Δ are indicated on top.
Figure 3—figure supplement 1
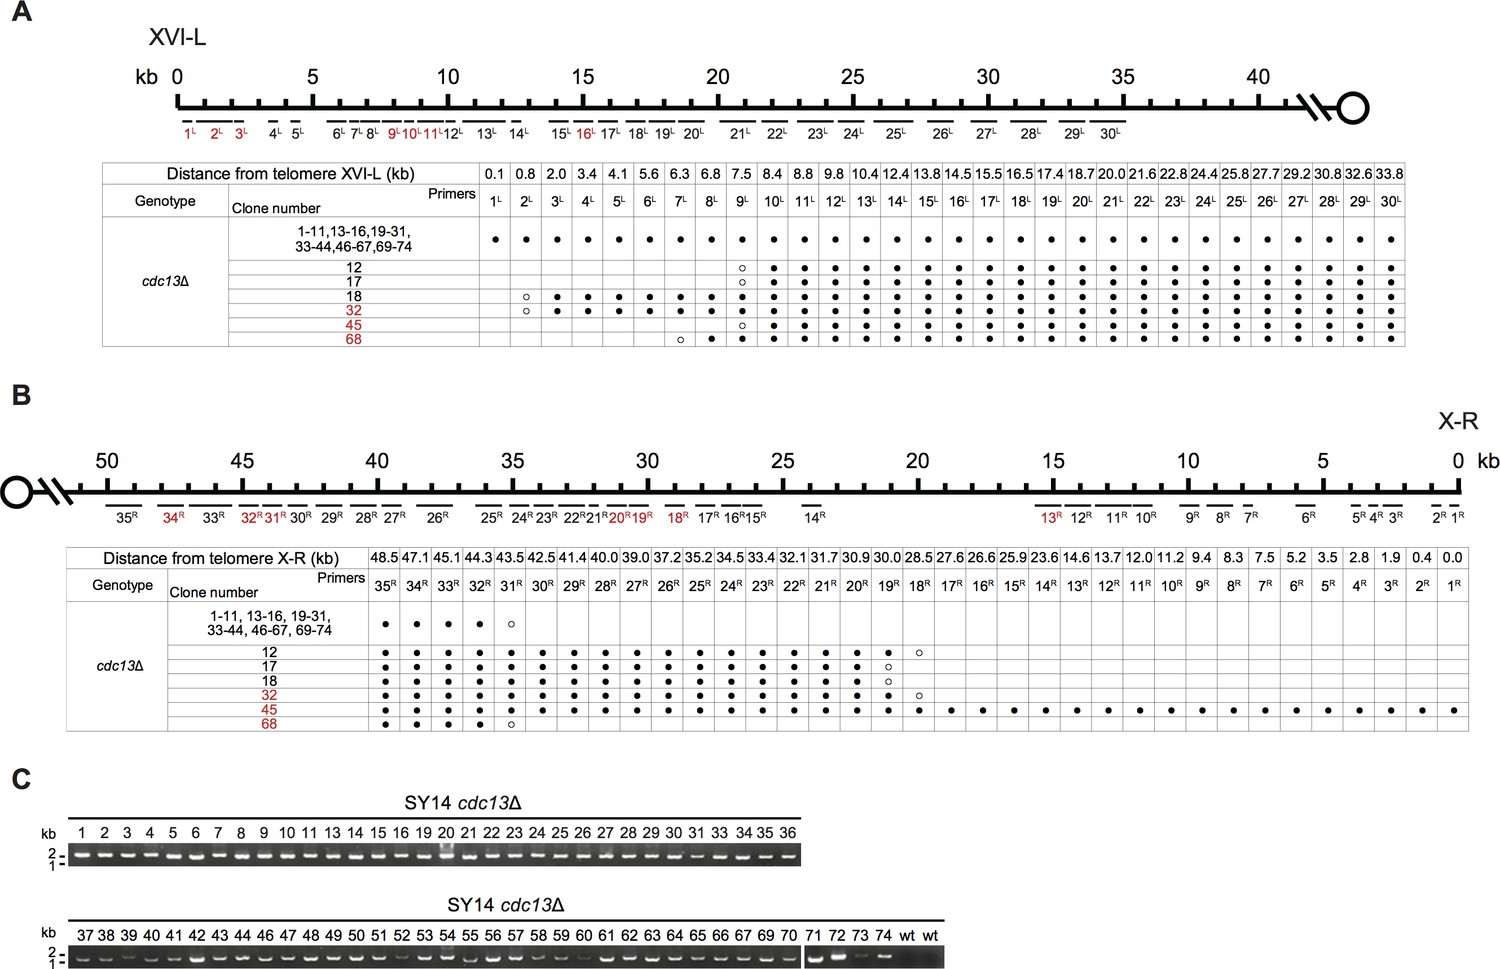
Borders of erosion and rTG Type of SY14 cdc13Δ survivors are defined by mapping and PCR amplification.
(A) Upper panel, schematic diagram of the subtelomeric region of 0–40 kb proximal to Chr XVI-L telomeric TG1-3 sequence is shown. Primer pairs (No. 1L to 30L) are aligned and indicated at their corresponding subtelomeric loci. Lower panel, all 74 clones of SY14 cdc13Δ survivors are listed on left, primer pairs are listed on top, primers in red are primer pairs used in Figure 3B; solid circles mean positive PCR products, and open circles mean no PCR products with corresponding primer pairs. The clone numbers in red are not-identified (NI) survivors. (B) Upper panel, schematic diagram of the subtelomeric region of 0–50 kb proximal to Chr X-R telomeric TG1-3 sequence is shown. Primer pairs (No. 1R to 35R) are aligned and indicated at their corresponding subtelomeric loci. Lower panel, all 74 clones of SY14 cdc13Δ survivors are listed on left, primer pairs are listed on top, primers in red are primer pairs used in Figure 3B; solid circles mean positive PCR products, and open circles mean no PCR products with corresponding primer pairs. The clone numbers in red are not-identified (NI) survivors. (C) Primer pairs of 1 L-R and 32 R-F were used to amplify the DNA fragments flanking the fusion points in SY14 cdc13Δ survivors. PCR products were examined on agarose gels. The genotype and clone numbers were indicated on top.
Figure 3—figure supplement 2
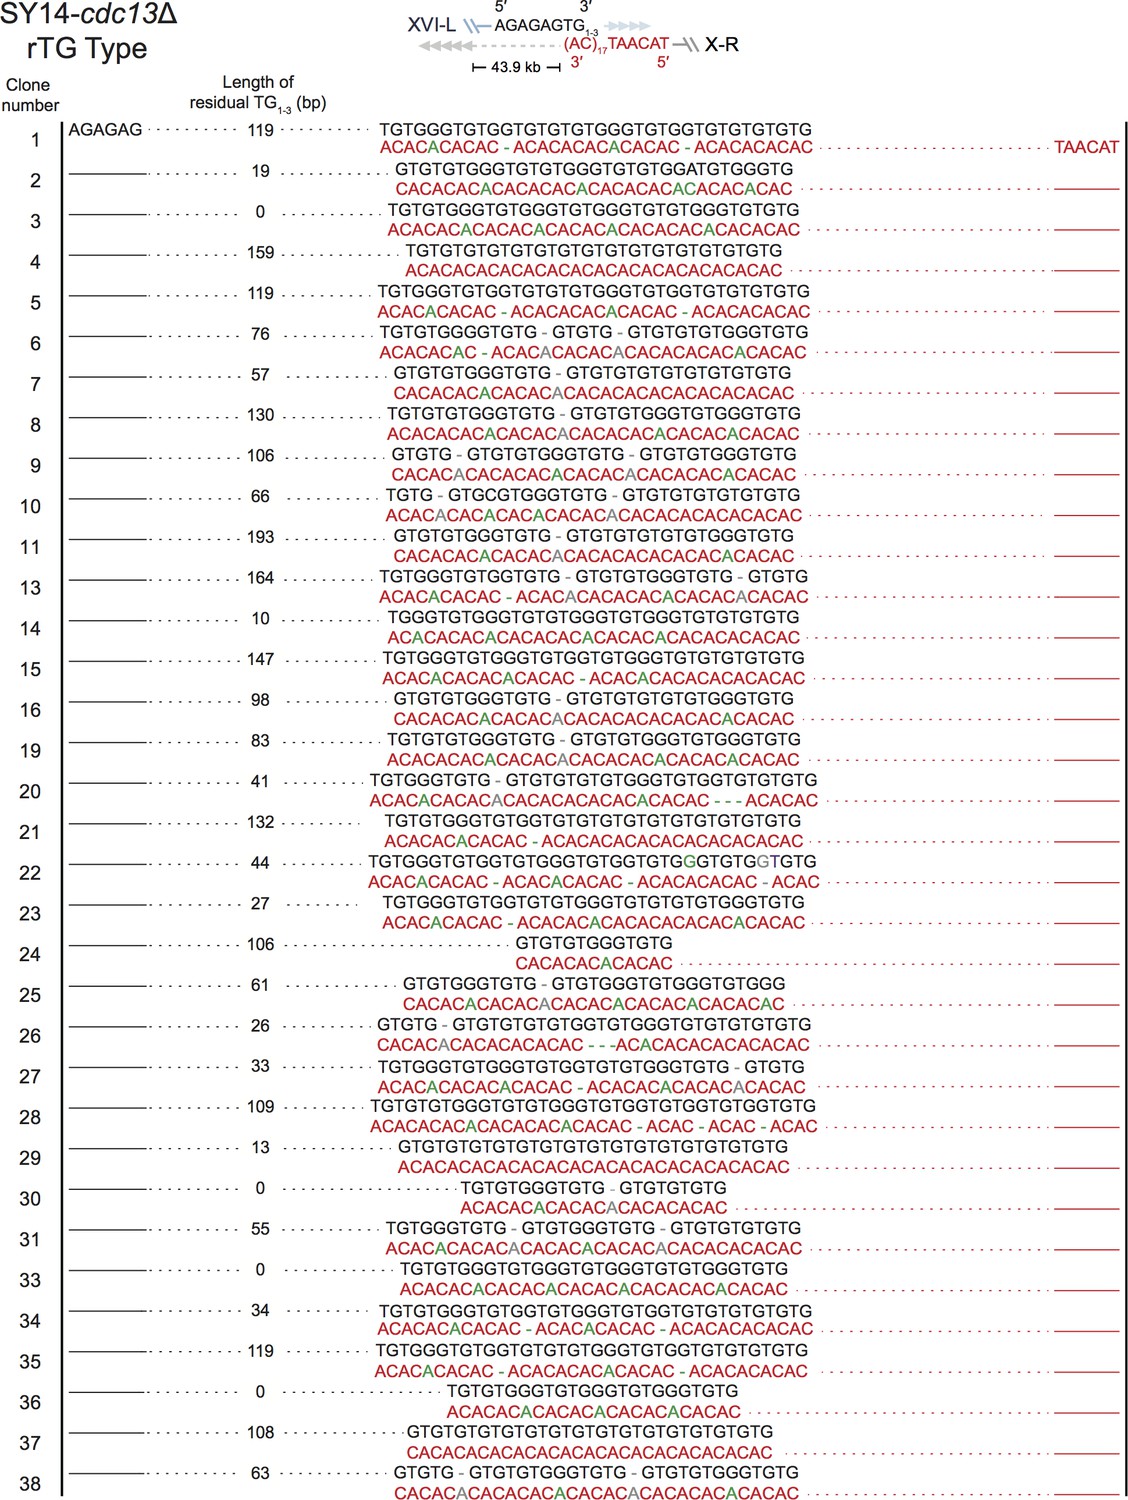
Fusion junctions in most SY14 cdc13Δ survivors contain TG sequences (rTG Type).
The sequences at the junction of 68 independent clones (labeled on left) of SY14 cdc13Δ survivors are determined: Figure 3—figure supplement 2, clone 1 to 38; Figure 3—figure supplement 3, clone 39-74. Top panel depicts the fusion points of rTG Type survivors. In each clone, sequence in black indicates the sequence of Chr XVL-L, sequence in red indicates the sequence of Chr X-R, bases in green are mis-paired, bases in grey or dashes are deleted. In each clone, the length of the residual TG1-3 sequence proximal to junction point of Chr XVI-L is also shown.
Figure 3—figure supplement 3
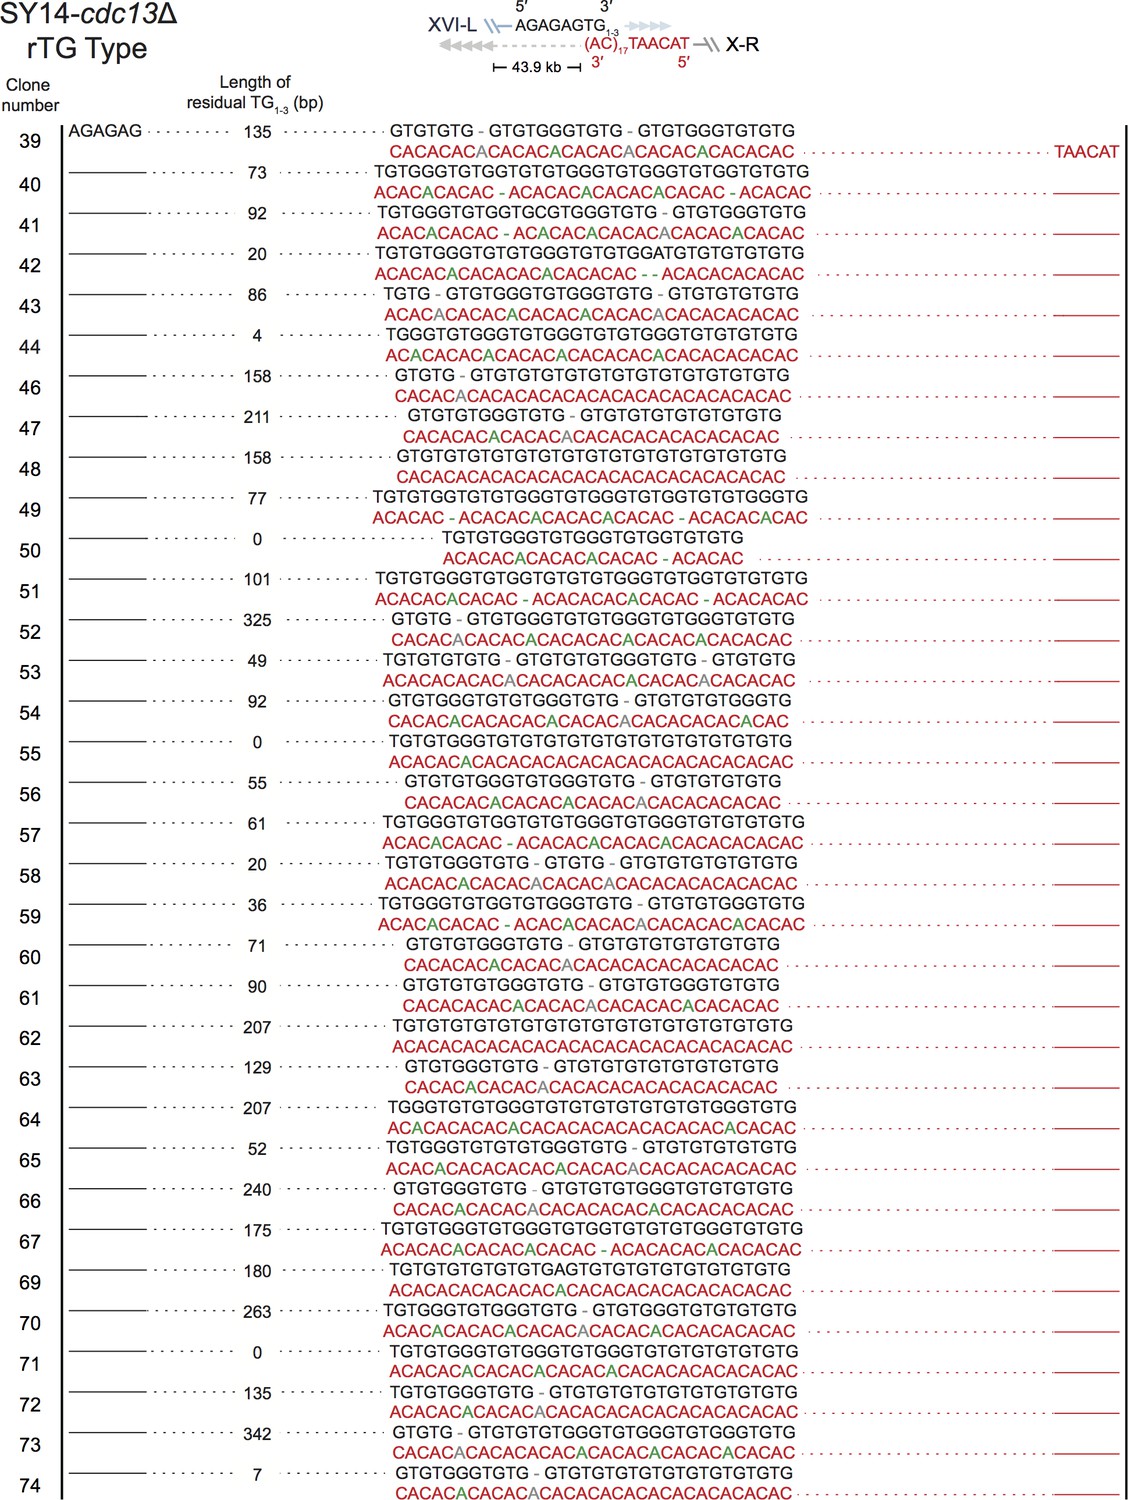
Fusion junctions in most SY14 cdc13Δ survivors contain TG sequences (rTG Type).
Figure 3—figure supplement 4
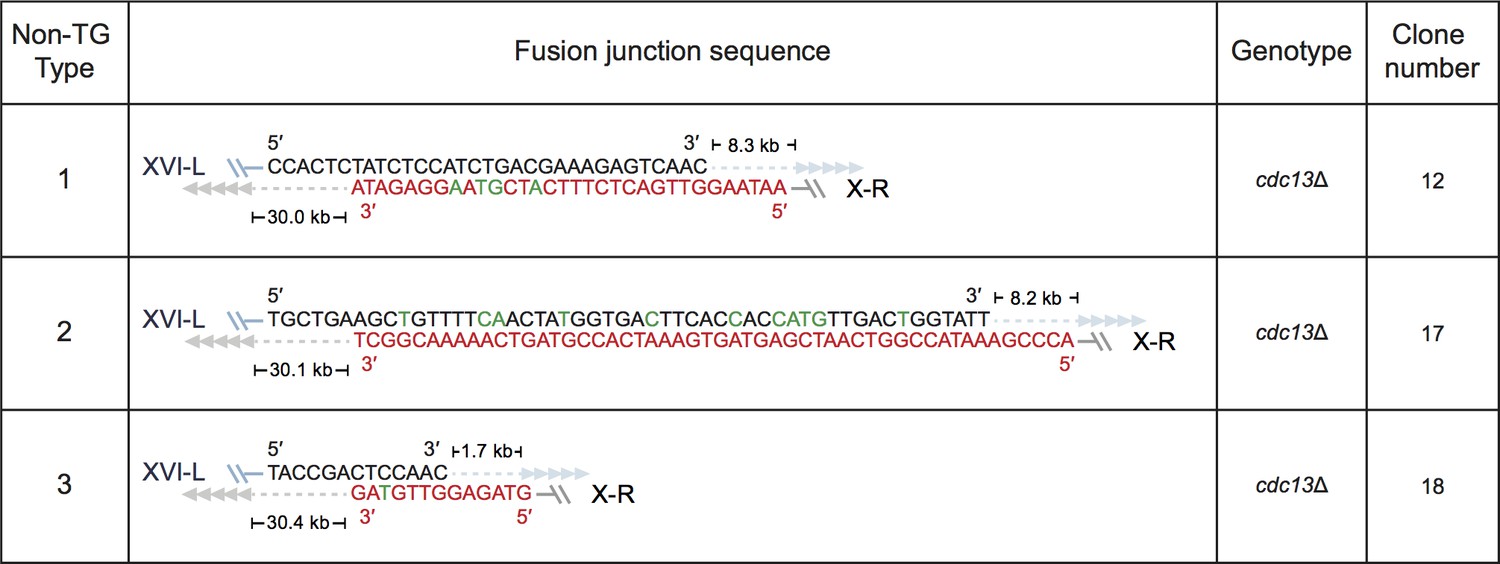
Fusion junction sequences of non-TG Type survivors derived from SY14 cdc13Δ mutants.
The genotype and clone numbers are listed on right. Sequences at the fusion junctions of three independent clones are shown. According to the fusion sequences, they were be classified into three types (listed on left).
Figure 4 with 4 supplements
Chromosome fusion of SY14 cdc13Δ cells is nearly eliminated in the absence of Rad52.
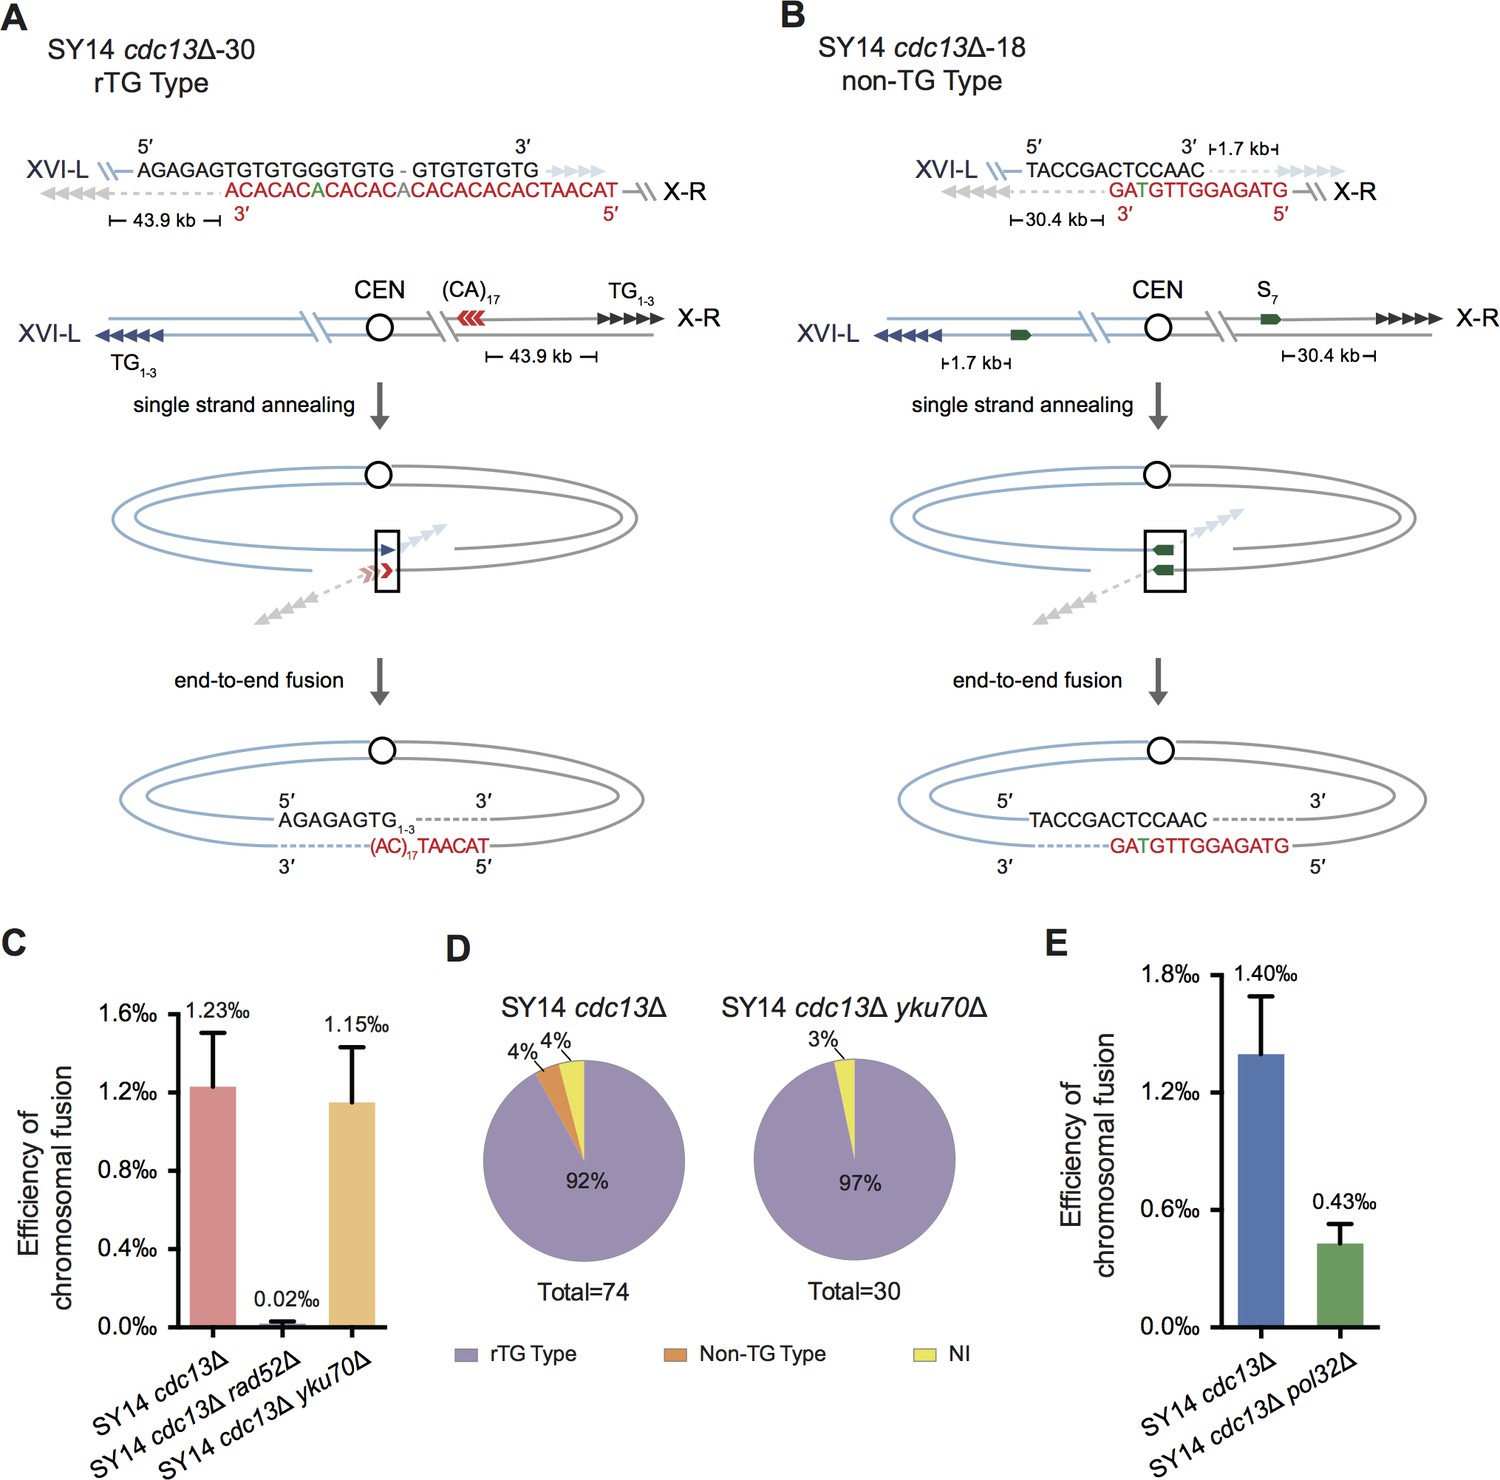
(A) Schematic of rTG Type survivors in SY14 cdc13Δ. In SY14 cdc13Δ clone 30, the fusion region of TG1-3 sequence (in black) is in Chr XVI-L, and the (CA)17 region (in red) locates 43.9 kb away from of Chr X-R. Bases in green are mis-paired, bases in grey or dashes are deleted. (B) Schematic of non-TG Type survivors in SY14 cdc13Δ. In SY14 cdc13Δ clone 18, the fusion sequence of CTCCAAC (in black) is 1.7 kb away from Chr XVI-L telomere, and the fusion sequence of GTTGTAG (in red) is 30.4 kb away from of Chr X-R telomere. Bases in green are mis-paired. (C) Quantification of survivor generation rates of SY14 cdc13Δ (1.23‰), SY14 cdc13Δ rad52Δ (0.02‰) and SY14 cdc13Δ yku70Δ (1.15‰) cells. Error bars represent standard deviation (s.d.), n = 3. (D) Percentage of rTG Type, non-TG Type and not-identified (NI) survivors in SY14 cdc13Δ (n = 74) and SY14 cdc13Δ yku70Δ (n = 30) strains. (E) Quantification of survivor generation rates of SY14 cdc13Δ (1.40‰) and SY14 cdc13Δ pol32Δ (0.43‰) cells. Error bars represent standard deviation (s.d.), n = 3.
-
Figure 4—source data 1
Quantification of survivor generation rates of SY14 cdc13Δ, SY14 cdc13Δ rad52Δ, SY14 cdc13Δ yku70Δ and SY14 cdc13Δ pol32Δ cells.
- https://cdn.elifesciences.org/articles/53144/elife-53144-fig4-data1-v1.xlsx
-
Figure 4—source data 2
NHEJ efficiency of SY14, SY14 lig4Δ and SY14 yku70Δ strains.
- https://cdn.elifesciences.org/articles/53144/elife-53144-fig4-data2-v1.xlsx
Figure 4—figure supplement 1
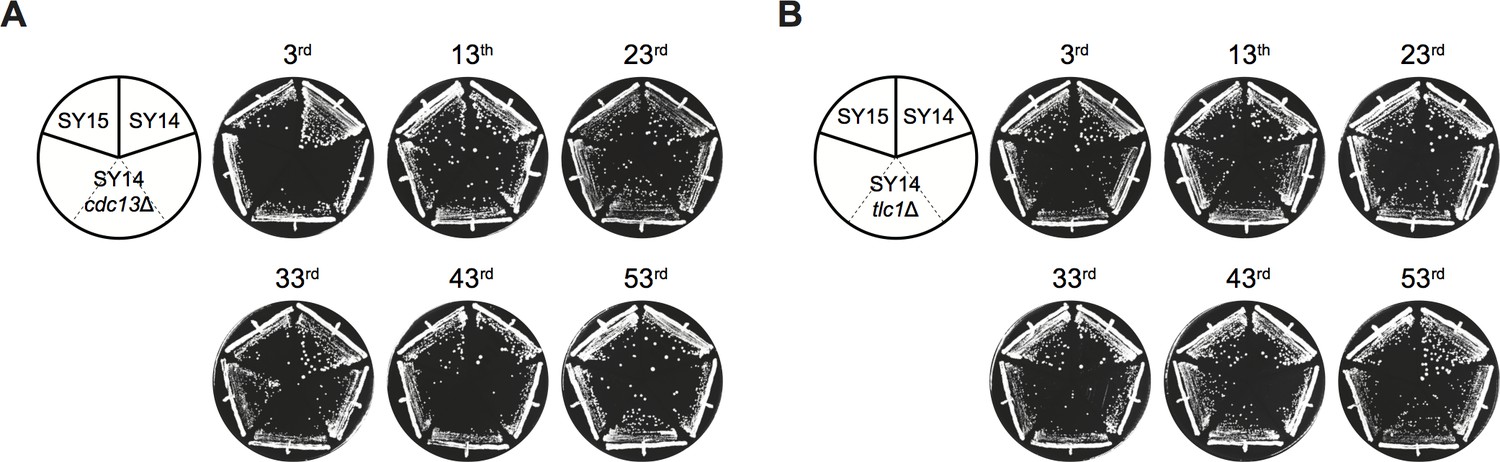
Survivors harboring circular chromosome maintain a stable genome.
Growth analysis of SY14 cdc13Δ (A) and SY14 tlc1Δ (B) survivors. A few clones of each strain were re-streaked at intervals of three days on YPD plates for 53 times.
Figure 4—figure supplement 2
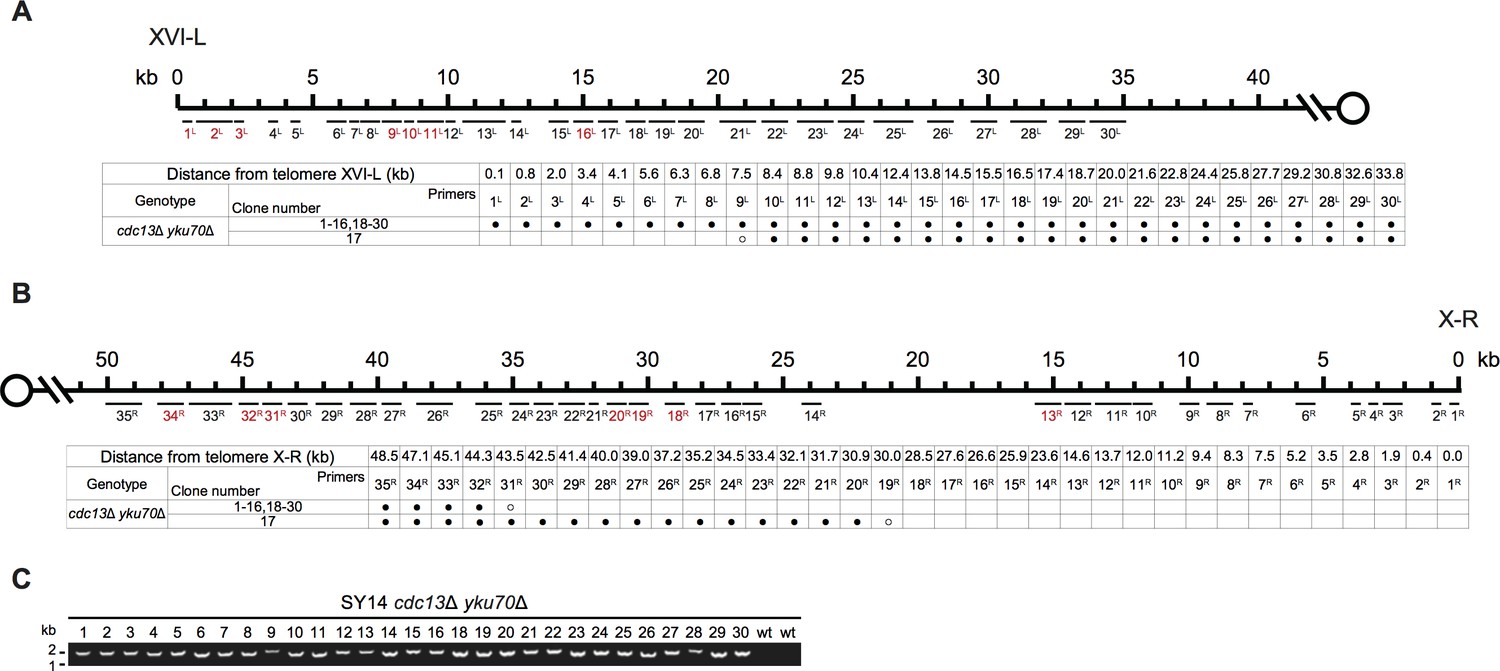
Borders of erosion (A and B) and rTG Type (C) of SY14 cdc13Δ yku70Δ survivors are defined by mapping and PCR amplification.
Figure 4—figure supplement 3
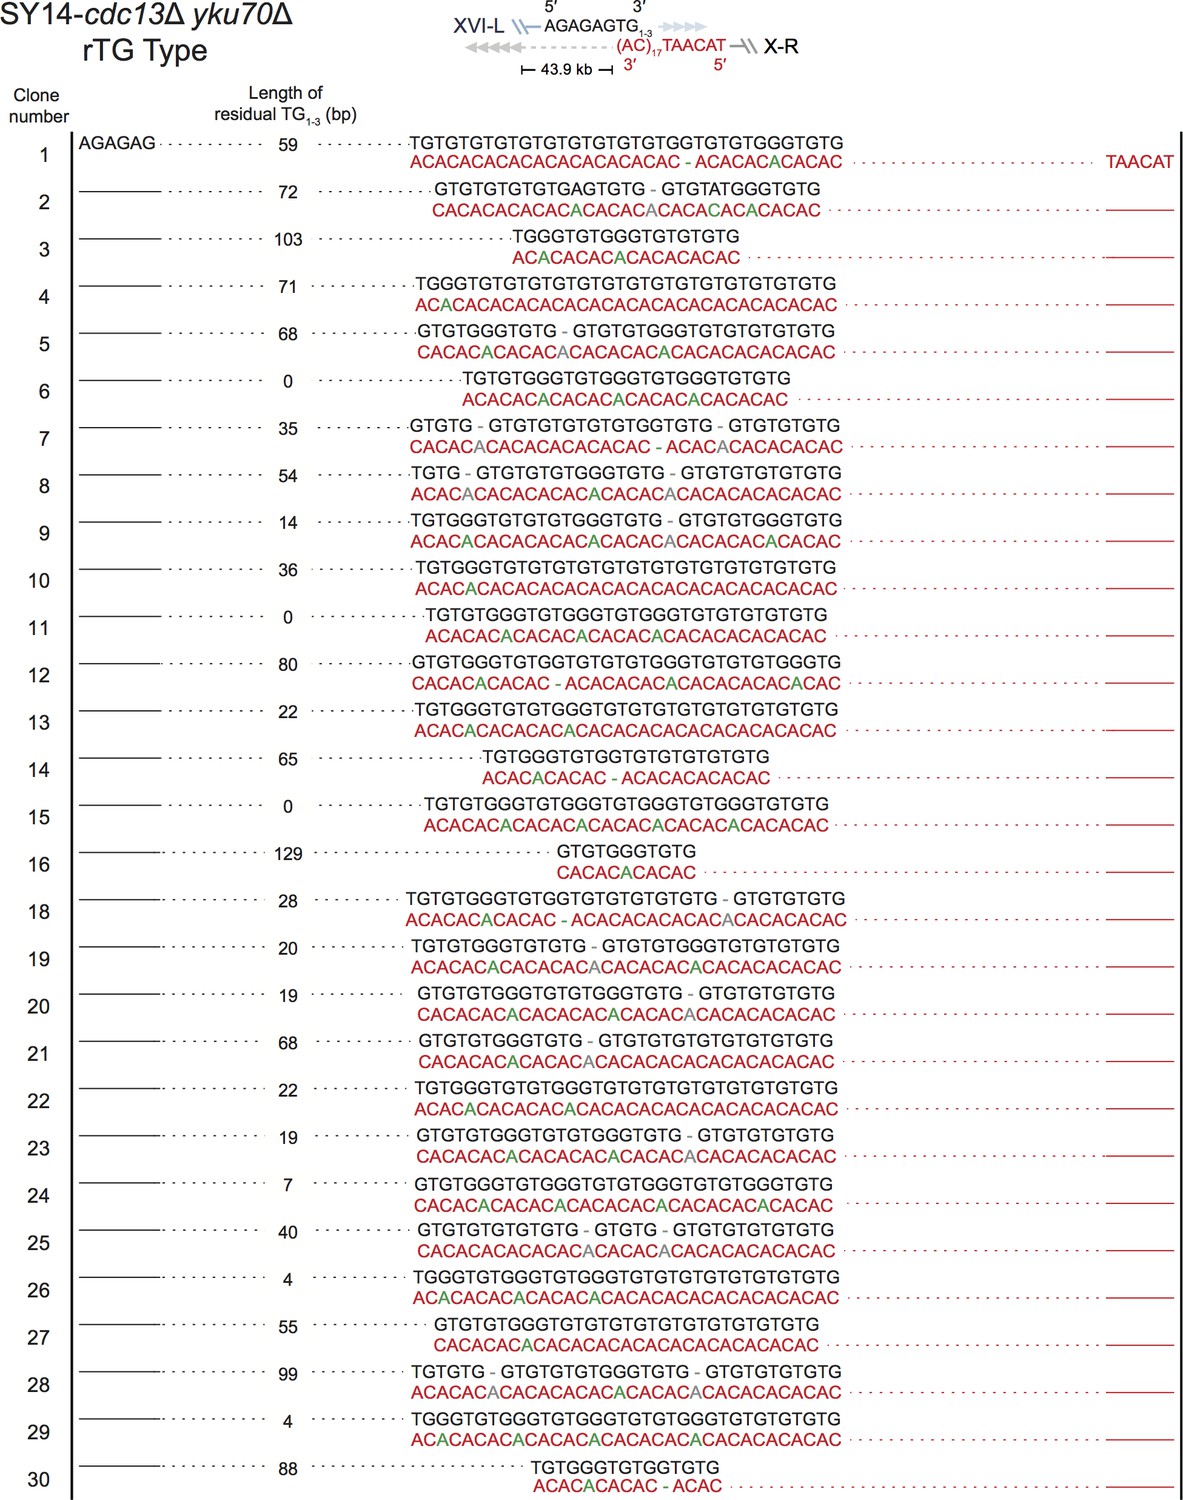
Fusion junctions of rTG Type in SY14 cdc13Δ yku70Δ survivors.
The sequences at the junction of 29 independent clones (labeled on left) of SY14 cdc13Δ yku70Δ survivors are determined. In each clone, the length of the residual TG1-3 sequence proximal to junction point of Chr XVI-L is also shown.
Figure 4—figure supplement 4
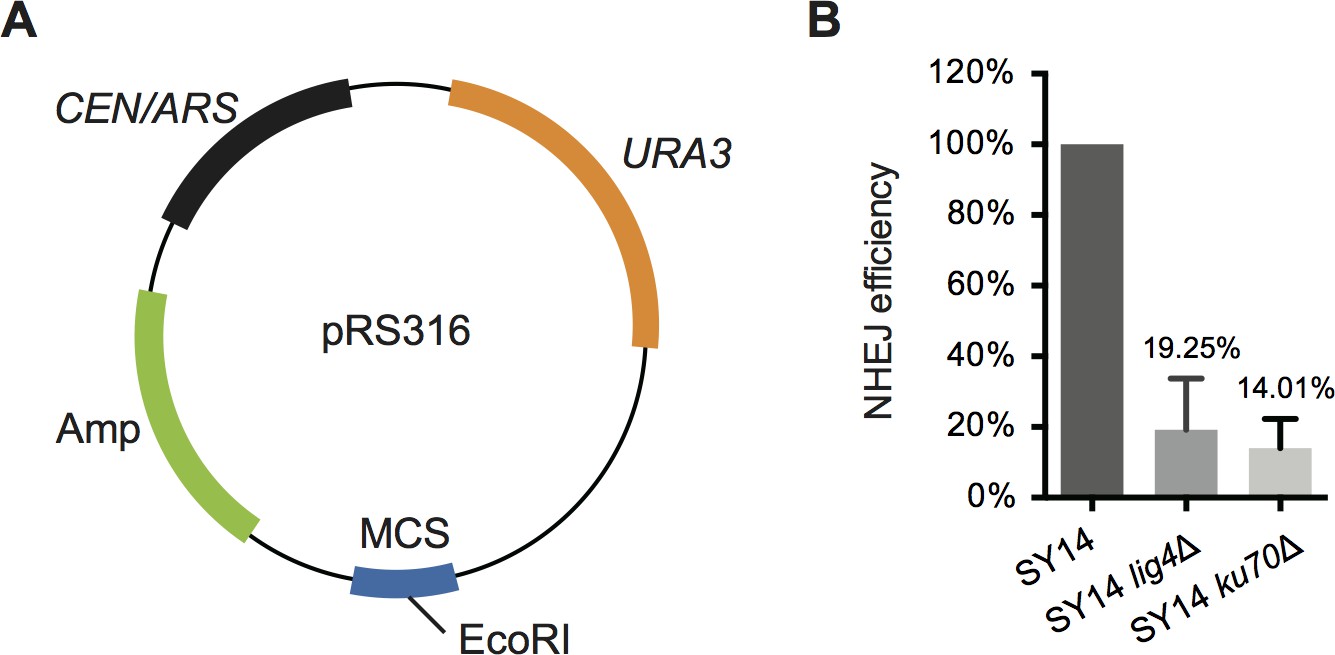
NHEJ pathway is still functional in single-linear-chromosome yeast SY14.
(A) Map of the test plasmid substrate pRS316. The ampicillin marker, CEN/ARS cassette, URA3 marker and the multiple cloning site (MCS) containing EcoRI recognition sites are shown in green, black, orange and blue, respectively. (B) NHEJ efficiency of SY14, SY14 lig4Δ and SY14 yku70Δ strains. Data are the average of three independent experiments normalized to SY14, which was set to 100%. The error bars indicate the standard deviations (s.d.), n = 4.
Figure 5 with 6 supplements

Chromosome fusion frequency in either SY14 stn1Δ or SY14 ten1Δ cells is much lower than that in SY14 cdc13Δ cells.
(A) Quantification of survivor generation rates of SY14 cdc13Δ (1.14‰), SY14 stn1Δ (0.04‰) and SY14 ten1Δ (0.04‰) cells. Error bars represent standard deviation (s.d.), n = 3. (B) Percentage of rTG Type, non-TG Type and not-identified (NI) survivors in SY14 stn1Δ (n = 46) and SY14 ten1Δ (n = 43) cells. (C) Quantification of survivor generation rates of SY14 cdc13Δ (1.54‰), SY14 stn1Δ (0.04‰), SY14 ten1Δ (0.07‰), SY14 cdc13Δ stn1Δ (0.39‰) and SY14 cdc13Δ ten1Δ (0.40‰) cells. Error bars represent standard deviation (s.d.), n = 3. (D) Percentage of rTG Type, non-TG Type and not-identified (NI) survivors in SY14 cdc13Δ stn1Δ (n = 35) and SY14 cdc13Δ ten1Δ (n = 35) cells.
-
Figure 5—source data 1
Quantification of survivor generation rates of SY14 cdc13Δ, SY14 stn1Δ, SY14 ten1Δ, SY14 cdc13Δ stn1Δ and SY14 cdc13Δ ten1Δ cells.
- https://cdn.elifesciences.org/articles/53144/elife-53144-fig5-data1-v1.xlsx
Figure 5—figure supplement 1
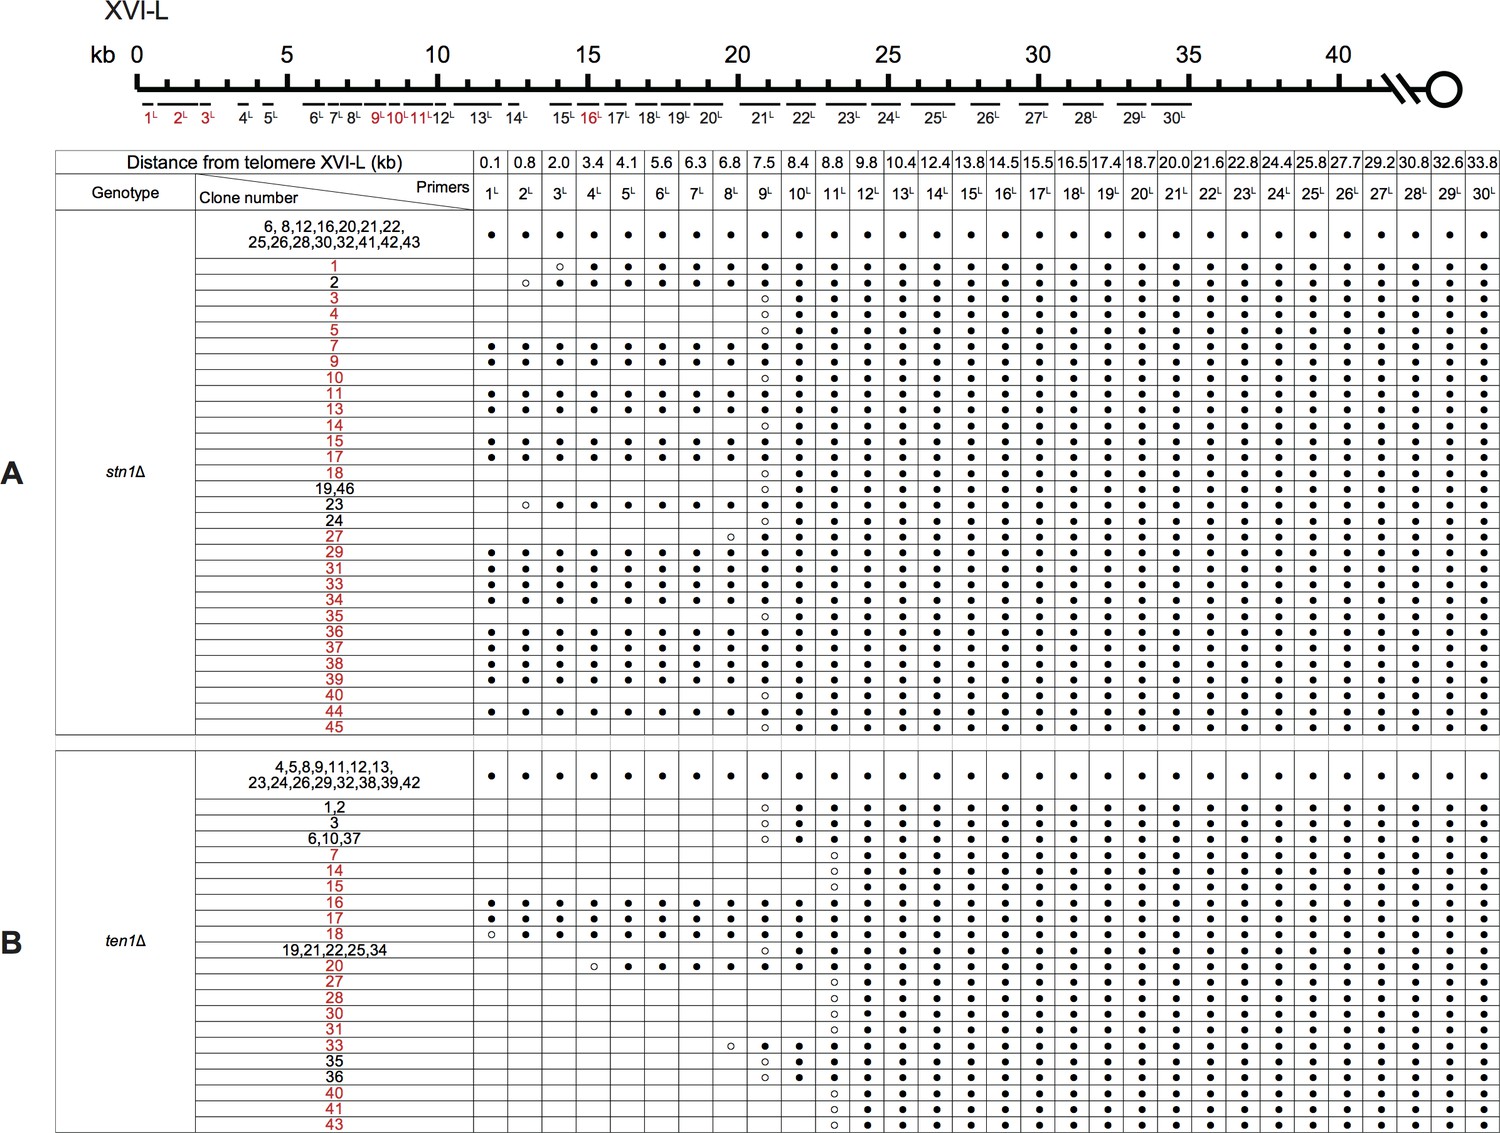
PCR mapping of the borders of Chr XVI-L erosion in SY14 stn1Δ (A) and ten1Δ (B) survivors.
Figure 5—figure supplement 2
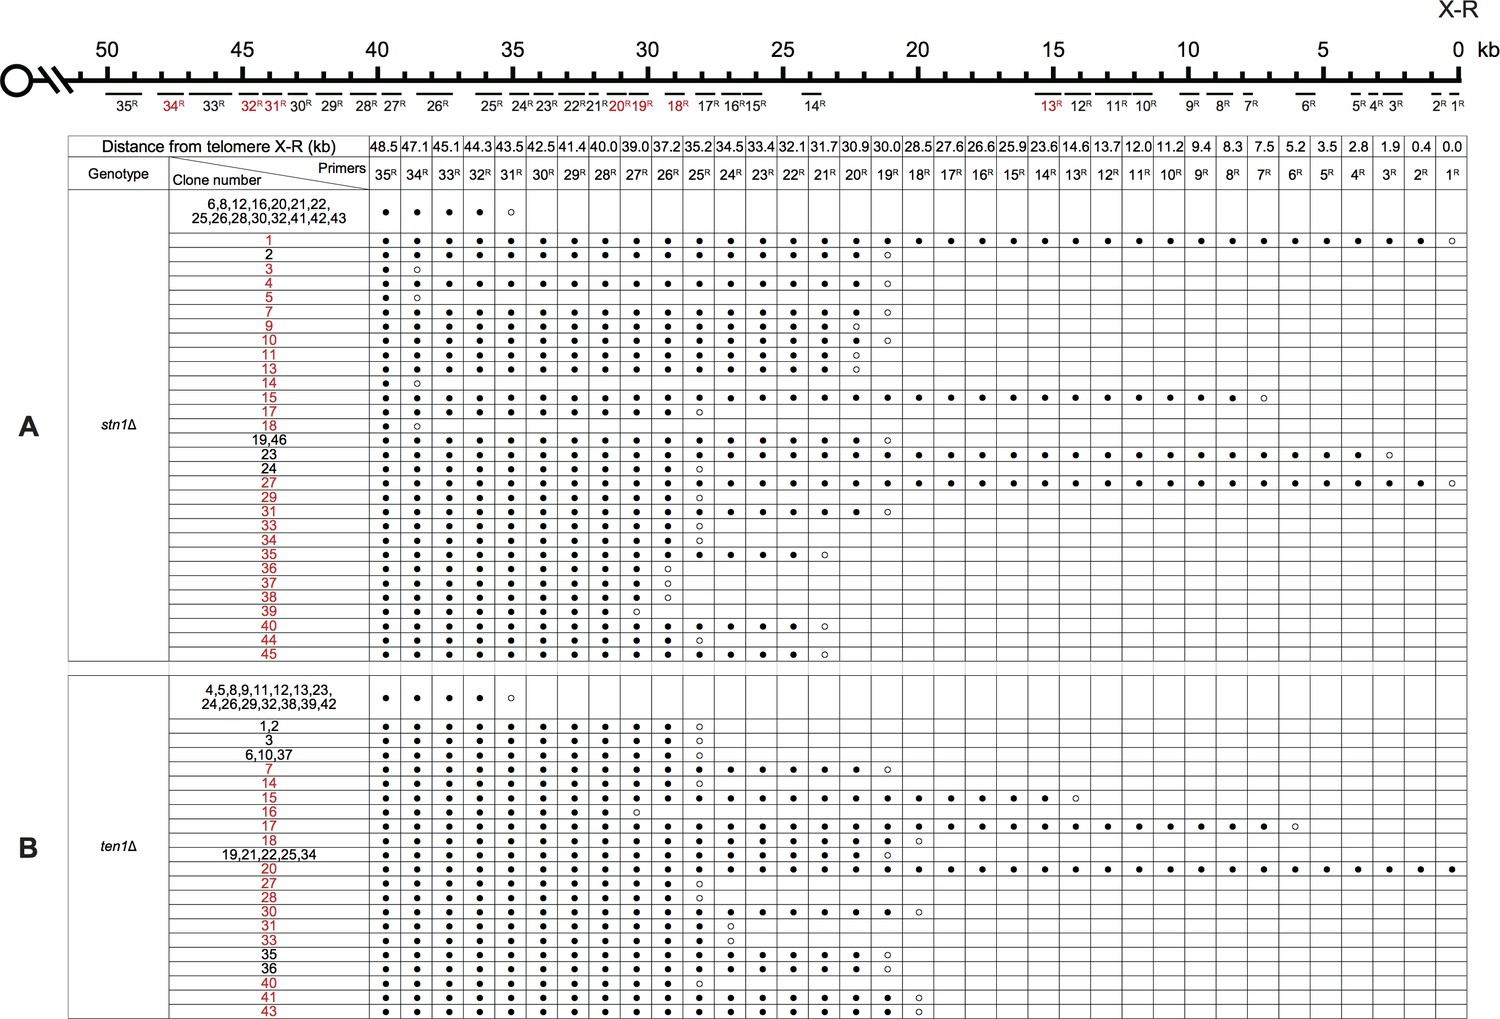
PCR mapping of the borders of Chr X-R erosion in SY14 stn1Δ (A) and ten1Δ (B) survivors.
Figure 5—figure supplement 3
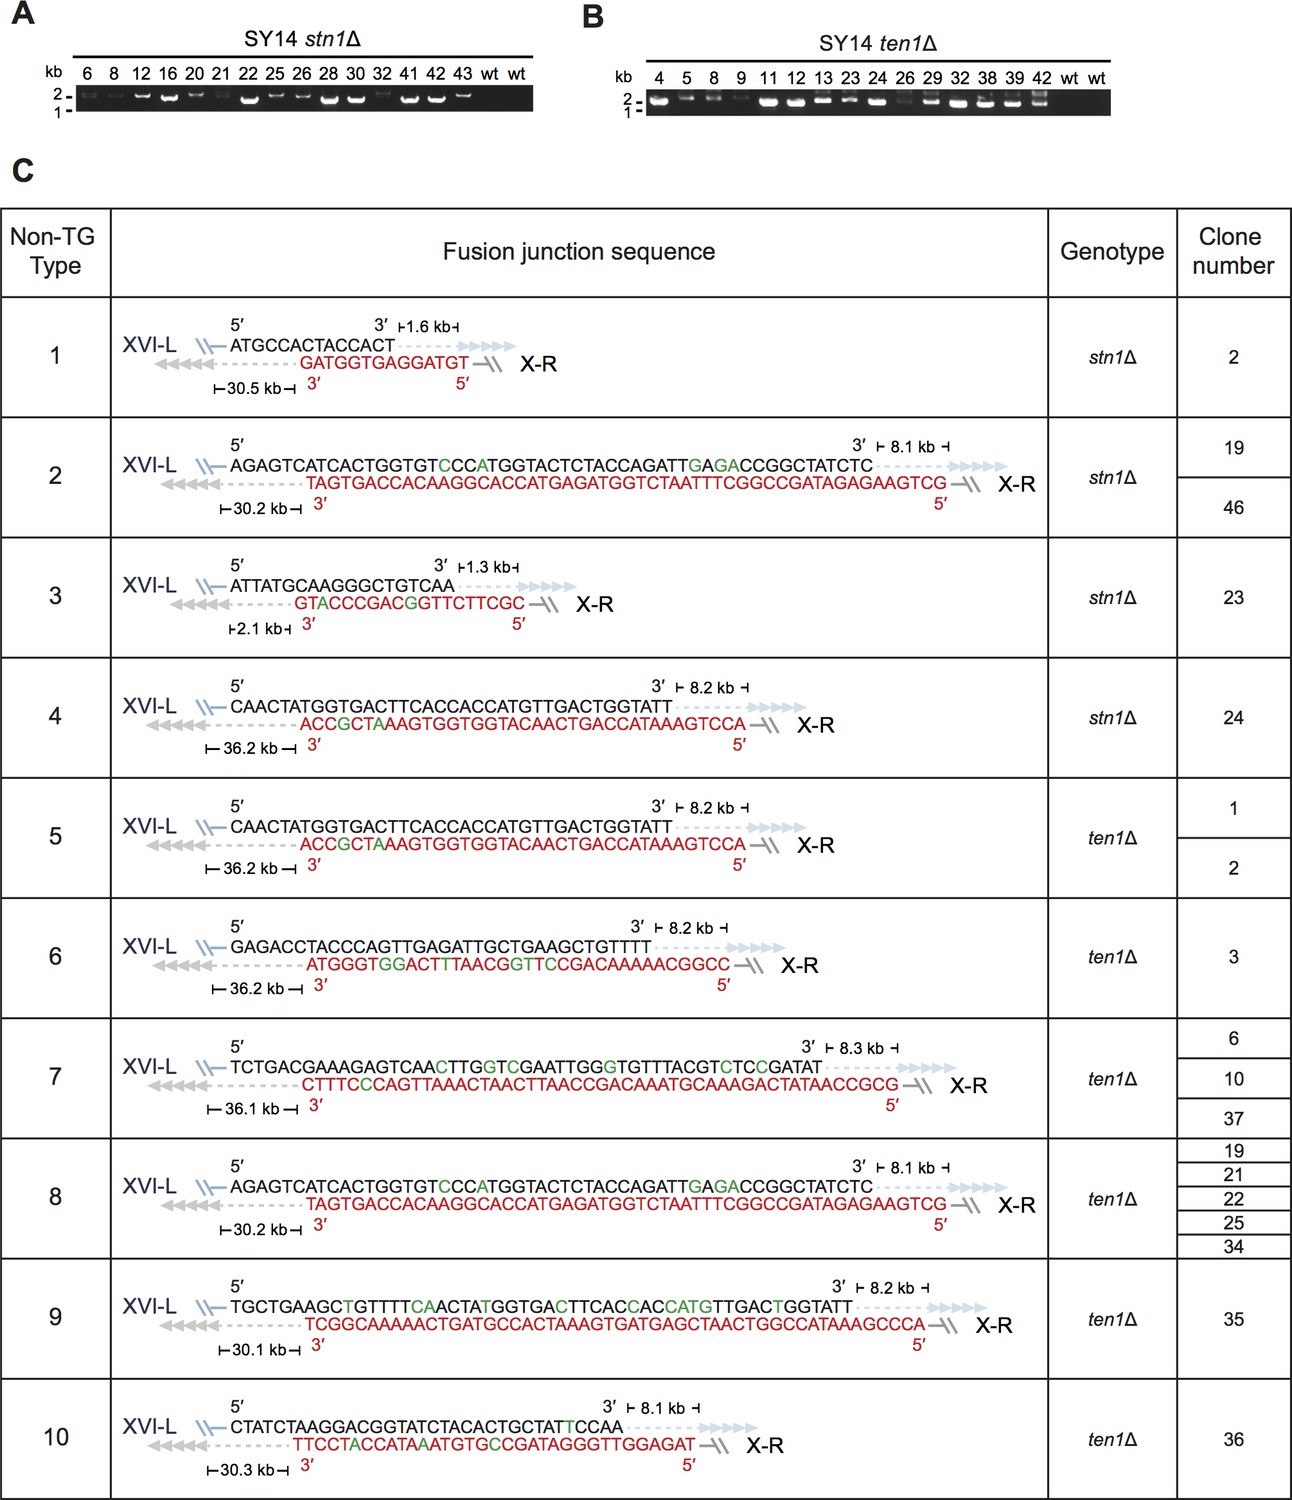
Determination of rTG Type survivors by PCR (A and B) and fusion junction sequences of non-TG Type survivors (C) in SY14 stn1Δ and SY14 ten1Δ mutants.
Figure 5—figure supplement 4
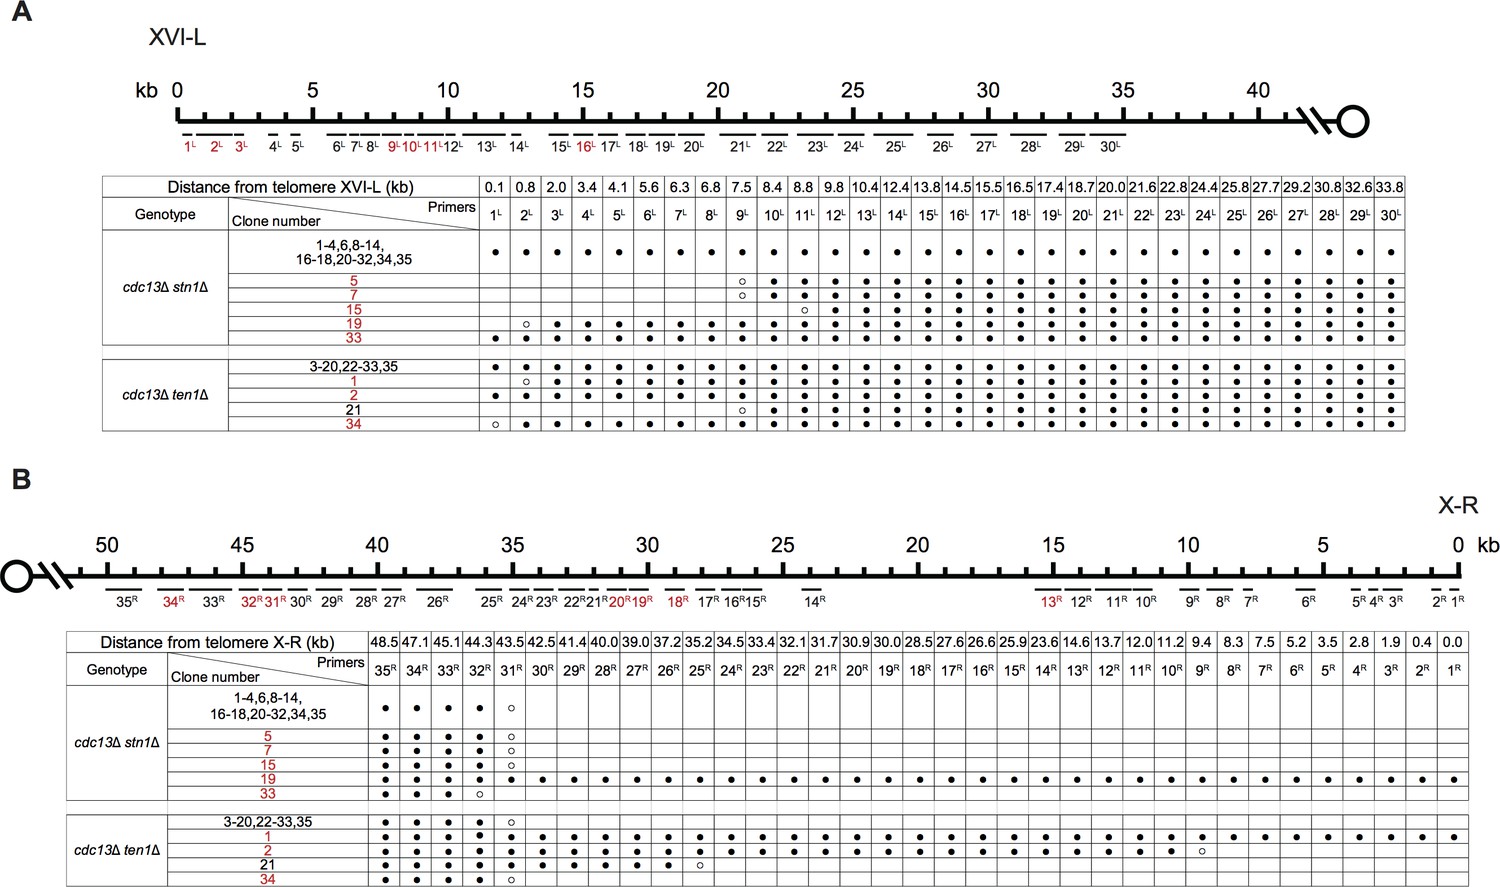
PCR mapping of the borders of Chr XVI-L erosion (A) and Chr X-R erosion (B) in SY14 cdc13Δ stn1Δ and cdc13Δ ten1Δ survivors.
Figure 5—figure supplement 5
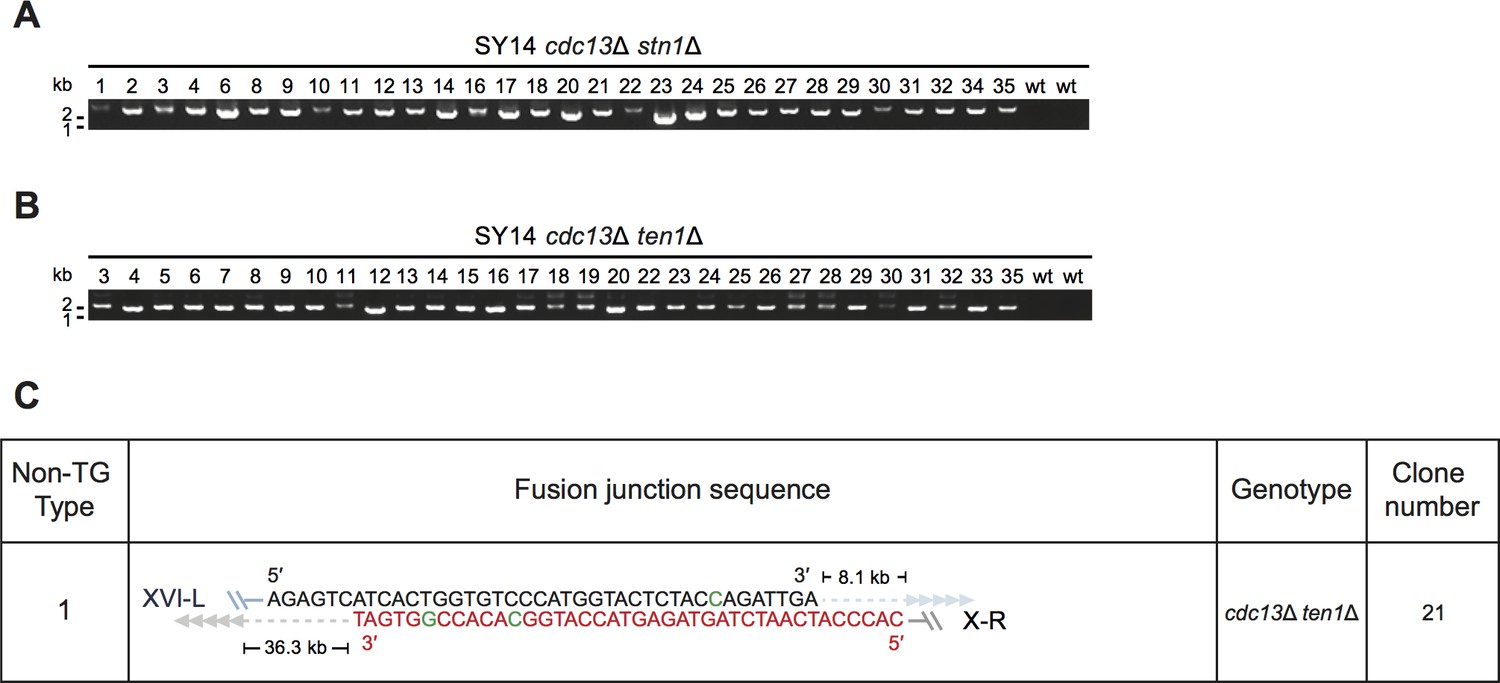
Determination of rTG Type survivors by PCR (A) in cdc13Δ stn1Δ and cdc13Δ ten1Δ survivors and fusion junction sequences of non-TG Type survivors (B) derived from SY14 cdc13Δ ten1Δ mutants.
Figure 5—figure supplement 6
SY14CA255 cstΔ survived cells utilize CA255 sequence for chromosomal circularization.
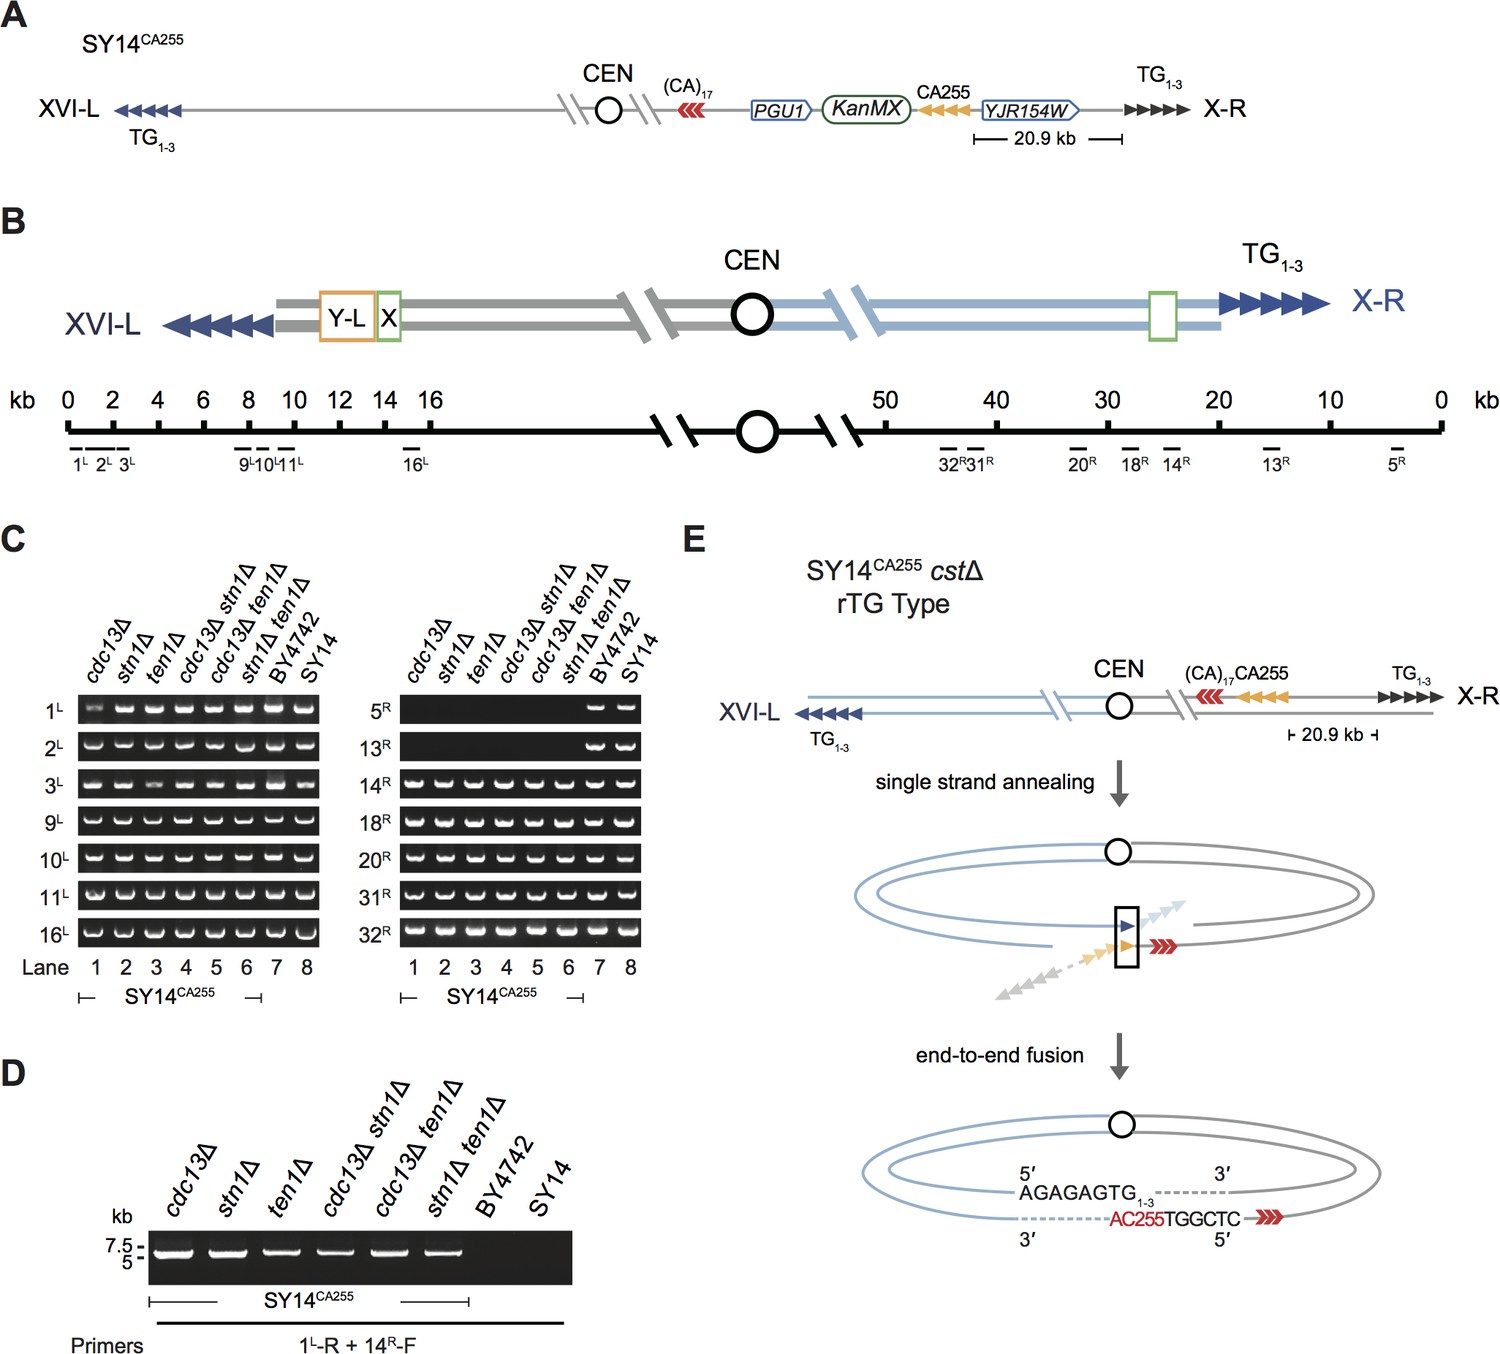
(A) Schematic representation of SY14CA255 strain. A 255 bp telomeric sequence (named CA255, tandem orange triangles) is inserted between the PGU1 and YJR154W genes. These two genes are located at the right arm of Chr X, and the inserted telomere sequence is 20.9 kb away from telomeric TG1-3 sequence (tandem grey triangles) in SY14. The KanMX gene serves as a genetic marker for the integration of the telomeric tracts. This figure is not precisely drawn to scale. (B) Schematic representation of two chromosome arms of XVI-L and X-R in SY14 strain. Boxes in light green and yellow adjacent to telomeres (tandem blue triangles) represent subtelomeric X element and Y′-L element respectively. The numbers above the schematic line (chromosome) indicate the distance to the corresponding telomeric TG1-3 sequences of XVI-L and X-R (not in precise scale). Black bars labeled 1 L-16L or 5 R-32R (under the schematic line) indicate the position of PCR primers that were used to examine either chromosomal end erosion. (C) Examples of PCR mapping results that define the borders of telomere erosion in SY14CA255 cstΔ survivors. The primer pairs (shown in (B)) are indicated on left in each panel. The clone numbers of SY14CA255 cstΔ are indicated on top in each panel. Primer sequences are listed in Supplementary file 1. (D) PCR examination of chromosome end-to-end fusion. A pair of primers (indicated at the bottom) were used to amplify the DNA fragments flanking the fusion points. The genotypes of SY14CA255 cstΔ are indicated on top. (E) Schematic of rTG Type survivors in SY14CA255 cstΔ cells. The CA255 region and ‘5′-(CA)17-3′’ repeat are shown in orange and red, respectively.
Figure 6 with 4 supplements
Telomerase inactivation in SY14 cells results in senescence and survivor formation.
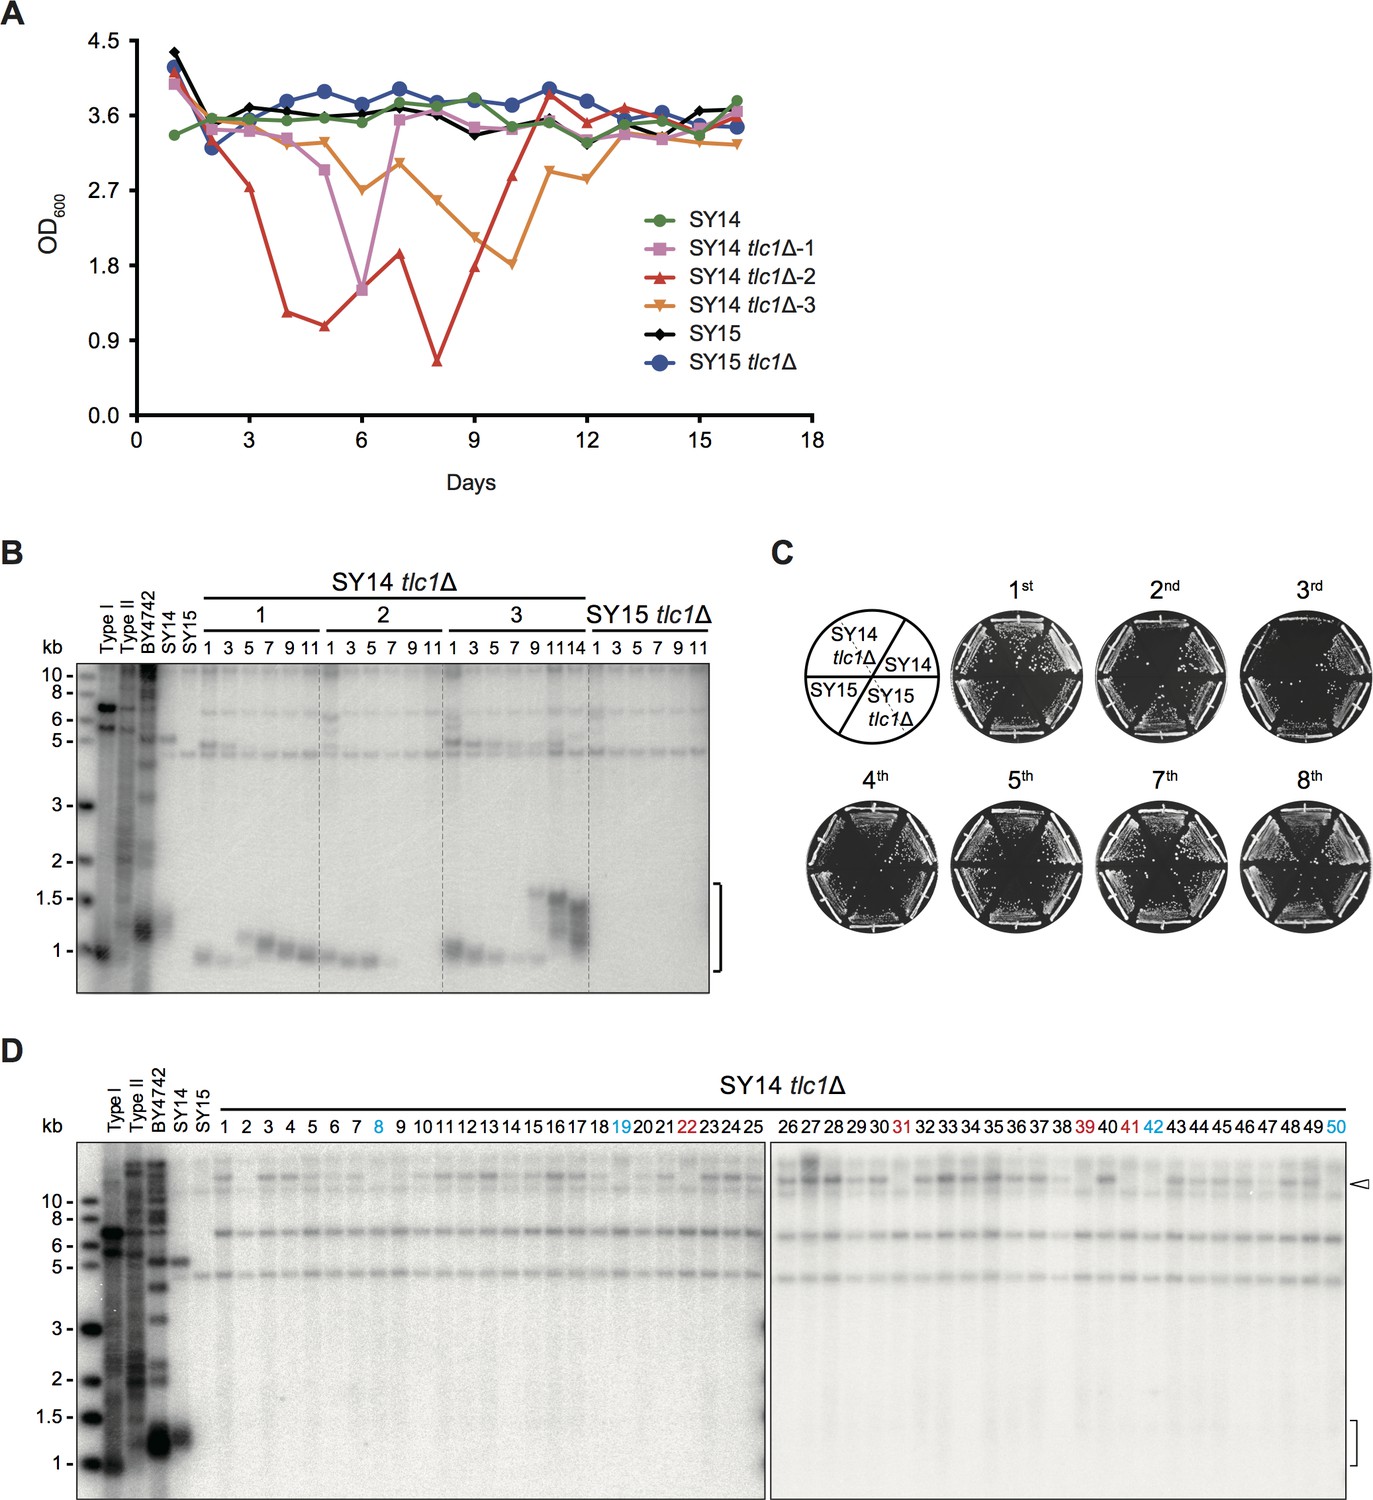
(A) Senescence assay in liquid medium. The growth (OD600) of SY14 (green), SY14 tlc1Δ (three clones in pink, red and orange), SY15 (black) and SY15 tlc1Δ (blue) strains were monitored every 24 hr for 16 days. (B) Telomeric Southern blotting assay. Genomic DNA of the SY14 tlc1Δ and SY15 tlc1Δ strain examined in (A) were digested by XhoI and subjected to a Southern blotting analysis. The bracket indicates Y′ telomere signals. (C) Senescence assay of the SY14 tlc1Δ and SY15 tlc1Δ strains on solid medium. After eviction of the pRS316-TLC1 plasmid in SY14 tlc1Δ TLC1 or SY15 tlc1Δ TLC1 strains by 5′-FOA selection, two independent SY14 tlc1Δ and SY15 tlc1Δ clones were re-streaked eight times to allow survivors to form. SY14 and SY15 were controls. (D) Telomere Southern blotting analysis of SY14 tlc1Δ survivors obtained on solid medium. 50 independent survivor clones (labeled 1 to 50 on top) were randomly picked, and their genomic DNA was subjected to Southern blotting assay with a telomeric TG1-3 probe. The clone numbers in red are non-TG Type survivors. The clone numbers in blue are not-identified survivors. The bracket indicates Y′ telomere signals and the open arrowhead indicates the new band of ~15 kb emerged in the majority of survivors.
-
Figure 6—source data 1
Senescence assay of SY14 tlc1Δ and SY15 tlc1Δ cells.
- https://cdn.elifesciences.org/articles/53144/elife-53144-fig6-data1-v1.xlsx
Figure 6—figure supplement 1
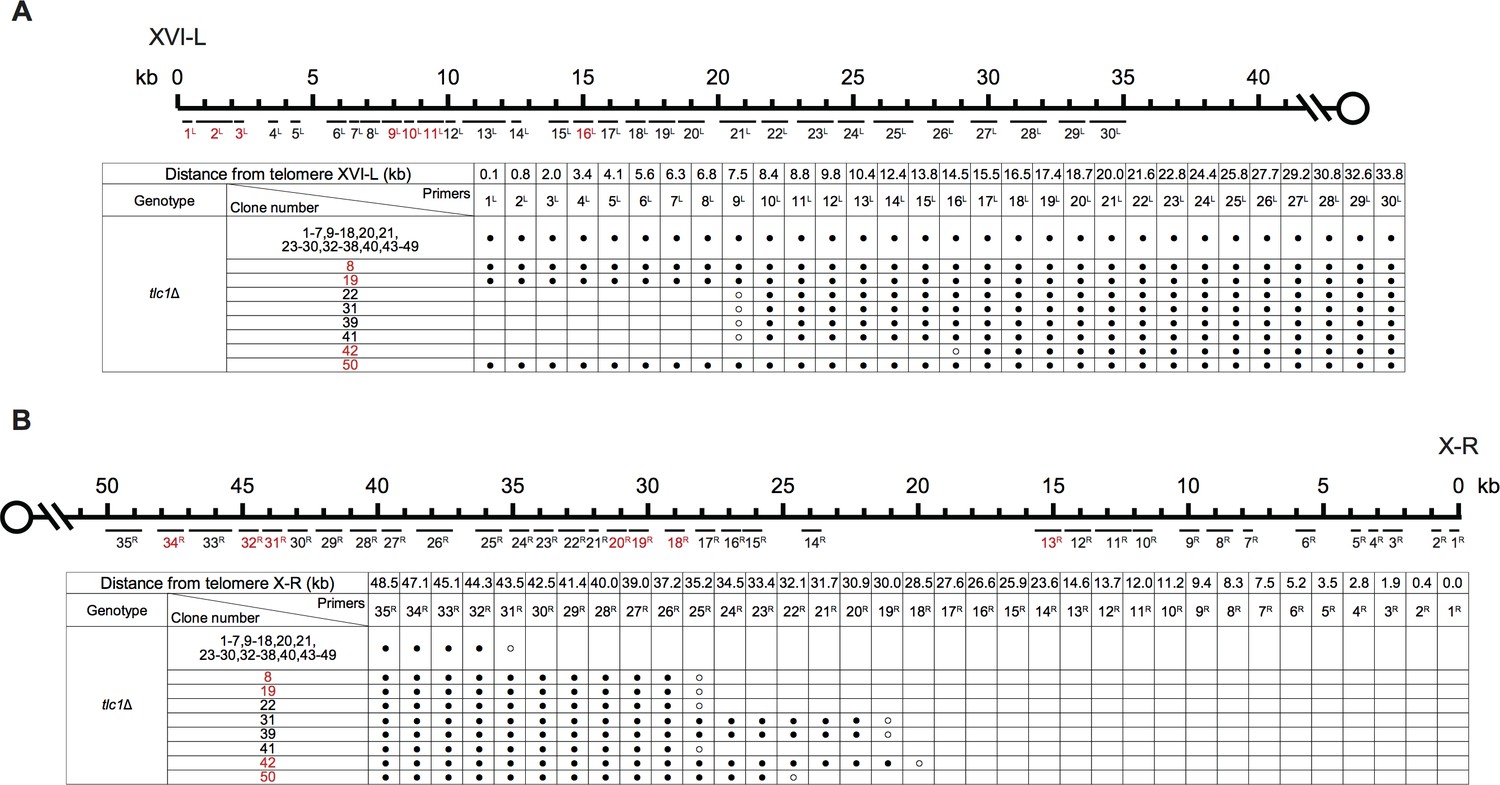
PCR mapping of the borders of Chr XVI-L erosion (A) and Chr X-R erosion (B) in SY14 tlc1Δ survivors.
Figure 6—figure supplement 2
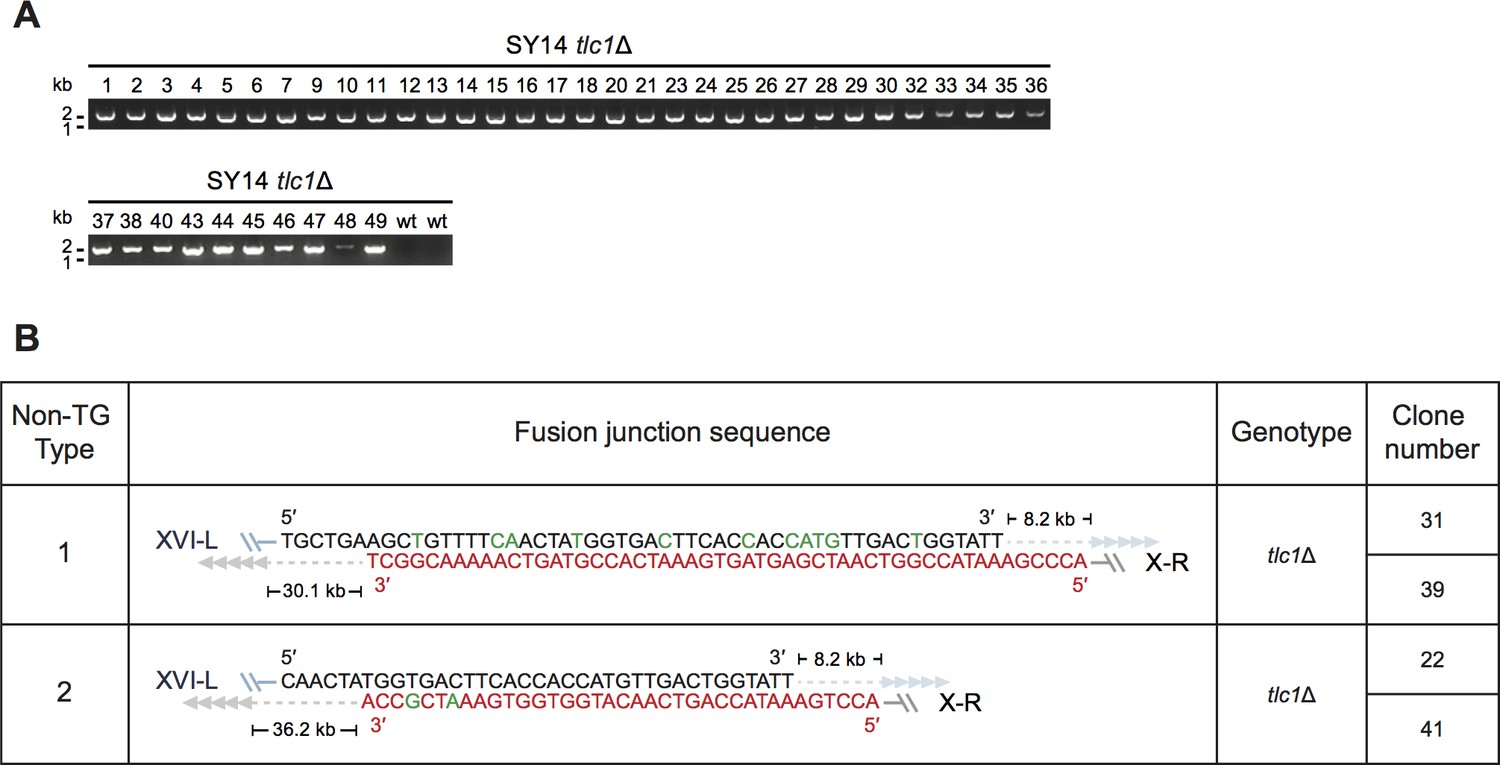
Determination of rTG Type survivors by PCR (A) and fusion junction sequences of non-TG Type survivors (B) of SY14 tlc1Δ mutants.
Figure 6—figure supplement 3
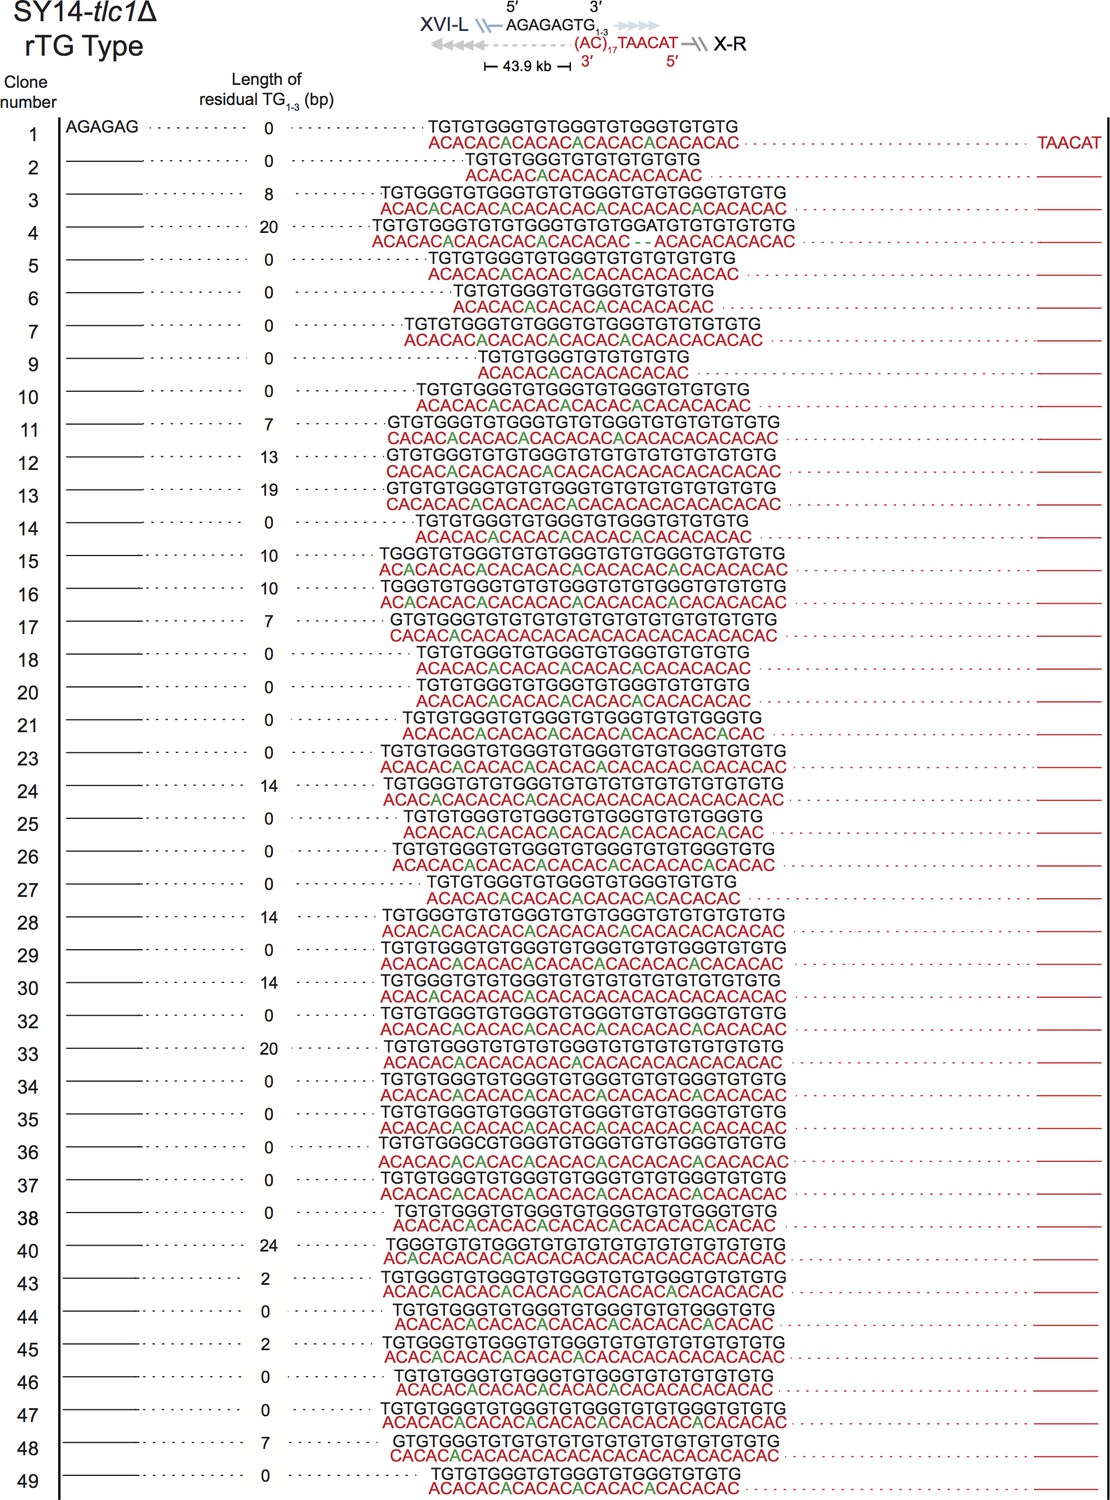
Fusion junctions of rTG Type in SY14 tlc1Δ survivors.
The sequences at the junction of 42 independent clones (labeled on left) of SY14 tlc1Δ survivors are determined. In each clone, the length of the residual TG1-3 sequence proximal to junction point of Chr XVI-L is also shown.
Figure 6—figure supplement 4
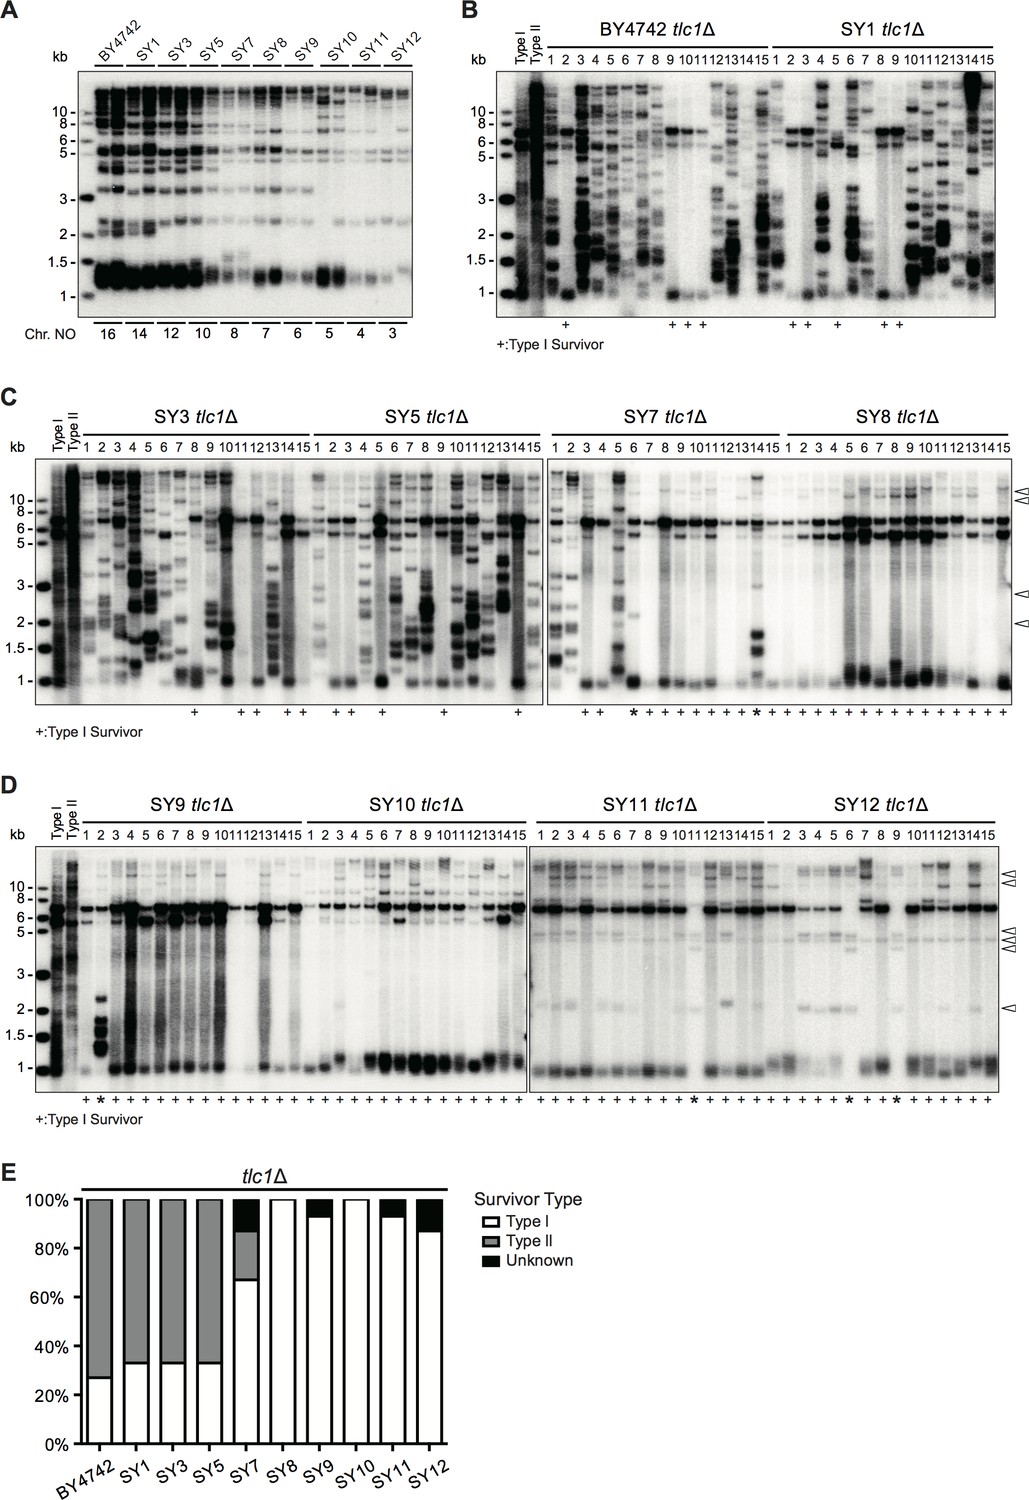
Telomerase null cells may experience inter- and/or intra-chromosome fusions to survive with the decrease of chromosome numbers in budding yeast.
(A) Telomere Southern blotting analysis. The genomic DNAs from the strains (labeled on top) with different numbers of chromosomes (labeled at bottom) were digested by XhoI and subjected to Southern hybridization. Two independent clones of each strain were examined. (B-D) Telomere Southern blotting analysis of tlc1Δ survivors obtained on plates. Fifteen independent survivor clones (1 to 15, labeled on top of each panel) of each strain were randomly picked, and their telomere structures were examined by Southern blotting with a TG1-3 probe. ‘+” at the bottom indicates Type I survivors. ‘*” marks the survivors which are not typical Type I or Type II. Open arrows at the right of the panels indicate distinct bands. (E) Percentage of Type I, Type II and unknown survivors in SY tlc1∆ strains with different numbers of chromosomes. Y-axis, percentage of different kinds of survivors; X-axis, SY tlc1∆ strains with different numbers of chromosomes.
Figure 7 with 5 supplements
Survivors in SY14 tlc1Δ have a circular chromosome.
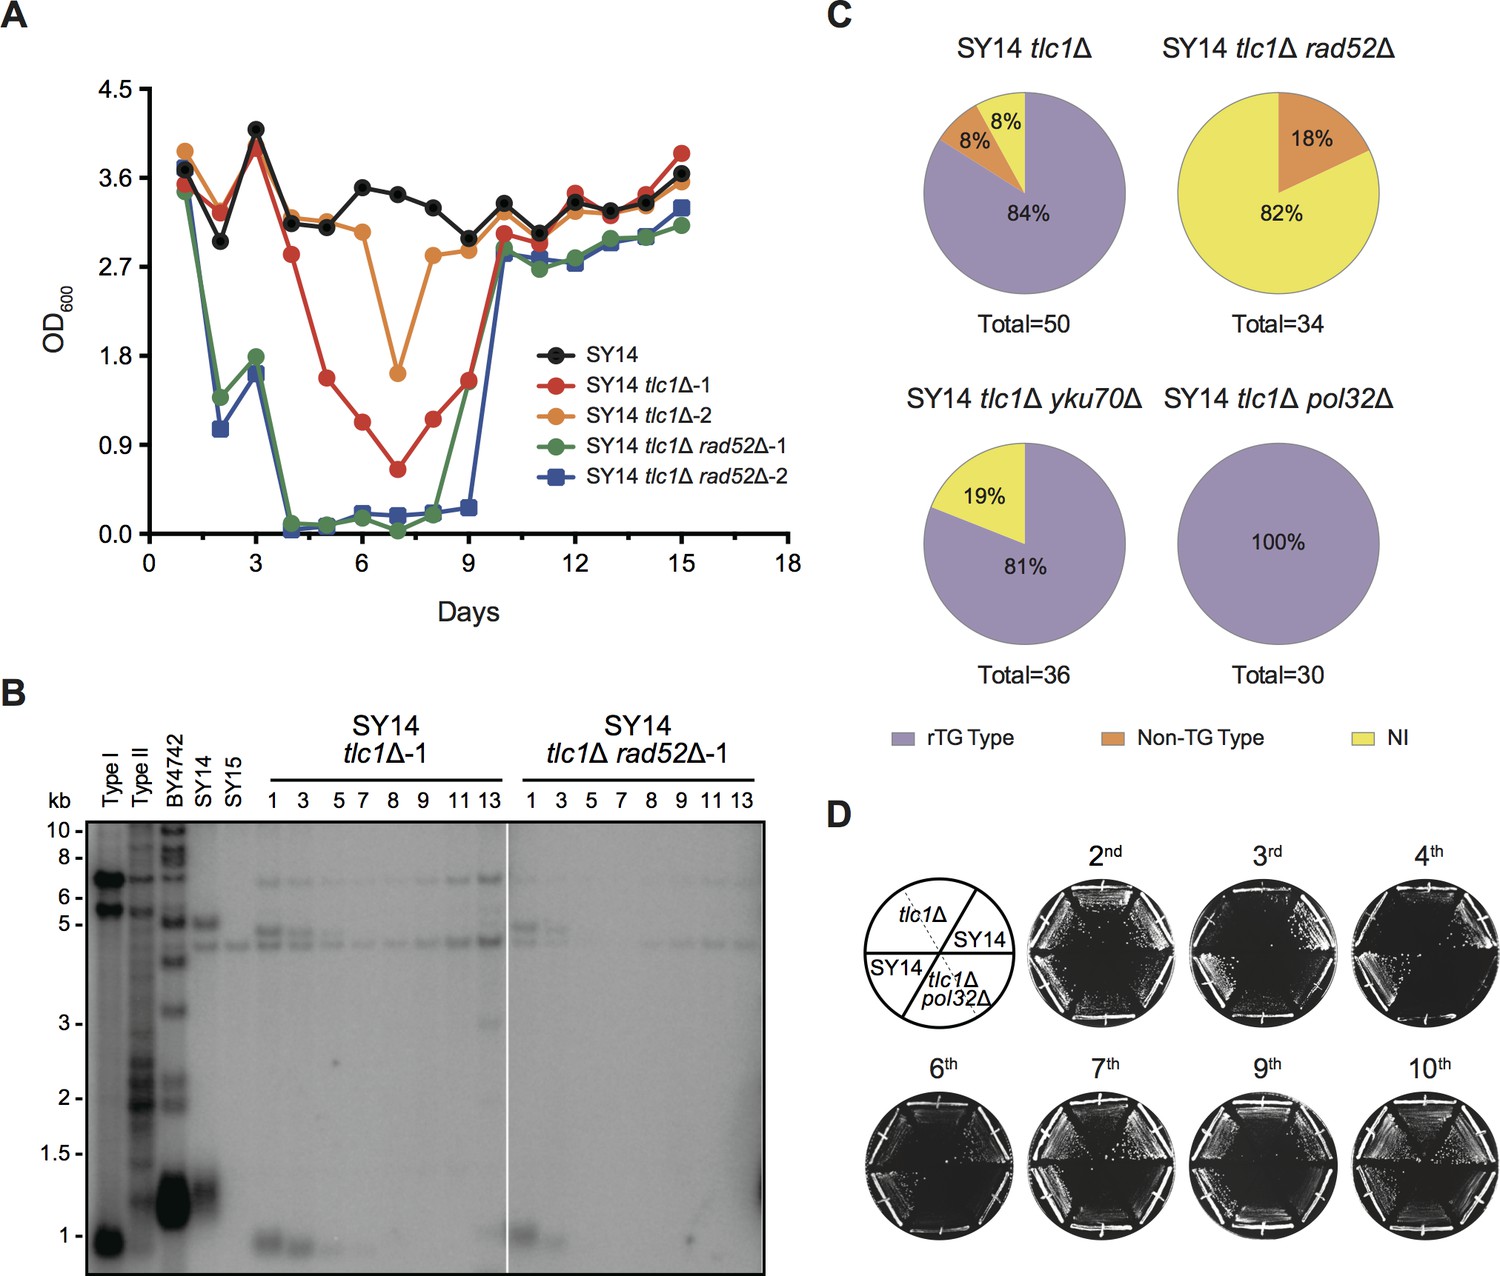
(A) Senescence assay in liquid medium. The growth (OD600) of SY14 (black), SY14 tlc1Δ (red, orange) and SY14 tlc1Δ rad52Δ (green, blue) strains were monitored every 24 hr for 15 days. (B) Telomere Southern blotting analysis of SY14 tlc1Δ and SY14 tlc1Δ rad52Δ survivors. Genomic DNA of the SY14 tlc1Δ and SY14 tlc1Δ rad52Δ strains assayed in (A) were digested by XhoI and subjected to a Southern blotting analysis. (C) Percentage of rTG Type, non-TG Type and not-identified (NI) survivors in SY14 tlc1Δ (n = 50), SY14 tlc1Δ rad52Δ cells (n = 34), SY14 tlc1Δ yku70Δ (n = 36) and SY14 tlc1Δ pol32Δ (n = 30). (D) Senescence assay of the SY14 tlc1Δ and SY14 tlc1Δ pol32Δ strains on solid medium. After eviction of the pRS316-TLC1 plasmid in SY14 tlc1Δ TLC1 or SY14 tlc1Δ pol32Δ TLC1 strains by 5′-FOA selection, two independent SY14 tlc1Δ and SY14 tlc1Δ pol32Δ clones were re-streaked ten times to allow survivors to form. SY14 was a control.
-
Figure 7—source data 1
Senescence assay of SY14 tlc1Δ and SY14 tlc1Δ rad52Δ cells.
- https://cdn.elifesciences.org/articles/53144/elife-53144-fig7-data1-v1.xlsx
Figure 7—figure supplement 1
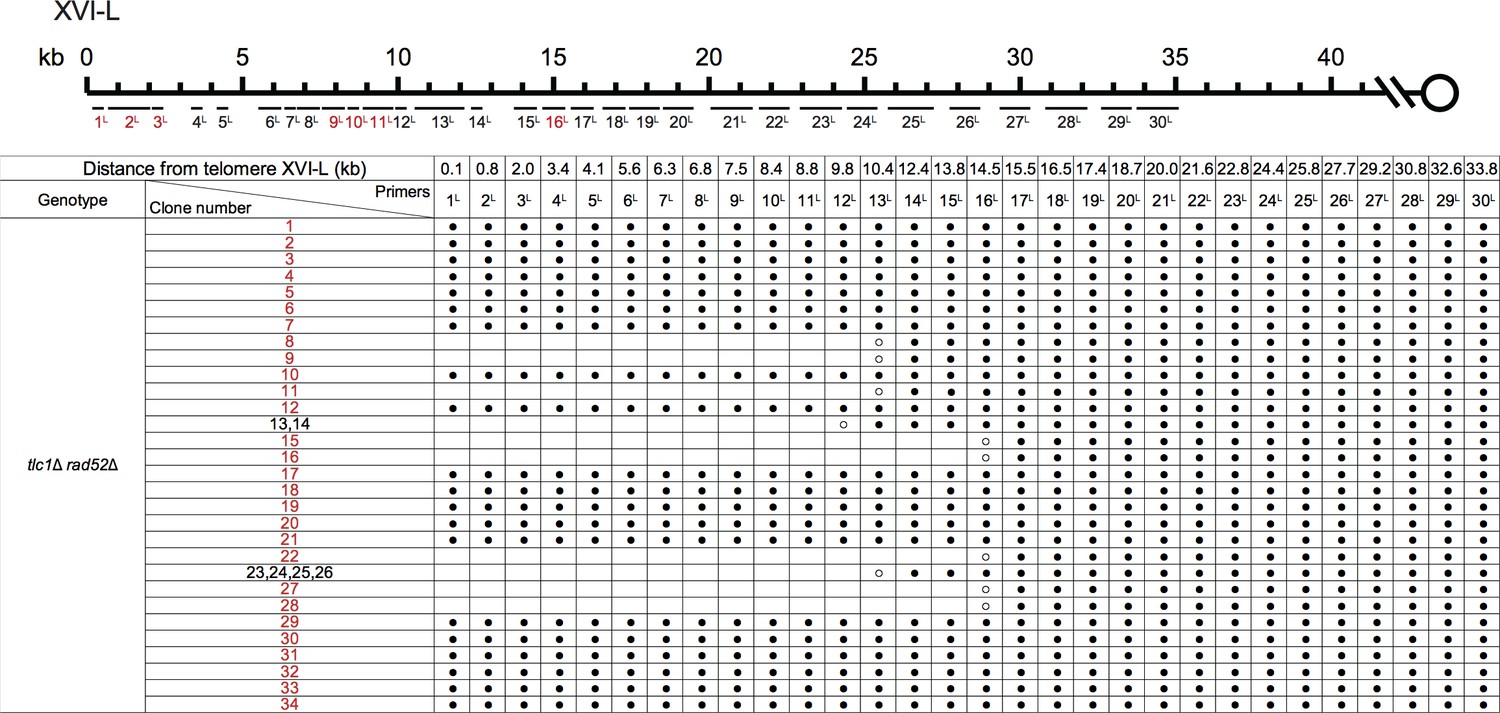
PCR mapping of the borders of Chr XVI-L erosion in SY14 tlc1Δ rad52Δ survivors.
Figure 7—figure supplement 2
PCR mapping of the borders of Chr X-R erosion in SY14 tlc1Δ rad52Δ survivors.
Figure 7—figure supplement 3
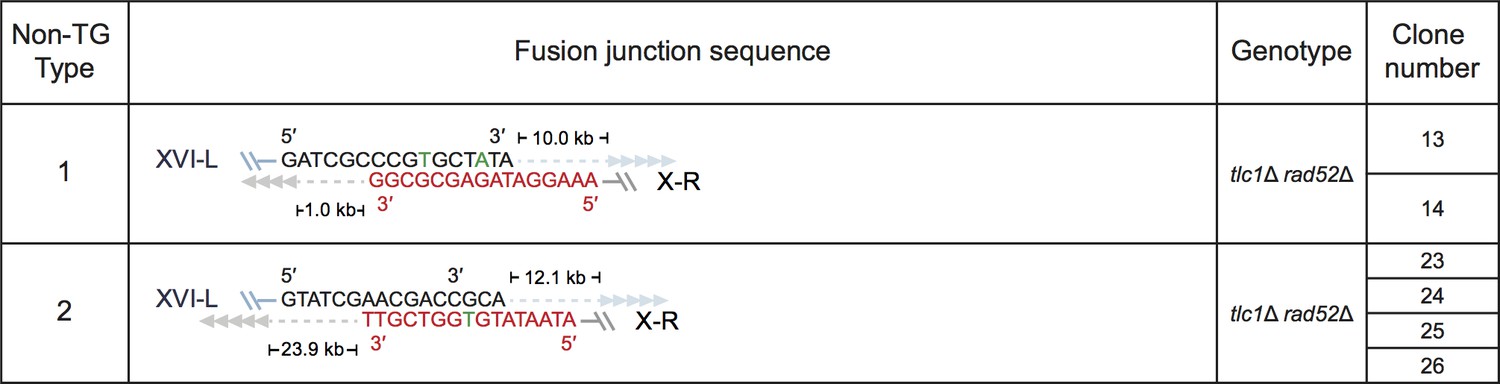
Fusion junction sequences of non-TG Type survivors derived from SY14 tlc1Δ rad52Δ mutants.
Figure 7—figure supplement 4
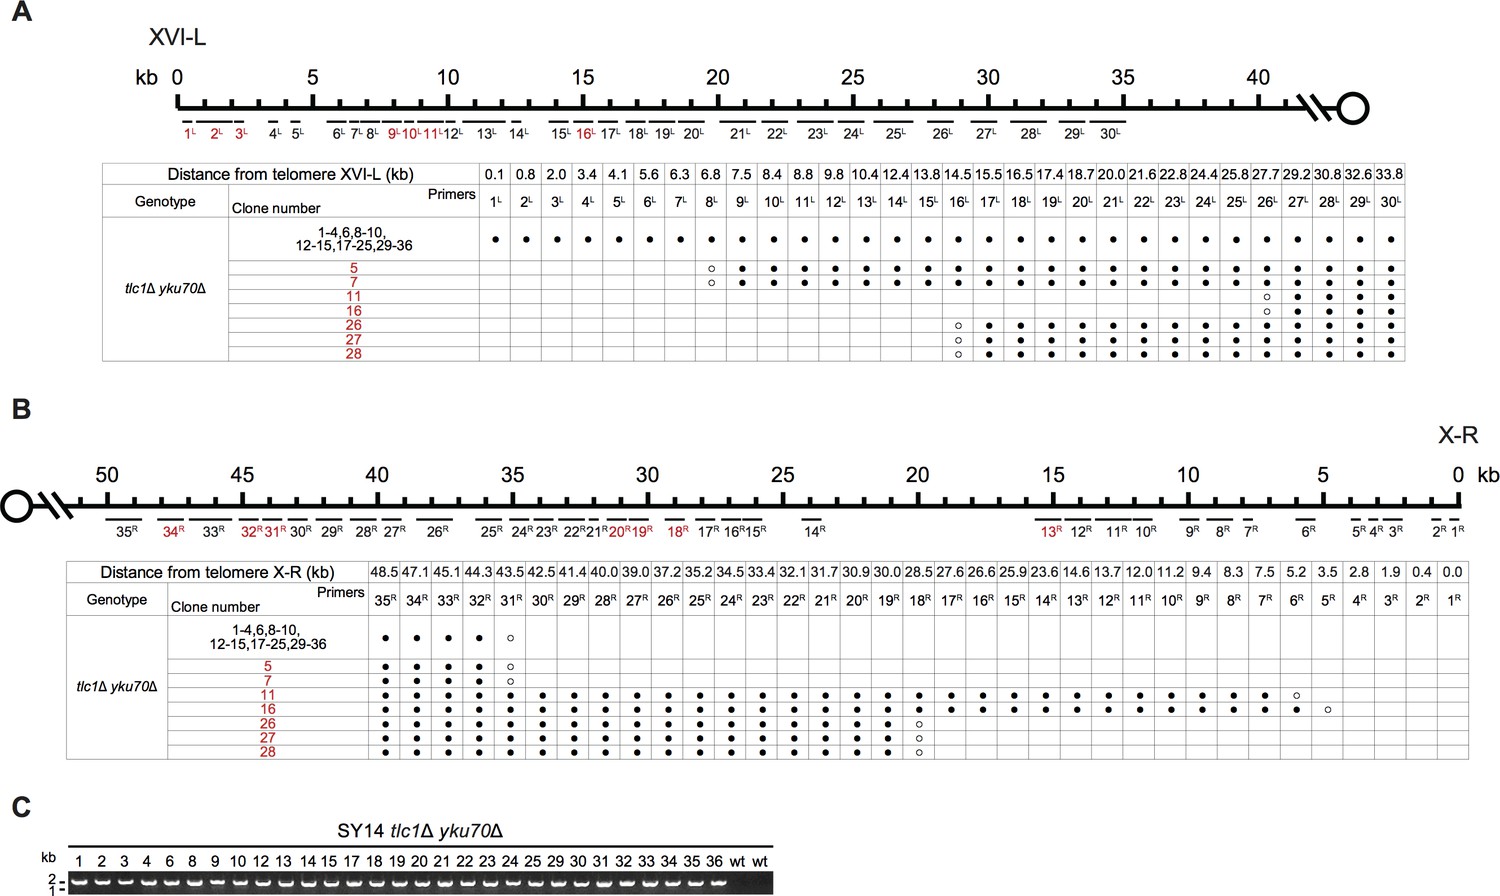
Borders of erosion (A and B) and rTG Type (C) of SY14 tlc1Δ yku70Δ survivors are defined by mapping and PCR amplification.
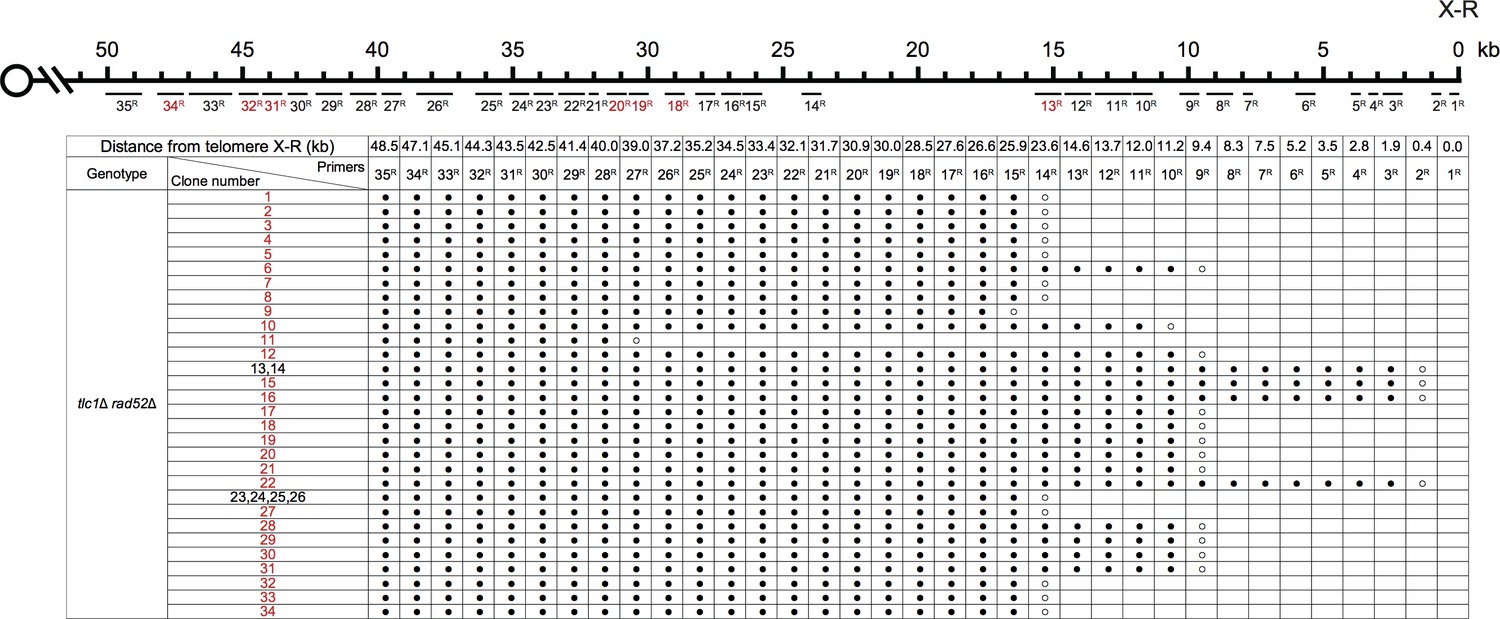
Figure 7—figure supplement 5
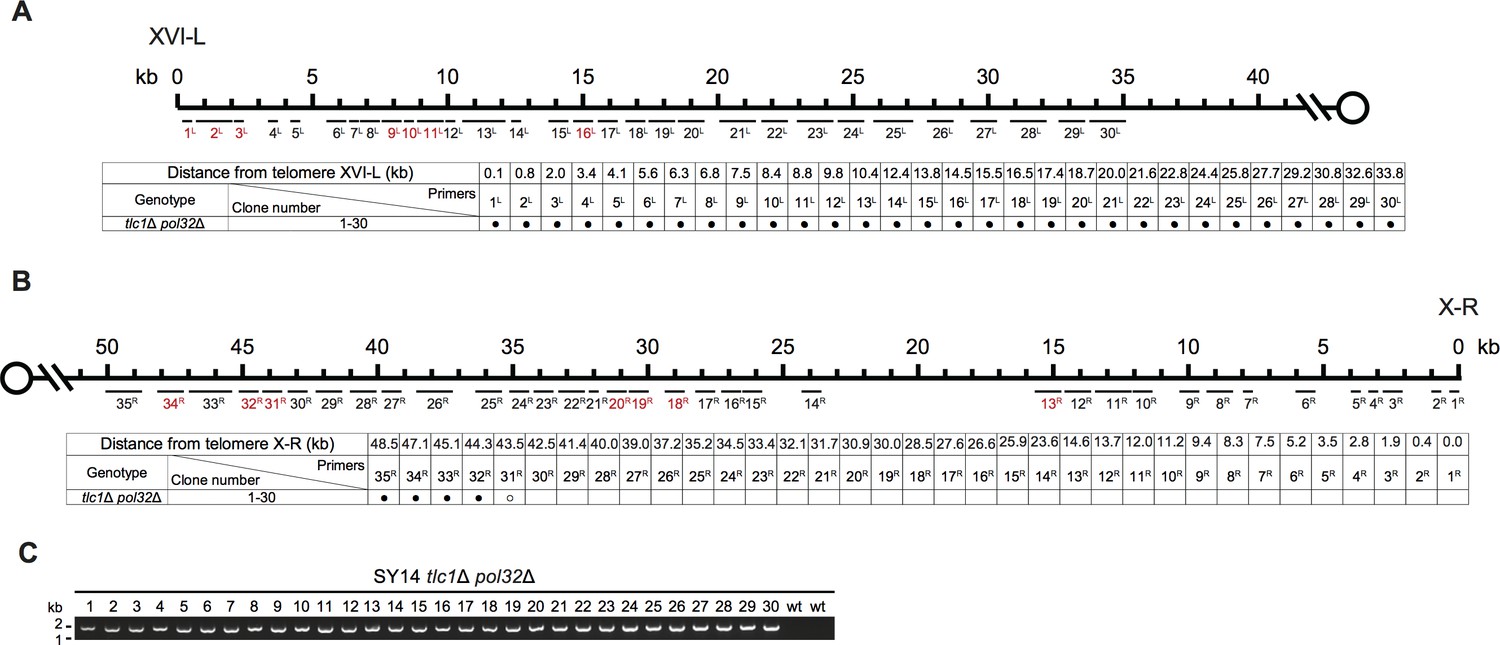
Chromosomal circularization in SY14 tlc1Δ cells is independent of Pol32.
(A-C) Borders of erosion (A and B) and rTG Type (C) of SY14 tlc1Δ pol32Δ survivors are defined by mapping and PCR amplification.
Additional files
-
Supplementary file 1
Mapping primers used in this study.
- https://cdn.elifesciences.org/articles/53144/elife-53144-supp1-v1.docx
-
Supplementary file 2
Yeast strains used in this study.
- https://cdn.elifesciences.org/articles/53144/elife-53144-supp2-v1.docx
-
Transparent reporting form
- https://cdn.elifesciences.org/articles/53144/elife-53144-transrepform-v1.docx
Download links
A two-part list of links to download the article, or parts of the article, in various formats.
Downloads (link to download the article as PDF)
Open citations (links to open the citations from this article in various online reference manager services)
Cite this article (links to download the citations from this article in formats compatible with various reference manager tools)
Cdc13 is predominant over Stn1 and Ten1 in preventing chromosome end fusions
eLife 9:e53144.
https://doi.org/10.7554/eLife.53144


