Mechanisms of substrate recognition by a typhoid toxin secretion-associated muramidase
- Yale University School of Medicine, United States
Figures
Figure 1 with 3 supplements
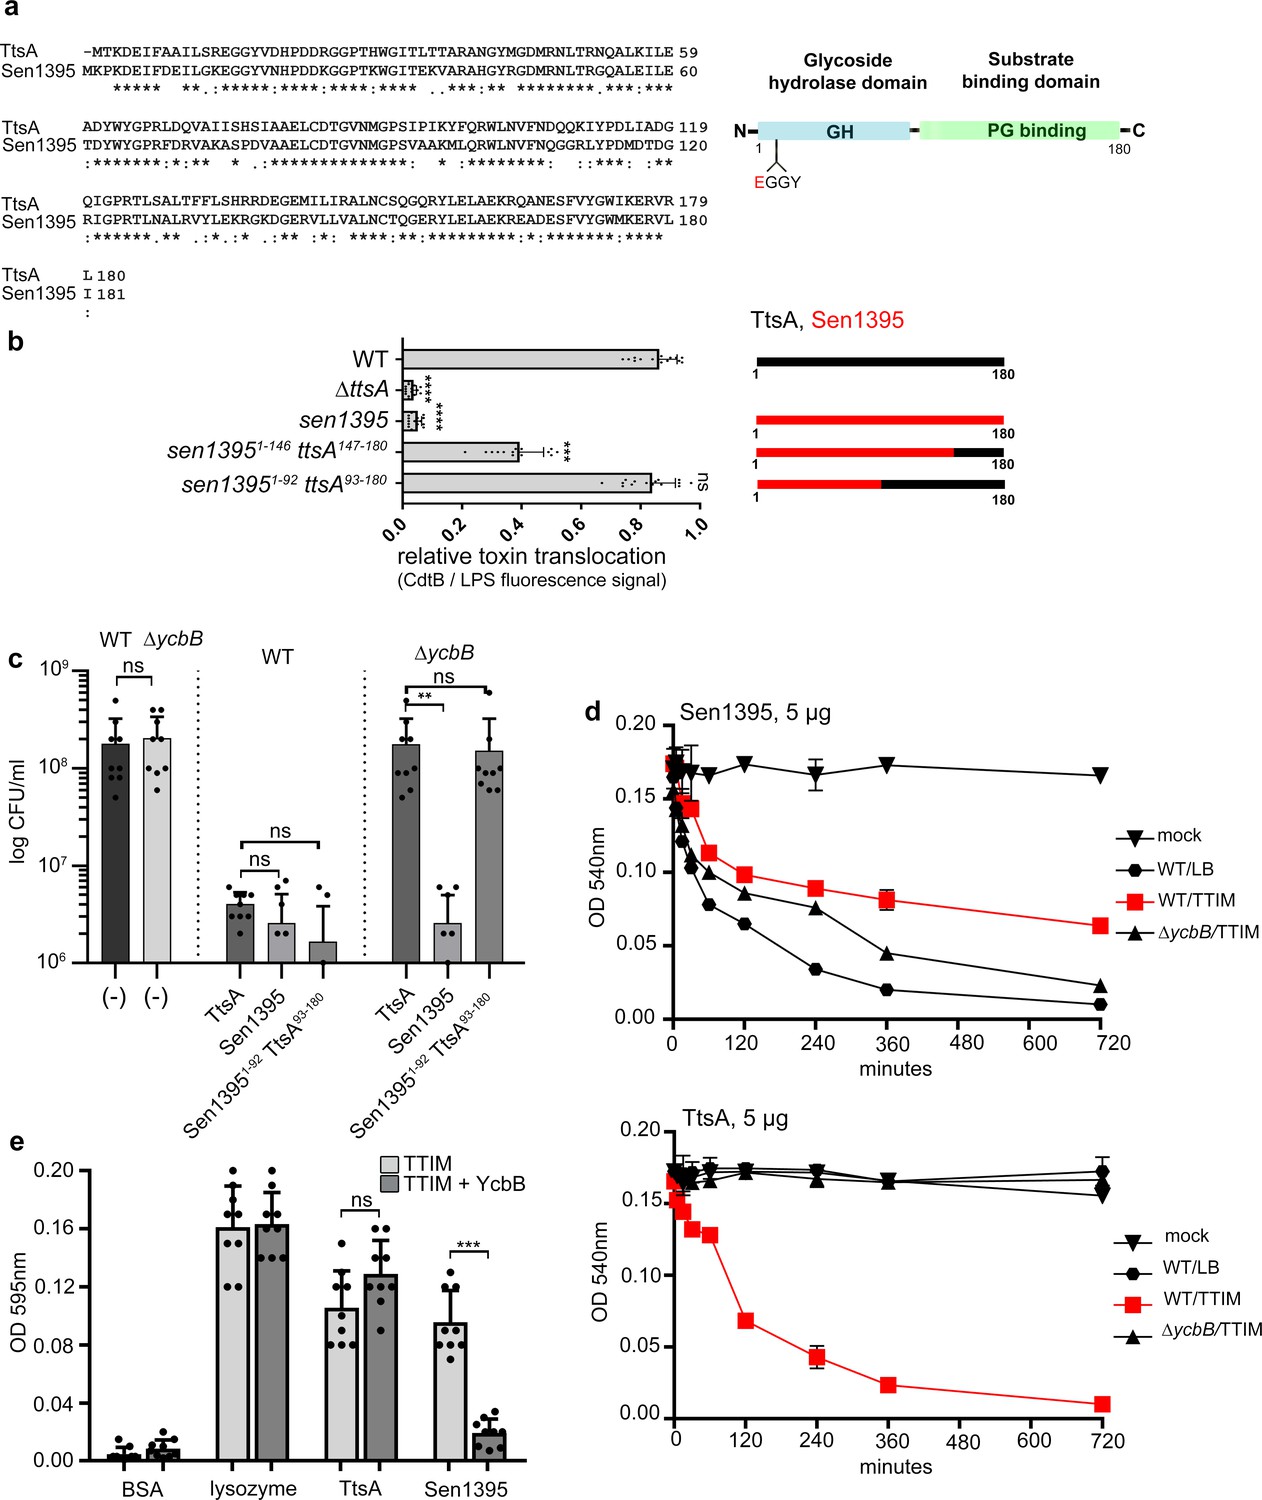
The carboxy-terminal domain of TtsA confers substrate specificity and typhoid toxin secretion functions.
(a) Amino acid sequence alignment between TtsA and its S. Enteritidis homolog Sen1395. Identical (*) and conserved (:) residues are indicated. The predicted domain organization is also shown. (b) Ability of S. Enteritidis Sen1395 and the indicated chimeras to complement a S. Typhi ∆ttsA mutant strain for typhoid toxin translocation across the PG. The relative amount of typhoid toxin translocation across the PG was quantified by immunofluorescence microscopy after staining with antibodies to the FLAG epitope (to visualize CdtB, a component of typhoid toxin), and LPS (to visualize bacterial cells). The average ratios of typhoid toxin- and LPS-associated fluorescence intensity ± standard deviation are shown (****p<0.0001, ***p<0.001, ns p=0.395, two-sided Student’s t Test) (Figure 1—source data 1). For each experiment a total of 10 images were collected from which 100 randomly selected bacteria per image were analyzed. A diagram of the different constructs is also shown. (c) Effect of expression of TtsA, Sen1395 or a TtsA-Sen1395 chimera on the growth of wild type or ∆ycbB S. Typhi, as indicated. Overnight grown bacteria were subcultured (1:50) in TTIM and grown to an OD600 of 0.3, at which point 0.3% arabinose was added to the bacterial cultures to induce the expression of the different muramidases, and subsequently incubated for 20 hr at 37°C. Colony forming units (CFUs) were determined by plating bacterial dilutions on LB agar plates. Values represent the mean + /- standard deviation (**p<0.01, ns p=0.6892, p=0.0115, p=0.0145, p=0.7505, two-sided Student`s t-Test, when compared to the values of the respective control strains, shown on the left bars). (d-e) TtsA and Sen1395 muramidase activity on YcbB-edited PG. Peptidoglycan was isolated from wild-type S. Typhi grown in either LB, or TTIM, or from the ∆ycbB S. Typhi mutant grown in TTIM, as indicated (d). The PG hydrolytic activity of purified Sen1395 and TtsA was evaluated using a turbidimetric assay. Graphs show the mean turbidity (measured at OD540 nm) ± standard deviation (d). Alternatively, PG was isolated from wild-type S. Typhi or from a wild-type S. Typhi strain carrying a plasmid over-expressing ycbB under the control of an arabinose-inducible promoter (e). Both strains were grown for 24 hr in TTIM containing 0.3% arabinose. The PG hydrolytic activity of purified Sen1395, TtsA, lysozyme (positive control) and BSA (negative control) was evaluated using a Remazol Brilliant Blue (RBB)-dye release assay. The dye bound to PG, is released to the supernatant due to PG hydrolysis and can be measured by its absorbance. Graphs show the mean absorbance (measured at OD595 nm)± standard deviation (***p<0.0026, ns p=0.6892, two-sided Student`s t-Test). (b–e) All data are derived from at least three independent experiments (Figure 1—source data 1).
-
Figure 1—source data 1
Contains source data related to Figure 1b–e.
- https://cdn.elifesciences.org/articles/53473/elife-53473-fig1-data1-v2.xlsx
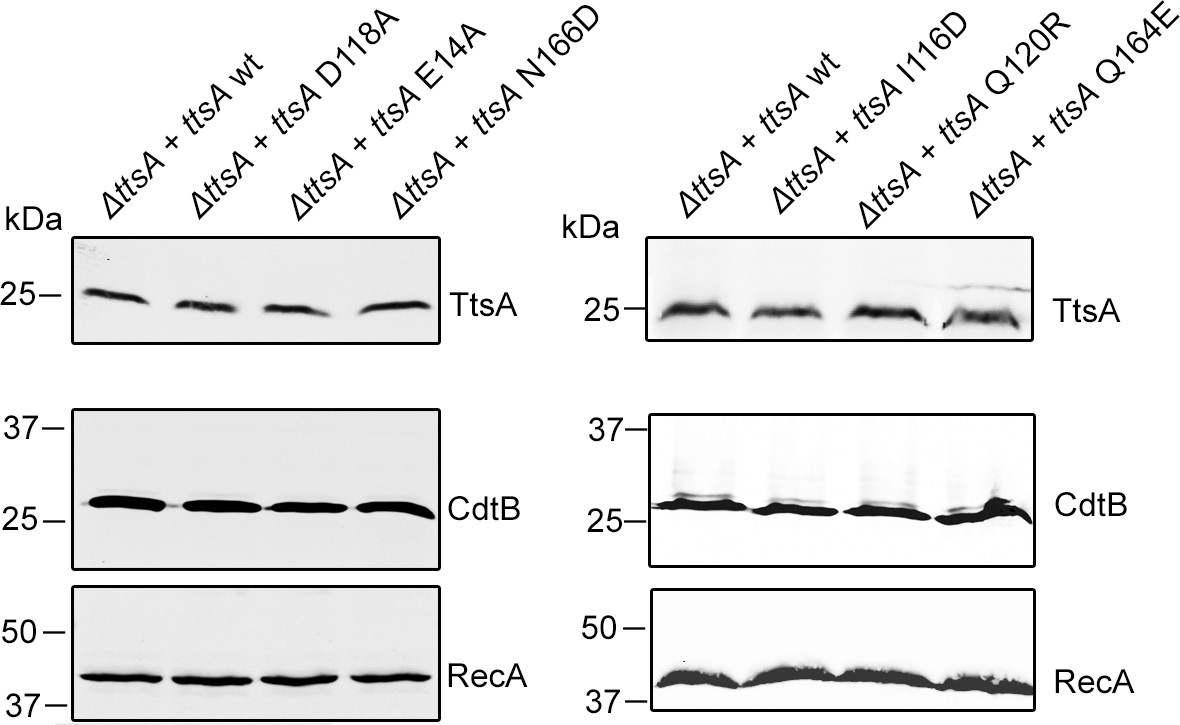
Figure 1—figure supplement 1
Western blot analysis of the expression levels of CdtB and TtsA in the indicated S.
Figure 1—figure supplement 2

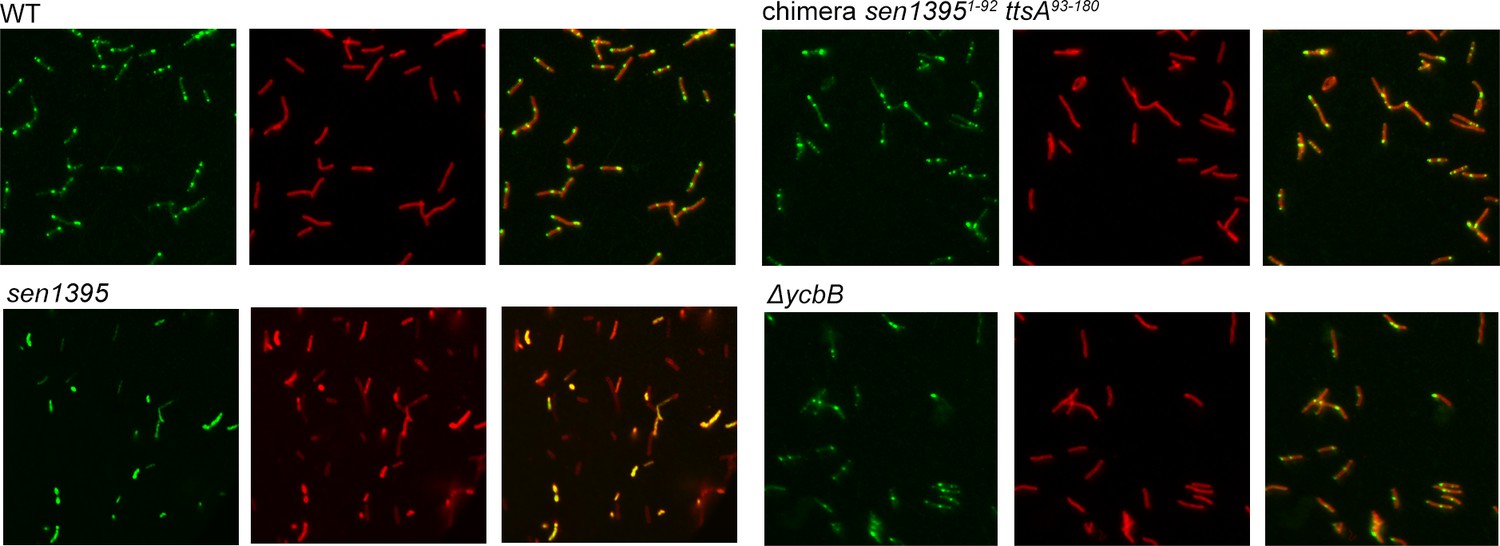
Ability of S. Enteritidis Sen1395 and the indicated chimera to complement a S. Typhi ∆ttsA mutant strain for typhoid toxin translocation across the PG.
Wild type S. Typhi (WT) and the isogenic mutant ∆ttsA carrying chromosomally-encoded FLAG-tagged CdtB and expressing S. Enteritidis Sen1395 or the Sen13951-146-TtsA147-180 chimera were grown for 24 hs in TTIM media, fixed, treated with Triton X-100 (0.1%) and then stained with mouse anti-FLAG (to stain CdtB) (green) and rabbit anti S. Typhi LPS (to visualize bacterial cells) (red).
Figure 1—figure supplement 3
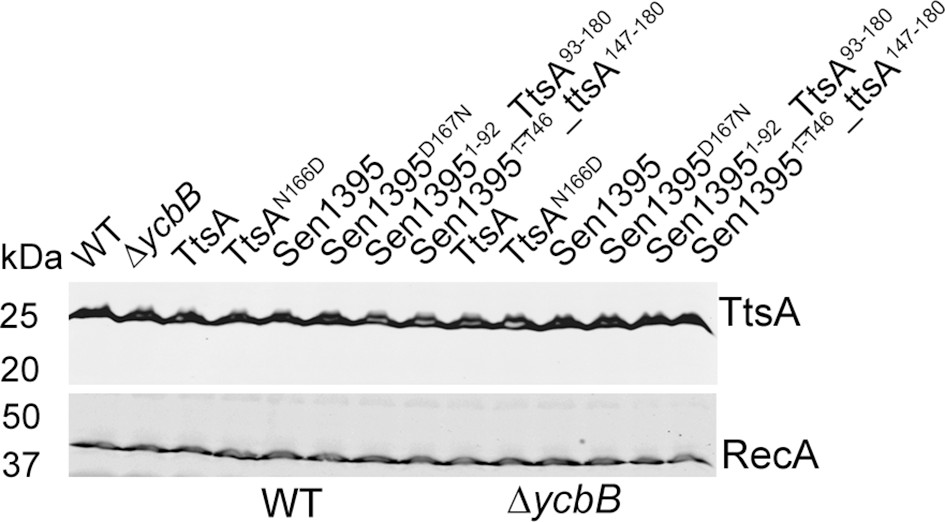
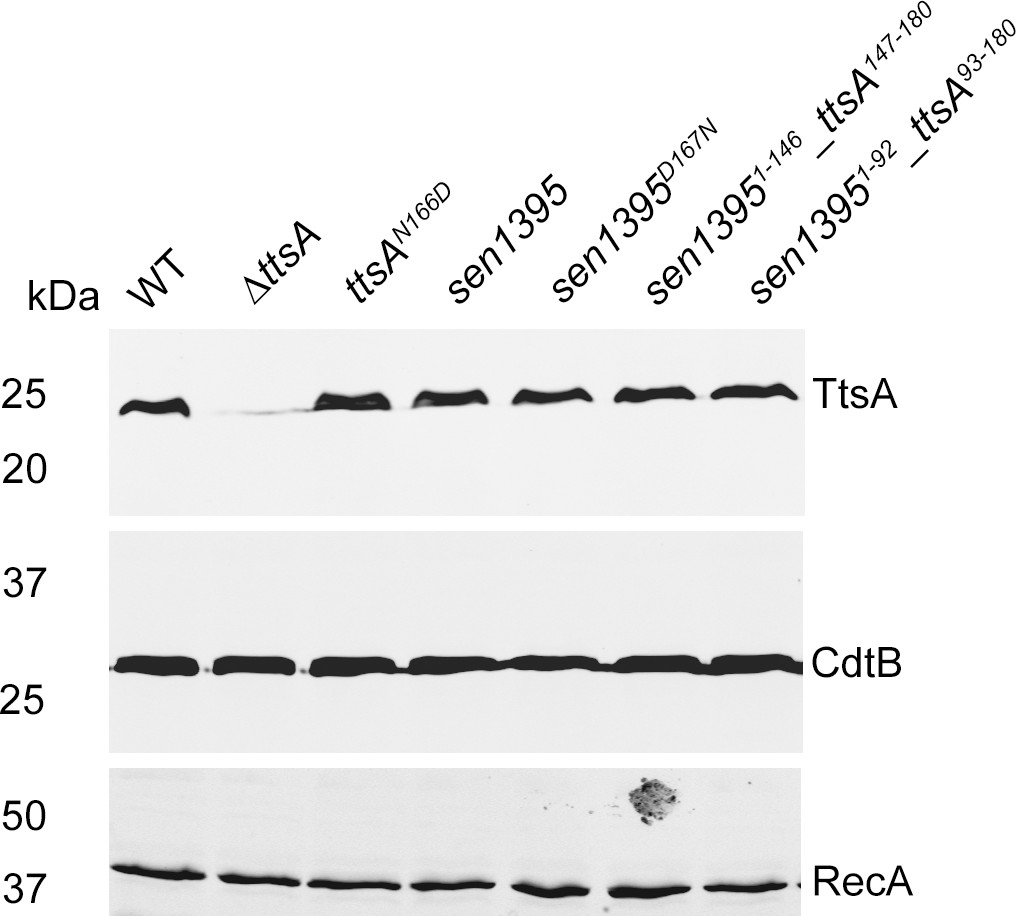
Western blot analysis of the expression levels of the indicated plasmid-born FLAG-tagged TtsA, Sen1395 or chimeric proteins expressed from an arabinose-inducible promoter in the S. Typhi strains assayed in Figure 1C.
WT: indicates the levels of expression of TtsA in a strain carrying a chromosomally-encoded FLAG-tagged allele of TtsA, which is included as a control. The amount of RecA was used as a loading control and analyzed on a separate Western blot.
Figure 2 with 2 supplements
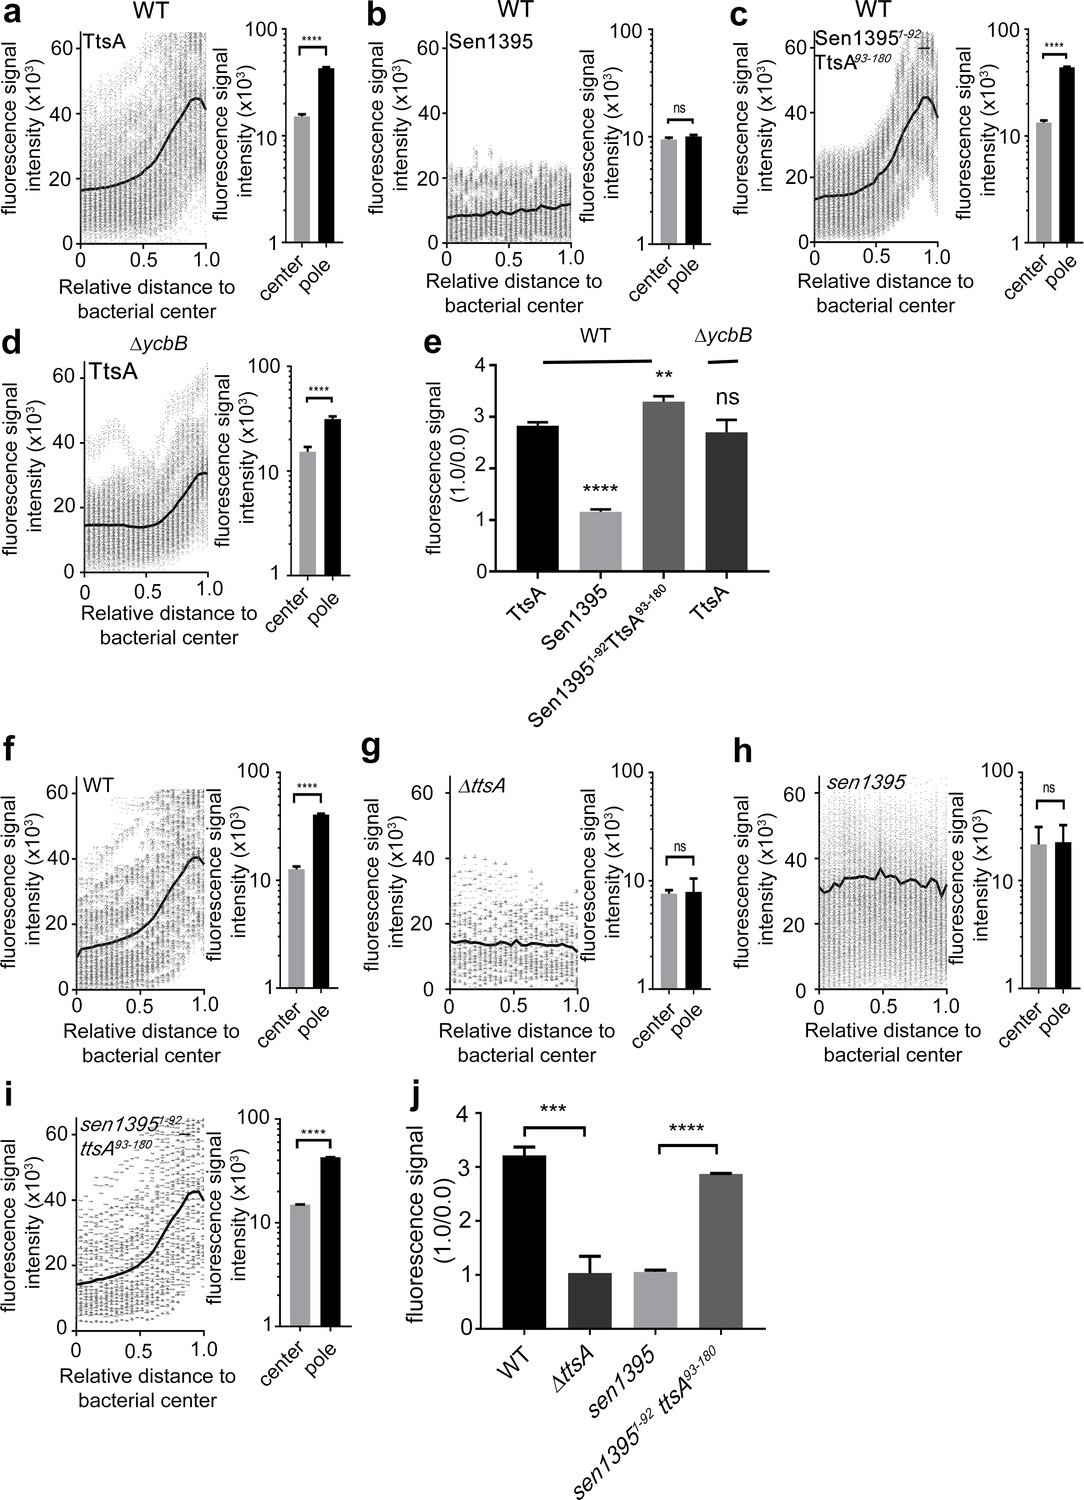
The carboxy-terminus of TtsA controls polar localization.
(a–e) Subcellular distribution of TtsA, Sen1395, and chimeric proteins. Wild type (a–c) or ∆ycbB (d) S. Typhi strains carrying chromosomally-encoded FLAG-tagged TtsA (a and d), Sen1395 (b) or the chimeric Sen1395-TtsA protein (c) were grown for 24 hr in TTIM, fixed, and stained with a mouse antibody directed to the 3xFLAG-epitope (green) (to visualize the muramidases) and a rabbit antibody directed to S. Typhi LPS (red). The scatter plots show fluorescence signal intensities for the indicated FLAG-tagged protein distributed along the axes of individual bacterial cells. Twenty-six measuring points were defined from the center (0) to each of the poles (1.0) of the bacterial cells and the distribution of the fluorescence intensity along the axes of bacteria were analyzed with the MicrobeJ plug-in of ImageJ (https://imagej.nih.gov/ij). The black line depicts the average of the intensities measured at each of the 26 measuring points. Data in each panel are from 1800 individual measurements at each of the measuring points from 900 bacteria analyzed in opposite directions from the center. The bar graphs next to each scatter plot show the quantification of the signal intensities at the measuring point furthest from the center (1.0), and at the center of each bacterium (0). Data represent the mean ± standard deviation from 1800 measurements (****p<0.0001, ns p=0.0864, two-sided Student`s t-Test) (a–d). (e) Bar graph shows the average ratios between the signal intensity of the indicated proteins measured at the furthest point from the center (1.0) and at the center of each bacterium (0.0) Data represent the mean ± standard deviation (****p<0.0001, **p<0.01, ns p=0.4369, two-sided Student`s t-Test). (f–j) TtsA- and Sen1395-mediated PG remodeling. S. Typhi wild type expressing ttsA (f), its isogenic ∆ttsA mutant (g), or S. Typhi strains expressing either sen1395 (h) or a sen1395-ttsA chimera (i) were grown in TTIM for 24 hr and the PG was metabolically labeled with alkyne-D-alanine. Remodeling PG was subsequently revealed with azido-AF488 after its linkage to the alkyne-D-alanine that had been incorporated into the PG layer. The scatter plots show the results of line scan analyses of fluorescence signal intensities along the axes of individual bacterial cells as described above. The line depicts the average fluorescence for each measured point. The bar graphs next to each scatter plot show the average ratios of the signal intensities measured at the furthest point from the center (1.0) and at the center of each bacterium (0.0). Data represent the mean ± standard deviation from 1800 measurements (****p<0.0001, ns p=0.8464 and p=0.8993, two-sided Student`s t-Test) (f–i). (j) Bar graph shows the average ratios between the signal intensity measured at the point furthest from the center (1.0) and at the center of each bacterium (0.0). Data represent the mean ± standard deviation (***p<0.001, ****p<0.0001, two-sided Student`s t-Test). (a–j) All data are derived from at least three independent experiments (Figure 2—source data 1).
-
Figure 2—source data 1
Contains source data related to Figure 2a and c.
- https://cdn.elifesciences.org/articles/53473/elife-53473-fig2-data1-v2.xlsx
Figure 2—figure supplement 1
Subcellular distribution of TtsA, Sen1395, and the indicated Sen1395-TtsA chimera.
The different strains (all encoding chromosomally-encoded FLAG-tagged TtsA) were grown for 24 hs in TTIM media, fixed, and stained with mouse anti-FLAG (to stain the different muramidases) (green) and rabbit anti S. Typhi LPS (to visualize bacterial cells) (red).
Figure 2—figure supplement 2
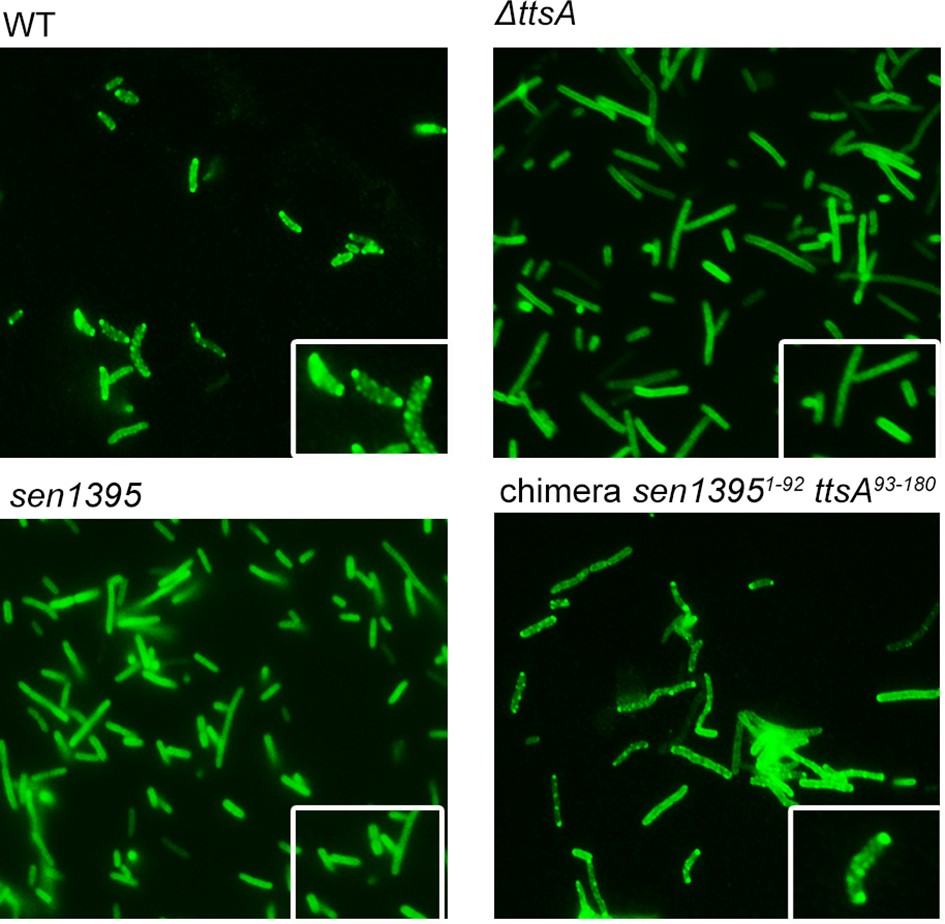
TtsA- and Sen1395-mediated PG remodeling.
S. Typhi wild type, its isogenic ∆ttsA mutant, or S. Typhi strains expressing either sen1395 or a sen1395-ttsA chimera were grown in TTIM for 24 hr and the PG was metabolically labeled with alkyne-D-alanine. Remodeling PG was subsequently revealed with azido-AF488 after its linkage to the alkyne-D-alanine that had been incorporated into the PG layer.
Figure 3 with 2 supplements
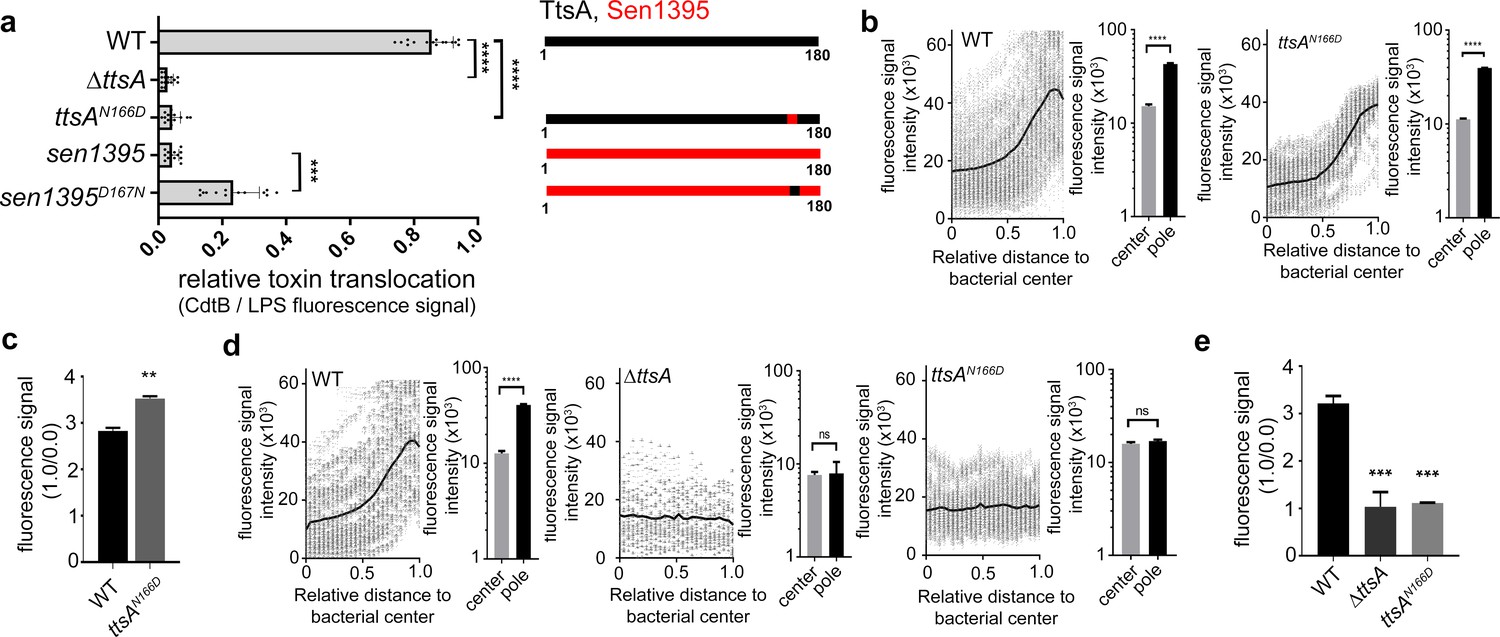
Polar localization and substrate recognition are mediated by different TtsA determinants.
(a) Typhoid toxin translocation across the PG layer. Wild type S. Typhi, the isogenic ∆ttsA mutant, or S. Typhi strains expressing ttsAN166D, or sen1395D167N, all encoding FLAG-tagged CdtB, were grown in TTIM for 24 hr. Bacteria were then fixed, treated with Triton X-100 (0.1%) and stained with mouse anti-FLAG (to stain CdtB) (green fluorescence) and rabbit anti S. Typhi LPS (to visualize bacterial cells) (red fluorescence). The relative amount of typhoid toxin translocation across the PG was quantified by immunofluorescence microscopy after staining with antibodies to the FLAG epitope (to visualize CdtB, a component of typhoid toxin), and LPS (to visualize bacterial cells). The average ratios of typhoid toxin- and LPS-associated fluorescence intensity ± standard deviation are shown (****p<0.0001, ***p<0.001, two-sided Student`s t-Test). For each experiment a total of 10 images were collected from which 100 randomly selected bacteria per image were analyzed. A diagram of the different constructs is also shown (right panel). (b-c) TtsA subcellular localization in different S. Typhi strains. S. Typhi strains carrying chromosomally-encoded 3xFLAG-tagged wild type TtsA or TtsAN166D were grown for 24 hr in TTIM, fixed, and stained with a mouse antibody directed to the FLAG-epitope (green) (to visualize TtsA) and a rabbit antibody directed to S. Typhi LPS (red). The scatter plot shows the line scan analysis of fluorescence intensity along the axes of individual bacterial cells as described in Figure 2. The bar graphs next to each scatter plot show the average ratios of the signal intensities measured at the furthest point from the center (1.0) and at the center of each bacterium (0.0). Data represent the mean ± standard deviation from 1800 measurements (****p<0.0001, two-sided Student`s t-Test). (c) Bar graph shows the average ratios between the signal intensity of the indicated proteins measured at the point furthest from the center (1.0) and at the center of each bacterium (0.0). Data represent the mean ± standard deviation (**p<0.01, two-sided Student`s t-Test). (d-e) TtsA- and TtsAN166D-mediated PG remodeling. S. Typhi wild type, the isogenic ∆ttsA mutant or a strain expressing ttsAN166D were grown in TTIM for 24 hr and the PG was metabolically labeled with alkyne-D-alanine. Remodeling PG was subsequently revealed with azido-AF488 after its linkage to the alkyne-D-alanine that had been incorporated into the PG layer. The scatter plots show the results of line scan analyses of fluorescence signal intensities along the axes of individual bacterial cells as described above. The line depicts the average fluorescence for each measured point. The bar graphs next to the scatter plots show the average ratios of the signal intensities measured at the furthest point from the center (1.0) and at the center of each bacterium (0.0) Data represent the mean ± standard deviation (****p<0.0001, ns p=0.8464, ns p=0.8741 two-sided Student`s t-Test) (Note: the data of the ∆ttsA mutant is the same as Figure 2g and is shown here to facilitate comparison). (e) The average ratios of the signal intensities of the indicated strains measured at the furthest point from the center (1.0) and at the center of each bacterium (0.0). Data represent the mean ± standard deviation (***p<0,001, two-sided Student`s t-Test). (a–e) All data are derived from at least three independent experiments (Figure 3—source data 1).
-
Figure 3—source data 1
Contains source data related to Figures 3a, b and d.
- https://cdn.elifesciences.org/articles/53473/elife-53473-fig3-data1-v2.xlsx
Figure 3—figure supplement 1
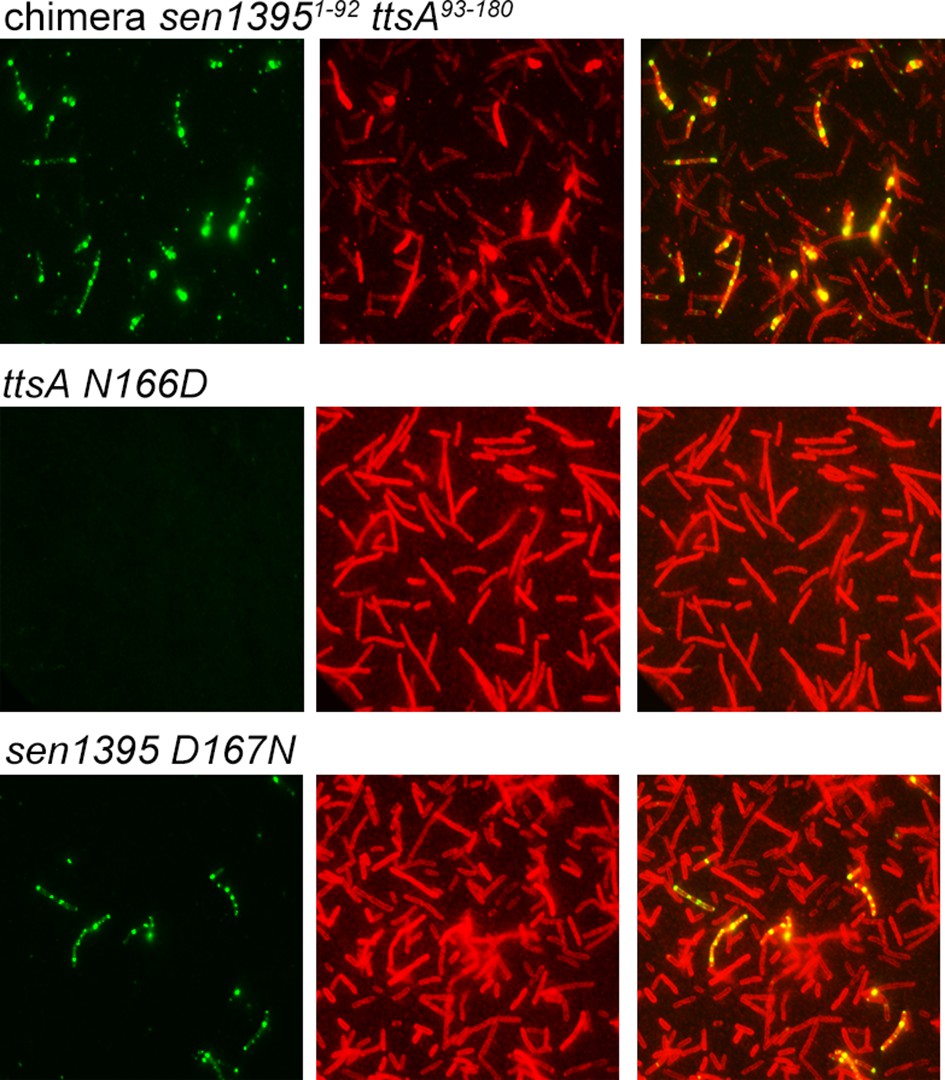
Ability of S. Enteritidis Sen1395-TtsA chimeric or mutant proteins to complement a S. Typhi ∆ttsA mutant strain for typhoid toxin translocation across the PG.
S. Typhi ∆ttsA carrying chromosomally-encoded FLAG-tagged CdtB and expressing the indicated S. Enteritidis Sen13951 chimeras or mutants were grown for 24 hs in TTIM media, fixed, treated with Triton X-100 (0.1%) and then stained with mouse anti-FLAG (to stain CdtB) (green) and rabbit anti S. Typhi LPS (to visualize bacterial cells) (red).
Figure 3—figure supplement 2
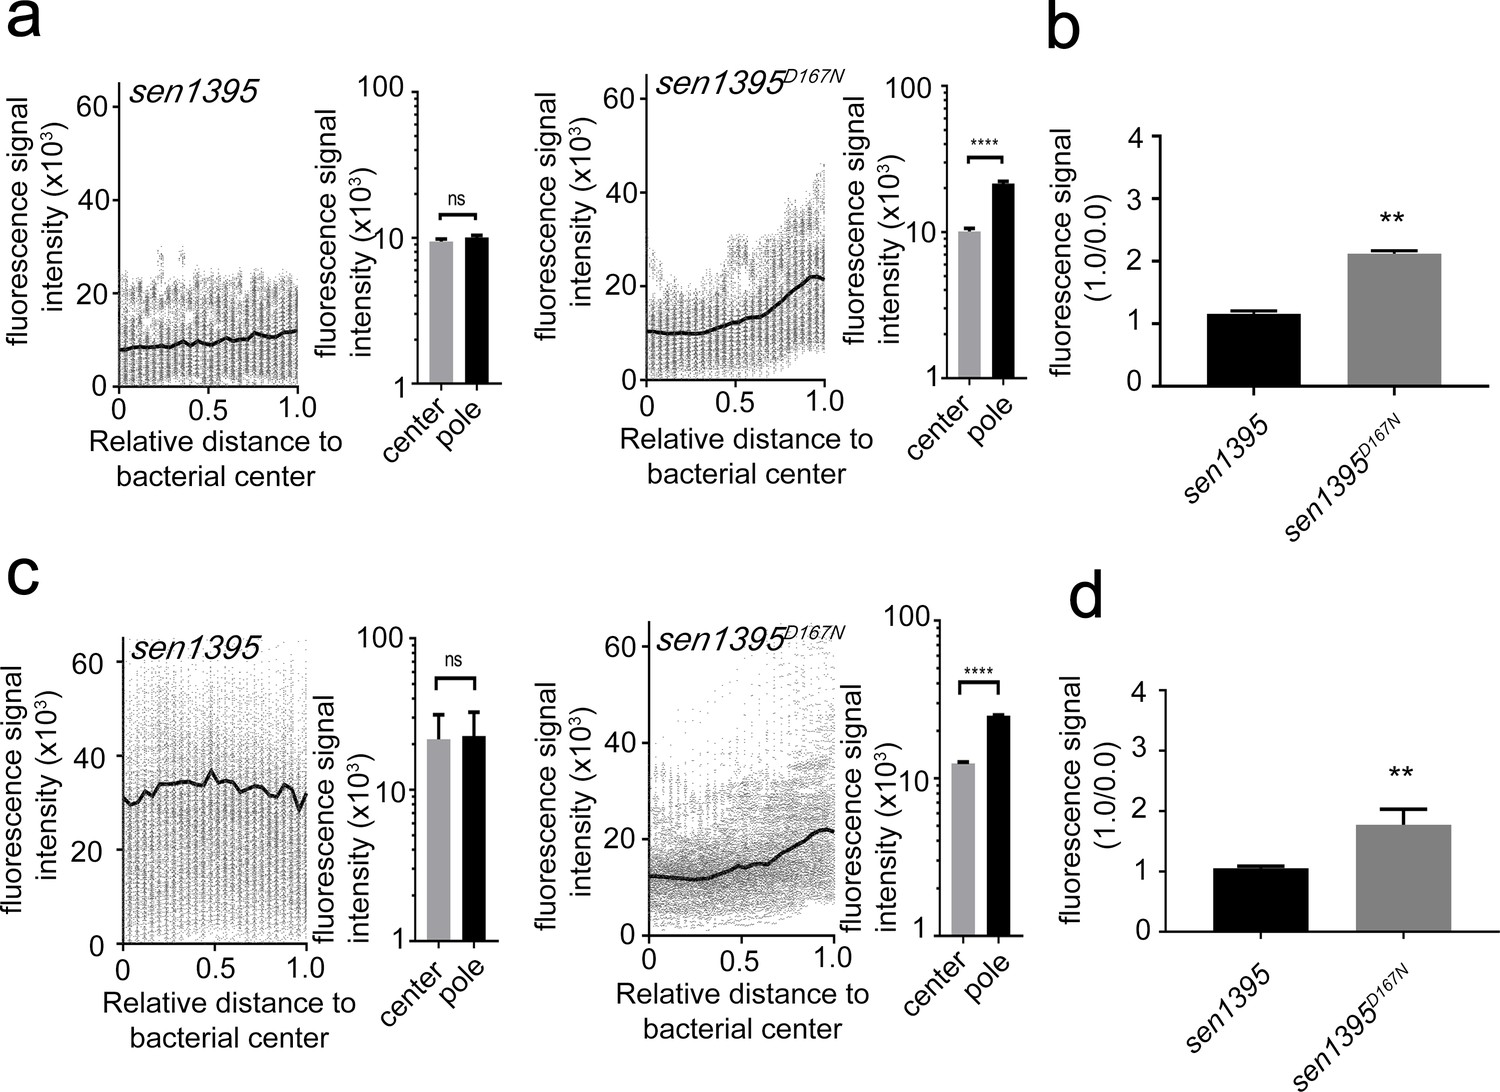
Subcellular localization of Sen1395D167N.
(a and b) Subcellular distribution of Sen1395D167N. S. Typhi strains carrying chromosomally-encoded FLAG-tagged Sen1395 or Sen1395D167N were grown for 24 hr in TTIM, fixed, and stained with a mouse antibody directed to the 3xFLAG-epitope (to visualize the muramidases) and a rabbit antibody directed to S. Typhi LPS. The scatter plots show fluorescence signal intensities for the indicated FLAG-tagged protein distributed along the axes of individual bacterial cells (a). The black line depicts the average of the intensities measured at each of the 26 measuring points. Data in each panel are from 1800 individual measurements at each of the measuring points from 900 bacteria analyzed in opposite directions from the center. The bar graphs next to each scatter plot show the quantification of the signal intensities at the measuring point furthest from the center (1.0), and at the center of each bacterium (0). Data represent the mean ± standard deviation from 1800 measurements (****p<0.0001, ns p=0.864, two-sided Student`s t-Test). (b) Bar graph shows the average ratios between the signal intensity of the indicated proteins measured at the furthest point from the center (1.0) and at the center of each bacterium (0.0) Data represent the mean ± standard deviation (**p<0.01, two-sided Student`s t-Test). (c and d) Sen1395D167N-mediated PG remodeling. S. Typhi strains carrying chromosomally-encoded FLAG-tagged Sen1395 or Sen1395D167N were grown in TTIM for 24 hr and the PG was metabolically labeled with alkyne-D-alanine. Remodeling PG was subsequently revealed with azido-AF488 after its linkage to the alkyne-D-alanine that had been incorporated into the PG layer. The scatter plots show the results of line scan analyses of fluorescence signal intensities along the axes of individual bacterial cells (c). The line depicts the average fluorescence for each measured point. The bar graphs next to each scatter plot show the average ratios of the signal intensities measured at the furthest point from the center (1.0) and at the center of each bacterium (0.0). Data represent the mean ± standard deviation from 1800 measurements (****p<0.0001, ns p=0.8993, two-sided Student`s t-Test). (d) Bar graph shows the average ratios between the signal intensity measured at the point furthest from the center (1.0) and at the center of each bacterium (0.0). Data represent the mean ± standard deviation (**p<0.01, two-sided Student`s t-Test). Note: the data on wild type Sen1395 is the same as the data shown in Figure 2b and h and is shown here to facilitate comparison.
Figure 4 with 4 supplements
The atomic structure of TtsA reveals two independent domains with distinct functions.
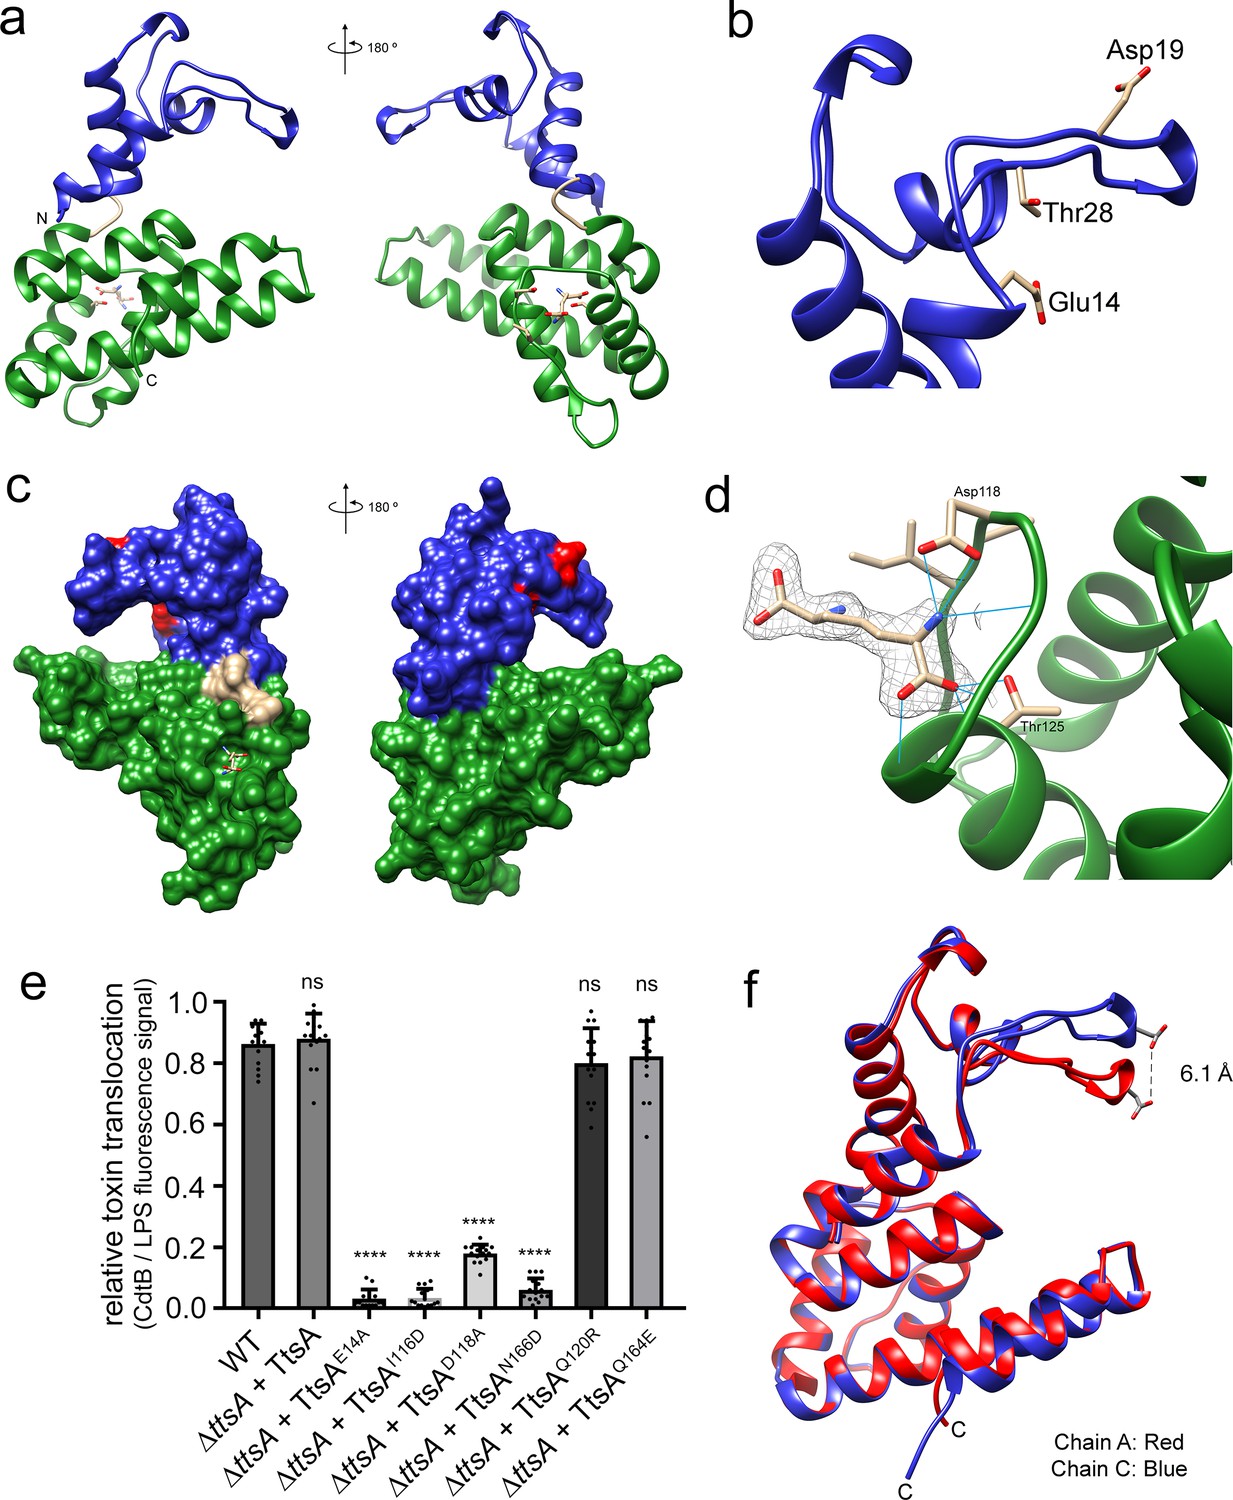
(a) Two opposite views of the overall structure of TtsA in ribbon representation. The catalytic domain is shown in blue while the substrate-binding domain is shown in green, linked by a loop (cream colored). (b) Close up view of the catalytic domain showing the lysozyme-like catalytic triad in TtsA. (c) Two opposite views of the surface rendering of TtsA. The color scheme is the same as in panel (a) with the catalytic triad colored in red. (d) Close up view of the diaminopimelic acid (API) binding pocket in the substrate-binding domain. The electron density map (2Fo-Fc, 1σ level) is shown with the modeled API (DAP) and hydrogen bonds between API (DAP) and TtsA marked by blue lines. (e) Typhoid toxin translocation across the PG layer in S. Typhi strains expressing structurally-guided TtsA mutants. S. Typhi wild type and isogenic ∆ttsA mutant strains (all expressing 3xFLAG-tagged CdtB) carrying plasmids expressing from an arabinose-inducible promoter the indicated ttsA mutants, were grown in TTIM containing 0.001% arabinose for 24 hr at 37°C. The relative amount of typhoid toxin translocation across the PG was quantified by immunofluorescence microscopy after staining with antibodies to the FLAG epitope (to visualize CdtB, a component of typhoid toxin), and LPS (to visualize bacterial cells). The average ratios of typhoid toxin- and LPS-associated fluorescence intensity ± standard deviation are shown (****p<0.0001, ns p=0.5629, p=0.0749, p=0.2450, two-sided Student`s t-Test). For each experiment a total of 10 images were collected from which 100 randomly selected bacteria per image were analyzed. Data are derived from three independent experiments (Figure 4—source data 1). (f) Comparison of the crystal structures of the TtsA chain A in red and chain C in blue, showing the conformational differences in the catalytic flap.
-
Figure 4—source data 1
Contains source data related to Figure 4e.
- https://cdn.elifesciences.org/articles/53473/elife-53473-fig4-data1-v2.xlsx
Figure 4—figure supplement 1
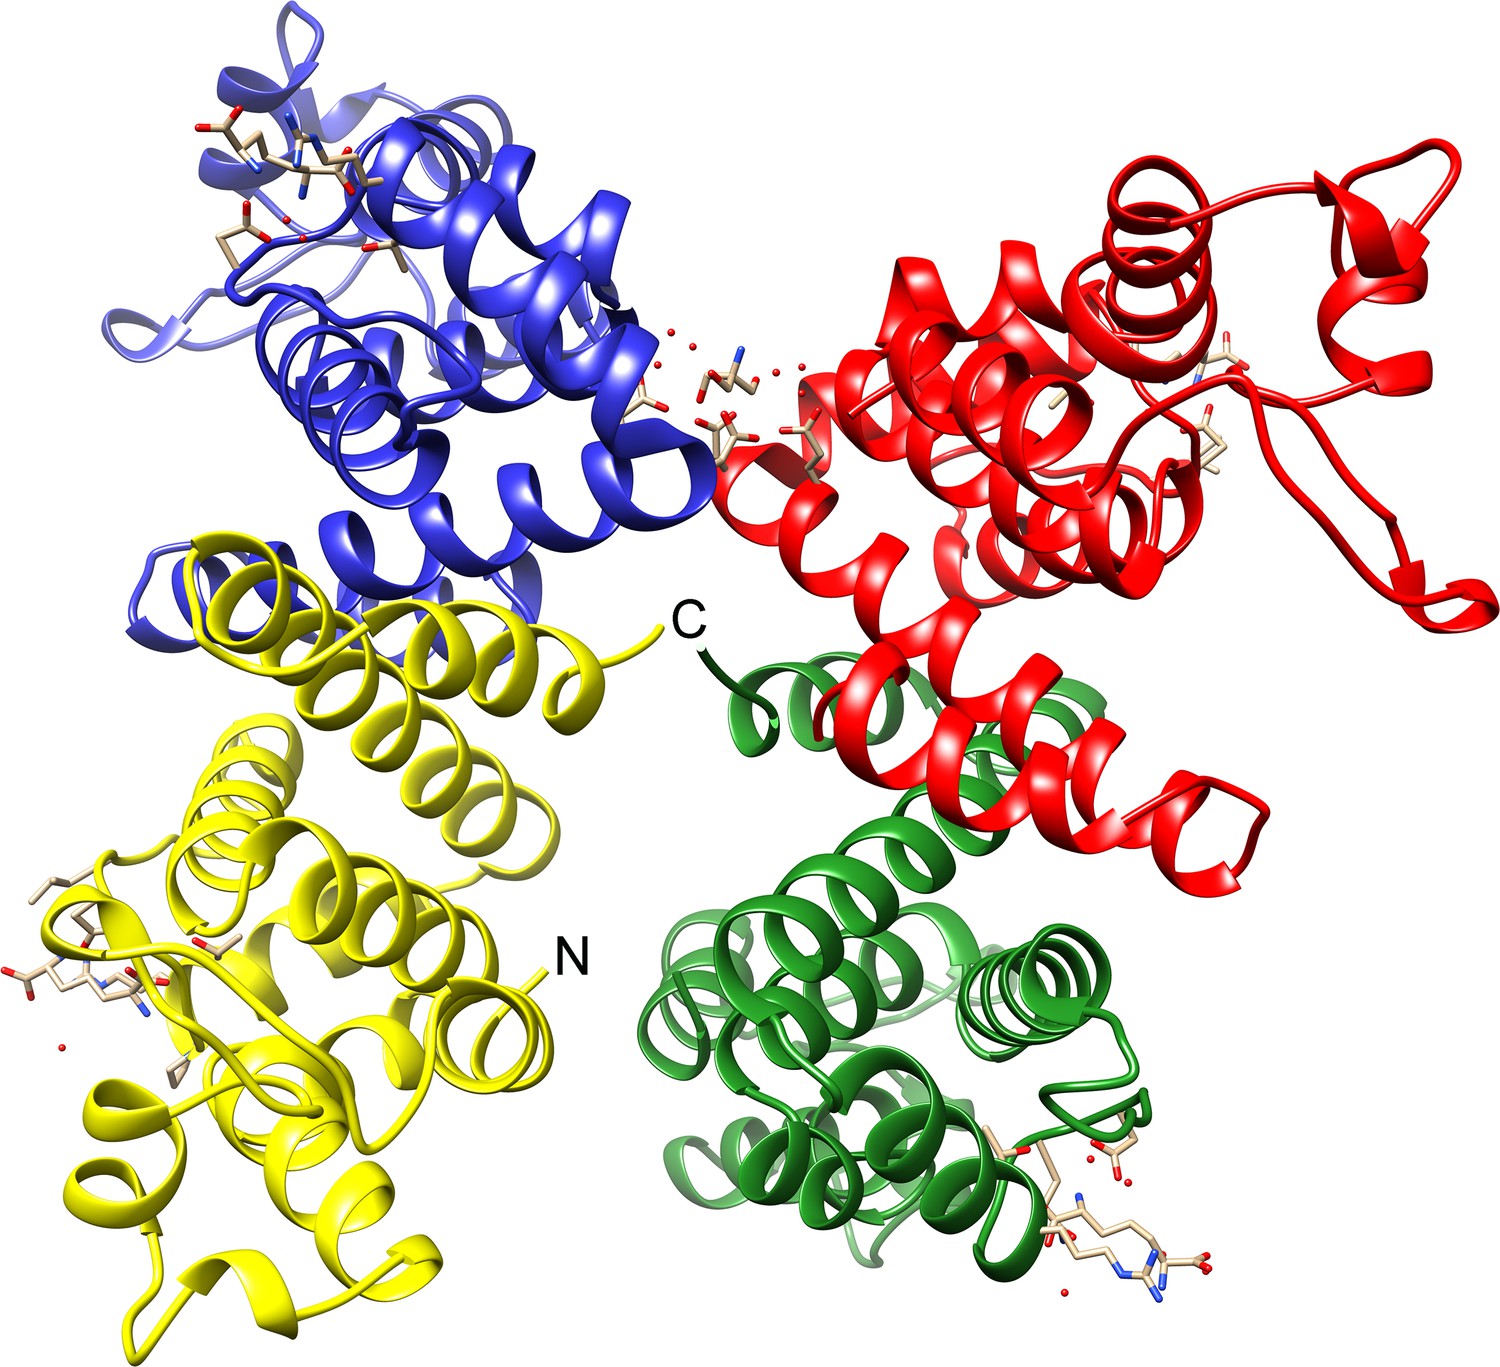
Overall view of the four monomers present in the asymmetric unit of the TtsA crystal.
Figure 4—figure supplement 2
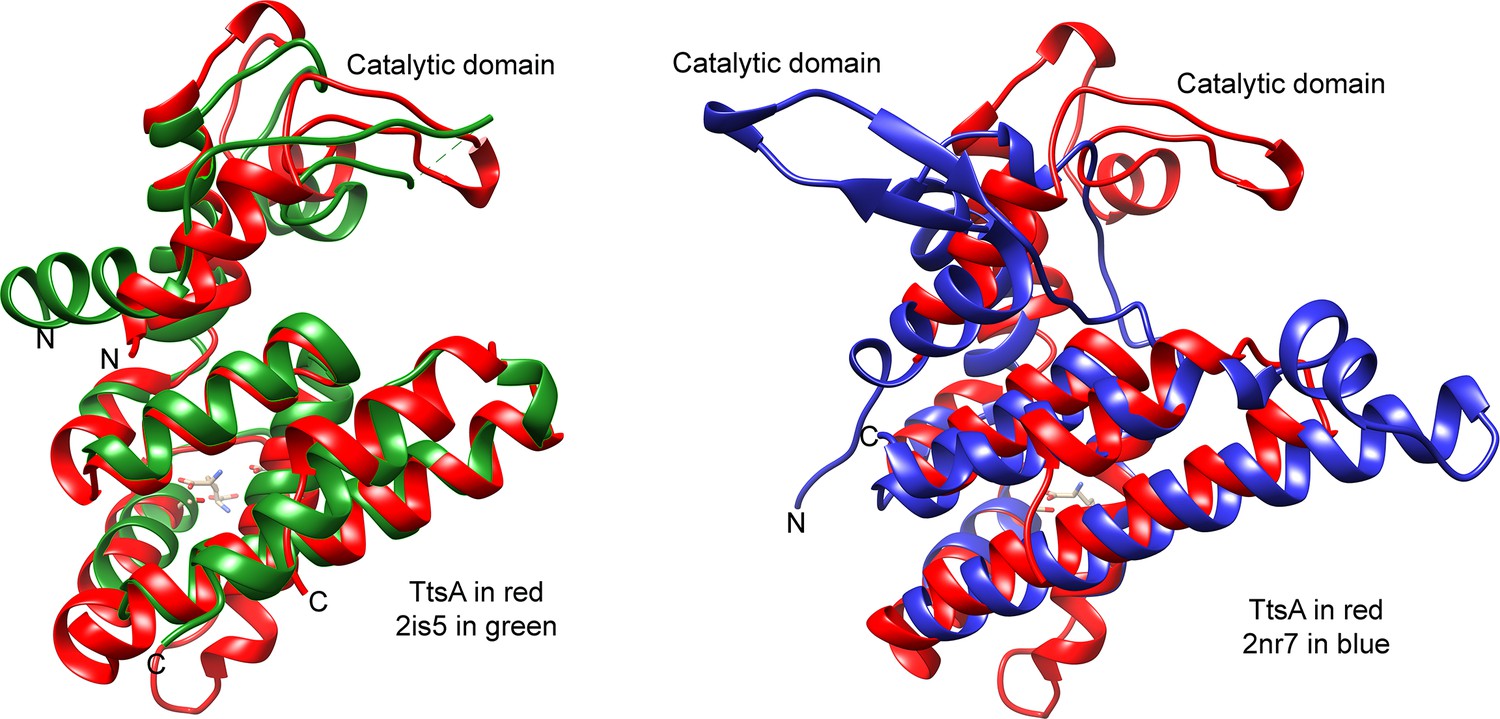
Structural comparison of TtsA with NMB1012 from Neisseria meningitides (PDB 2is5, left panel) and PG_0293 from Porphyromonas gingivalis (PDB 2nr7, right panel).
The translocation of the catalytic domain of PG_0293 relative to TtsA’s is indicated.
Figure 4—figure supplement 3
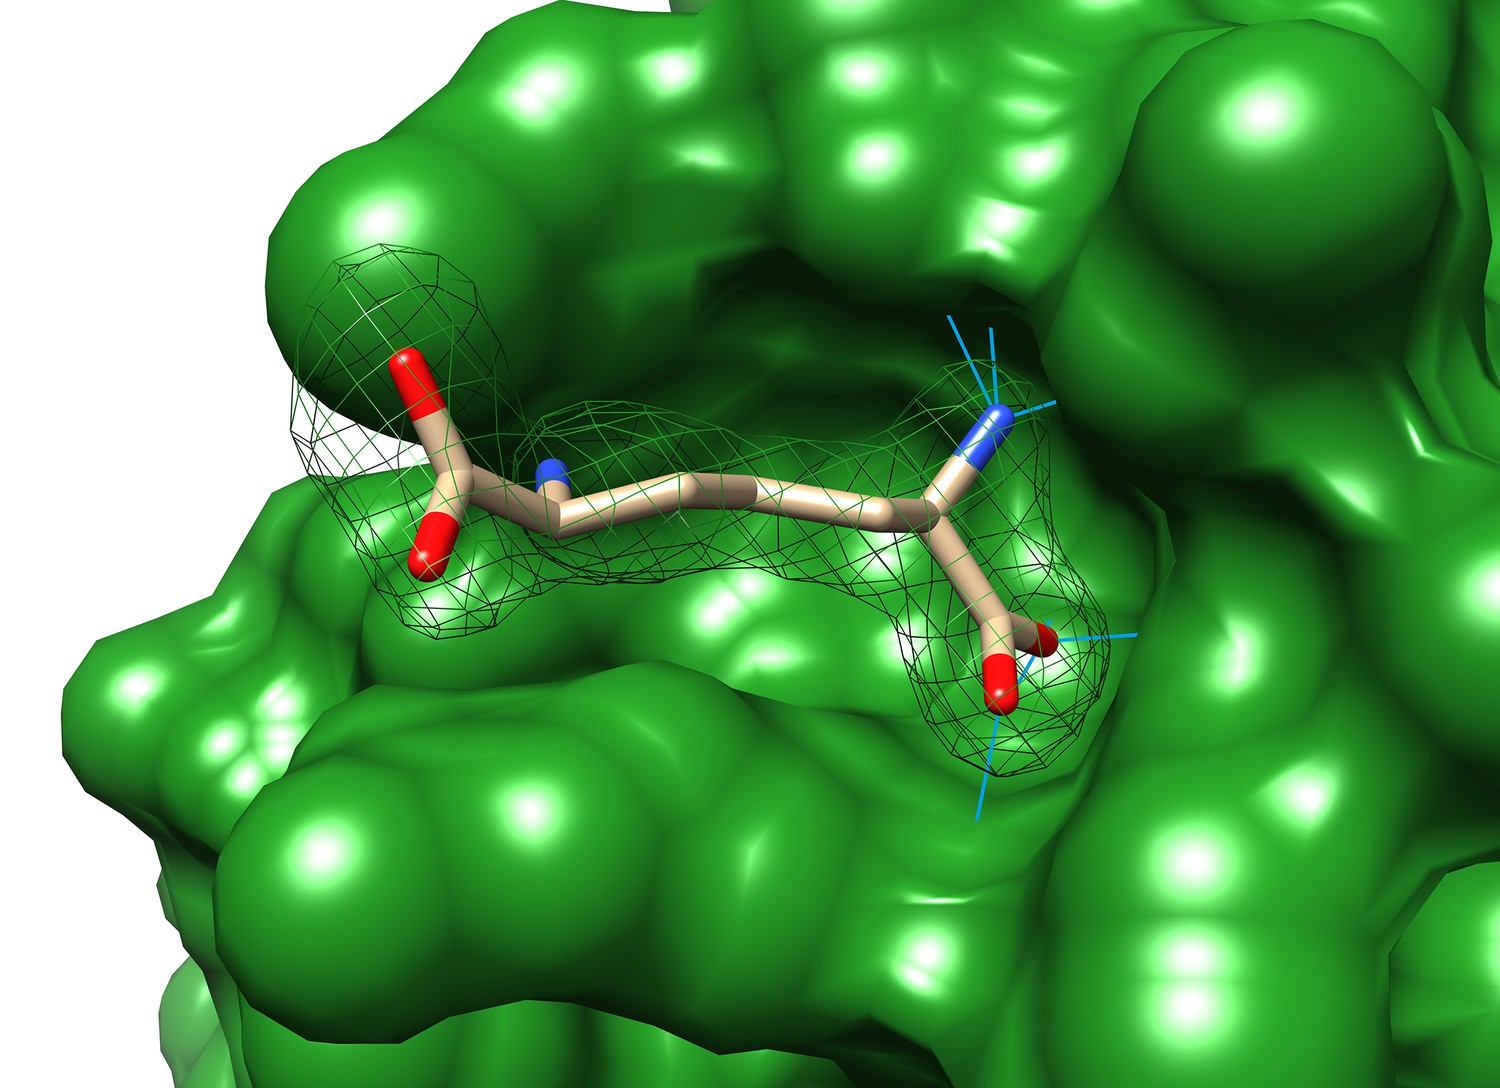
Close up of the surface rendering of the diaminopimelic (API) binding pocket.
The electron density map (2Fo-Fc, 1 s level) is shown with API modeled and hydrogen bonds between API and TtsA marked by blue lines.
Figure 4—figure supplement 4
Western blot analysis of the expression levels of TtsA and CdtB in the indicated S. Typhi strains assayed in Figure 4E.
The amount of RecA was used as a loading control and analyzed on a separate Western blot.
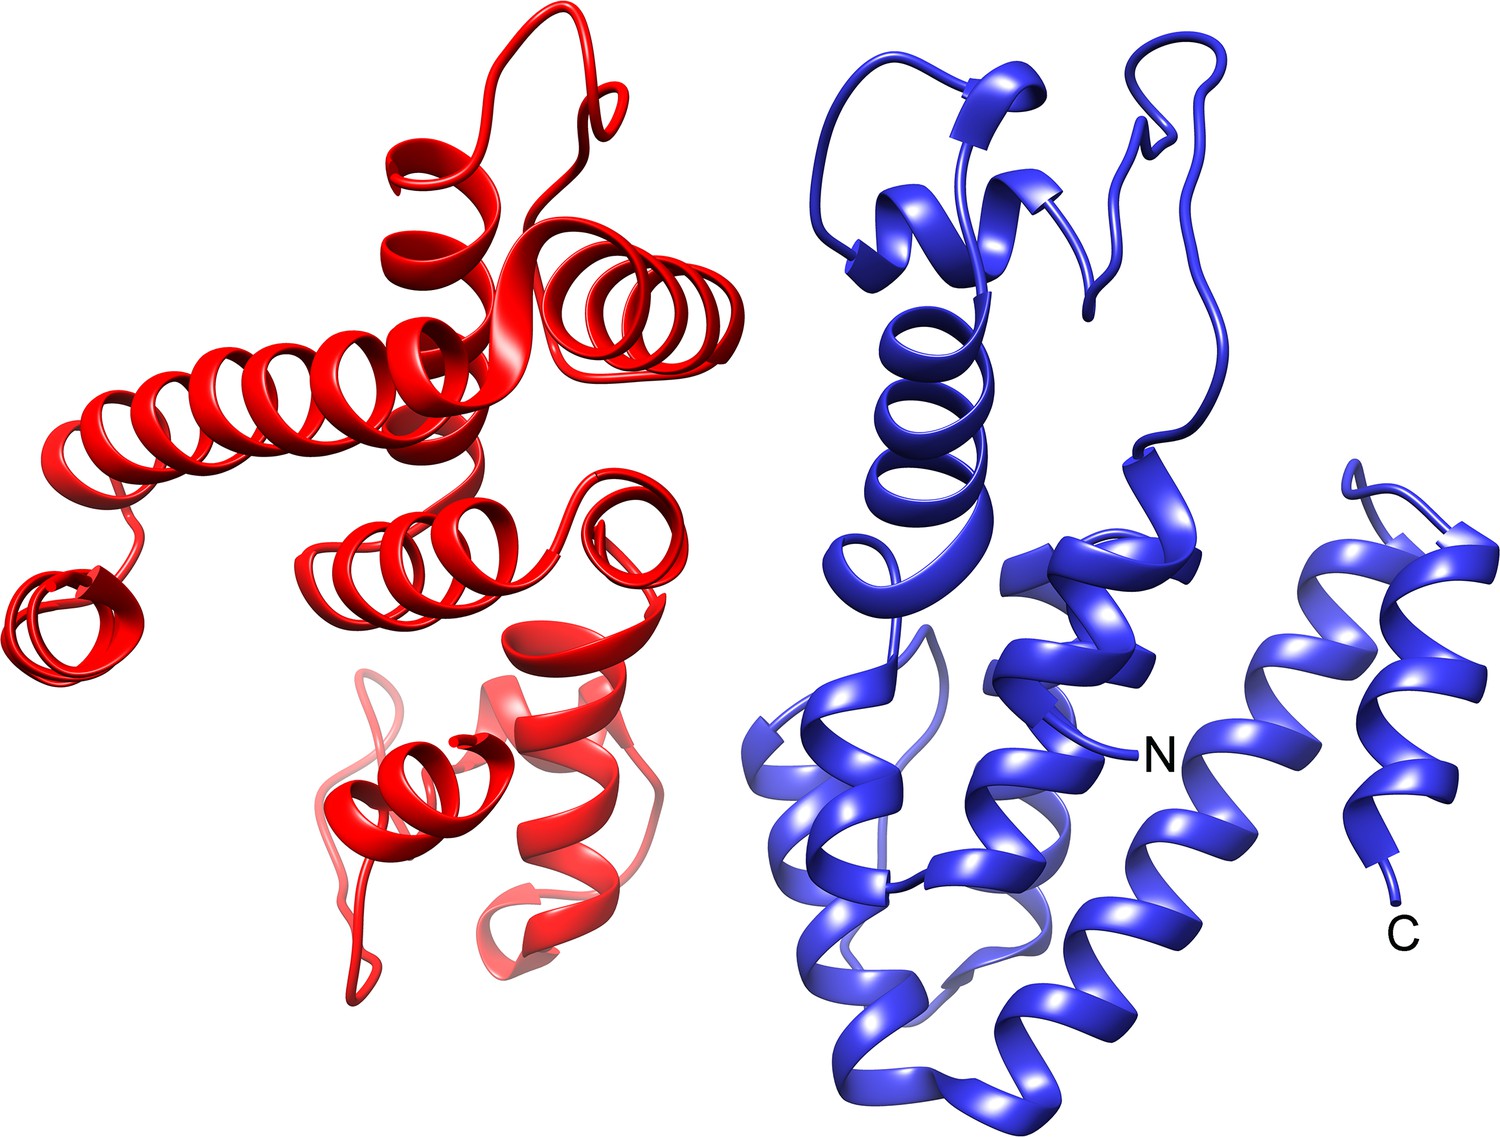
Figure 5 with 2 supplements
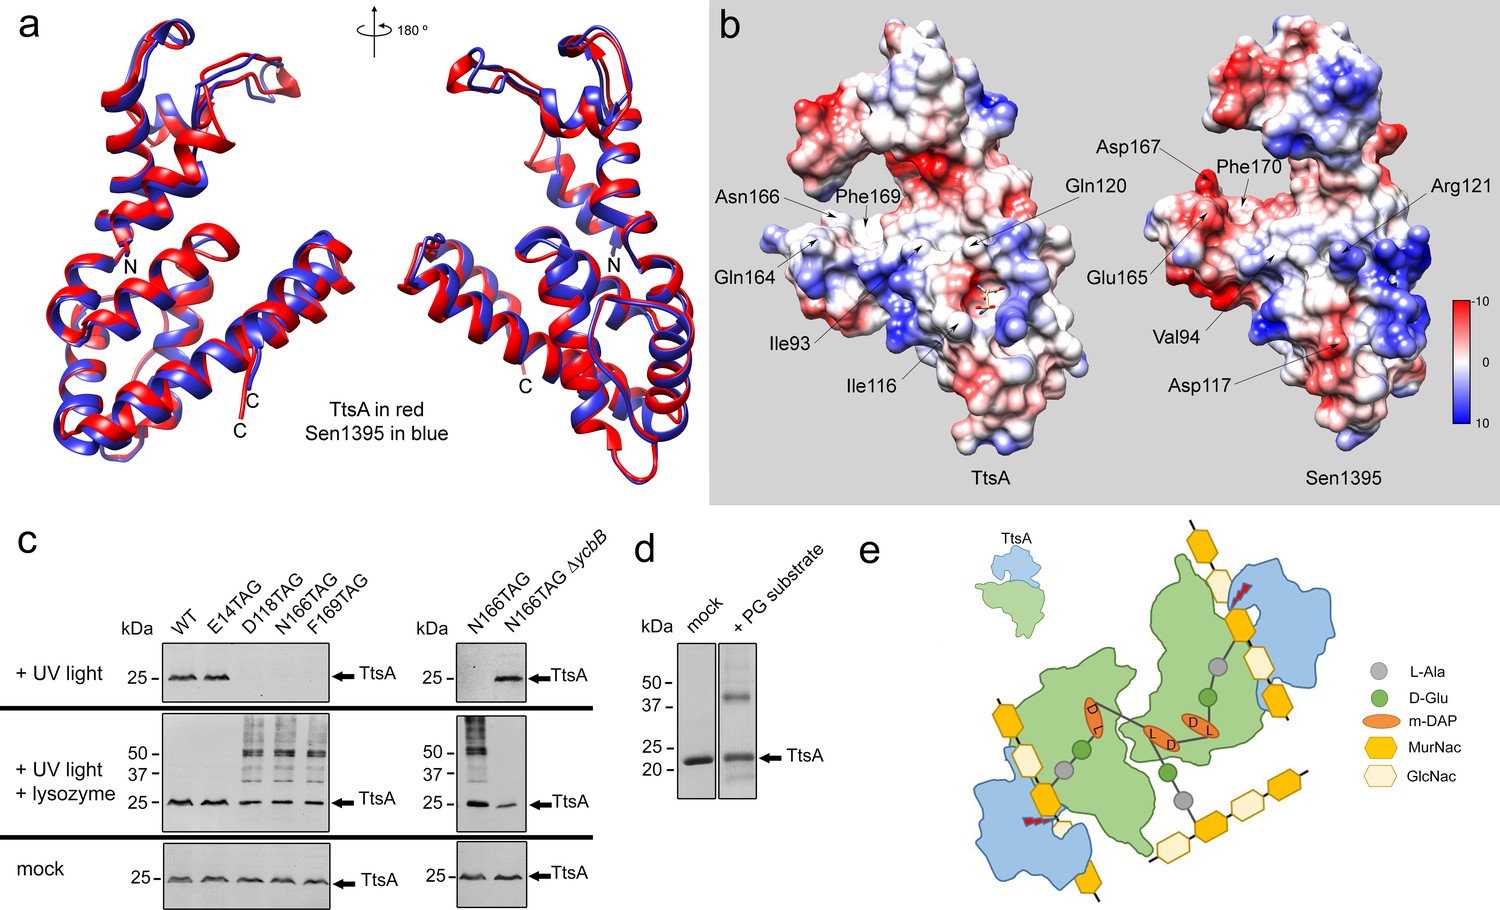
Structural bases for TtsA substrate specificity.
(a) Two opposite views of the comparison of the crystal structures of TtsA (in red) and Sen1395 (in blue) in ribbon representation. (b) Surface rendering of TtsA and Sen1395 colored by electrostatic potential according to Coulomb’s law (blue: positive; red: negative). Critical residues in the substrate-binding groove are indicated. (c) In-vivo photo-crosslinking of selected TtsA residues within its substrate-binding groove. Wild-type S. Typhi, an isogenic ycbB mutant, or S. Typhi strains carrying chromosomally encoded 3xFLAG-tagged wild type and mutant TtsA with an amber codon (TAG) at positions E14, D118, N166 or F169, all expressing the orthogonal suppressor aminoacyl-tRNA synthetase/tRNA pair, were grown 24 hr at 37°C in TTIM containing 1 mM pBpa. Cultures were split and exposed to UV light or exposed to UV light followed by treatment with lysozyme (as indicated). Cross-linked species were analyzed by western blotting using mouse-anti FLAG antibodies. (d) In vitro chemical crosslinking of purified TtsA. Purified TtsA was mixed with PBS (mock) or mixed with purified PG isolated from S. Typhi. The mixtures were incubated with the amine-to-amine crosslinker BS3 (bis(sulfosusinimidyl)suberate) and subsequently analyzed by SDS-PAGE. (e) Model for the TtsA mechanism of substrate recognition. TtsA monomers recognize adjacent peptide stems of PG polymers that are the subject of complex L-D crosslinking patterns that yield trimers and tetramers after lysozyme treatment. The cartoon does not imply any specific position of any specific domain of the TtsA molecule relative to the stem peptides or the glycan strands.
Figure 5—figure supplement 1
Overall view of the two monomers present in the asymmetric unit of the Sen1395 crystal.
Figure 5—figure supplement 2
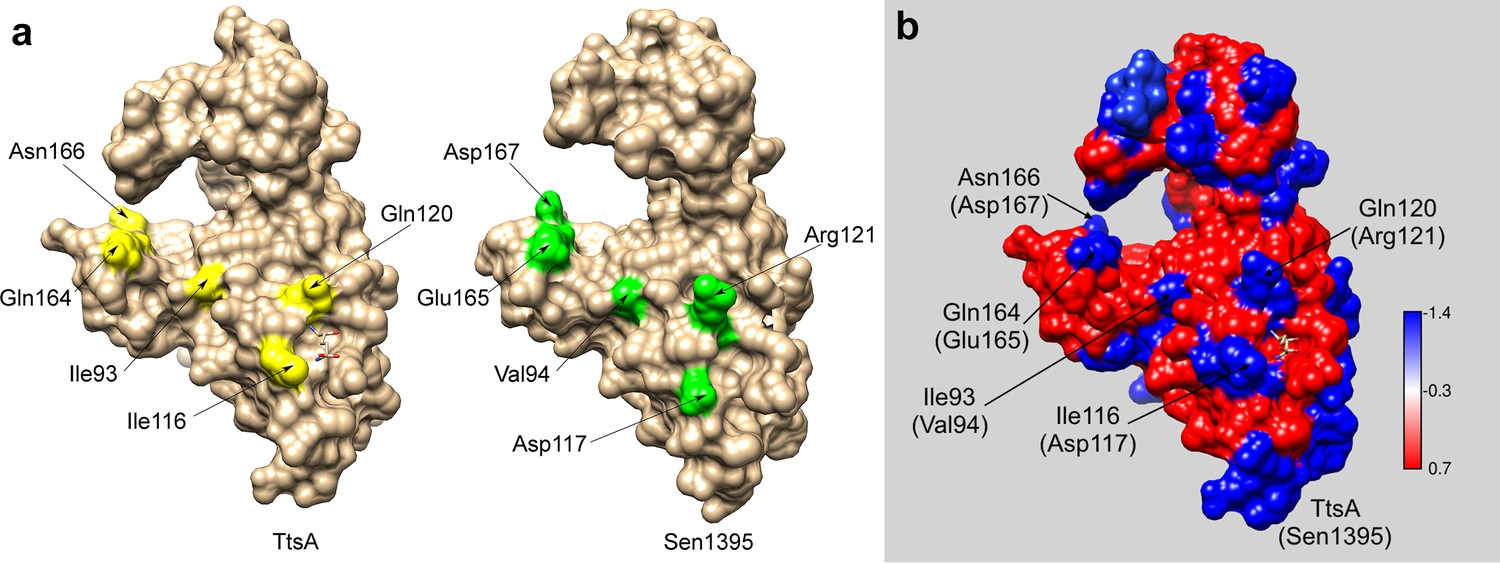
Critical non-conserved residues in the substrate-binding groove of TtsA and Sen1395.
(a) Surface rendering of TtsA (left) and Sen1395 (right) with the critical for specificity non-conserved residues colored in yellow (TtsA) or green (Sen1395). (b) Surface rendering of the TtsA and Sen1395 alignment colored by sequence conservation.
Videos
Video 1
Conformational differences between chain A and chain C of the TtsA crystal.
Tables
Key resources table
| Reagent type (species) or resource | Designation | Source or reference | Identifiers | Additional information |
|---|---|---|---|---|
| Gene (Salmonella enterica serovar Typhi) | ttsA | PMID: 23174673; MicrobesOnline Database | sty1889 | |
| Gene (S. Typhi) | ycbB | PMID: 30250245; MicrobesOnline Database | sty0997 | |
| Gene (Salmonella enteritidis) | sen1395 | PMID: 30250245; MicrobesOnline Database | sen1395 | |
| Gene (S. Typhi) | cdtB | PMID: 18191792; MicrobesOnline Database | sty1886 | |
| Strain, strain background (Escherichia coli) | BL21 (DE3) | Invitrogen | Galan lab; electro competent | |
| Strain, strain background (Escherichia coli) | β−2163 Δnic 35 (DAP-) | PMID: 15748991 | ||
| Strain, strain background (Escherichia coli) | B834 (DE3) | Novagen | Cat. No. 69041 | |
| Strain, strain background (Salmonella enterica serovar Typhi) | ISP2825 | PMID: 1879916 | ||
| Antibody | anti-FLAG M2 (Monoclonal mouse) | Sigma-Aldrich | 1:10000 | |
| Antibody | anti-Salmonella O poly A-1 and Vi (Polyclonal rabbit) | Becton, Dickinson and Co | 1:10000 | |
| Antibody | Alexa-Fluor 488-conjugated anti-mouse | Invitrogen | 1:2000 | |
| Antibody | Alexa-Fluor 594-conjugated anti-rabbit | Invitrogen | 1:2000 | |
| Recombinant DNA reagent | pSB 890 (plasmid) | PMID: 7997169 | ||
| Recombinant DNA reagent | pET28b (plasmid) | Invitrogen | ||
| Recombinant DNA reagent | pSB 3783 (plasmid) | PMID: 30250245 | pBAD24 | |
| Sequence-based reagent | ttsAfor | This paper | PCR primers | ATGACTAAAGATGAAATC |
| Sequence-based reagent | ttsArev | This paper | PCR primers | TTACAATCTTACCCGTTC |
| Sequence-based reagent | sen1395for | This paper | PCR primers | ATGAAACCGAAGGACGAA |
| Sequence-based reagent | sen1395rev | This paper | PCR primers | TCATATCAATACGCGCTC |
| Sequence-based reagent | ycbBfor | This paper | PCR primers | ATGTTGCTTAATAAGATG |
| Sequence-based reagent | ycbBrev | This paper | PCR primers | TTACCTGATTAATTGTTC |
| Software, algorithm | ImageJ with Microbe J plug in | http://rsbweb.nih.gov/ij/; PMID: 27572972 |
Additional files
-
Supplementary file 1
Data collection and refinement statistics.
Values in parenthesis are for the highest resolution shell.
- https://cdn.elifesciences.org/articles/53473/elife-53473-supp1-v2.docx
-
Supplementary file 2
Strains and plasmids.
- https://cdn.elifesciences.org/articles/53473/elife-53473-supp2-v2.docx
-
Transparent reporting form
- https://cdn.elifesciences.org/articles/53473/elife-53473-transrepform-v2.docx
Download links
A two-part list of links to download the article, or parts of the article, in various formats.
Downloads (link to download the article as PDF)
Open citations (links to open the citations from this article in various online reference manager services)
Cite this article (links to download the citations from this article in formats compatible with various reference manager tools)
Mechanisms of substrate recognition by a typhoid toxin secretion-associated muramidase
eLife 9:e53473.
https://doi.org/10.7554/eLife.53473


