Epigenetic regulation of Wnt7b expression by the cis-acting long noncoding RNA Lnc-Rewind in muscle stem cells
- Department of Biology and Biotechnology Charles Darwin, Sapienza University of Rome, Italy
- Institute of Molecular Biology and Pathology (IBPM), National Research Council (CNR) at Sapienza University of Rome, Italy
- Center for Life Nano Science at Sapienza, Istituto Italiano di Tecnologia, Italy
Figures
Figure 1 with 1 supplement
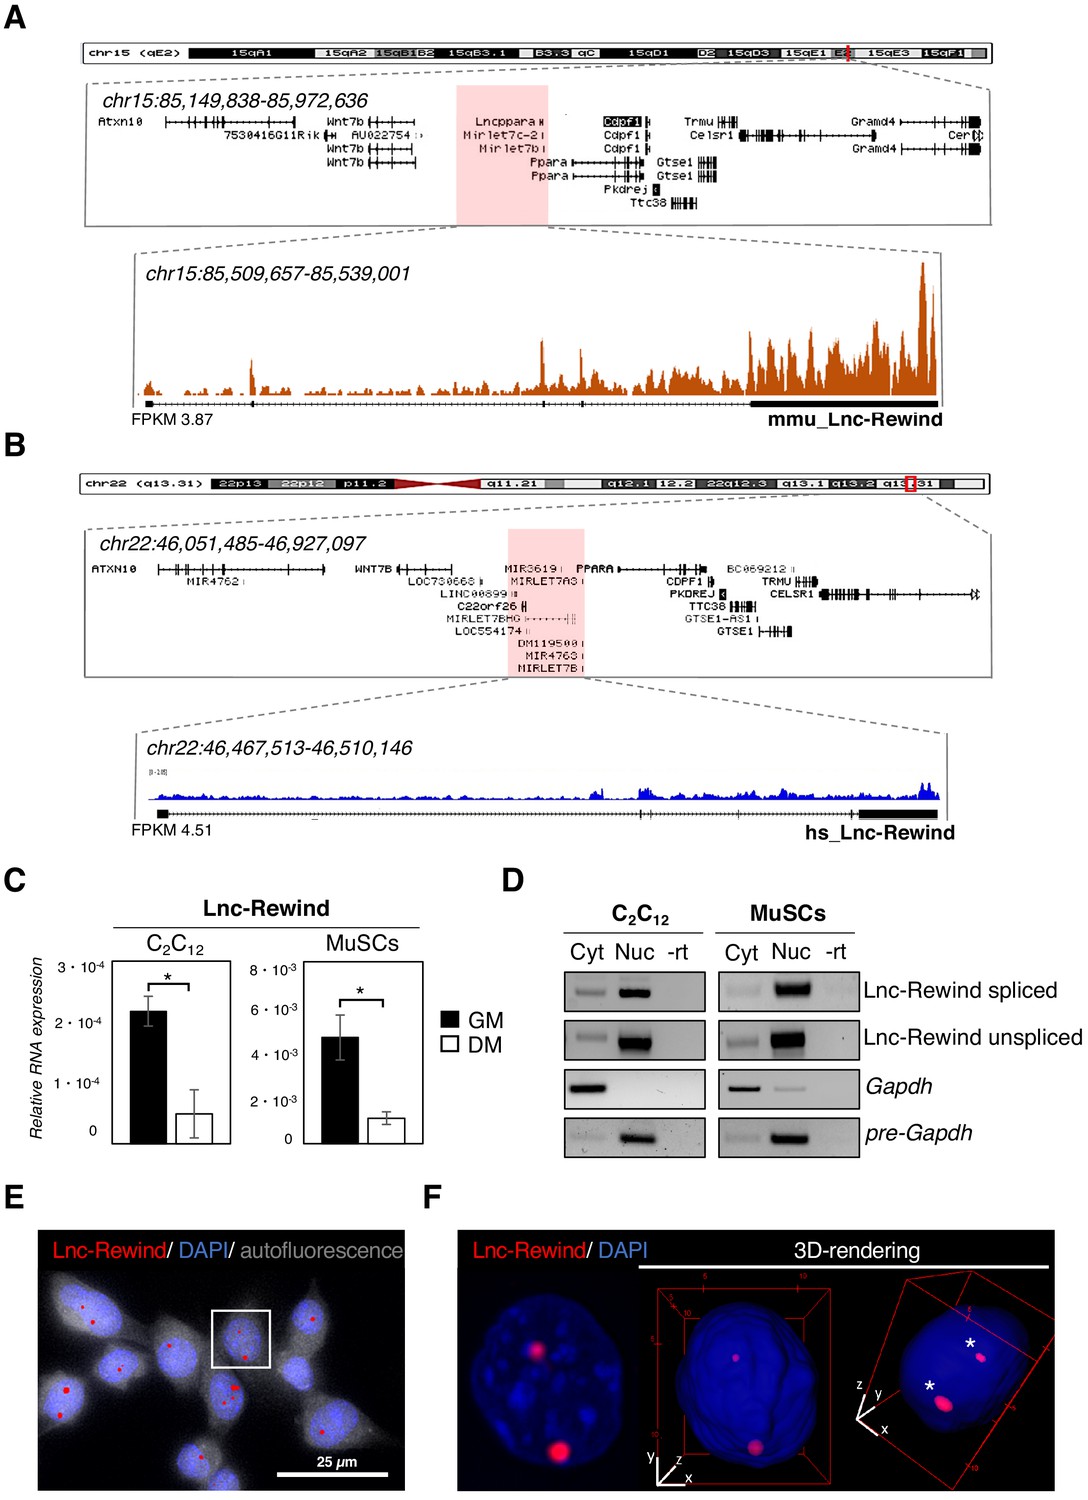
Lnc-Rewind is a conserved chromatin-associated lncRNA expressed in satellite cells.
(A) UCSC visualization showing the chromosome position and the genomic coordinates of Lnc-Rewind (red shade) in the mm9 mouse genome. Mmu_Lnc-Rewind reads coverage and quantification (FPKM) from RNA-Seq experiments performed in proliferating C2C12 cells (Ballarino et al., 2015; GSE94498) are shown. (B) UCSC visualization showing the chromosome position and the genomic coordinates of hs_Lnc-Rewind (red shade) in the hg19 human genome. Hs_Lnc-Rewind reads coverage and quantification (FPKM) from RNA-Seq experiments performed in proliferating myoblasts (Legnini et al., 2017; GSE70389) are shown together with the genomic structure of the human locus (magnified box). (C) Relative Lnc-Rewind expression assessed by quantitative RT-PCR (qRT-PCR) in C2C12 myoblast (C2C12) and MuSC-derived myoblasts (referred as MuSCs) maintained in growing (GM) or differentiated (DM) conditions. Data represent the mean ± SEM from three biological replicates. Gapdh RNA was used as a normalization control. (D) Semiquantitative RT-PCR (sqRT-PCR) analysis of spliced and unspliced Lnc-Rewind isoforms in cytoplasmic (Cyt) and nuclear (Nuc) fractions from proliferating C2C12 and MuSC-derived myoblasts. The quality of fractionation was tested with mature (Gapdh) and precursor (pre-Gapdh) RNAs. –rt represents the negative control. (E) RNA-FISH analysis for Lnc-Rewind RNA (red) in proliferating MuSC-derived myoblasts. Autofluorescence (grey) is shown with false colour to visualize the cell body. (F) Digital magnification and 3D visualization of the square insert of (E). Asterisks indicate the Lnc-Rewind RNA signals inside the nuclear volume. DAPI, 4’,6-diamidino-2-phenylindole (blue). Data information: *p<0.05, unpaired Student’s t-test.
-
Figure 1—source data 1
Source data for Figure 1.
- https://cdn.elifesciences.org/articles/54782/elife-54782-fig1-data1-v2.xlsx
Figure 1—figure supplement 1
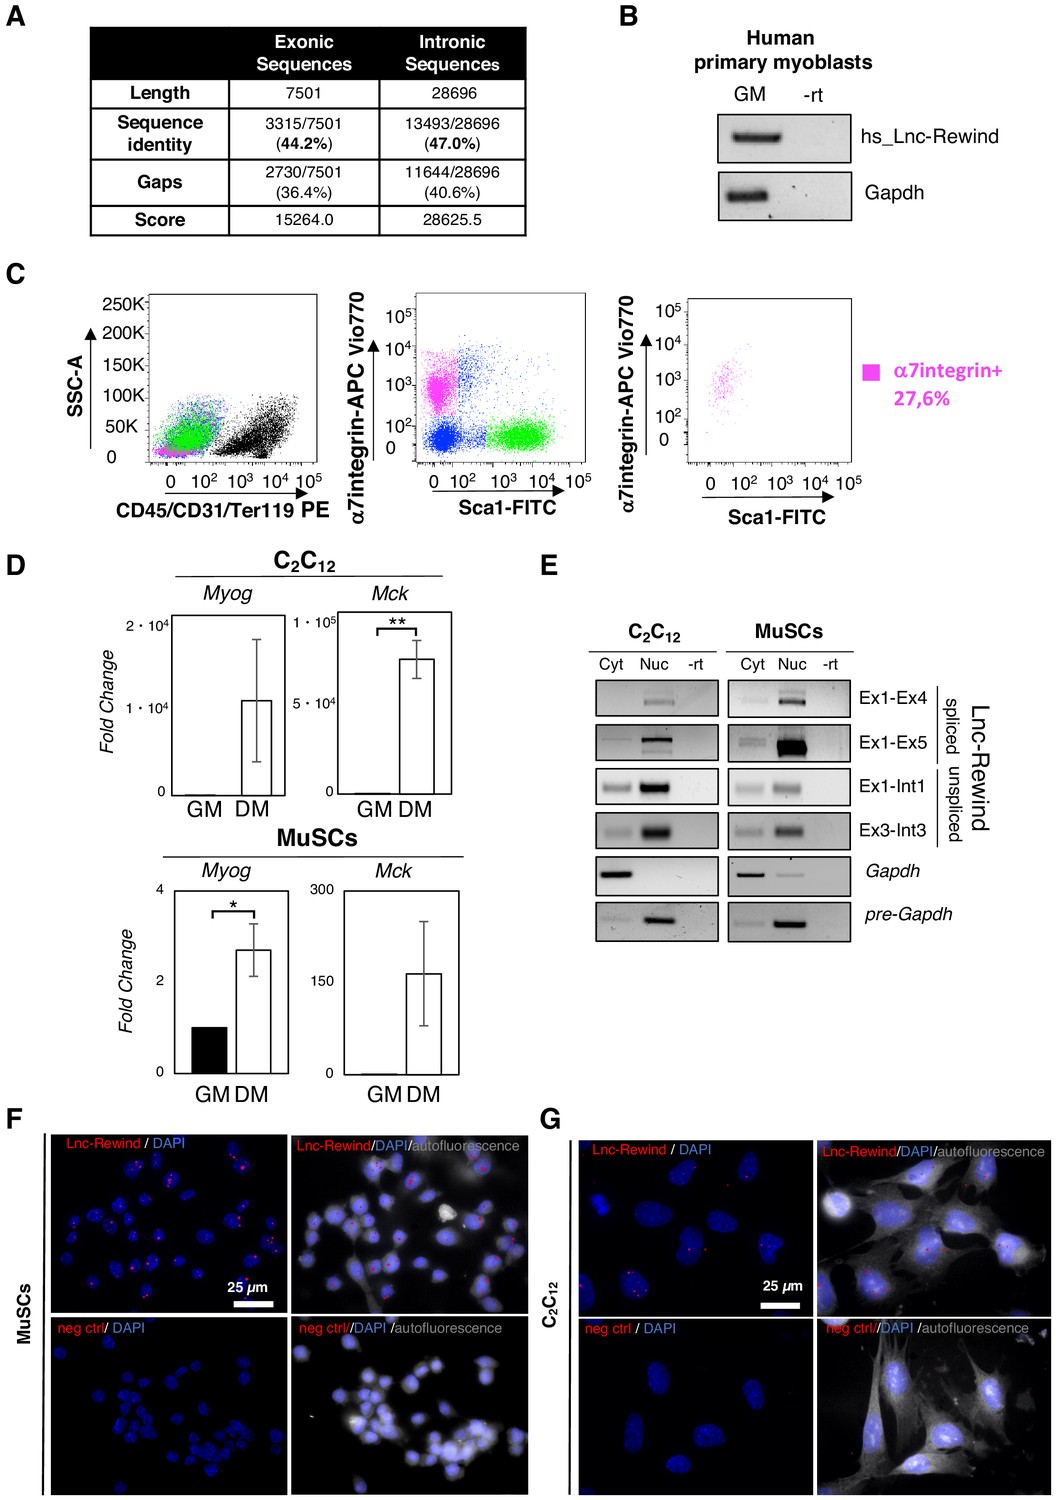
Lnc-Rewind is a conserved chromatin-associated lncRNA expressed in satellite cells.
(A) Table represents the values obtained by analysing the local sequence alignment between the human and murine Lnc-Rewind transcripts. Data were produced by using the implementation of the Smith–Waterman algorithm available at http://www.ebi.ac.uk/Tools/psa/emboss_water/. (B) Semiquantitative RT-PCR (sqRT-PCR) quantification of the human hs_Lnc-Rewind transcript in proliferating (GM) myoblasts from a healthy donor. Mature Gapdh was used as endogenous control. (C) FACS plot showing MuSC isolation strategy from WT mice. MuSCs are isolated, among the lineage (CD45/CD31/Ter119) negative cells, as α7integrin+/Sca1− cells (magenta box) (left and middle panels). The right plot shows the check purity of sorted MuSCs. (D) qRT-PCR quantification of Myog and Mck in C2C12 and MuSC-derived myoblasts in growth (GM) and differentiated (DM) conditions. Data represent the mean ± SEM of three biological replicates and were normalized on Gapdh mRNA. (E) sqRT-PCR quantification of Lnc-Rewind, using different primers, in cytoplasmic (Cyt) and nuclear (Nuc) fractions from proliferating C2C12 and MuSC-derived myoblasts. The quality of fractionation was tested with mature (Gapdh) and precursor (pre-Gapdh) RNAs. –rt represents the negative control (F) Representative 60X confocal images of MuSC-derived myoblasts cell cultures hybridized with probes set specific for Lnc-Rewind (upper panels) and for a human mRNA (dlc1), as negative control (neg ctrl) (bottom panels). Autofluorescence (gray) is shown with false colour to visualize the cell body. DAPI, 4’,6-diamidino-2-phenylindole (blue); scale bar: 25 μm. (G) Representative 60× confocal images of C2C12 cell cultures hybridized with probes set specific for Lnc-Rewind (upper panels) and for a human mRNA (dlc1), as negative control (neg ctrl) (bottom panels). Autofluorescence (grey) is shown with false colour to visualize the cell body. DAPI, 4’,6-diamidino-2-phenylindole (blue); scale bar: 25 μm. Data information: *p<0.05, unpaired Student’s t-test.
-
Figure 1—figure supplement 1—source data 1
Source data for Figure 1—figure supplement 1.
- https://cdn.elifesciences.org/articles/54782/elife-54782-fig1-figsupp1-data1-v2.xlsx
Figure 2 with 1 supplement
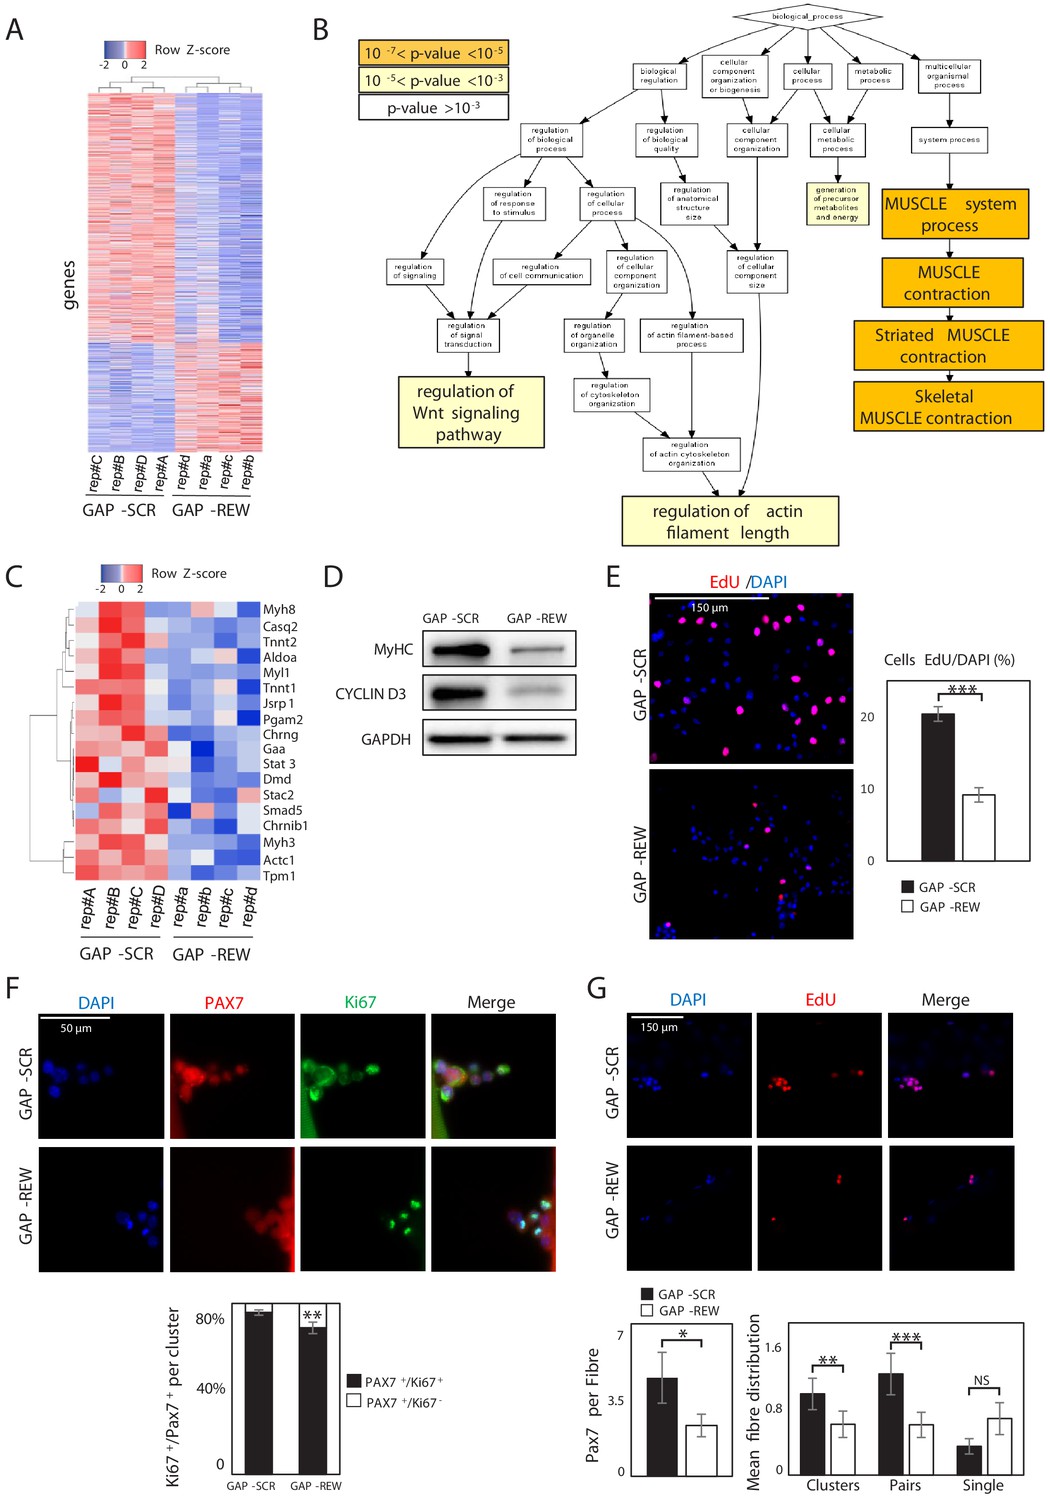
Lnc-Rewind regulates muscle system processes and MuSC expansion.
(A) Heatmap representing hierarchical clustering performed on the final list of genes differentially expressed in MuSC-derived myoblasts upon Lnc-Rewind depletion (p-value threshold<0.05; see also Figure 2—source data 1). The analysis was performed using the Heatmapper webserver tool (Babicki et al., 2016). For each gene, expression levels are expressed as Z-score values. (B) Gene Ontology (GO) enrichment analysis performed by GORILLA (Eden et al., 2009) in Biological process for genes differentially expressed upon Lnc-Rewind depletion in MuSC-derived myoblasts. (C) Heatmap representing hierarchical clustering performed on DEGs belonging to the Skeletal Muscle contraction GO category (GO:0003009). The analysis was performed using the Heatmapper webserver tool (Babicki et al., 2016). For each gene, expression levels are expressed as Z-score values. (D) Western blot analysis performed on protein extracts from MuSC-derived myoblasts treated with GAP-SCR or GAP-REW. GAPDH protein was used as endogenous control. (E) Representative images of MuSC-derived myoblasts treated with GAP-SCR and GAP-REW and incubated with EdU (red). Nuclei were visualized with DAPI (blue). Histogram shows the percentage of EdU-positive cells on the total of DAPI-positive cells. Data are graphed as mean ± SEM; n = 6 mice. (F) Representative images of single muscle fibres from WT mice treated with GAP-SCR or GAP-REW and stained for Pax7 (red) and Ki67 (green). Nuclei were visualized with DAPI (blue); histogram shows the percentage of Pax7+/Ki67− cells on the total of Pax7+/Ki67+ cells per cluster. Data represent the mean ± SEM of 40 clusters per condition; n = 5 mice. (G) Representative images of single muscle fibres from WT mice treated with GAP-SCR or GAP-REW and incubated for 24 hr with EdU (red). Nuclei were visualized with DAPI (blue); left histogram shows the number of Pax7+ cells per fibre (50 fibres per condition; n = 5 mice). Right histograms represent the mean of clusters (nuclei [n], n > 2), pairs (n = 2), and single cells Pax7+ (n = 1) per fibre. Data represent the mean ± SEM of 80 fibres per condition; n = 5 mice. Data information: *p<0.05, **p<0.01, ***p<0.001, unpaired Student’s t-test.
-
Figure 2—source data 1
List of the differentially expressed genes (DEGs) between GAP-SCR and GAP-REW transfected MuSCs.
- https://cdn.elifesciences.org/articles/54782/elife-54782-fig2-data1-v2.xlsx
-
Figure 2—source data 2
Source data for Figure 2.
- https://cdn.elifesciences.org/articles/54782/elife-54782-fig2-data2-v2.xlsx
Figure 2—figure supplement 1
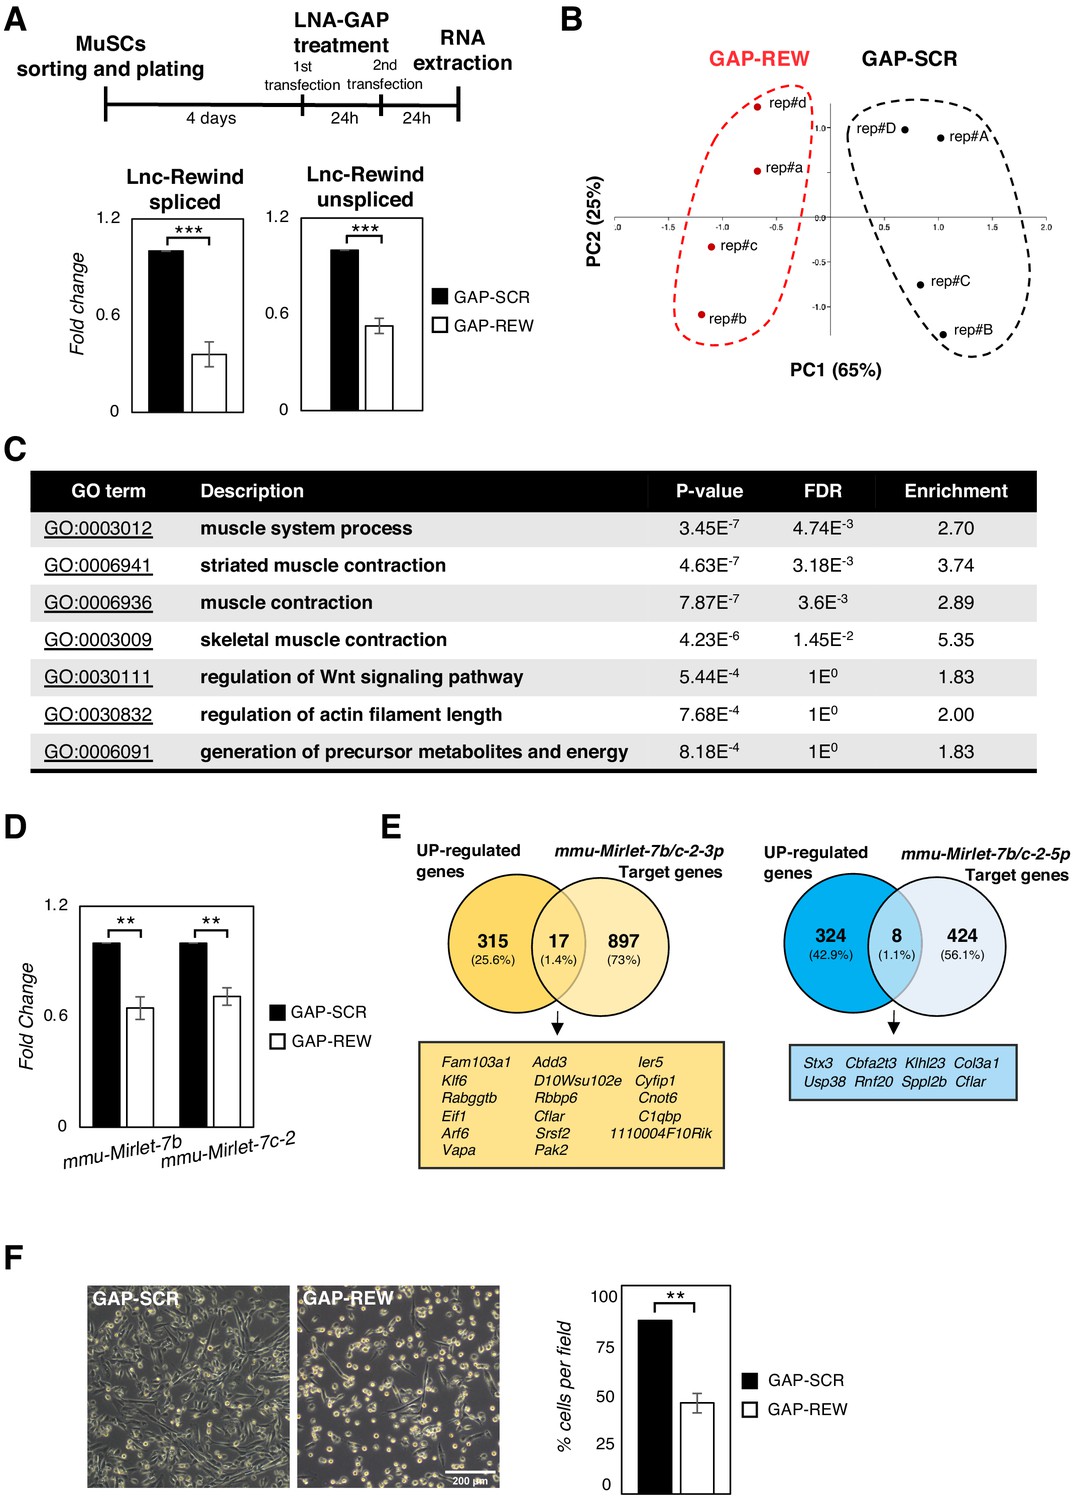
Lnc-Rewind regulates muscle system processes and MuSC expansion.
(A) Upper part: Experimental timeline used for the transfection of MuSC-derived myoblasts with GAP-SCR or GAP-REW. Lower part: qRT-PCR quantification of Lnc-Rewind spliced and unspliced transcript in MuSC-derived myoblasts treated with GAP-SCR or GAP-REW. Data were normalized to Gapdh mRNA and expressed as fold change of the mean ± SEM of four biological replicates. (B) PCA analysis of DEGs upon Lnc-Rewind depletion. GAP-REW and GAP-SCR RNA-seq replicates are shown, respectively, as red and black dots. PC1 and PC2 represent the top two dimensions of the PCA which account, respectively, for 65% and 25% of the total variability. (C) Table shows the GO terms, their description, the p-value, the false discovery rate (in decreasing order of statistical significance), and the enrichment of the different categories listed in the diagram of Figure 2B. (D) qRT-PCR quantification of mmu-Mirlet7-b and mmu-Mirlet7-c-2 miRNAs in GAP-SCR- or GAP-REW-treated MuSC-derived myoblasts. Data were normalized to Gapdh mRNA and expressed as fold change of the mean ± SEM of three biological replicates. (E) Target prediction analyses performed by crossing the genes upregulated upon Lnc-Rewind depletion with the mmu-Mirlet7b/c2-3p (yellow) and mmu-Mirlet7b/c2-5p (blue) predicted target genes. Predictions were obtained from Targetscan database (Agarwal et al., 2015). (F) Representative images (left) and cells number quantification (right) of MuSC-derived myoblasts treated with GAP-SCR or GAP-REW. Data represent the mean percentage ± SEM of three biological replicates. Data information: *p<0.05, **p<0.01, ***p<0.001, unpaired Student’s t-test.
-
Figure 2—figure supplement 1—source data 1
Source data for Figure 2—figure supplement 1.
- https://cdn.elifesciences.org/articles/54782/elife-54782-fig2-figsupp1-data1-v2.xlsx
Figure 3 with 1 supplement
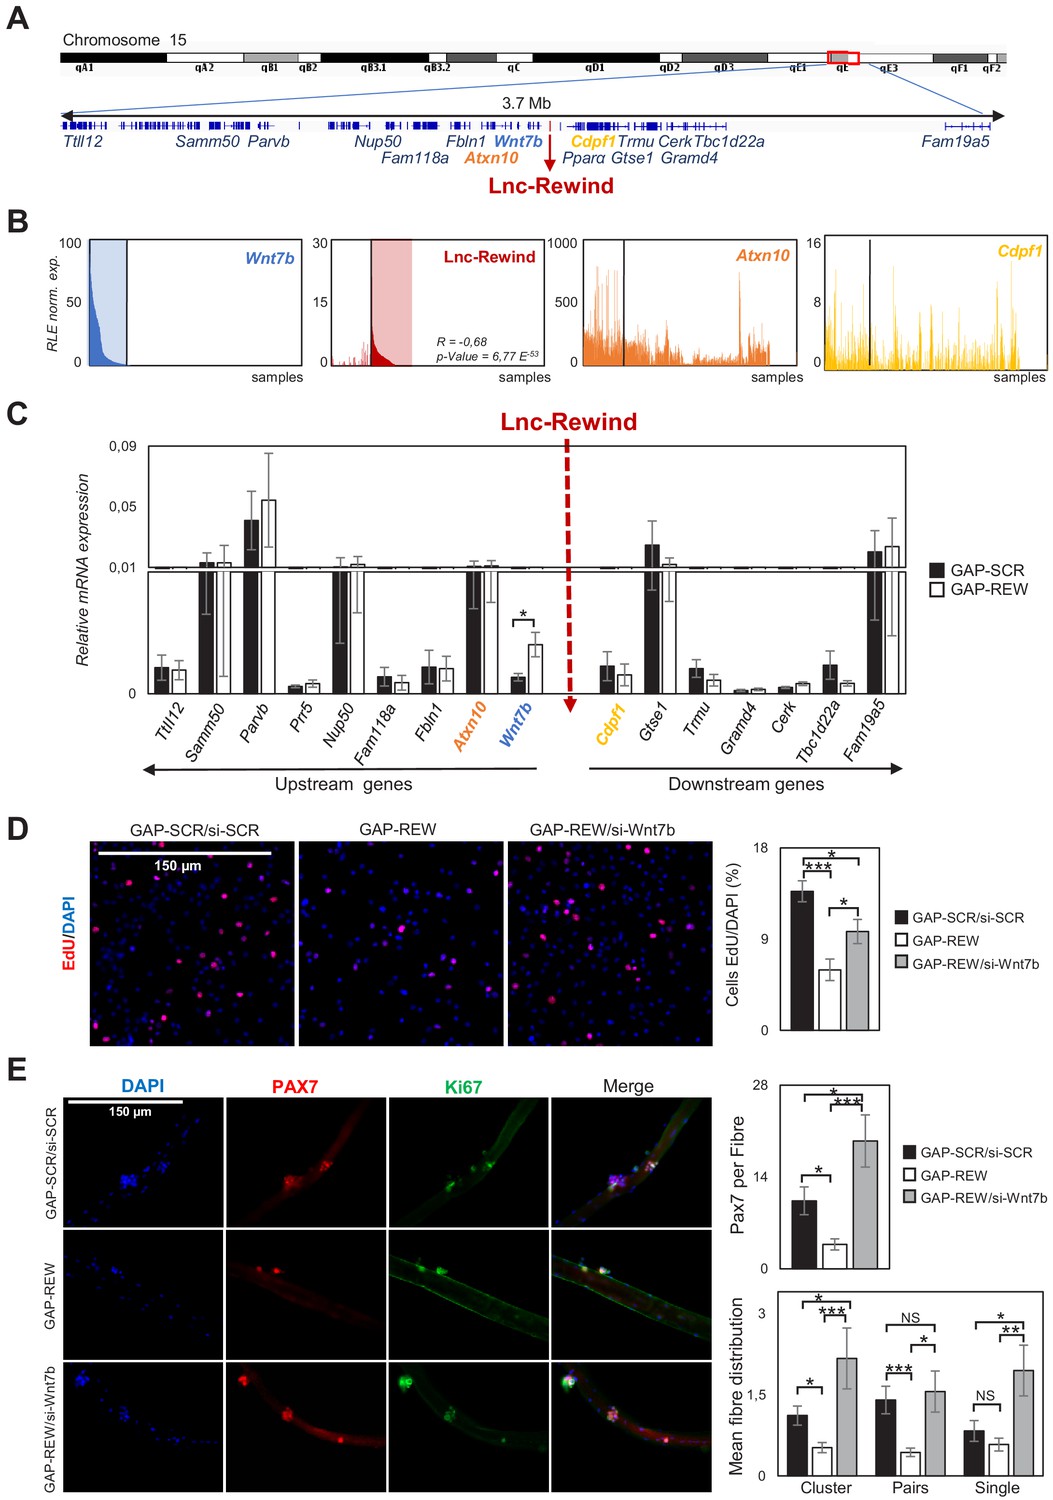
Lnc-Rewind and Wnt7b genes display opposite pattern of expression and a functional interplay.
(A) Schematic UCSC visualization showing the Lnc-Rewind chromosome position and its neighbouring genes. (B) TSS usage analyses of Wnt7b, Lnc-Rewind, Atxn10, and Cdpf1 performed by using FANTOM5 (Phases 1 and 2) CAGE datasets. Each bar represents the Relative Logarithmic Expression (RLE) of the tag per million (TPM) values of the TSS of each gene in one sample (1196 samples). The order of the samples is the same in each of the histograms and shown in Figure 3—source data 1. R value represents the Spearman’s rank correlation coefficient between Lnc-Rewind and Wnt7b expression, and the p-value was calculated using the Spearman’s rank correlation test. (C) qRT-PCR quantification of Lnc-Rewind neighbouring genes in GAP-SCR versus GAP-REW treated. MuSCs-derived myoblasts. Data were normalized to Gapdh mRNA and represent the average ± SEM from four biological replicates. (D) Representative images of MuSC-derived myoblasts treated with GAP-SCR/si-SCR, GAP-REW, and GAP-REW/si-Wnt7b and incubated with EdU (red). Nuclei were visualized with DAPI, 4′,6-diamidino-2-phenylindole (blue). Histogram shows the percentage of EdU-positive cells on the total of DAPI-positive cells. Data are graphed as mean ± SEM; n = 5 mice. (E) Representative images of single muscle fibres treated with GAP-SCR/si-SCR, GAP-REW, and GAP-REW/si-Wnt7b from WT mice after 96 hr in culture, stained for Pax7 (red) and Ki67 (green). Nuclei were visualized with DAPI, 4′,6-diamidino-2-phenylindole (blue). Histogram (upper panel) shows the number of Pax7+ cells per fibre. Histograms (lower panel) represent the mean of the number of clusters (nuclei [n]: n > 2), pairs (n = 2), and single cells Pax7+ (n = 1) per fibre. Data represent the mean ± SEM; n = 5 mice. Data information: (C): *p<0.05, paired Student’s t-test. 3D and 3E: *p<0.05, **p<0.01, ***<0.001, one-way Anova with Tukey’s multiple comparison test.
-
Figure 3—source data 1
5'CAGE TSS expression profile of Wnt7b, Lnc-Rewind, Atxn10 and Cdpf1 genes.
- https://cdn.elifesciences.org/articles/54782/elife-54782-fig3-data1-v2.xlsx
-
Figure 3—source data 2
Source data for Figure 3.
- https://cdn.elifesciences.org/articles/54782/elife-54782-fig3-data2-v2.xlsx
Figure 3—figure supplement 1
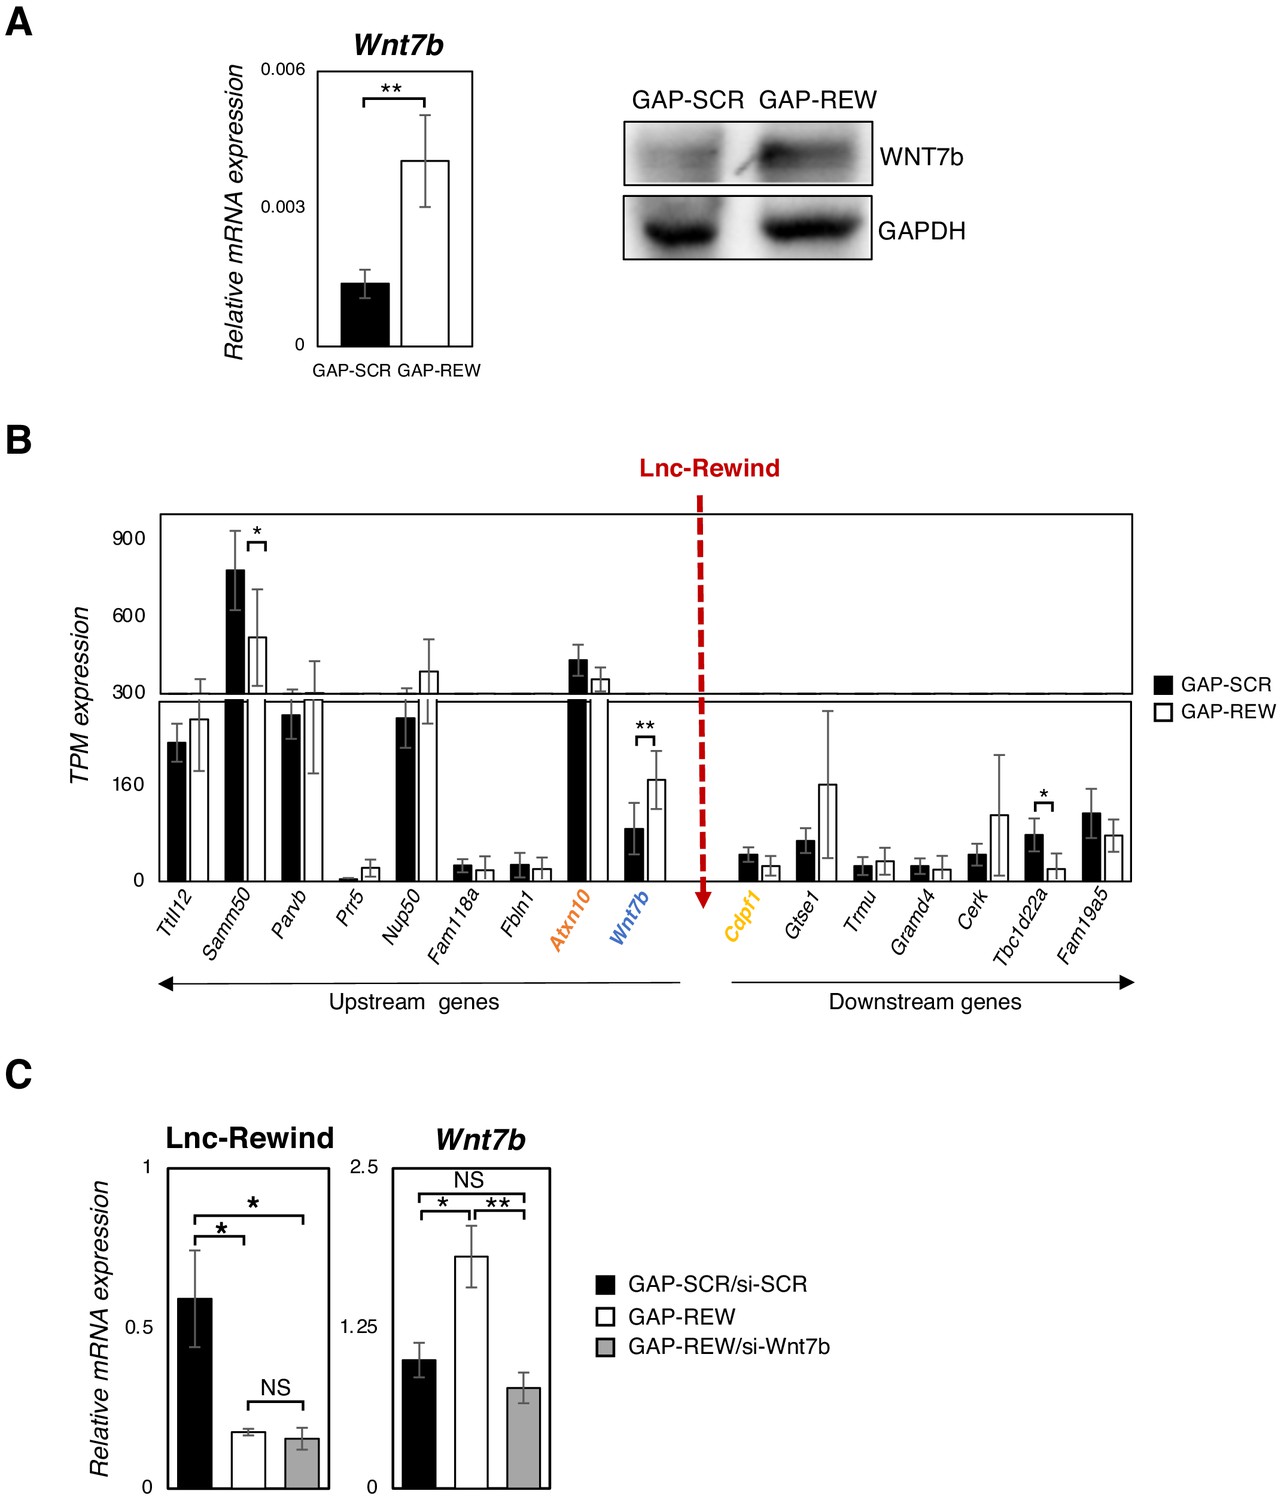
Lnc-Rewind and Wnt7b genes display opposite pattern of expression and a functional interplay.
(A) qRT-PCR (left panel) and Western blot (right panel) analyses performed on extracts from MuSC-derived myoblasts, treated with GAP-SCR or GAP-REW. Gapdh mRNA and protein were used as endogenous control. Error bars represent the mean ± SEM of four biological replicates. (B) TPM (transcripts per million) values of Lnc-Rewind neighbouring genes obtained from the RNA-seq analyses performed in GAP-SCR- versus GAP-REW-treated MuSC-derived myoblasts. TPM values are presented as average ± SD of four biological replicates. (C) qRT-PCR quantification of Lnc-Rewind and Wnt7b in GAPSCR/si-SCR, GAP-REW, and GAP-REW/si-Wnt7b conditions. Data were normalized to Gapdh mRNA and represent the mean ± SEM of four biological replicates. Data information: (A) **p<0.01, unpaired Student’s t-test. (B) *p<0.05, **p<0.01, paired Student’s t-test. (C) *p<0.05, **p<0.01, one-way Anova with Tukey’s multiple comparison test.
-
Figure 3—figure supplement 1—source data 1
Source data for Figure 3—figure supplement 1.
- https://cdn.elifesciences.org/articles/54782/elife-54782-fig3-figsupp1-data1-v2.xlsx
Figure 4 with 1 supplement
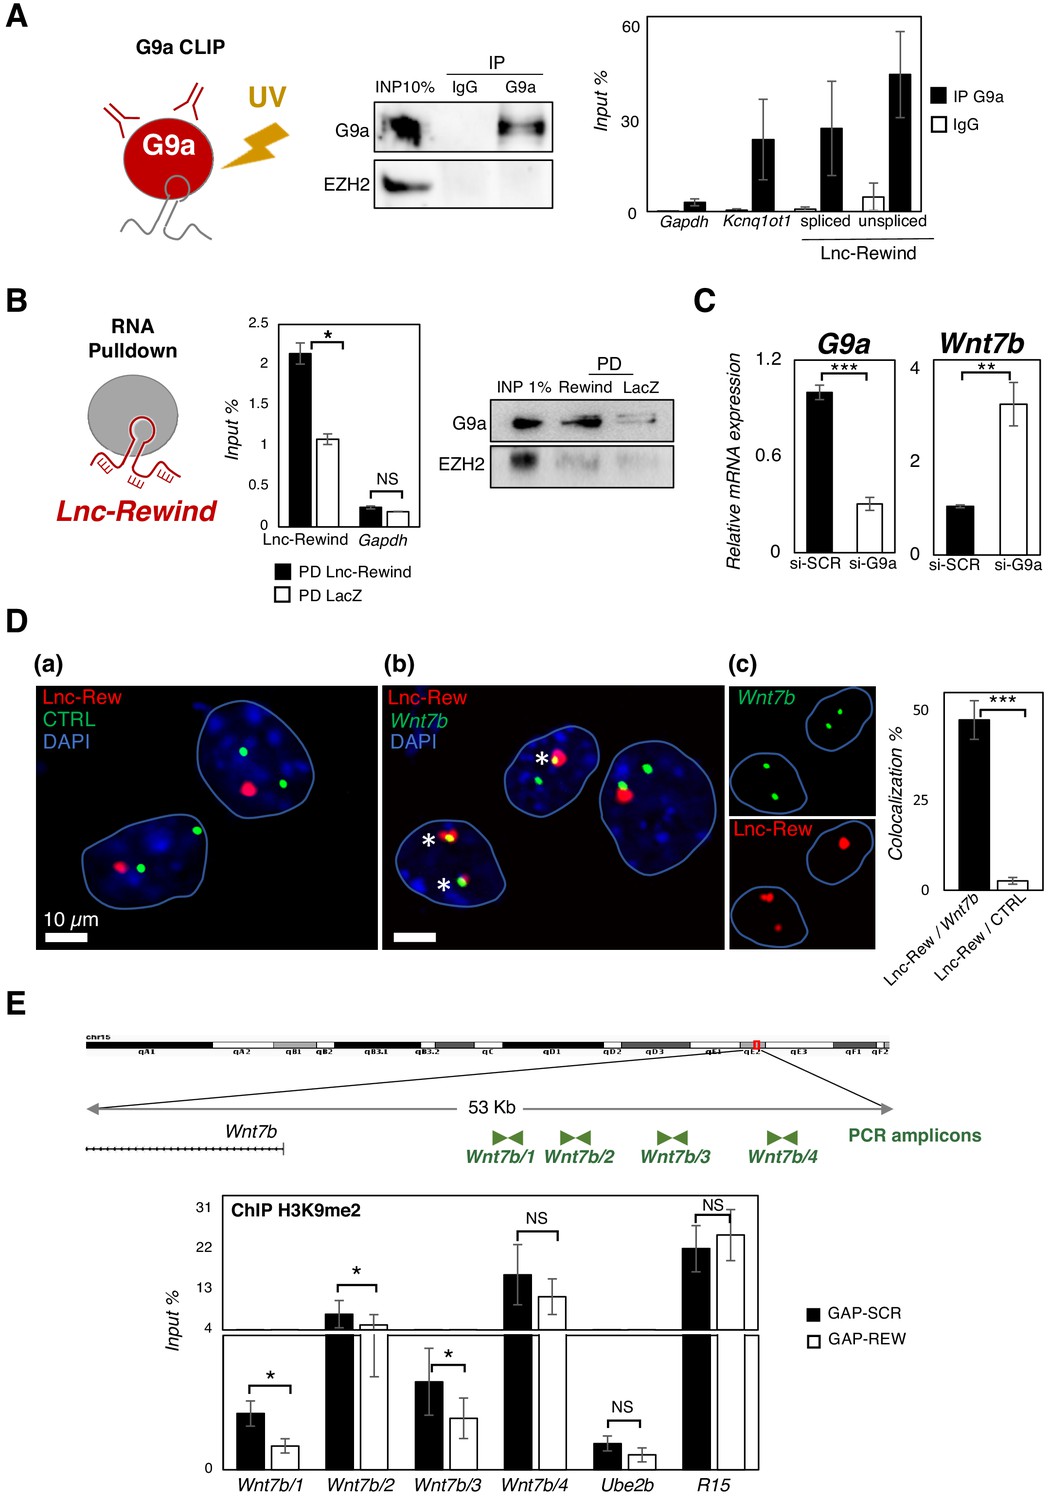
Lnc-Rewind directly interacts with the methyltransferase G9a and mediates specific in cis repression of Wnt7b.
(A) G9a crosslinked RNA immunoprecipitation assay (CLIP) performed on nuclear extracts from C2C12 proliferating myoblasts. Western blot analysis of G9a (left panel) and qRT-PCR quantification of Lnc-Rewind recovery (right panel) expressed as input percentage (Input %) are shown. EZH2 protein and Gapdh RNA serve as negative controls; Kcnq1ot RNA is used as positive control. Data represent mean ± SEM of three biological replicates. (B) Lnc-Rewind RNA pulldown assay performed on nuclear extracts from C2C12 proliferating myoblasts. qRT-PCR quantification of Lnc-Rewind recovery (left panel) and Western blot analysis of G9a (right panel) are shown. Gapdh RNA and EZH2 protein serve as negative controls. Data represent mean ± SEM of three biological replicates. (C) qRT-PCR quantification of G9a and Wnt7b in MuSC-derived myoblasts treated with si-SCR or si-G9a. Data were normalized to Gapdh mRNA and represent the mean ± SEM of three biological replicates. (D) RNA/DNA-FISH experiments performed in proliferating MuSC-derived myoblasts showing the Lnc-Rewind RNA (red) and a DNA control (CTRL) region (green) (a) or the Wnt7b locus (green) (b). Inserts in (c) show single fluorescent channels for Lnc-Rewind and Wnt7b signals labelled by asterisks. Blue lines indicate the edges of the nuclei. DAPI, 4′,6‐diamidino‐2‐phenylindole (blue). Histogram reports the mean percentage ± SD of Lnc-Rewind signals colocalizing with Wnt7b locus or with the control region from three biological replicates. The extended list of the DNA and RNA probes used is listed in Key resources table. (E) Zoom-in into the genomic region upstream the Wnt7b TSS (upper panel). ChIP amplicons used to test the H3K9me2 enrichments are shown in green. Histogram shows the levels of H3K9me2 as analysed by ChIP experiments performed in MuSC-derived myoblasts upon GAP-SCR or GAP-REW transfection (lower panel). The H3K9me2 enrichment is represented as input percentage (Input %). Ube2b and R15 genomic regions were used as negative and positive controls, respectively. The graph shows the mean ± SEM of six independent experiments. Data information: (B) and (E): *p<0.05, paired Student’s t-test. (C) and (D): **p<0.01, ***p<0.001, unpaired Student’s t-test.
-
Figure 4—source data 1
Source data for Figure 4.
- https://cdn.elifesciences.org/articles/54782/elife-54782-fig4-data1-v2.xlsx
Figure 4—figure supplement 1
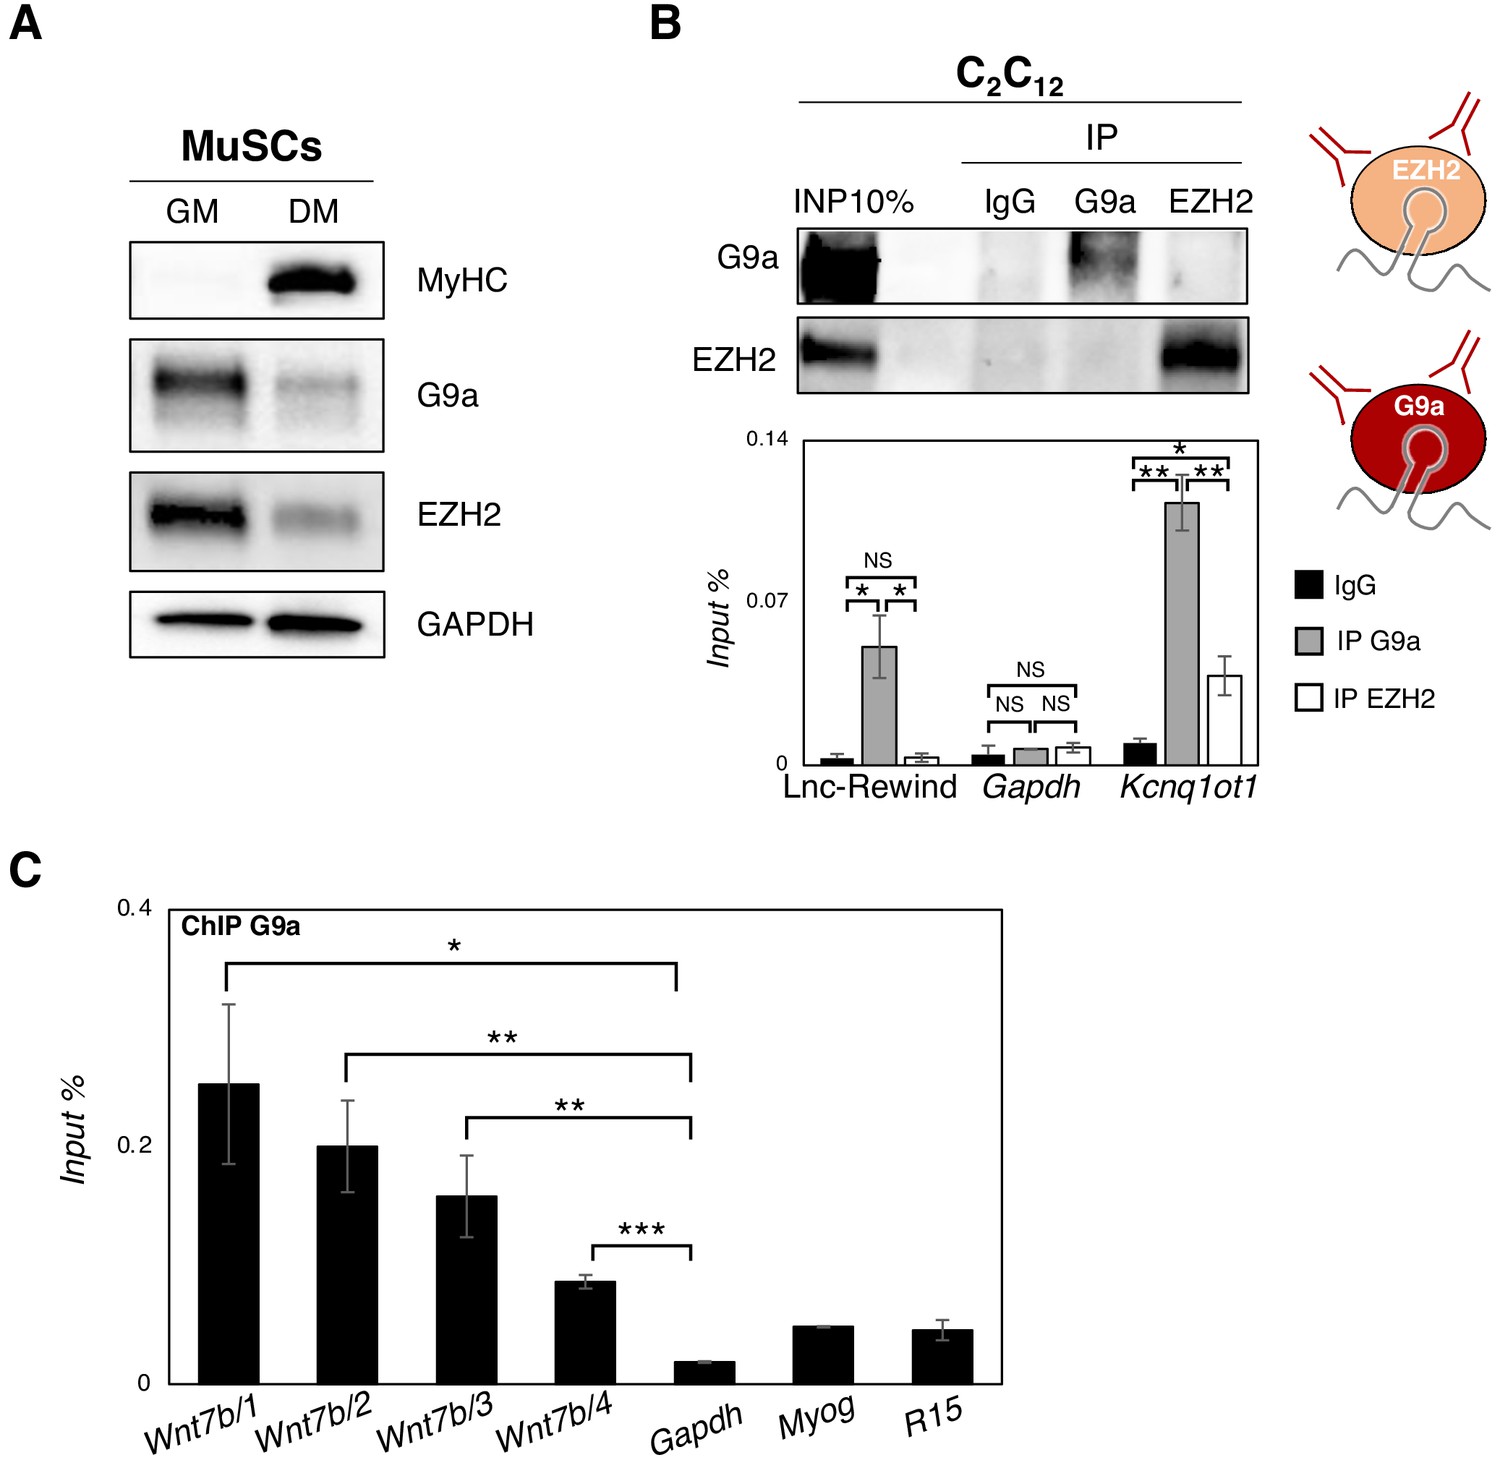
Lnc-Rewind directly interacts with the methyltransferase G9a and mediates specific in cis repression of Wnt7b.
(A) Western blot analysis performed on protein extracted from WT MuSC-derived myoblasts cultured in growth (GM) and differentiated (DM) conditions. GAPDH protein was used as endogenous control. (B) G9a and EZH2 native RNA immunoprecipitation (RIP) performed on nuclear extracts of C2C12 proliferating myoblasts. Data represent mean ± SEM of four biological replicates. Western blot analysis of G9a and EZH2 (upper panel) and qRT-PCR quantification of Lnc-Rewind recovery (lower panel) are shown. EZH2 protein serves as negative control. Gapdh and Kcnq1ot1 RNAs serve, respectively, as negative and positive controls. (C) Chromatin immunoprecipitation (ChIP) of G9a performed in C2C12 proliferating myoblasts; enrichment was calculated as (IP-IgG)/Input and represented as input percentage (Input %). Gapdh genomic region was used as negative control, while Myog and R15 genomic regions were used as positive controls. The graph shows the mean ± SEM of three biological replicates. Data information: *p<0.05, **p<0.01, ***p<0.001, unpaired Student’s t-test.
-
Figure 4—figure supplement 1—source data 1
Source data for Figure 4—figure supplement 1.
- https://cdn.elifesciences.org/articles/54782/elife-54782-fig4-figsupp1-data1-v2.xlsx
Figure 5

Lnc-Rewind and G9a colocalize on Wnt7b gene locus.
(A) Top panel: RNA/DNA-FISH combined with immunofluorescence performed on MuSC-derived myoblasts; Lnc-Rewind RNA (red), Wnt7b DNA locus (green), and G9a protein (grey) are shown. Bottom panel: Isosurface rendering of nuclear sections is indicated by the yellow dashed lines. The overlapping regions between Lnc-Rewind (RNA) and Wnt7b (DNA) locus (left) and among Lnc-Rewind, Wnt7b locus, and G9a (right) are indicated by the white asterisks inside the nuclear volume. (B) Proposed model for the functional interplay between Lnc-Rewind and G9a on Wnt7b gene locus. Representation of mmu_Lnc-Rewind mode of action in muscle cells. In proliferating myoblasts, the Lnc-Rewind transcript is expressed, recruits the silencing methyltransferase G9a on the locus that represses Wnt7b transcription.
Tables
Key resources table
| Reagent type (species) or resource | Designation | Source or reference | Identifiers | Additional information | |
|---|---|---|---|---|---|
| Strain, strain background (mouse) | C57Bl/10 (WT) | JAX | Stock# 000665 RRID:MGI:5656893 | ||
| Cell line (mouse) | C2C12 | ATCC | C3H RRID:CVCL_UR38 | ||
| Cell line (human) | Male myoblast (WT) | Telethon Biobank | N/A | ||
| Antibody | Anti-CD31-PE (cell line monoclonal) | MiltenyBiotec | Cat# 130111540 RRID:AB_2657296 | (1:25) | |
| Antibody | Anti-CD45-PE (cell line monoclonal) | MiltenyBiotec | Cat# 130110797 RRID:AB_2658218 | (1:25) | |
| Antibody | Anti-Ter119-PE (cell line monoclonal) | MiltenyBiotec | Cat# 130112909 RRID:AB_2654115 | (1:25) | |
| Antibody | Anti-Sca1-FITC (cell line monoclonal) | MiltenyBiotec | Cat# 130116490 RRID:AB_2751322 | (1:50) | |
| Antibody | Anti-α7Integrin-APCVio770 (cell line monoclonal) | MiltenyBiotec | Cat# 130095212 Custom | (1:20) | |
| Antibody | Anti-G9a (rabbit monoclonal) | Abcam | Cat# ab185050 RRID:AB_2792982 | (CLIP, RIP: 10 ug; ChIP: 5 ug; WB: 1:1000; IF: 1:100) | |
| Antibody | Anti-EZH2 (mouse monoclonal) | Cell Signaling | Cat# 3147 RRID:AB_10694383 | (RIP: 5 ug; WB: 1:1000) | |
| Antibody | Anti-GAPDH (rabbit polyclonal) | Sigma–Aldrich | Cat# G9545 RRID:AB_796208 | (1:10000) | |
| Antibody | Anti-MyHC (mouse monoclonal) | DSHB | Cat# Mf20-s RRID:AB_2147781 | (1:20) | |
| Antibody | Anti-CyclinD3 (rabbit polyclonal) | Santa Cruz Biotechnology | Cat# sc-182 RRID:AB_2259653 | (1:200) | |
| Antibody | Anti-Wnt7b (rabbit polyclonal) | Abcam | Cat#ab94915 RRID:AB_10675749 | (1:200) | |
| Antibody | Anti-H3K9me2(mouse monoclonal) | Abcam | Cat# ab1220 RRID:AB_449854 | (ChIP: 5 ug) | |
| Antibody | Anti-Pax7 (mouse monoclonal) | DSHB | Cat# Pax7-s RRID:AB_2299243 | (1:10) | |
| Antibody | IgG Anti-Rabbit | Invitrogen | Cat# 14-4616-82 RRID:AB_2865072 | (CLIP, RIP:10 ug; ChIP: 5 ug) | |
| Antibody | Donkey anti-rabbit IgG Alexa Fluor Plus 647 | Invitrogen | Cat# A32795 RRID:AB_2762835 | (1:300) | |
| Antibody | Anti-Ki67 (rabbit polyclonal) | Abcam | Cat# ab15580 RRID:AB_443209 | (1:100) | |
| Sequence-based reagent | siRNA: nontargeting control | Sigma–Aldrich | Cat# SIC007 | ||
| Sequence-based reagent | LNA Gapmer: nontargeting control | Qiagen | Cat# 300610 | ||
| Sequence-based reagent | Mir-Let7-b | Qiagen | Cat# MS00003122 | ||
| Sequence-based reagent | Mir-Let7-c | Qiagen | Cat# 18300 | ||
| Sequence-based reagent | siG9a | Sigma–Aldrich | SASI_Mm01_00136174 SASI_Mm_00136174_AS SASI_Mm01_00136175 SASI_Mm01_00136175_AS | ||
| Sequence-based reagent | siWnt7b | Sigma–Aldrich | SASI_MM02_00316332 SASI_MM02_00316332_AS SASI_MM01_00033690 SASI_MM01_00033690_AS | ||
| Sequence-based reagent | HS-DLC1 mRNA probe set | Advanced Cell Diagnostics, Inc | Ref. 716041 | ||
| Sequence-based reagent | Wnt7b BAC probe | Invitrogen clones | RP23-272K17 | ||
| Sequence-based reagent | NCTC BAC probe | Invitrogen clones | RP23-352B6 | ||
| Sequence-based reagent | Mm-Lnc-Rewind probe set | Advanced Cell Diagnostics, Inc | Ref. 722581 | ||
| Chemical compound, drug | TriReagent | Sigma | Cat#T9424 | ||
| Chemical compound, drug | DAPI | Sigma | Cat# 28718-90-3 | (1:10000) | |
| Chemical compound, drug | DSG (di-succinimidyl glutarate) | Santa Cruz Biotechnology | CAS 79642-50-5 | ||
| Commercial assay or kit | SYBR Green Master mix | ThermoFisher Scientific | Cat# A25742 | ||
| Commercial assay or kit | Paris Kit | Thermo fisher scientific | Cat# AM1921 | ||
| Commercial assay or kit | Direct-Zol RNA MiniPrep Kit | Zymo Research | Cat# R2050 | ||
| Commercial assay or kit | MAGnify ChIP | ThermoFisher Scientific | Cat# 492024 | ||
| Commercial assay or kit | MyTaq DNA polymerase | Bioline | Cat# bio-21105 | ||
| Commercial assay or kit | SuperScript RT Vilo Master Mix | ThermoFisher Scientific | Cat# 11754050 | ||
| Commercial assay or kit | BaseScope Reagent Kit v2-RED | Advanced Cell Diagnostics, Inc | Ref. 323900 | ||
| Commercial assay or kit | MiScript II RT kit | Qiagen | Cat# 218160 | ||
| Commercial assay or kit | Lipofectamine 2000 | Invitrogen | Cat# 11668019 | ||
| Commercial assay or kit | Click-iT EdU Alexa Flour 594 HCS Assay | Invitrogen | Cat# C10354 | ||
| Commercial assay or kit | Pierce ChIP-grade Protein A/G Magnetic Beads | ThermoFisher scientific | Cat# 26162 | ||
| Peptide, recombinant protein | Dispase II | Roche | 4942078001 | ||
| Peptide, recombinant protein | Proteinase K | Roche | EO0491 | ||
| Peptide, recombinant protein | Collagenase A | Roche | 10103578001 | ||
| Peptide, recombinant protein | DNase I | Roche | 10104159001 | ||
| Peptide, recombinant protein | DNase I | ThermoFisher scientific | #EN0521 | ||
| Peptide, recombinant protein | Collagenase I | Sigma | C0130 | ||
| Software, algorithm | FACSDiva | BD Biosciences | Version 6.1.3. | ||
| Software, algorithm | FlowJo | Tree Star | Version 9.3.2 RRID:SCR_008520 | ||
| Software, algorithm | Fiji image processing package | Open-source software (OSS) projects | https://imagej.net/Fiji RRID:SCR_002285 | ||
| Software, algorithm | MetaMorph | Molecular Devices | https://www.moleculardevices.com/ RRID:SCR_002368 | ||
| Software, algorithm | FV10-ASW Viewer software | Olympus | https://www.olympus-lifescience.com/ RRID:SCR_014215 | ||
| Software, algorithm | ZEN 3.0 Blue edition | ZEISS | |||
Additional files
-
Supplementary file 1
List and sequences of the oligonucleotides, LNA gapmers, and siRNAs used.
- https://cdn.elifesciences.org/articles/54782/elife-54782-supp1-v2.xlsx
-
Transparent reporting form
- https://cdn.elifesciences.org/articles/54782/elife-54782-transrepform-v2.docx
Download links
A two-part list of links to download the article, or parts of the article, in various formats.
Downloads (link to download the article as PDF)
Open citations (links to open the citations from this article in various online reference manager services)
Cite this article (links to download the citations from this article in formats compatible with various reference manager tools)
Epigenetic regulation of Wnt7b expression by the cis-acting long noncoding RNA Lnc-Rewind in muscle stem cells
eLife 10:e54782.
https://doi.org/10.7554/eLife.54782


