Revealing the structure of information flows discriminates similar animal social behaviors
- Arizona State University, School of Earth and Space Exploration, United States
- Arizona State University, School of Life Sciences, United States
- Okinawa Institute of Science & Technology Graduate University, Onna-son, Japan
- Arizona State University, ASU–SFI Center for Biosocial Complex Systems, United States
- Arizona State University, Beyond Center for Fundamental Concepts in Science, United States
- Arizona State University, School of Computing, Informatics, and Decision Systems Engineering, United States
- Arizona State University, School of Sustainability, United States
Figures
Figure 1
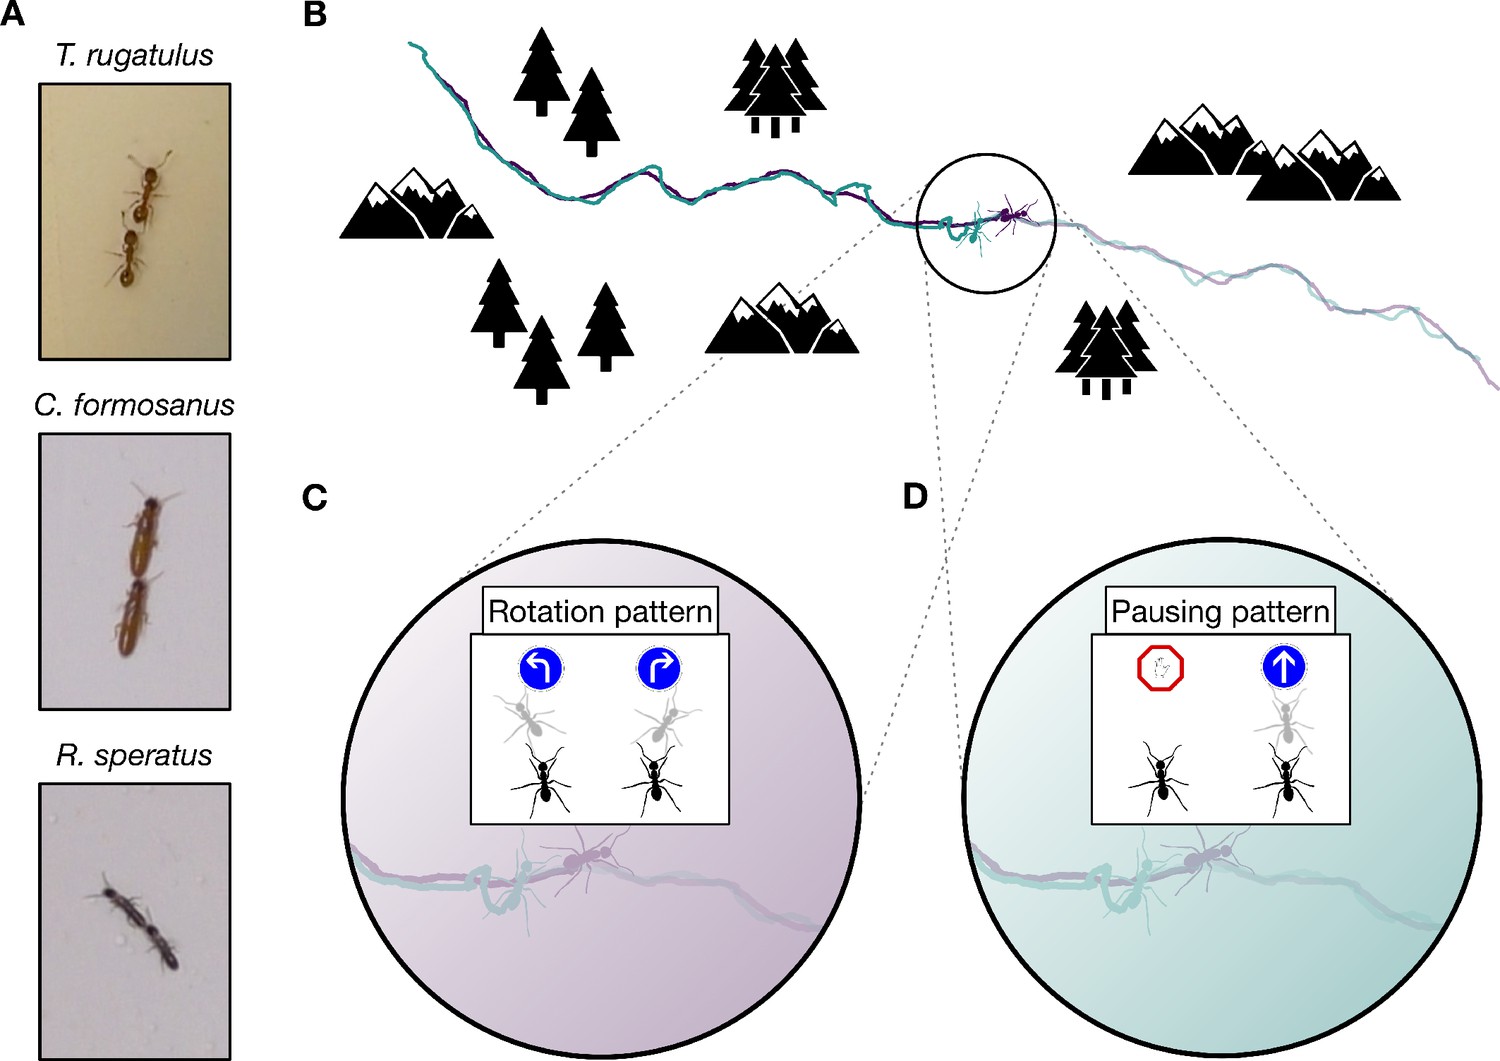
Tandem run recruitment by ants and termites.
(A) Tandem running pairs of the ant species T. rugatulus and the termite species C. formosanus and R. speratus. (B) A sampled tandem run trajectory within an idealized environment. The encoding schemas used to discretise spatial trajectories of each ant and each termite on the basis of (C) the rotation pattern and (D) the pausing pattern.
Figure 2
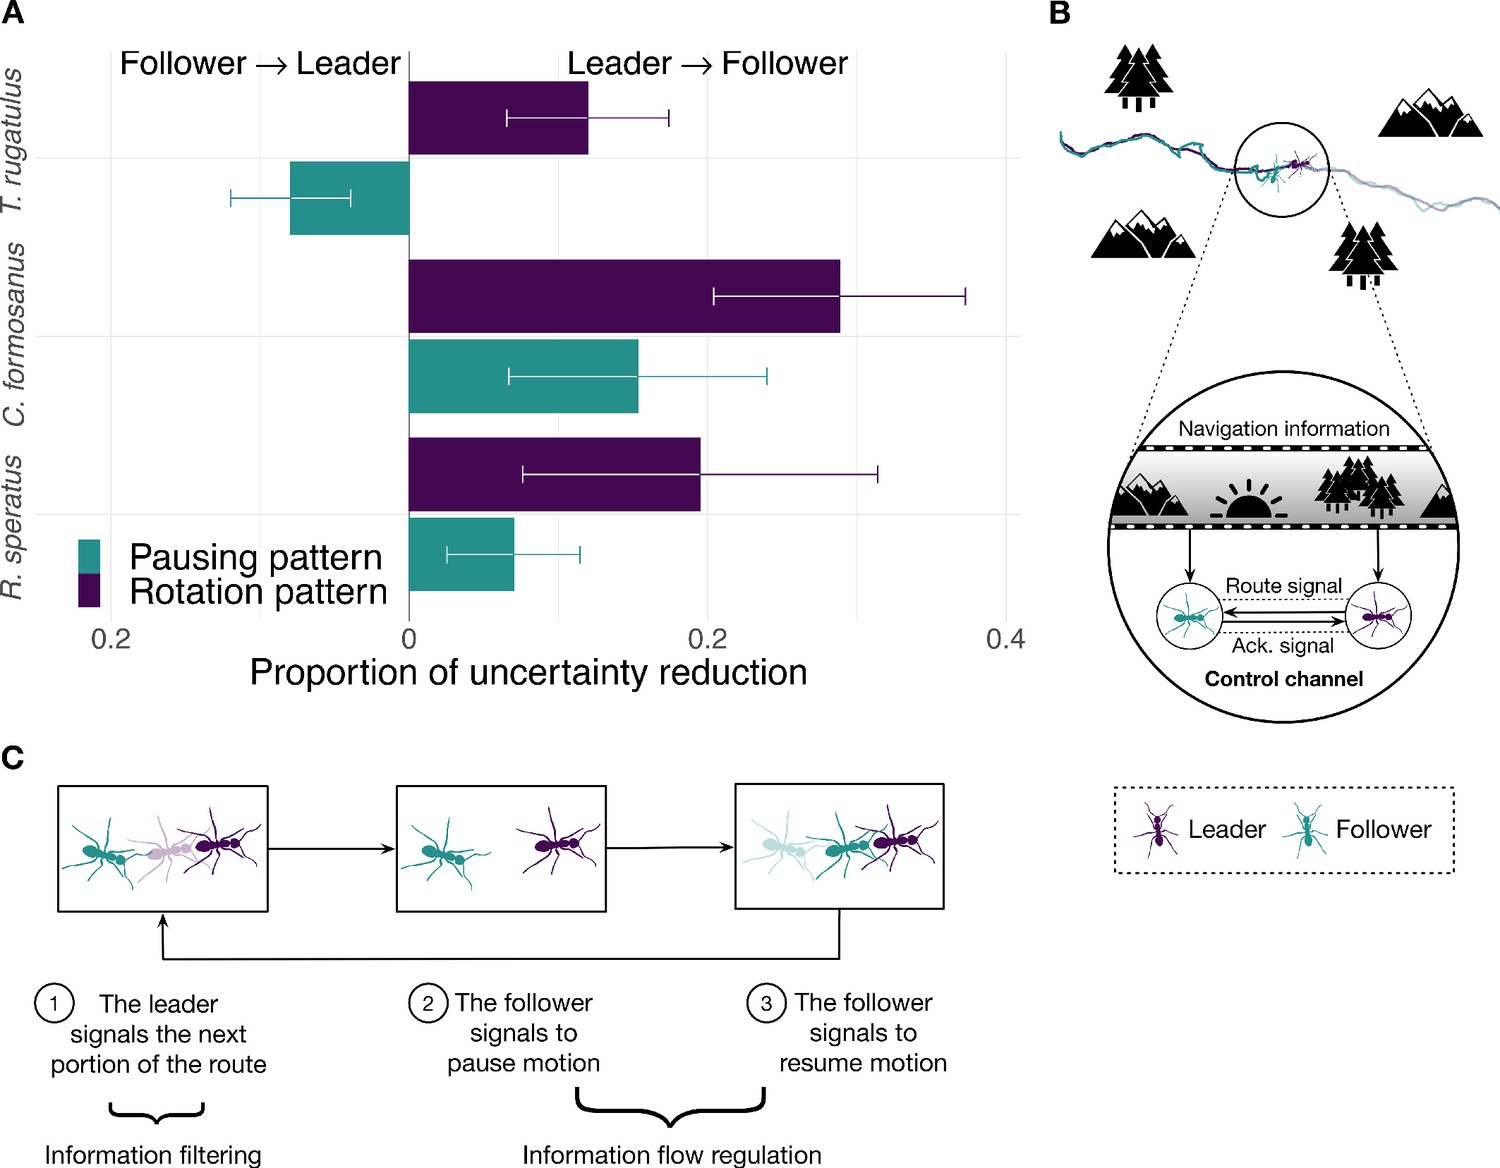
Information flow during tandem run recruitment.
(A) The predominant direction of predictive information given by the proportion of uncertainty reduction explained by the interaction between leader and follower (mean normalized transfer entropy and standard error). (B) A schematic illustration and (C) a mechanistic illustration of the regulation of information flow in ants' tandem runs. Source data of predictive information are available in Figure 2—source data 1.
-
Figure 2—source data 1
Conditional entropy and transfer entropy for selected parameter configurations.
- https://cdn.elifesciences.org/articles/55395/elife-55395-fig2-data1-v1.csv
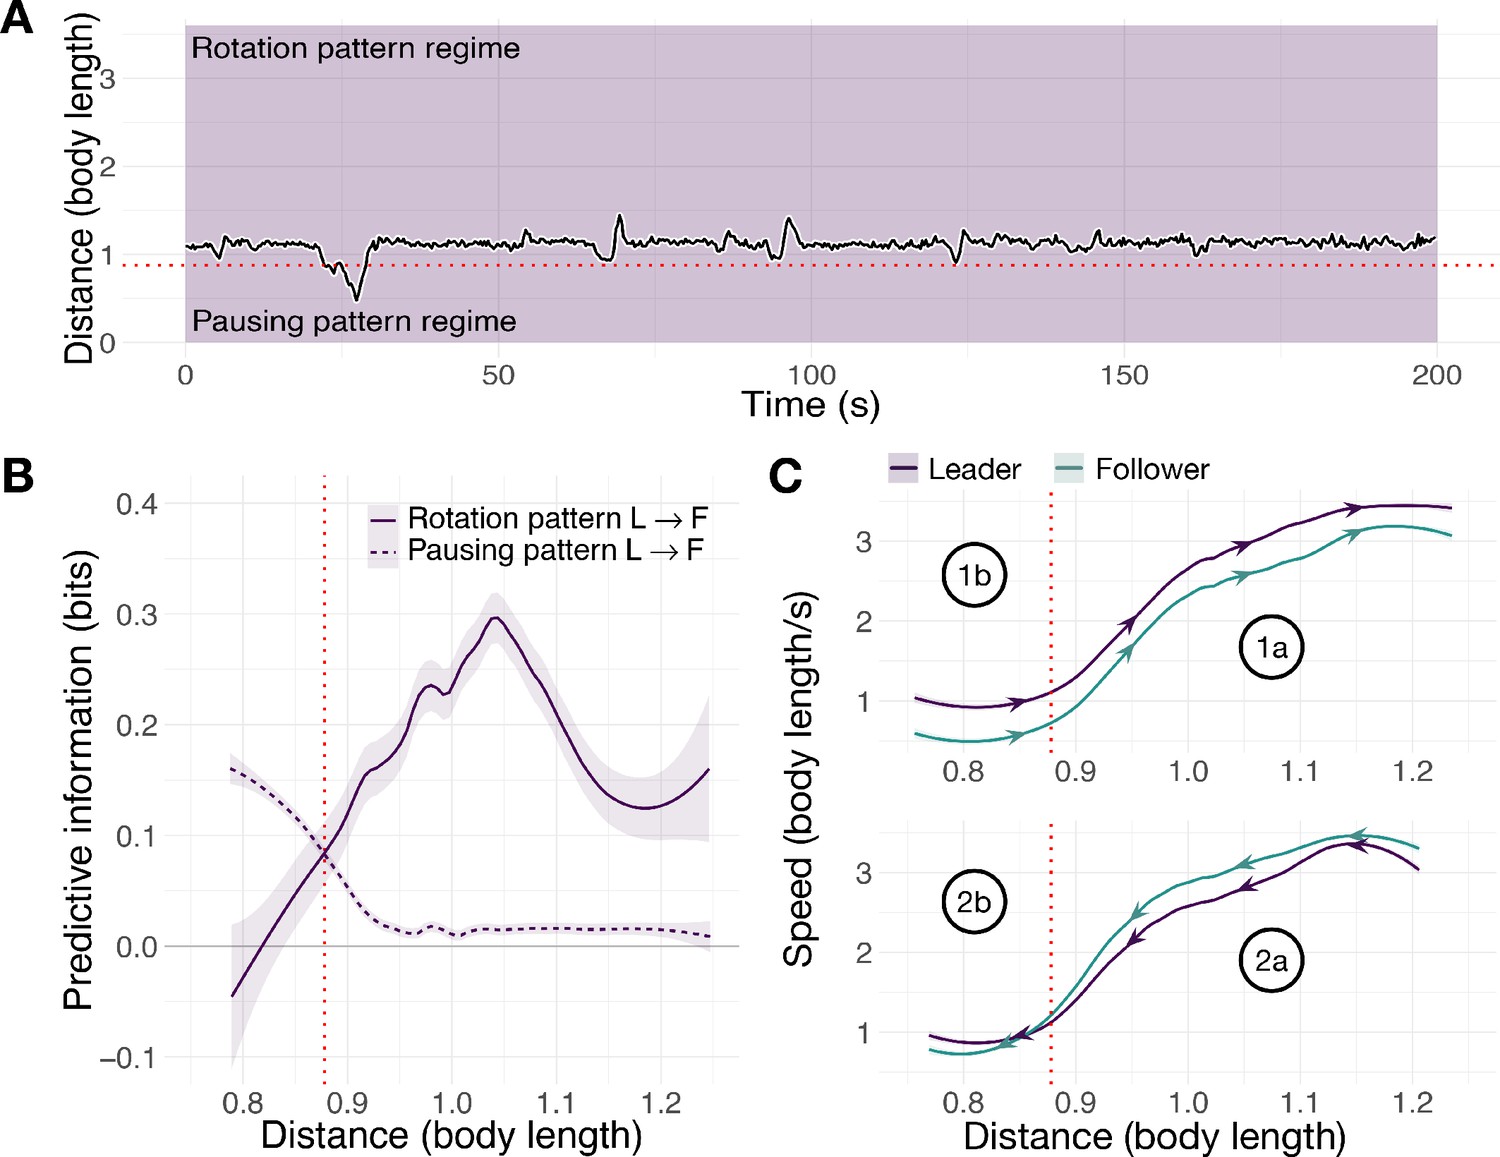
Figure 3
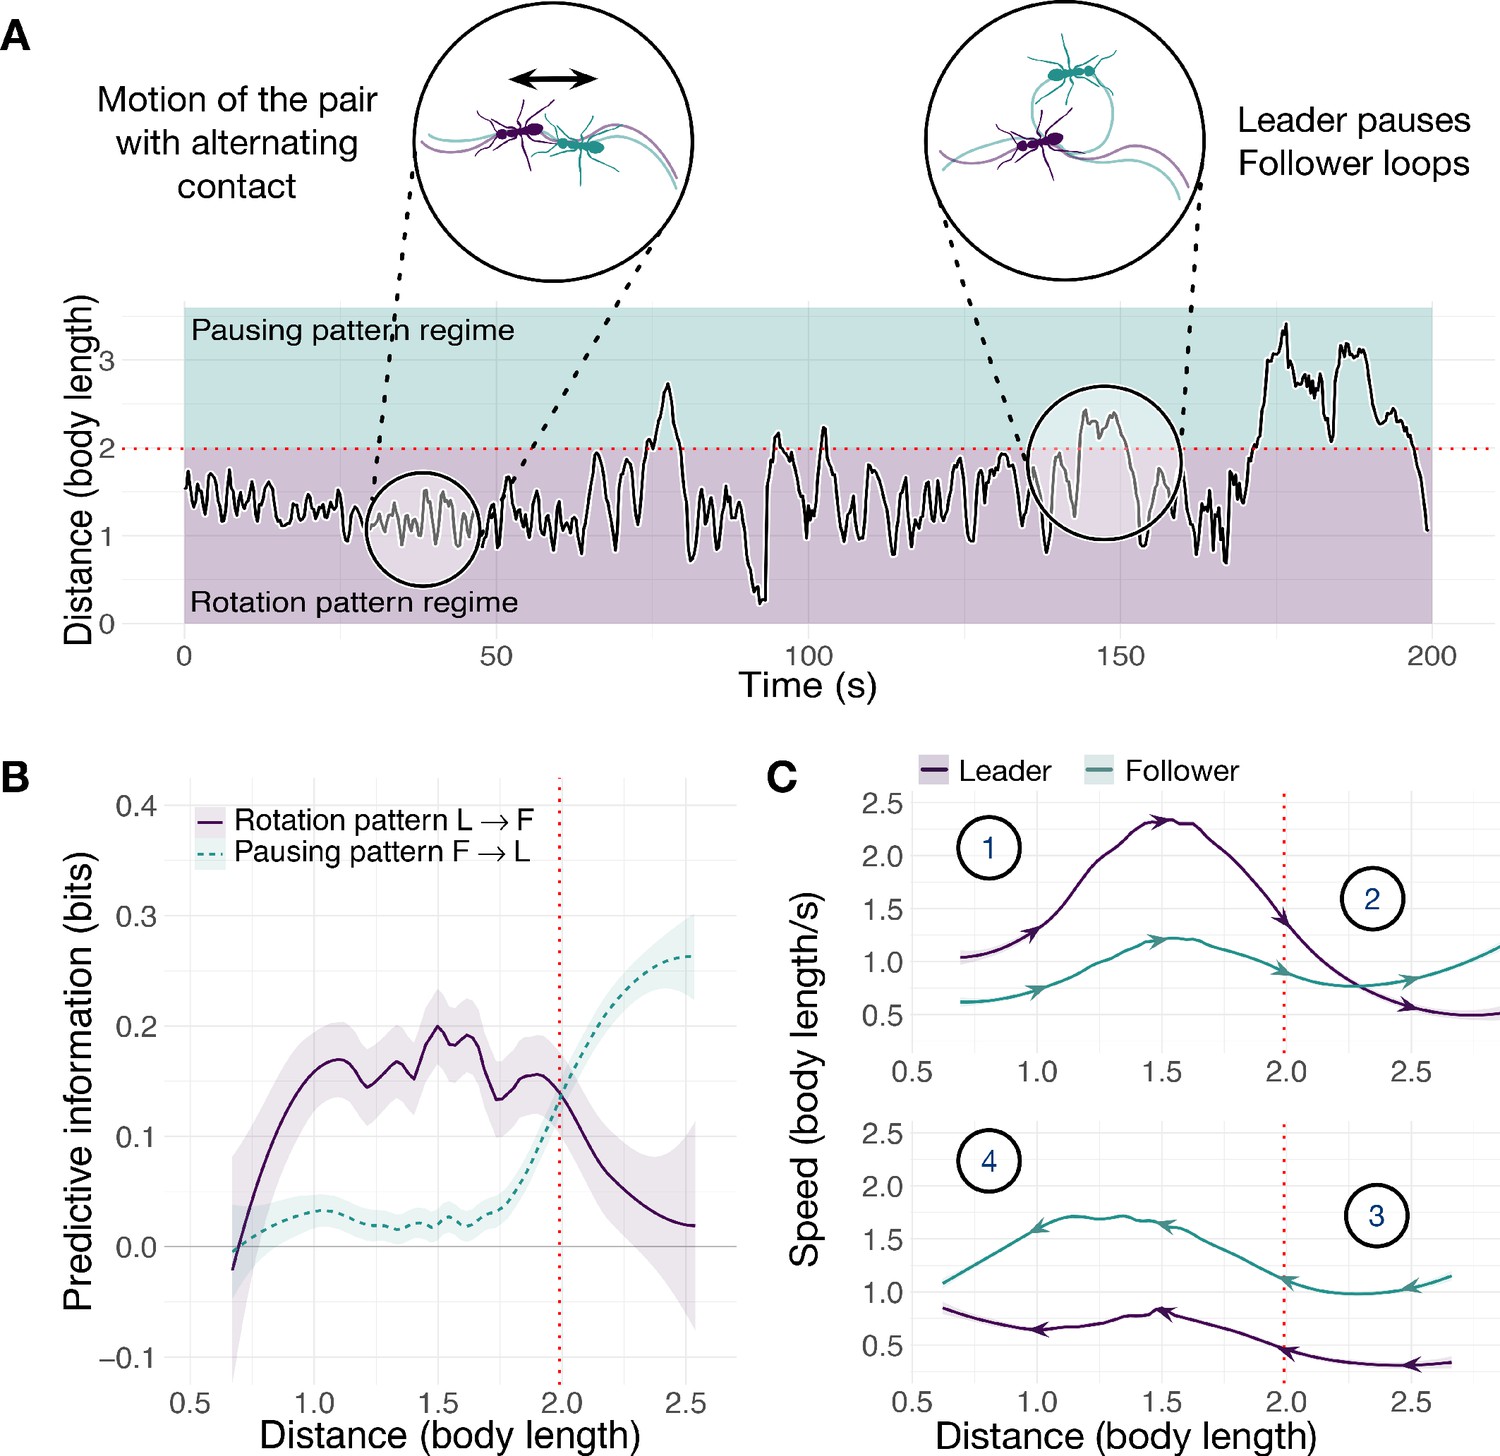
Spatiotemporal dynamics of the ant T. rugatulus.
(A) Distance between the centroids of runners as a function of time. (B) Average predictive information (measured with local transfer entropy) as a function of the distance between centroids of runners (smoothed conditional means with LOESS smoothing and 0.3 span). (C) Average speed of leader and follower as a function of the distance between their centroids for increasing and decreasing distance. Purple represents the leader, green represents the follower. Source data of predictive information are available in Figure 3—source data 1.
-
Figure 3—source data 1
Average local transfer entropy as a function of distance between runners.
- https://cdn.elifesciences.org/articles/55395/elife-55395-fig3-data1-v1.csv
Figure 4 with 1 supplement
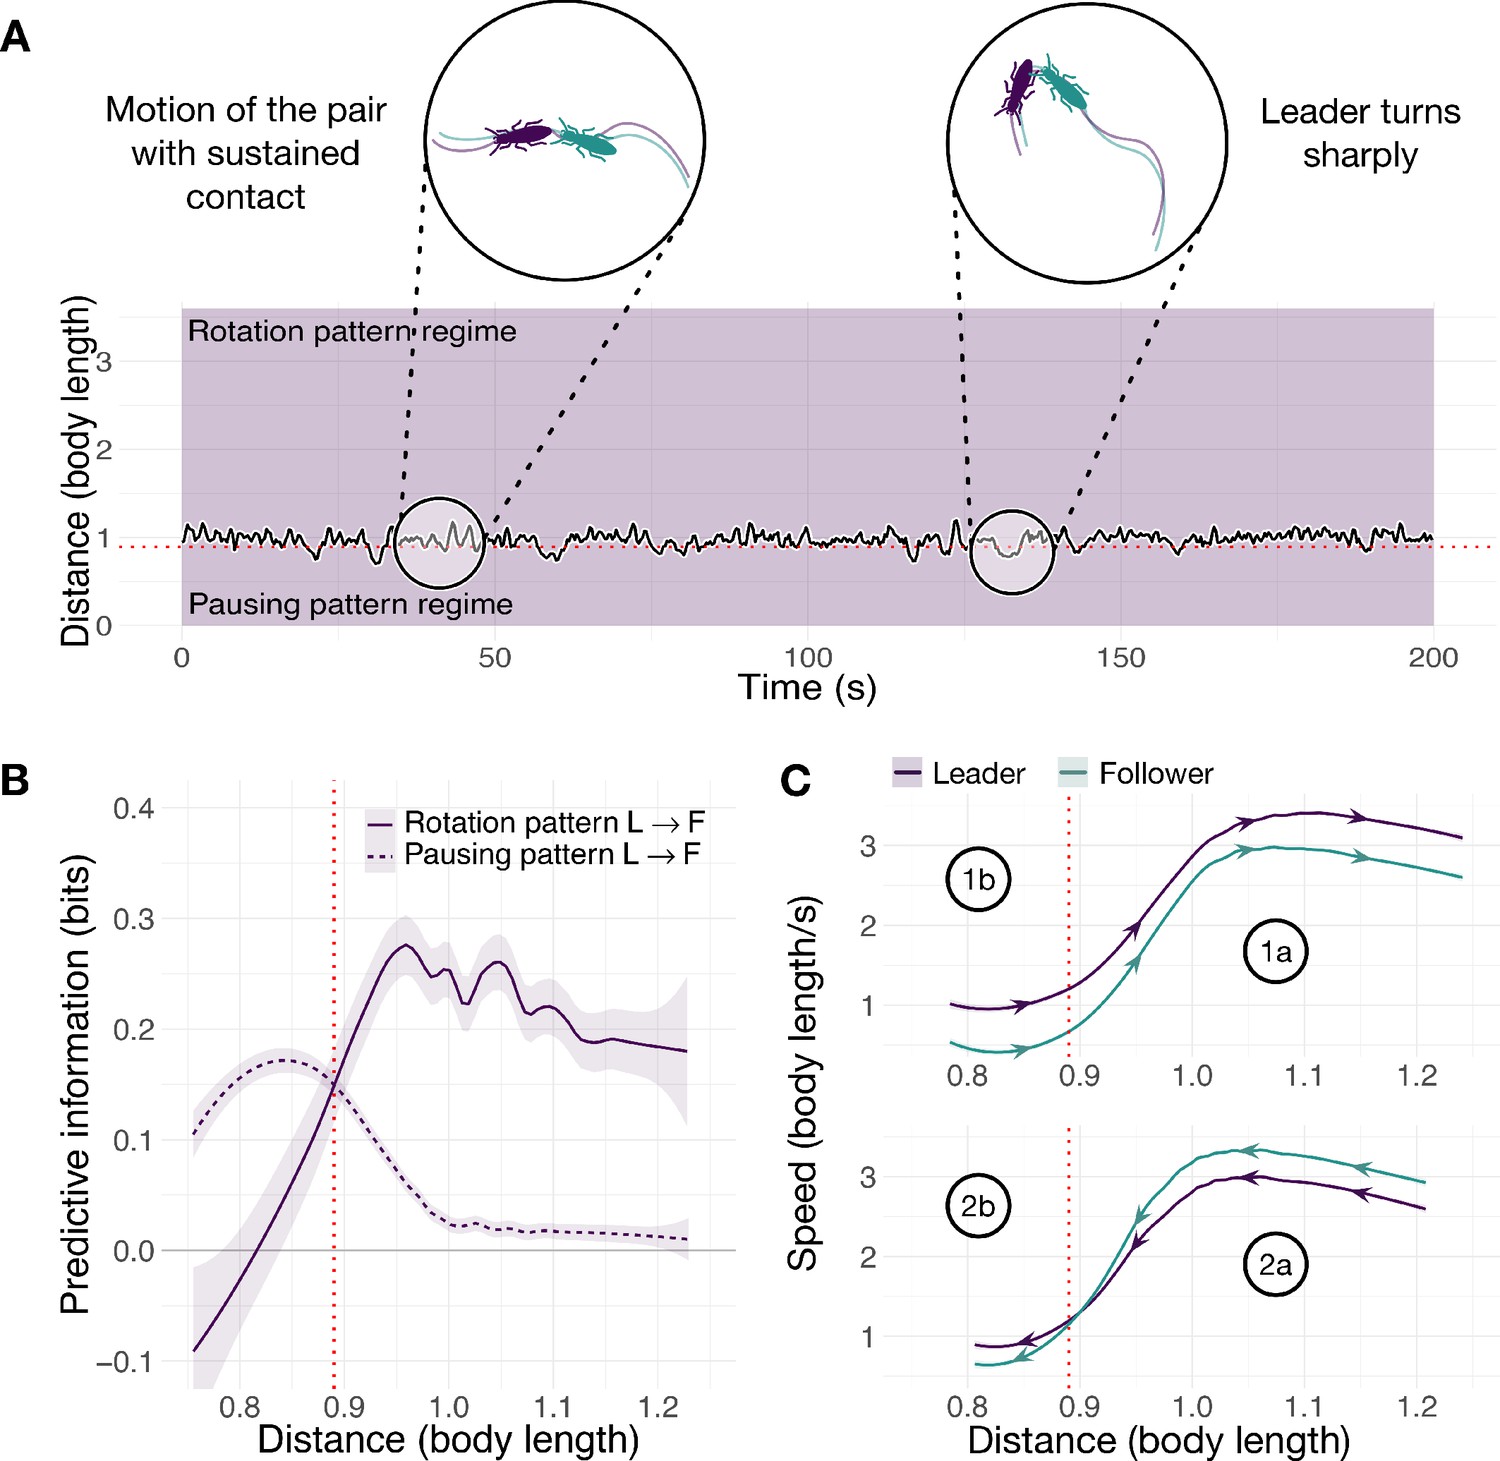
Spatiotemporal dynamics of the termite C. formosanus.
(A) Distance between the centroids of runners as a function of time. (B) Average predictive information (measured with local transfer entropy) as a function of the distance between centroids of runners (smoothed conditional means with LOESS smoothing and 0.3 span). (C) Average speed of leader and follower as a function of the distance between their centroids for increasing and decreasing distance. Purple represents the leader, green represents the follower. See also Figure 4—figure supplement 1. Source data of predictive information are available in Figure 4—source data 1 and Figure 4—source data 2.
-
Figure 4—source data 1
Average local transfer entropy as a function of distance between runners for C. formosanus.
- https://cdn.elifesciences.org/articles/55395/elife-55395-fig4-data1-v1.csv
-
Figure 4—source data 2
Average local transfer entropy as a function of distance between runners for R. speratus.
- https://cdn.elifesciences.org/articles/55395/elife-55395-fig4-data2-v1.csv
Figure 4—figure supplement 1
Spatiotemporal dynamics of the termite R. speratus.
(A) Distance between the centroids of runners as a function of time. (B) Average predictive information (measured with local transfer entropy) as a function of the distance between centroids of runners (smoothed conditional means with LOESS smoothing and 0.3 span). (C) Average speed of leader and follower as a function of the distance between their centroids for increasing and decreasing distance. Purple represents the leader, green represents the follower.
Figure 5
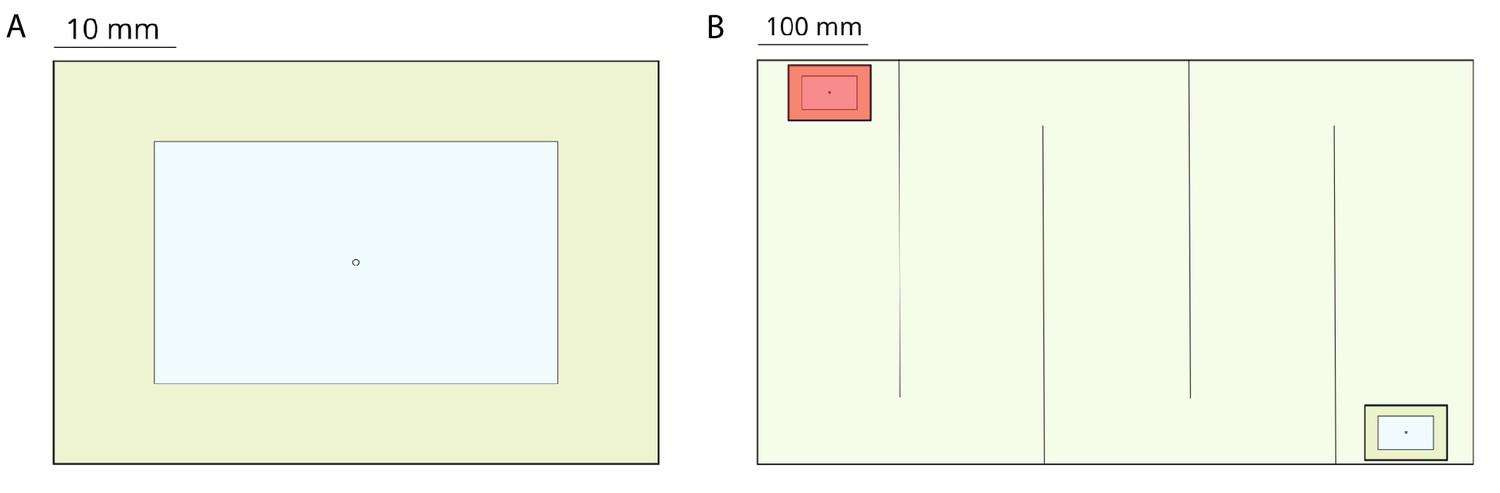
Experimental setup for experiments performed with the ant T. rugatulus.
(A) Nest architecture with the entrance in the center of the roof. (B) Experimental arena partitioned into a corridor with the old nest (bottom right) and the new nest (top left) positioned at the extremities.
Figure 6 with 2 supplements
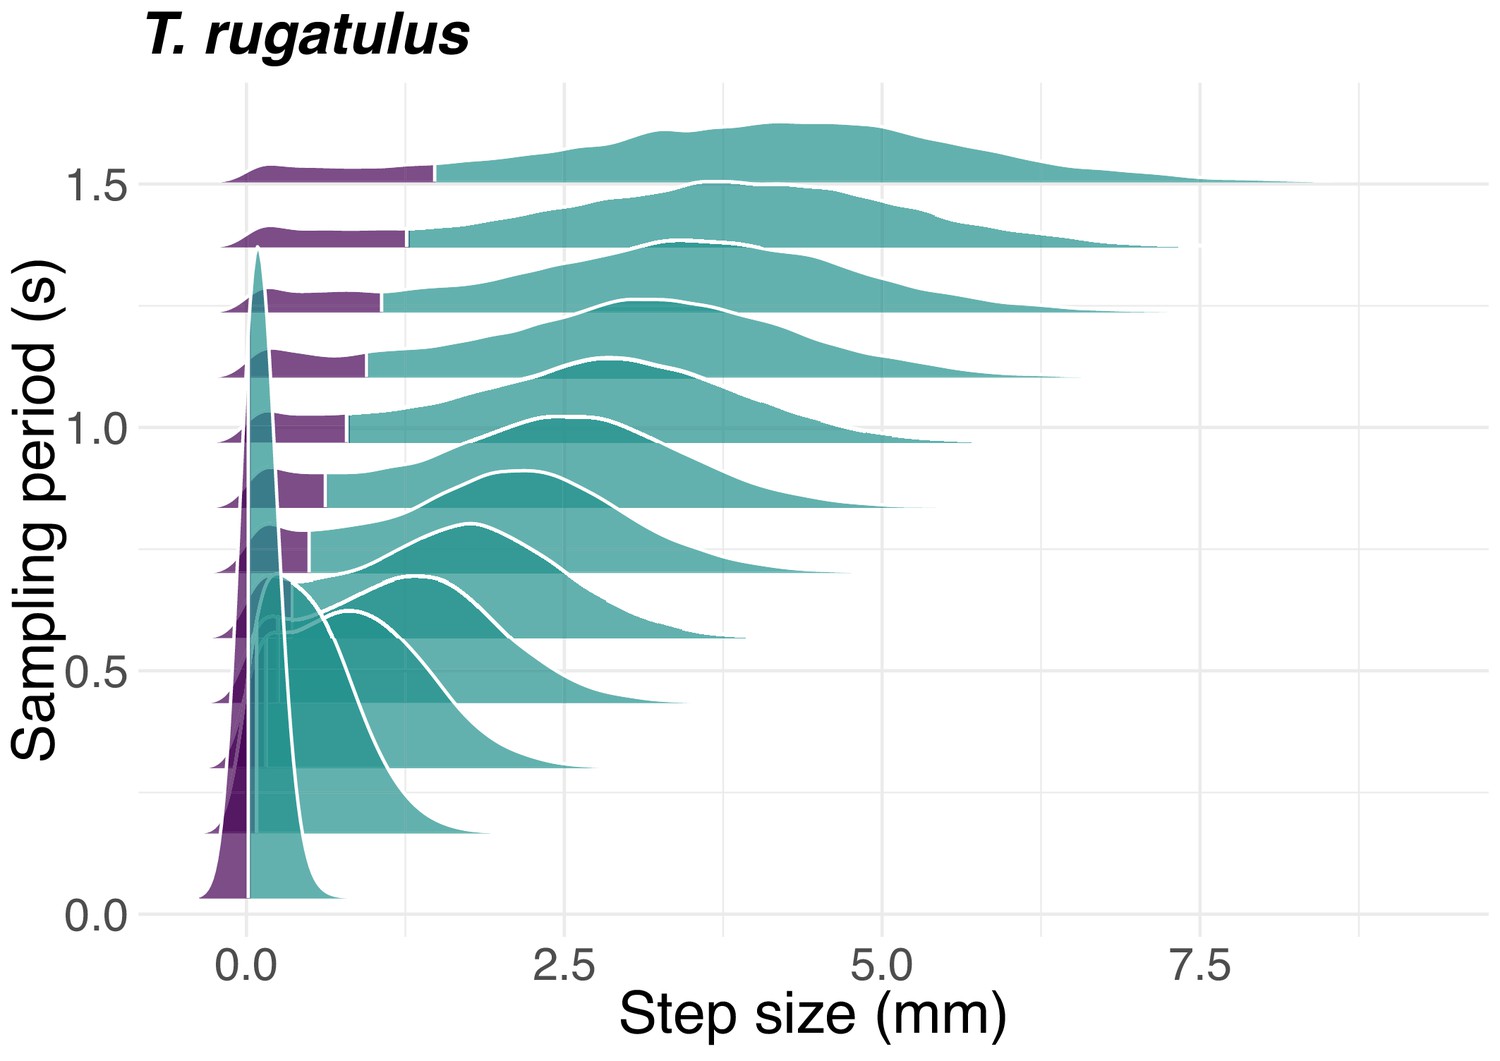
Step-size distribution as a function of sampling period.
Probability density function of the step size for the ant T. rugatulus as a function of the sampling period. Purple represents the 10% probability mass used to define the pause state; green represents the remaining 90% of the probability mass defining the motion state. See also Figure 6—figure supplement 1 for the termite C. formosanus and Figure 6—figure supplement 2 for R. speratus.
Figure 6—figure supplement 1
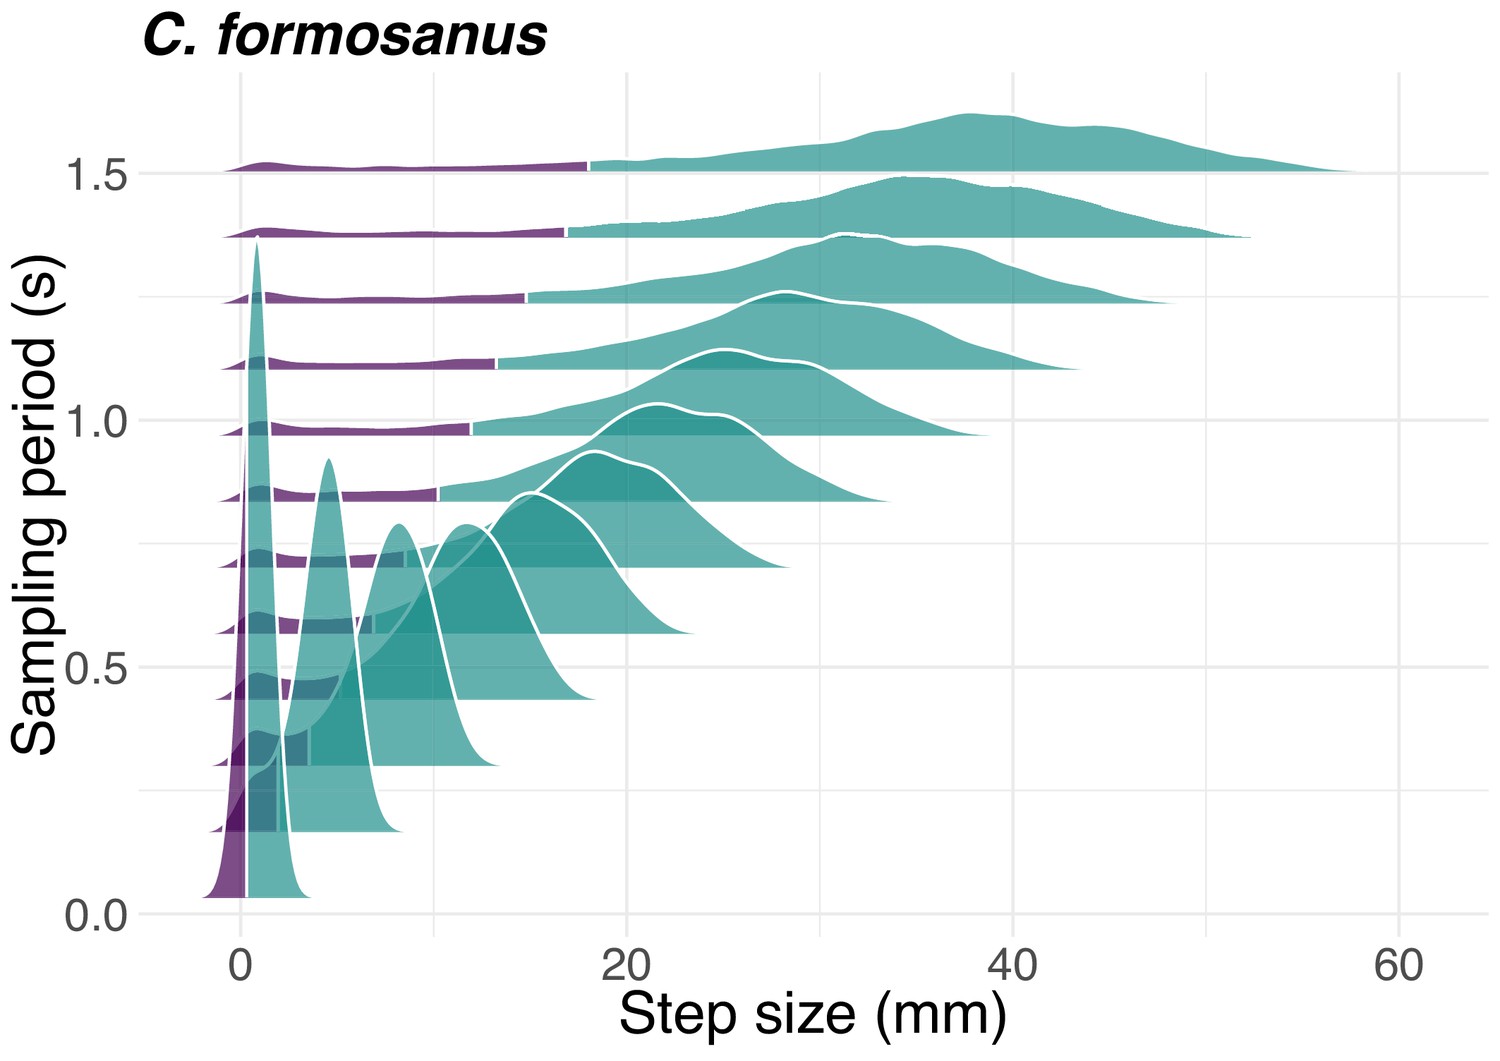
Step-size distribution as a function of sampling period.
Probability density function of the step size for the termite C. formosanus as a function of the sampling period. Purple represents the 10% probability mass used to define the pause state; Green represents the remaining 90% of the probability mass defining the motion state.
Figure 6—figure supplement 2
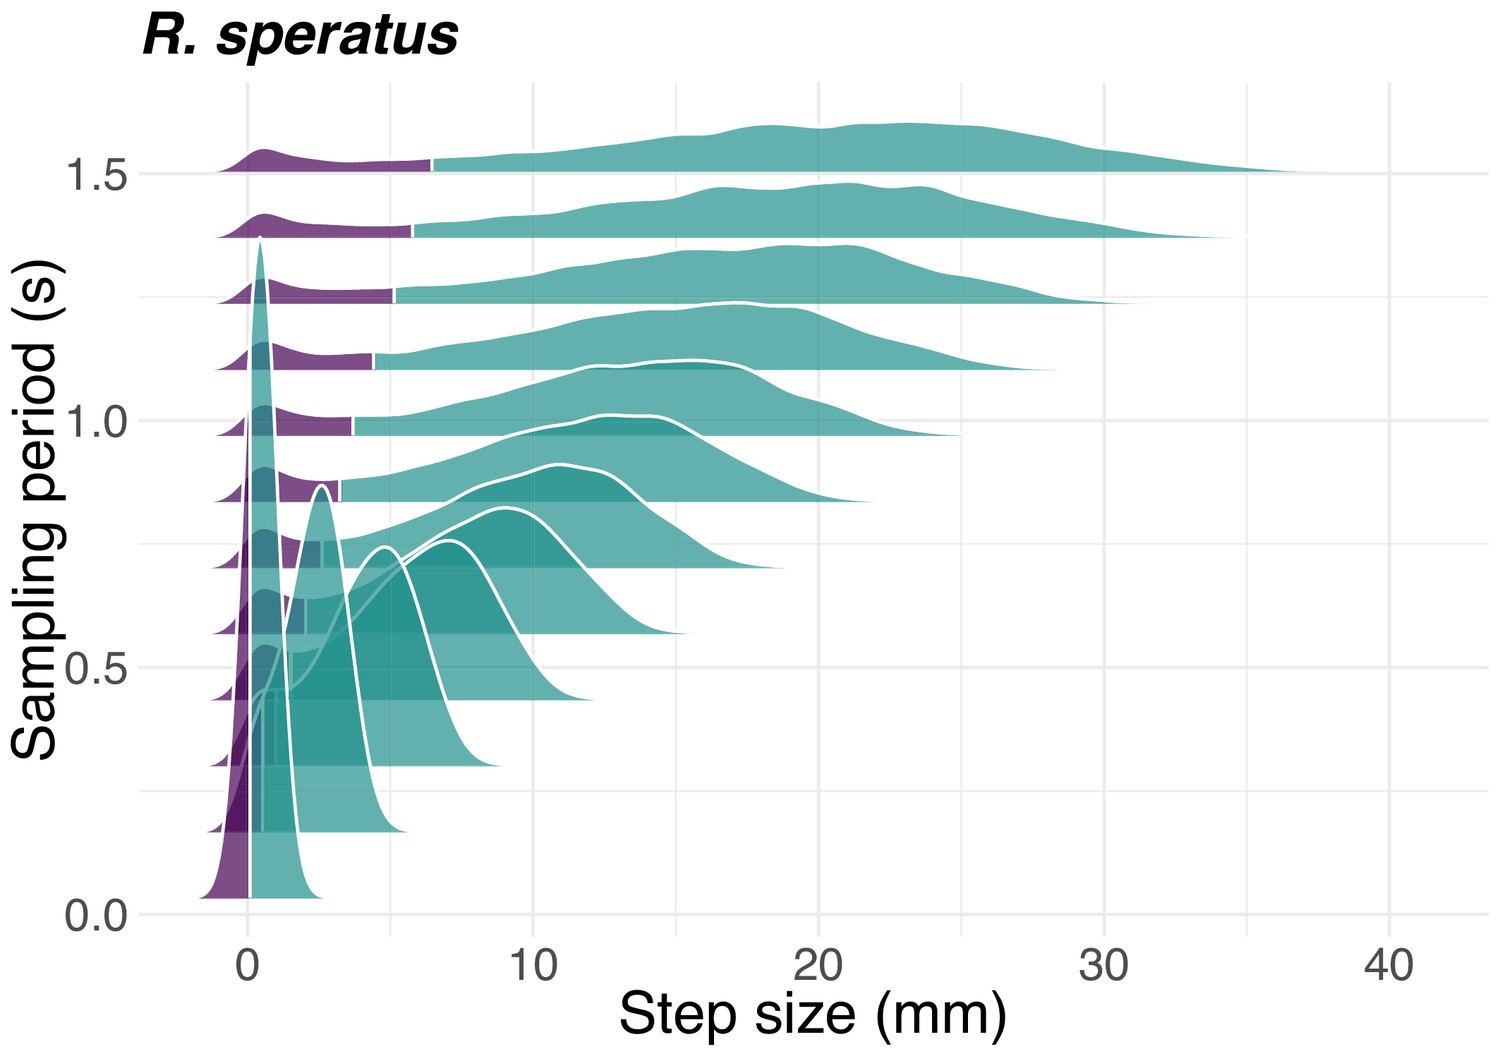
Step-size distribution as a function of sampling period.
Probability density function of the step size for the termite R. speratus as a function of the sampling period. Purple represents the 10% probability mass used to define the pause state; green represents the remaining 90% of the probability mass defining the motion state.
Figure 7 with 3 supplements
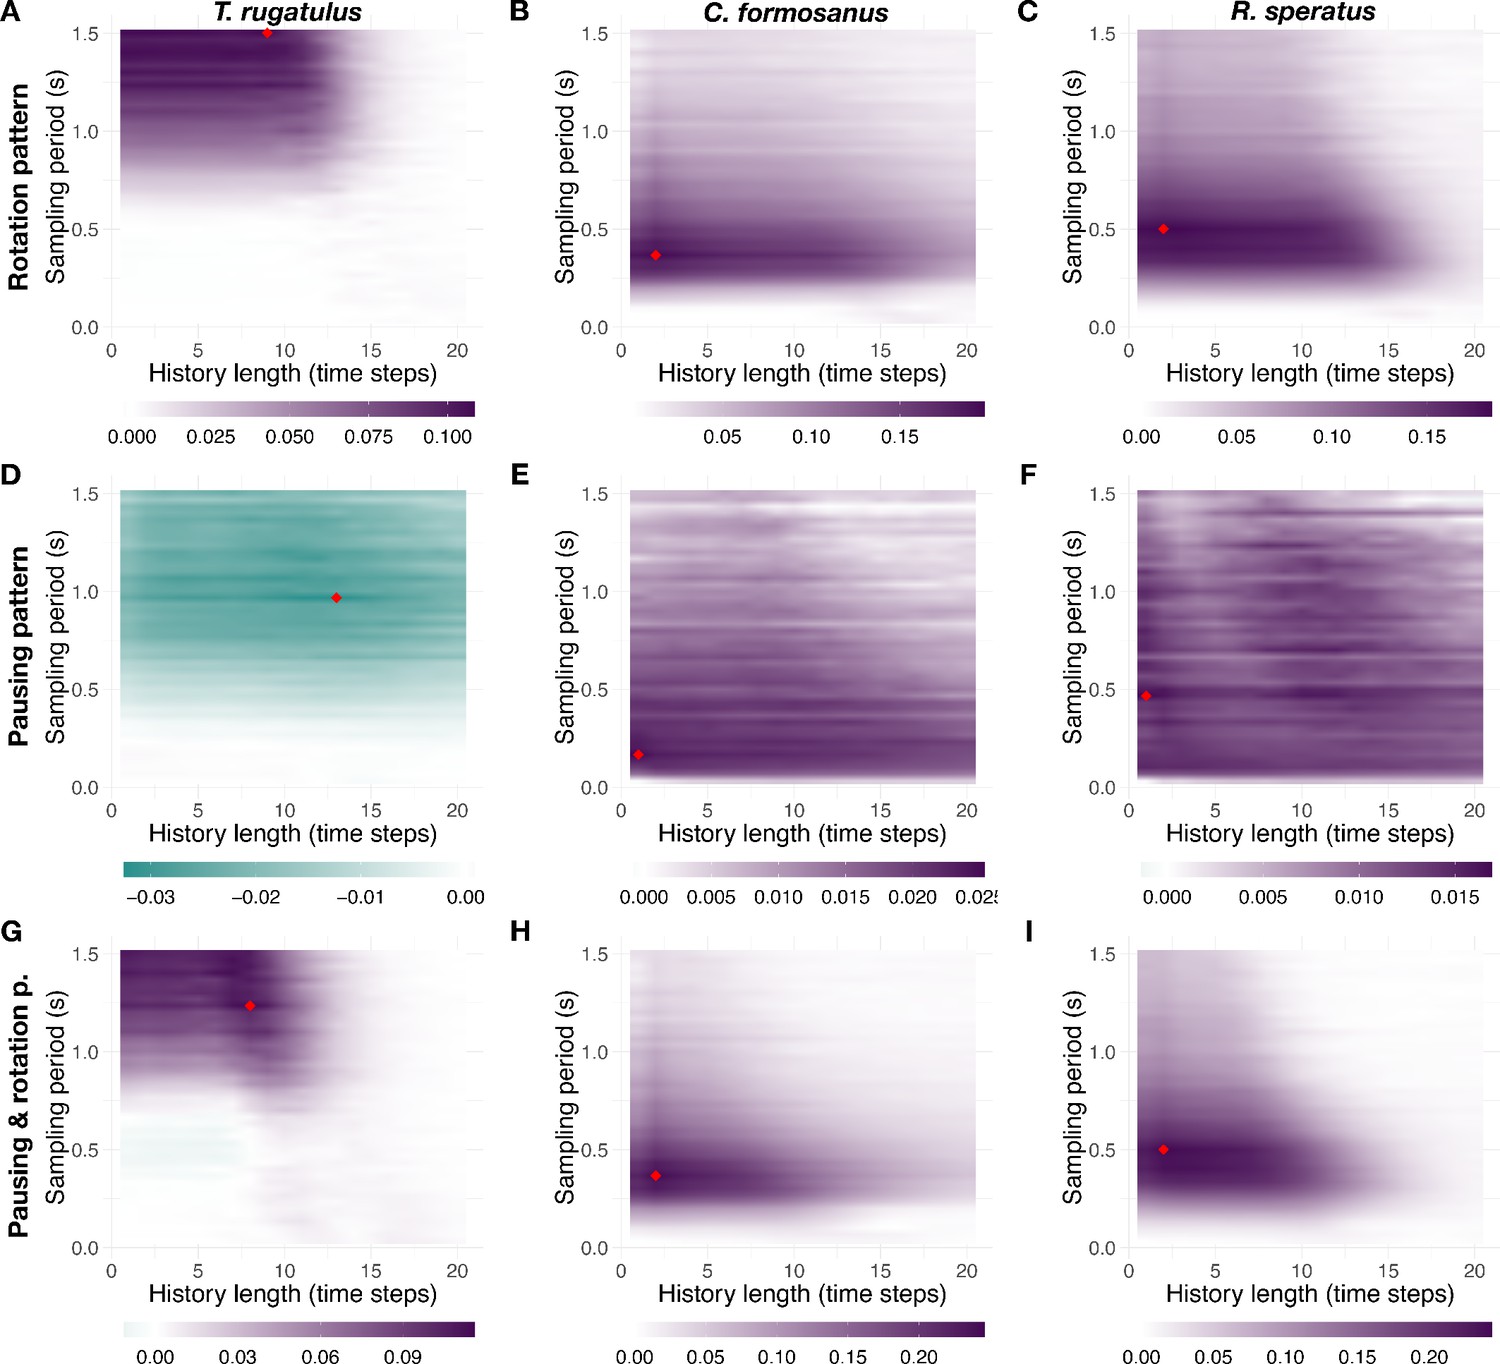
Landscape of net information transfer.
Net transfer entropy (bits) as a function of the sampling period and of the history length. (A), (B), and (C) show the results for the rotation pattern, (D), (E), and (F) show the results for the pausing pattern, and (G), (H), and (I) show the results for the compound pausing and rotation pattern. The first, second, and third columns show the results, respectively, for T. rugatulus, C. formosanus, and R. speratus. Colors indicate the intensity and predominant direction of information transfer (purple, from leader to follower; green, from follower to leader); the red diamond symbol indicates the configuration with maximum magnitude. See also Figure 7—figure supplements 1–3. Source data of net transfer entropy are available in Figure 7—source data 1.
-
Figure 7—source data 1
Transfer entropy as a function of the sampling period and of the history length.
- https://cdn.elifesciences.org/articles/55395/elife-55395-fig7-data1-v1.csv
Figure 7—figure supplement 1
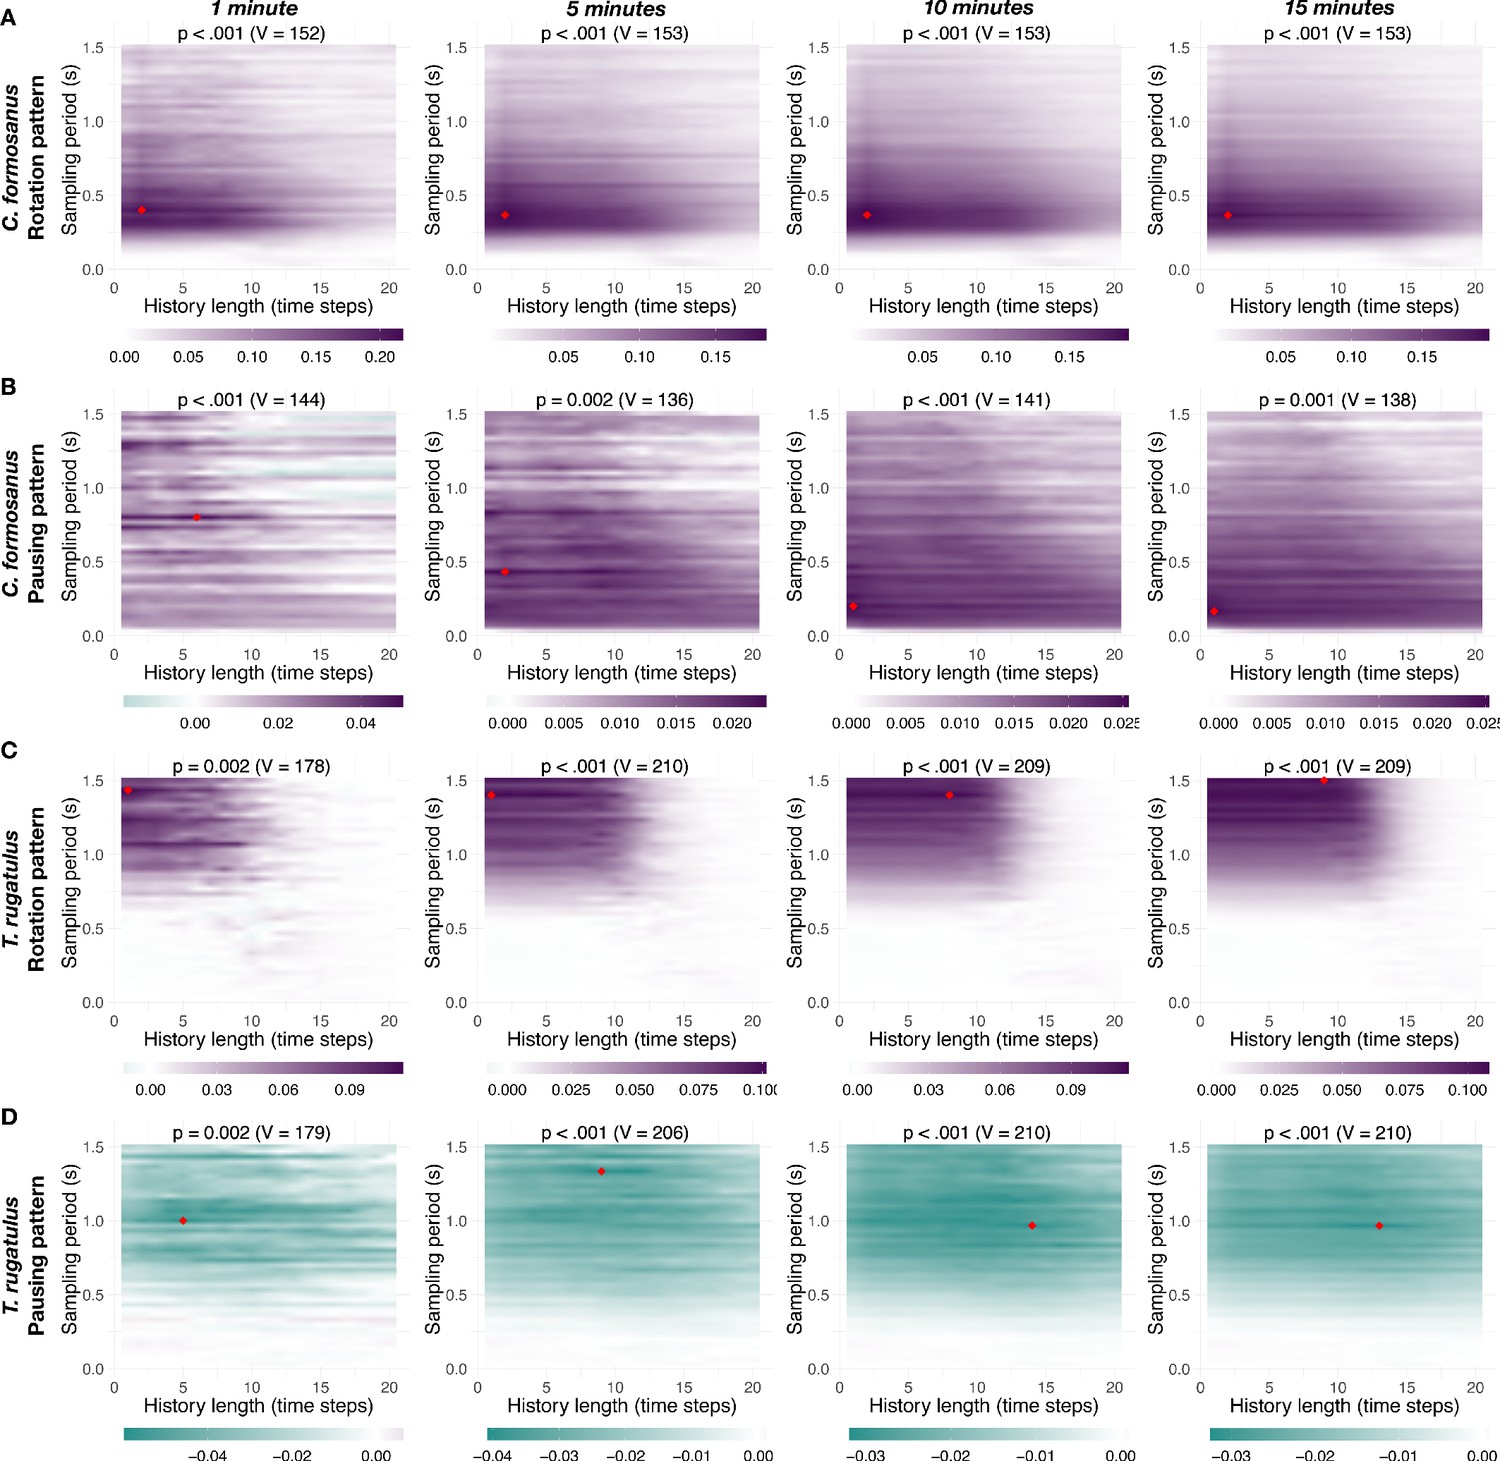
Impact of amount of data on the landscape information transfer.
Net transfer entropy (bits) as a function of the sampling period and of the history length for increasing length of time series (1, 5, 10, and 15 min). (A) and (B) show the results for the rotation pattern and for the pausing pattern for C. formosanus. (C) and (D) show the results for the rotation pattern and for the pausing pattern for T. rugatulus. Colors indicate the intensity and predominant direction of information transfer (purple, from leader to follower; green, from follower to leader); the red diamond symbol indicates the configuration with maximum absolute magnitude and each panel reports the result of a one-sided paired Wilcoxon signed-rank test with continuity correction (-value and statistic) testing the significance of the observed effect for this parameter configuration.
Figure 7—figure supplement 2
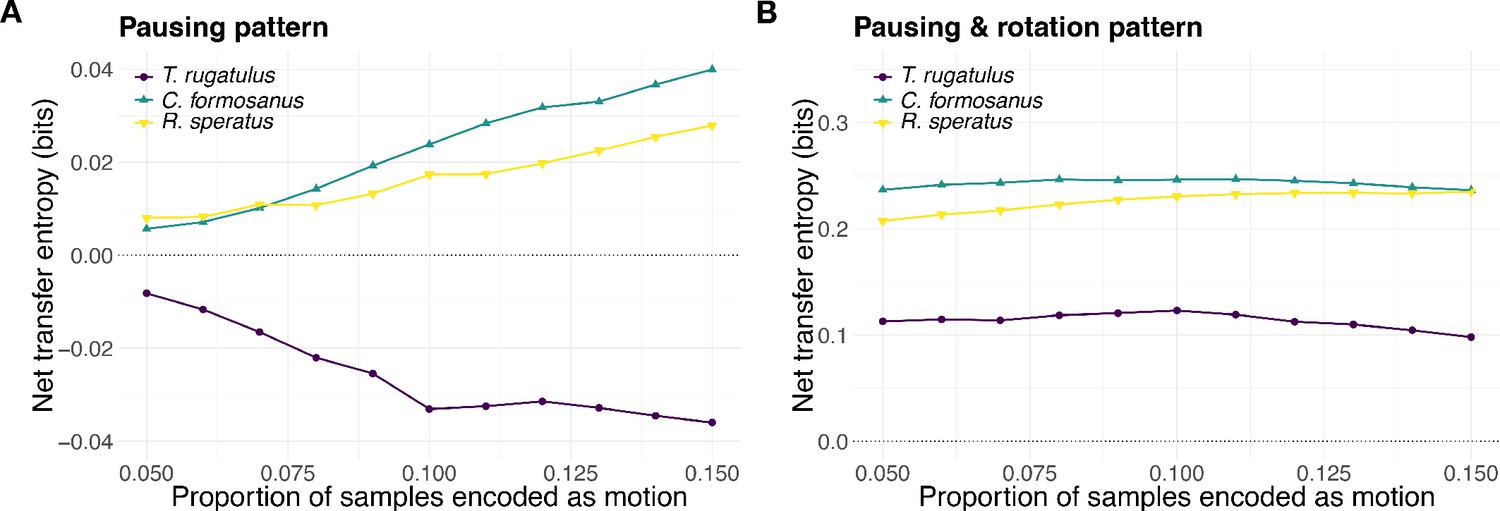
Perturbation analysis of pause-motion threshold.
Net transfer entropy as a function of the probability threshold used to encode step sizes into the motion state and pausing state. (A) Results for the pausing pattern. (B) Results for the compound pausing and rotation pattern. Sampling period and history length correspond to those in Table 1. Positive values represent information transfer from leader to follower, negative values represent information transfer from follower to leader.
Figure 7—figure supplement 3
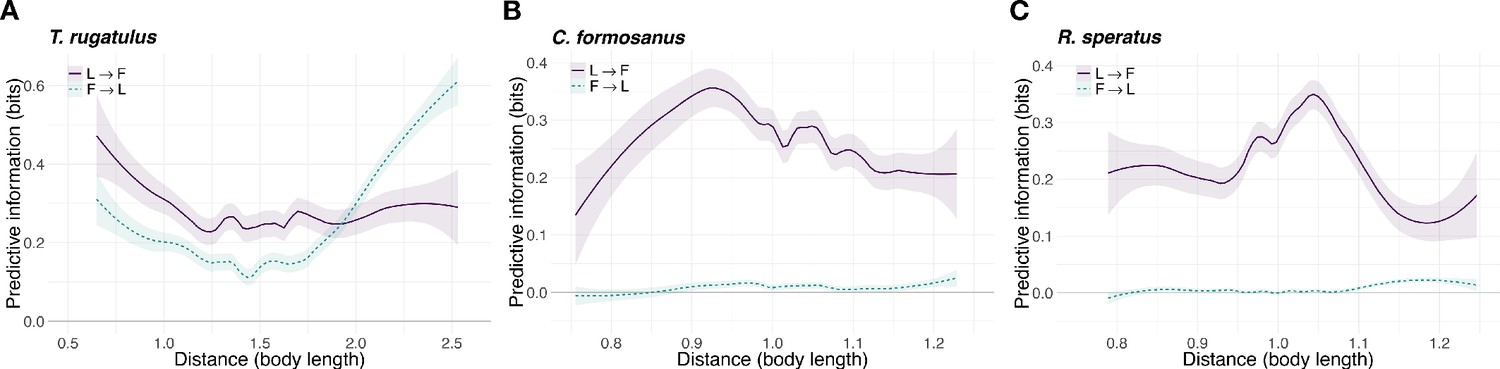
Predictive information over distance between runners.
Average local transfer entropy as a function of the distance between centroids of runners for the compound pausing and rotation pattern (smoothed conditional means with LOESS smoothing and 0.3 span). (A) T. rugatulus, (B) C. formosanus, and (C) R. speratus.
Tables
Table 1
Selected parameter configurations.
For each species and behavioral pattern, the table provides the number of tandem runs used in the study, the sampling period and corresponding number of time steps in each time series, and the history length.
| Species | #Tandem runs | Behavioral pattern | Sampling period (s) | #Time steps | History length |
|---|---|---|---|---|---|
| T. rugatulus | 20 | Rotation | 1.5015 | 599 | 9 |
| Pausing | 0.9676 | 930 | 13 | ||
| Pausing and Rotation | 1.2346 | 728 | 8 | ||
| C. formosanus | 17 | Rotation | 0.3670 | 2452 | 2 |
| Pausing | 0.1668 | 5395 | 1 | ||
| Pausing and Rotation | 0.3670 | 2452 | 2 | ||
| R. speratus | 20 | Rotation | 0.5005 | 1798 | 1 |
| Pausing | 0.4671 | 1926 | 1 | ||
| Pausing and Rotation | 0.5005 | 1798 | 2 |
Table 2
Statistics about transfer entropy.
Mean value and standard error of transfer entropy for the experimental () and surrogate () datasets and of normalized transfer entropy () from the predominant source of predictive information to its destination (i.e., always from leader to follower except for the pausing pattern of T. rugatulus when information is transferred from follower to leader).
| Species | Behavioral pattern | |||||
|---|---|---|---|---|---|---|
| T. rugatulus | Rotation | |||||
| Pausing | ||||||
| Pausing and Rotation | ||||||
| C. formosanus | Rotation | |||||
| Pausing | ||||||
| Pausing and Rotation | ||||||
| R. speratus | Rotation | |||||
| Pausing | ||||||
| Pausing and Rotation |
Table 3
Results of hypothesis testing of information transfer between leaders and followers.
Columns 3 and 4 report the results of one-sided two-sample Wilcoxon rank-sum tests with continuity correction (-value and statistic) testing if the experimental dataset has significantly higher transfer entropy than the surrogate one. Columns 5 and 6 report the results of one-sided paired Wilcoxon signed-rank tests with continuity correction (-value and statistic) testing, respectively, if the leader is significantly more informative than the follower and vice versa. Significant -values are reported in bold.
| Species | Behavioral pattern | ||||
|---|---|---|---|---|---|
| T. rugatulus | Rotation | ||||
| Pausing | |||||
| Pausing and Rotation | |||||
| C. formosanus | Rotation | ||||
| Pausing | |||||
| Pausing and Rotation | |||||
| R. speratus | Rotation | ||||
| Pausing | |||||
| Pausing and Rotation |
Additional files
Download links
A two-part list of links to download the article, or parts of the article, in various formats.
Downloads (link to download the article as PDF)
Open citations (links to open the citations from this article in various online reference manager services)
Cite this article (links to download the citations from this article in formats compatible with various reference manager tools)
Revealing the structure of information flows discriminates similar animal social behaviors
eLife 9:e55395.
https://doi.org/10.7554/eLife.55395


