Ultrastructural comparison of dendritic spine morphology preserved with cryo and chemical fixation
- Laboratory of Sensory Processing, Brain Mind Institute, Faculty of Life Sciences, Ecole Polytechnique Fédérale de Lausanne (EPFL), Switzerland
- Biological Electron Microscopy Facility, Faculty of Life Sciences, Ecole Polytechnique Fédérale de Lausanne (EPFL), Switzerland
- Functional Anatomy and Neuroscience, Graduate School of Medicine, Nagoya University, Japan
- Japan Society of the Promotion of Sciences (JSPS), Japan
- School of Health Sciences (HESAV), University of Applied Sciences and Arts Western Switzerland (HES-SO), Switzerland
Figures
Figure 1 with 1 supplement
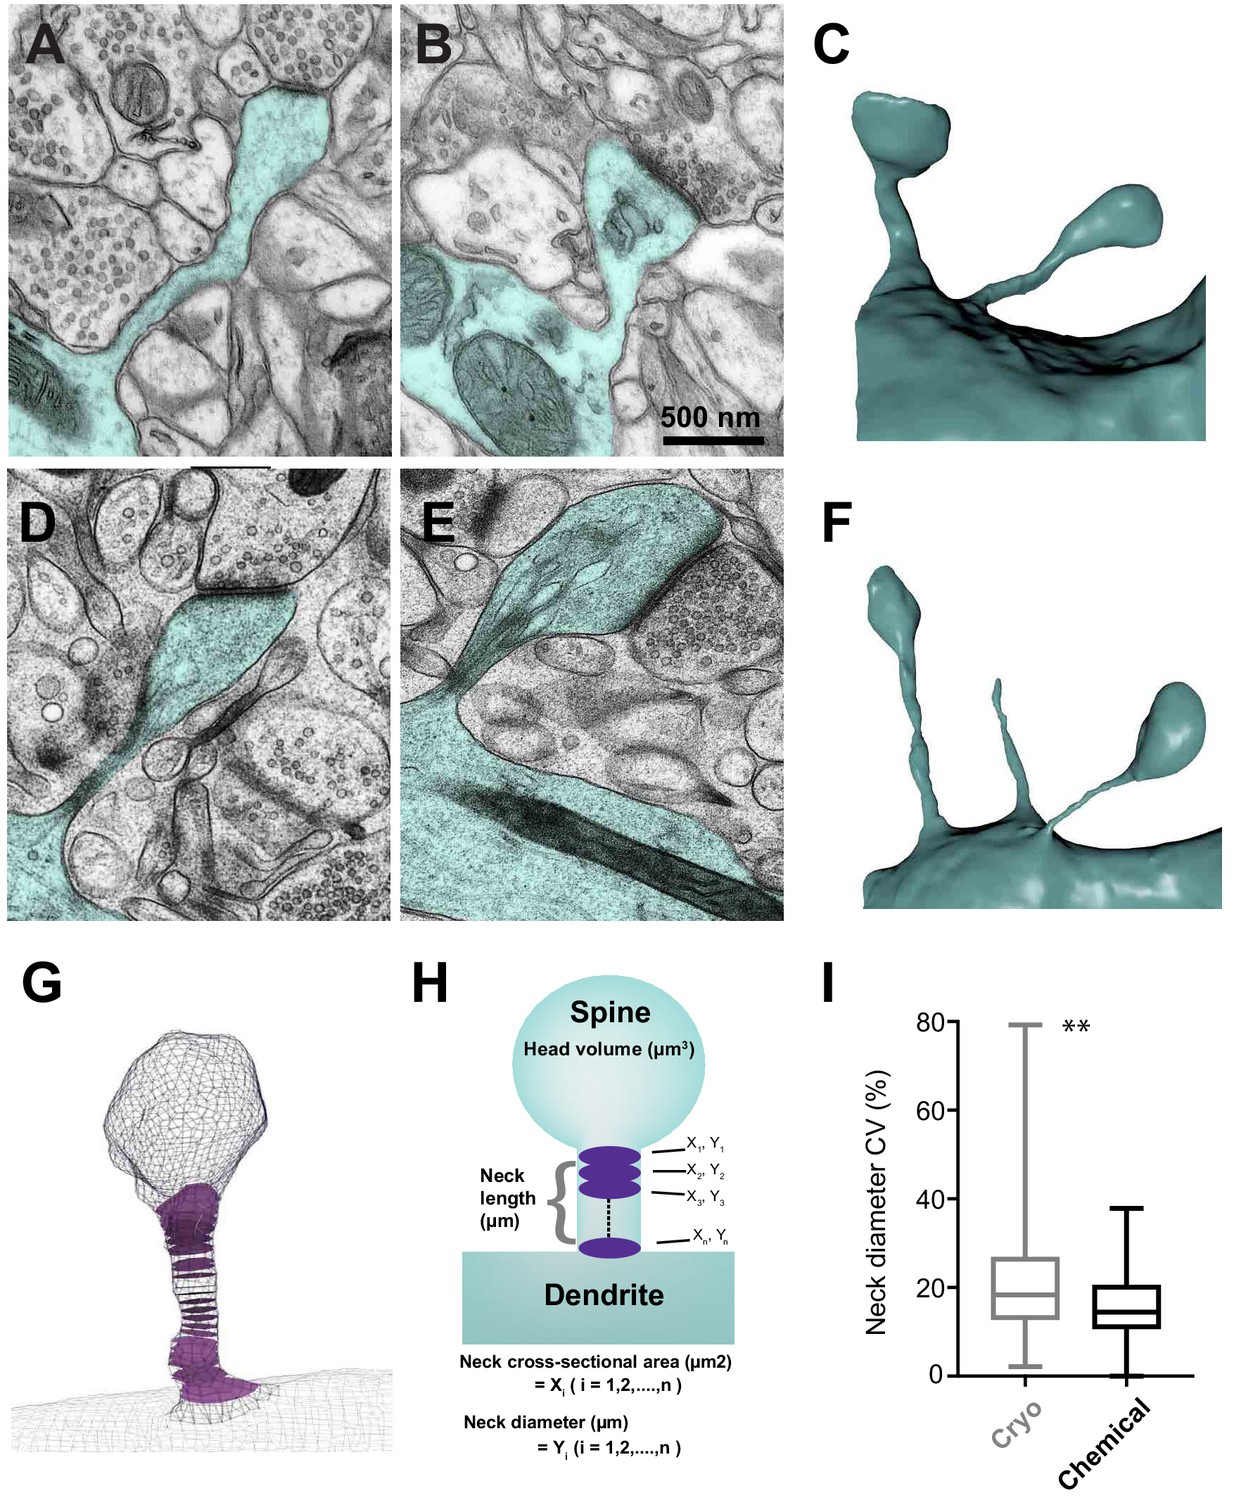
Serial section electron microscopy to compare the sizes of spine heads, their neck lengths and neck widths between cryo and chemically fixed tissue.
Dendritic spines in chemically fixed (A, B, C) and cryo-fixed (D, E, F) neuropil were reconstructed in 3D from serial electron micrographs. (G) An example of a 3D model showing cross-sections (purple) through the neck region. (H) These models were used to measure head volume, neck length, and average and minimum neck cross-sectional area. The neck cross-sectional area is an average of several neck cross-sectional areas (X1, X2,…, Xn) through the spine neck, and the neck diameter (Y1, Y2,…, Yn) was calculated from these values. (I) Box plot showing a difference in the coefficient of variation (%) of neck diameter for each spine. Plot shows the median, interquartile range with minimum and maximum values (p=0.0012, unpaired, Kolmogorov-Smirnov test).
-
Figure 1—source data 1
Coefficients of variation data used in Figure 1I.
- https://cdn.elifesciences.org/articles/56384/elife-56384-fig1-data1-v2.xlsx
Figure 1—figure supplement 1
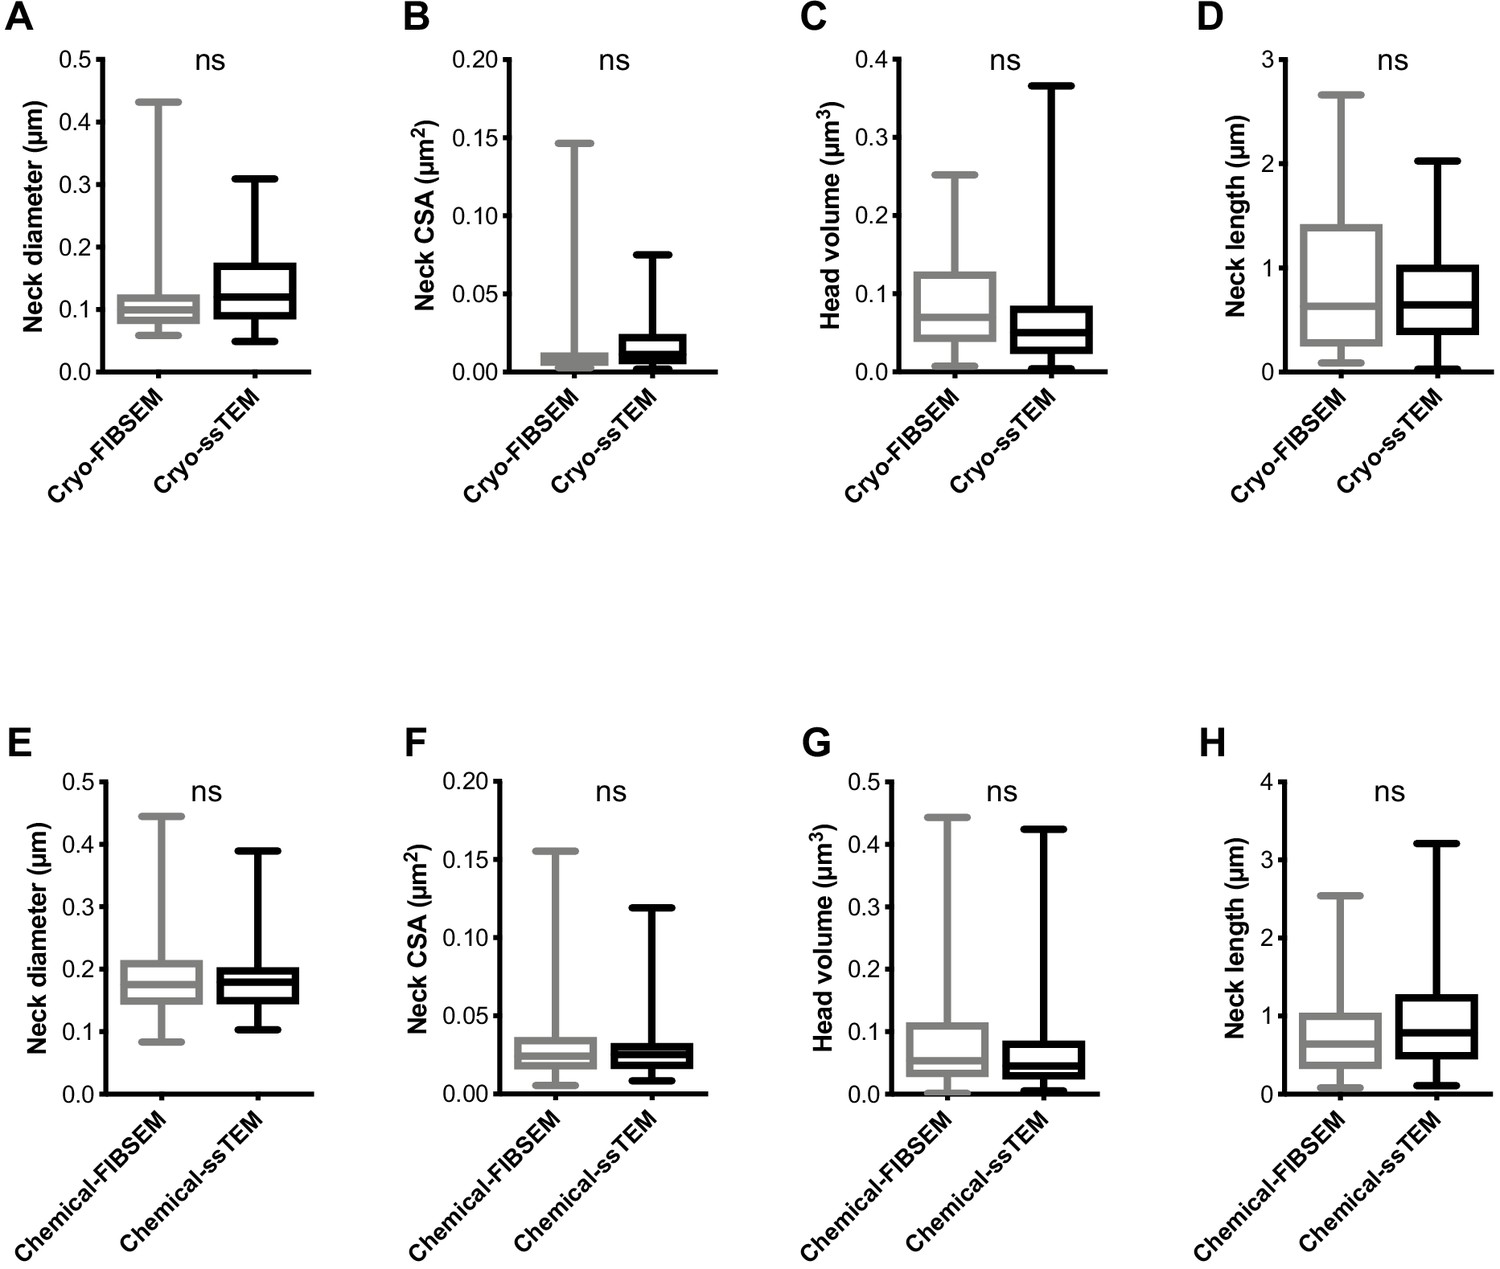
Comparison between FIBSEM and serial section TEM data showing no significant difference between the two imaging methods.
(A) Spine neck diameter in cryo-fixed samples was not significantly different between those measured in FIBSEM and ssTEM (FIBSEM, 0.12 ± 0.07 µm; ssTEM, 0.13 ± 0.06 µm; p=0.06, K-S test). (B) Spine neck cross-sectional area in cryo-fixed samples was not significantly different between those measured in FIBSEM and ssTEM (FIBSEM, 0.014 ± 0.027 µm2; ssTEM, 0.016 ± 0.02 µm2; p=0.06, K-S test). (C) Spine head volume in cryo-fixed samples was not significantly different between those measured in FIBSEM and ssTEM (FIBSEM, 0.087 ± 0.06 µm3; ssTEM, 0.065 ± 0.062 µm3; p=0.07, K-S test). (D) Spine neck length in cryo-fixed samples was not significantly different between those measured in FIBSEM and ssTEM (FIBSEM, 0.88 ± 0.74 µm; ssTEM, 0.74 ± 0.48 µm; p=0.62, K-S test). (E) Spine neck diameter in chemically fixed samples was not significantly different between those measured in FIBSEM and ssTEM (FIBSEM, 0.19 ± 0.06 µm; ssTEM, 0.18 ± 0.05 µm; p=0.52, K-S test). (F) Spine neck cross-sectional area in chemically fixed samples was not significantly different between those measured in FIBSEM and ssTEM (FIBSEM, 0.03 ± 0.02 µm2; ssTEM, 0.027 ± 0.016 µm2; p=0.52, K-S test). (G) Spine head volume in chemically fixed samples was not significantly different between those measured in FIBSEM and ssTEM (FIBSEM, 0.089 ± 0.097 µm3; ssTEM, 0.072 ± 0.075 µm3; p=0.89, K-S test). (H) Spine neck length in chemically fixed samples was not significantly different between those measured in FIBSEM and ssTEM (FIBSEM, 0.75 ± 0.54 µm; ssTEM, 0.92 ± 0.59 µm; p=0.10, K-S test).
-
Figure 1—figure supplement 1—source data 1
Spine parameter data used in Figure 1—figure supplement 1.
- https://cdn.elifesciences.org/articles/56384/elife-56384-fig1-figsupp1-data1-v2.xlsx
Figure 2 with 1 supplement

Cryo-fixed dendritic spines show reduced neck widths.
(A) Distribution of neck cross-sectional area measurement in cryo-fixed (n = 116 spines, N = 5) and chemically fixed (n = 150, N = 3) cortex (p<0.0001, Kolmogorov-Smirnov). Curves show log-normal fits (R2 values of 0.92 for cryo-fixed spines; 0.94 for chemically fixed). Inset shows a box plot indicating median, interquartile range and minimum and maximum values. (B) The distribution of minimum neck cross-sectional area measurements in cryo-fixed and chemically fixed cortex (p<0.0001, Kolmogorov-Smirnov). Log-normal curves have R2 values of 0.98 for cryo-fixed spines and 0.98 for chemically fixed. (C) The distribution of neck diameter calculated from the cross-sectional area measurements in cryo-fixed and chemically fixed cortex (p<0.0001, Kolmogorov-Smirnov). Log-normal curves have R2 values of 0.95 for cryo-fixed spines and 0.96 for chemically fixed. (D) The distribution of minimum neck diameter in cryo-fixed and chemically fixed cortex (p<0.0001, Kolmogorov-Smirnov). Log-normal curves have R2 values of 0.90 for cryo-fixed spines and 0.89 for chemically fixed. (E) The distribution of neck length measurements in cryo-fixed and chemically fixed cortex (p=0.53, Kolmogorov-Smirnov). Log-normal curves have R2 values of 0.80 for cryo-fixed spines and 0.76 for chemically fixed. (F) Distribution of head volume measurement in cryo-fixed and chemically fixed cortex (p=0.65, Kolmogorov-Smirnov). Log-normal curves have R2 values of 0.89 for cryo-fixed spines and 0.86 for chemically fixed.
-
Figure 2—source data 1
Spine parameter data used in Figure 2.
- https://cdn.elifesciences.org/articles/56384/elife-56384-fig2-data1-v2.xlsx
Figure 2—figure supplement 1
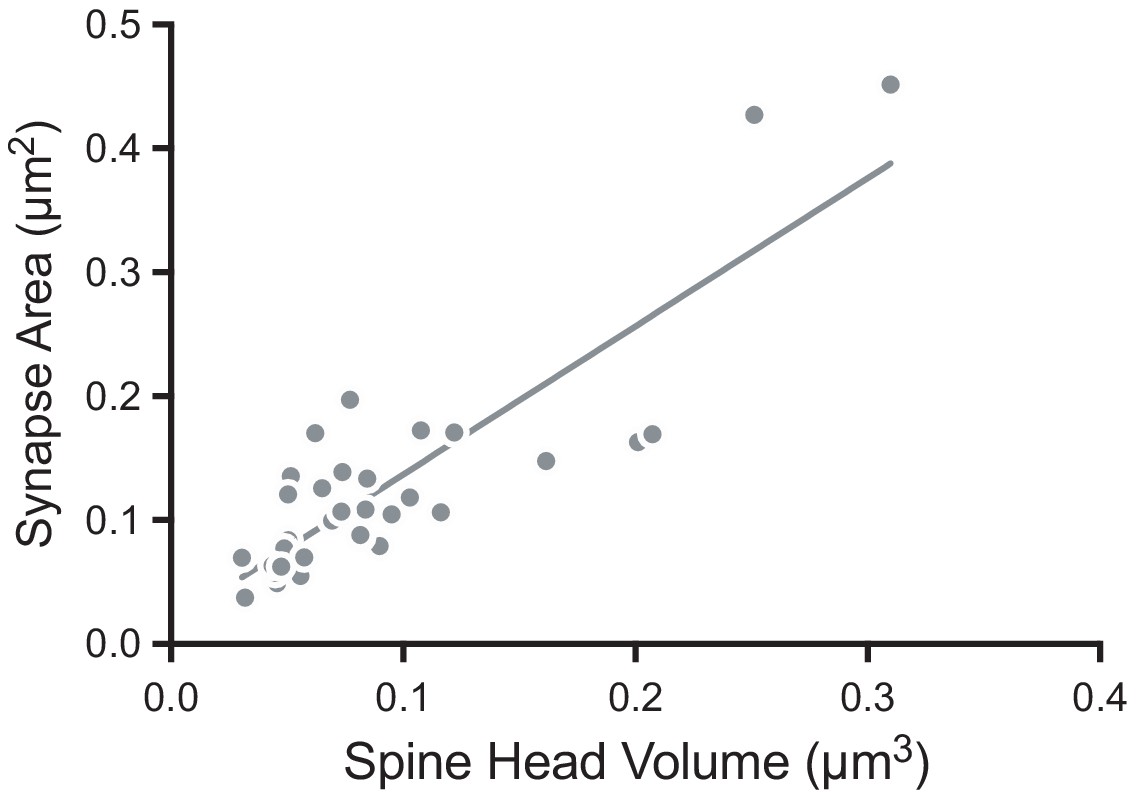
Dendritic spine head volume correlates with the size of the synapse in cryo-fixed neuropil.
Plot of synapse area against spine head volume for 33 spines (R2 = 0.73).
-
Figure 2—figure supplement 1—source data 1
Spine parameter data used in Figure 2—figure supplement 1.
- https://cdn.elifesciences.org/articles/56384/elife-56384-fig2-figsupp1-data1-v2.xlsx
Figure 3
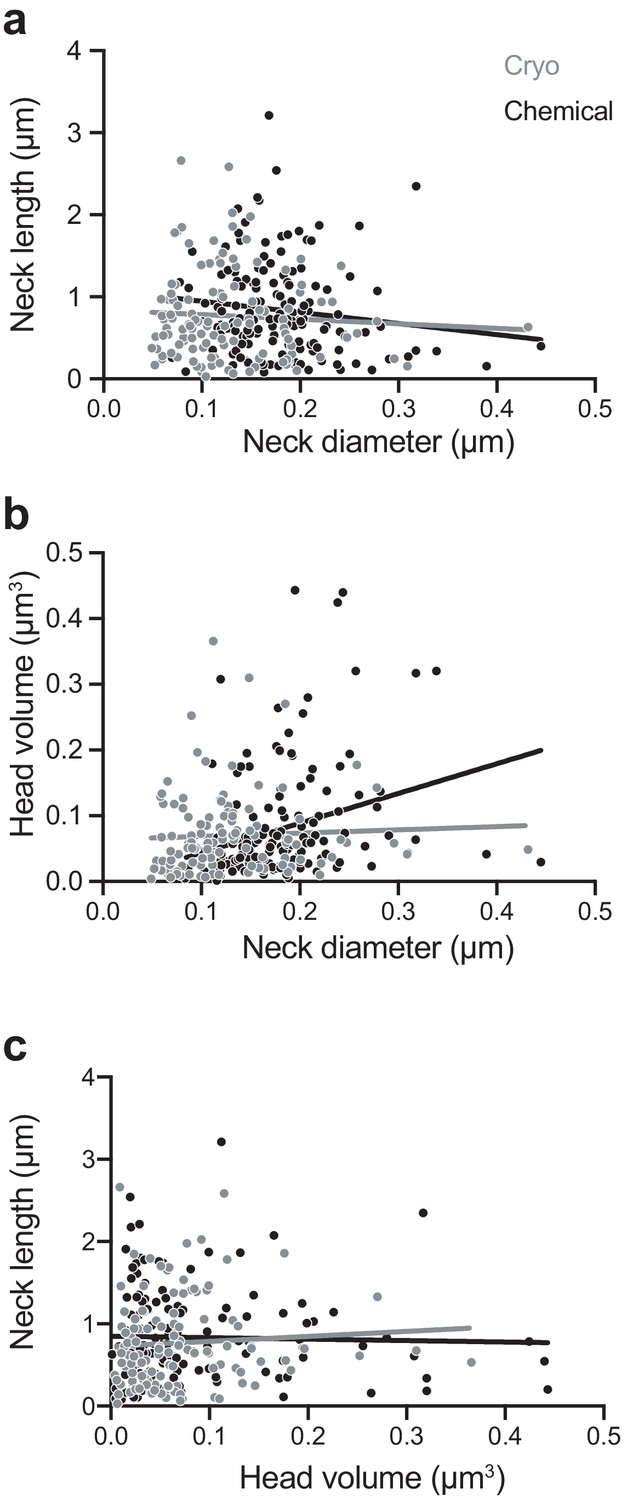
Chemically fixed, but not cryo-fixed, spines show a correlation between neck width and head volume.
(A) Correlation between neck diameter and neck length for cryo-fixed spines (Spearman r = −0.020, p=0.83, n = 116 spines, N = 5 mice) and chemically fixed spines (Spearman r = −0.155, p=0.059, n = 150, N = 3 mice). (B) Correlation between neck diameter and head volume; (cryo fixed; r = 0.145, p=0.121; chemically fixed; r = 0.358, p<0.0001, Spearman). (C) Correlation between head volume and neck length; cryo fixed; r = 0.124, p=0.184, chemically fixed; r = 0.0441, p=0.592.
-
Figure 3—source data 1
Spine parameter data used in Figure 3.
- https://cdn.elifesciences.org/articles/56384/elife-56384-fig3-data1-v2.xlsx
Figure 4
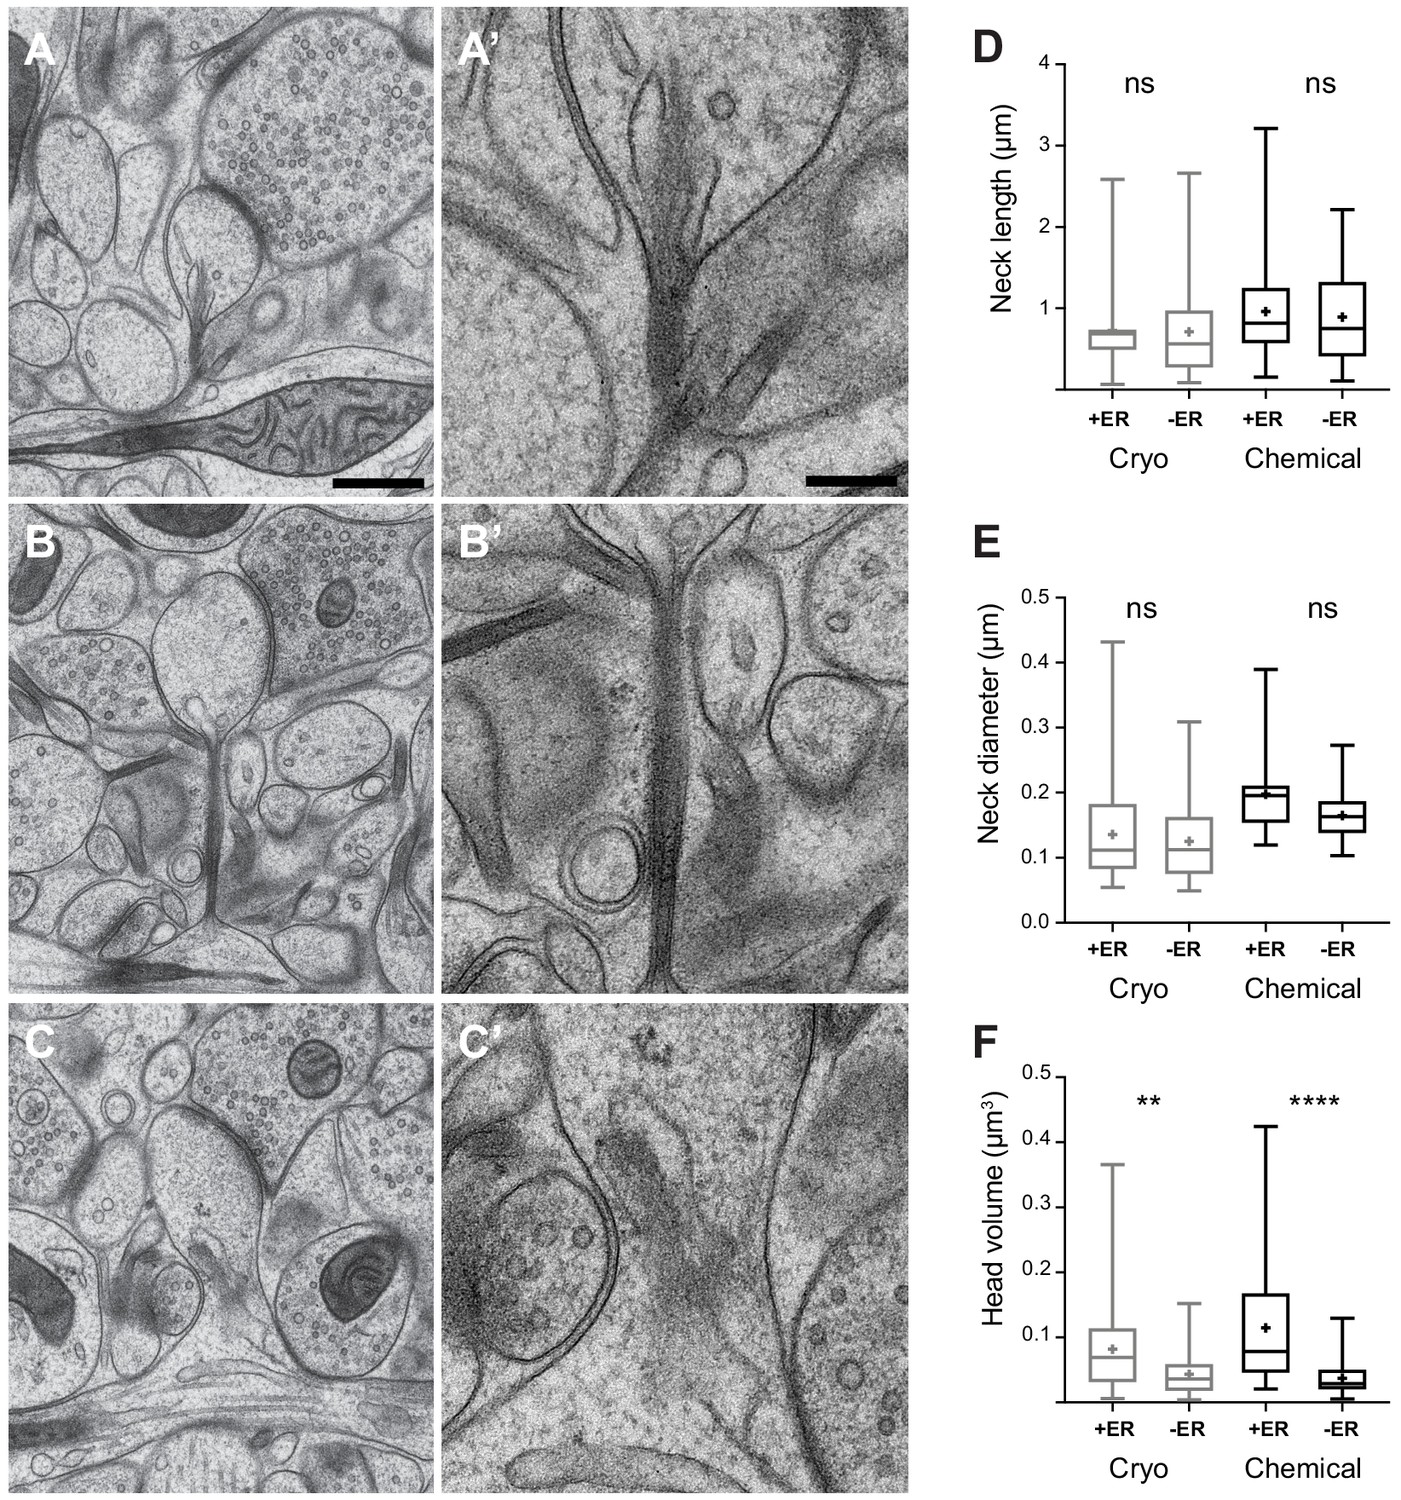
Dendritic spine geometry and the presence of membranes in the spine neck.
(A, B, C) show examples of cryo-fixed spines, and higher magnification views of their necks (A’, B’, C’). (D) Spine neck length and, (E) spine neck diameter were not significantly different between spines with (+ER) and those without (-ER) membranes in the neck (spine neck length: cryo-fixed p=1.0, chemical fixation p=0.95; spine diameter: cryo fixation p=0.81, chemical fixation, p=0.08; Tukey’s multiple comparison n = 98 cryo-fixed spines, n = 75 chemically fixed spines). (F) Spine head volume was larger in spines with membranes in the neck (cryo fixation p=0.007; chemical fixation p<0.0001; Tukey’s multiple comparison). Box plots showing median, interquartile range, minimum, and maximum values, and mean (cross). Each group is divided according to whether or not membranes were present in the spine neck (+ER, or -ER). Scale bar in A is 500 nm and in A’ 200 nm.
-
Figure 4—source data 1
Spine parameter data used in Figure 4.
- https://cdn.elifesciences.org/articles/56384/elife-56384-fig4-data1-v2.xlsx
Figure 5
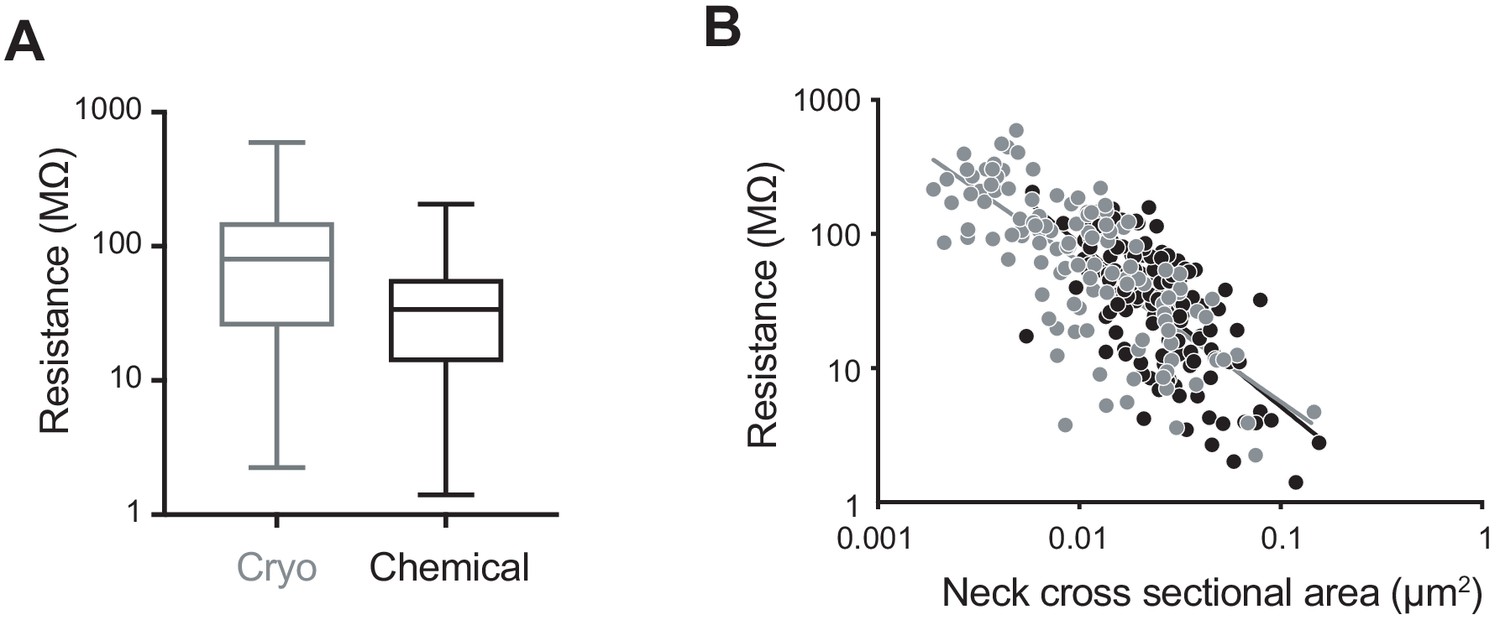
Computed spine neck resistances are higher in cryo-fixed cortex compared to chemically fixed cortex.
(A) Dendritic spine neck resistances were calculated with resistivity constant of 109 (Ω cm) for cryo-fixed and chemically fixed cortex (cryo-fixed spines n = 116 spines, N = 5 mice; chemically fixed spines n = 150 spines, N = 3 mice). Cryo-fixed spines have higher resistance, box plots showing median, range, and distribution of resistances (p<0.0001, unpaired, Kolmogorov-Smirnov test). (B) Correlation between neck cross-sectional area and resistance (cryo fixed, r = −0.74, p<0.0001; chemical fixation, r = −0.64, p<0.0001).
-
Figure 5—source data 1
Spine parameter data used in Figure 5.
- https://cdn.elifesciences.org/articles/56384/elife-56384-fig5-data1-v2.xlsx
Additional files
Download links
A two-part list of links to download the article, or parts of the article, in various formats.
Downloads (link to download the article as PDF)
Open citations (links to open the citations from this article in various online reference manager services)
Cite this article (links to download the citations from this article in formats compatible with various reference manager tools)
Ultrastructural comparison of dendritic spine morphology preserved with cryo and chemical fixation
eLife 9:e56384.
https://doi.org/10.7554/eLife.56384


