Imaging: The many facets of brain aging
Applying big-data analytic techniques to brain images from 18,707 individuals is shedding light on the influence of aging on the brain.
- Umeå center for Functional Brain Imaging, Umeå University, Sweden
- Umeå University, Sweden
- Department of Radiation Sciences, Umeå University, Sweden
We are not all equal when it comes to brain aging: while some people manage to maintain well-preserved cognitive function into old age, others do not (Nyberg et al., 2012). Brain-imaging studies have attempted to capture brain aging by exploring age-related changes to specific structures and different kinds of brain tissue (Good et al., 2001; Walhovd et al., 2005). But a more recent approach has been to use one or more brain-imaging techniques to define a global, single brain-age for each individual (Franke et al., 2010). This estimate is then used to derive a measure called brain-age delta, which represents the gap between the age expected from the brain status and the actual age of the individual. Now, in eLife, Stephen Smith (University of Oxford) and colleagues report a refined brain-age approach that might better represent how aging affects the biological processes of the brain (Smith et al., 2020).
From a sample of 21,407 participants of the UK Biobank study, Smith et al. reported the data of 18,707 individuals over the age of 45 whose brains have been imaged using the same MRI and fMRI protocols. The team then generated 3913 imaging-derived phenotypes: each of the phenotypes represents a different aspect of brain structure or function, such as how specific regions are connected or the structure of certain cortical areas (Figure 1A).
Figure 1
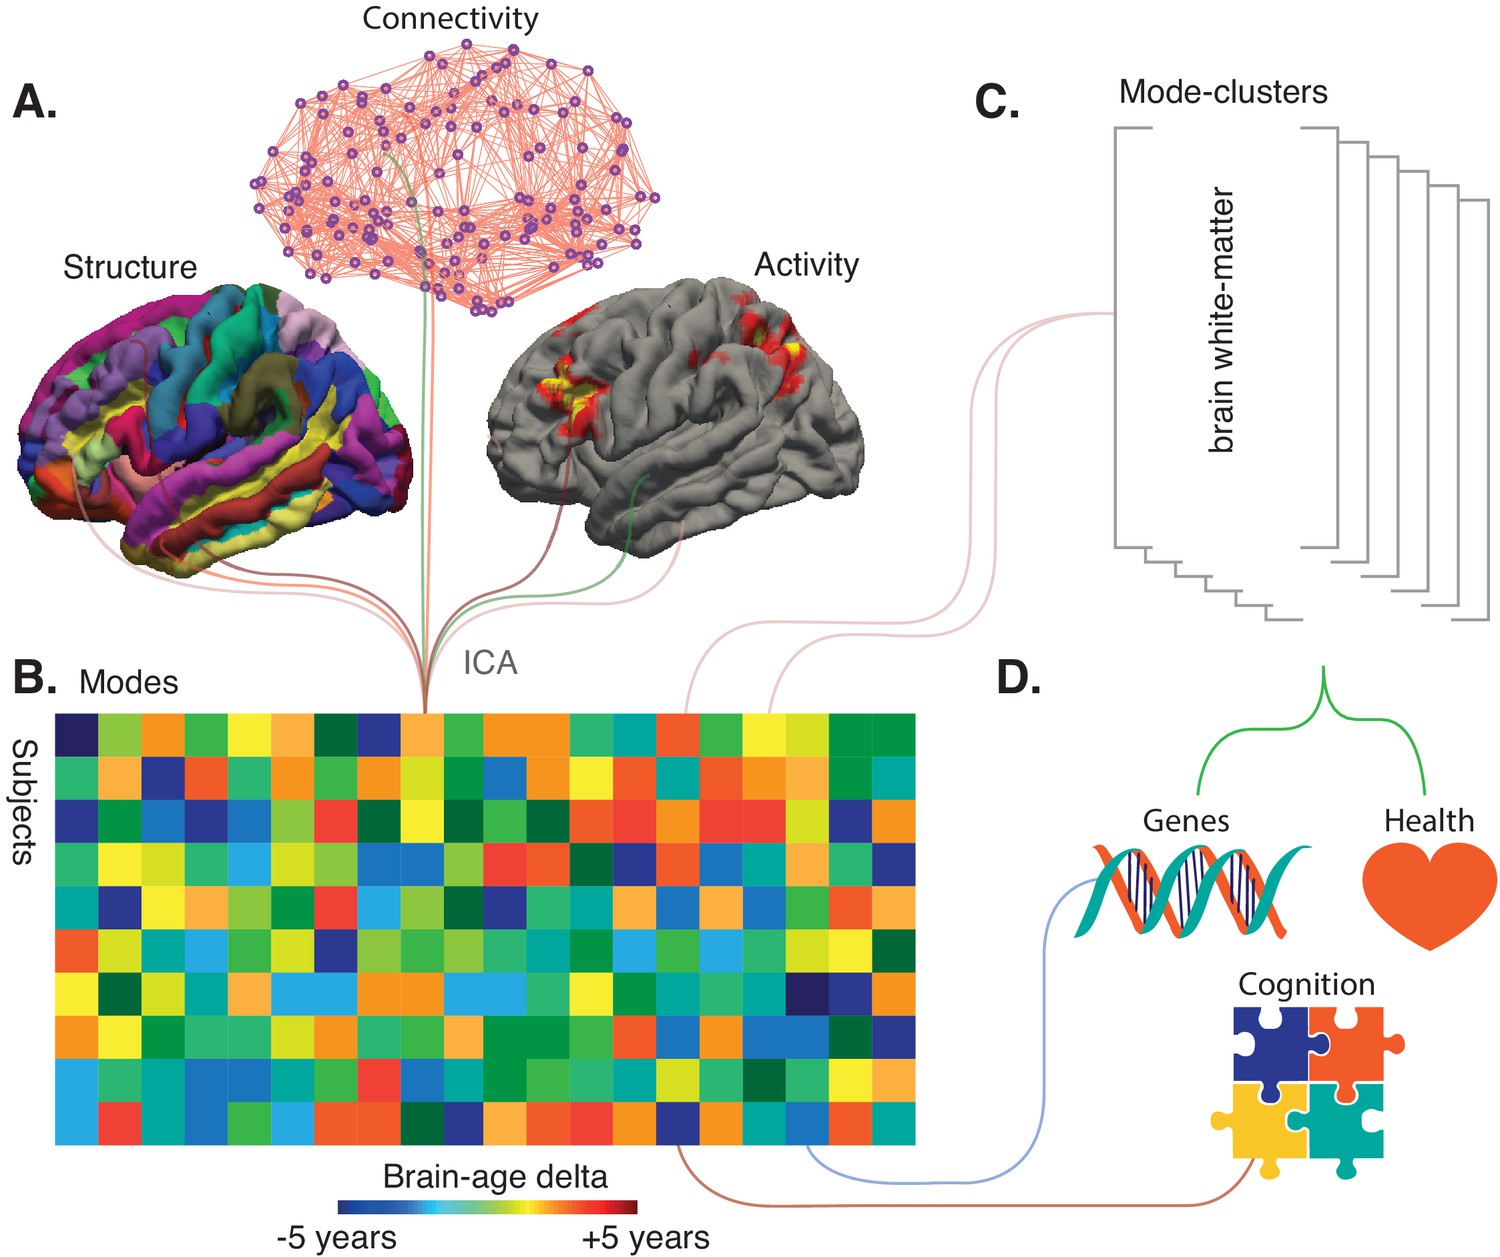
Refining big-data analytic approaches to reveal the many facets of brain aging.
(A) Smith et al. used a technique called independent component analysis (ICA) to analyze MRI and fMRI data on brain structure, connectivity or activity from more than 18,000 individuals over the age of 45. This enabled them to identify 62 modes. Most of these modes co-varied with age across the sample, thus potentially reflecting biological processes affected by aging. (B) Schematic matrix in which each row represents an individual and each column represents a mode. The color scale represents the brain-age delta, the difference between the actual age of the individual and what age would have been expected for this person given the value of the mode. (C) The 62 modes can be grouped into six mode-clusters, such as one which captures the microstructure of brain white-matter. (D) Smith et al. were able to relate the brain-age deltas for specific modes and the mode-clusters to various phenotypes (for instance health, genetics and cognition).
Further computational analyses were conducted to combine the phenotypes that vary together with age across subjects. In total, 62 of these groups (termed ‘modes’) were established, each potentially representing a biological process affected by aging: for instance, changes in white-matter microstructure could reflect degeneration of axons. These modes were then weighted to describe how strongly each is present in an individual.
The next step was to try to use the modes to assess how an individual would fare in comparison to others, and to examine whether these new measures could correlate with genetic factors. The modes were first grouped to create an ‘all-in-one’ brain-age delta for each participant, a measure that turned out not to be associated with a genetic signature. Next, each specific mode was used to create a brain-age delta that assesses the gap between the participant and the population for this particular mode (Figure 1B). Most of these ‘mode-specific’ brain-age deltas turned out to be associated with the genetic makeup of the individuals. This demonstrates that superimposing distinct brain aging processes in an all-in-one brain-age may obscure biological relations.
While the individual modes might be related to specific biological processes, Smith et al. used data-driven optimization to group the 62 modes into coarser ‘mode-clusters’ (Figure 1C). The six clusters that emerged helped to understand larger patterns of age-related brain changes, and how these relate to other ‘non-imaging’ variables such as health parameters. The mode-cluster that was associated with the greatest aging effect, for example, linked cognitive processing speed with brain patterns like ventricular volume and white-matter microstructure. Diabetes, hypertension, and smoking were all risk factors distributed across mode-clusters, suggesting that different aspects of vascular health influence brain aging through different biological processes.
This work highlights the challenge in determining the optimal balance between integration and diversification in studies of brain aging, where a single brain-age is at the extreme end of integration. An argument in favor of diversification is the fact that, unlike the all-in-one brain-age delta, deltas defined from modes and mode-clusters were associated with genetics (Figure 1D). But what will the optimal ‘unit’ of brain aging turn out to be in the end? Should it be six (as the mode-clusters suggest), 62 (from the analyses of the 3913 imaging-derived phenotypes), or another figure altogether? The relevant number will depend on the type of imaging used in a specific dataset – for example, if it includes both MRI and PET images or MRI alone. Unique brain-age deltas may be revealing a gap between chronological and actual brain age – thus stressing the vast heterogeneity in the older population – but the work by Smith et al. represents the next generation of analytic methods that can help to decode the complexity of brain aging. In the future, genetics and cognition may even be considered in the early stages of analysis, when distinct modes are initially computed.
As imaging data continue to be gathered at a large scale, it is becoming increasingly relevant to examine the complex intrinsic structure of data collected through different imaging methods (Bzdok and Yeo, 2017). Techniques such as the ones used by Smith et al. reduce complexity while respecting the patterns created by actual biological processes, thereby limiting the dilution and potential loss of valuable information. As big-data approaches continue to be refined, they will be able to detect biological processes from brain images, and ultimately these mechanisms might be linked to models of brain aging established at the cellular level.
References
-
Memory aging and brain maintenanceTrends in Cognitive Sciences 16:292–305.https://doi.org/10.1016/j.tics.2012.04.005
-
Effects of age on volumes of cortex, white matter and subcortical structuresNeurobiology of Aging 26:1261–1270.https://doi.org/10.1016/j.neurobiolaging.2005.05.020
Article and author information
Author details
Publication history
- Version of Record published: April 16, 2020 (version 1)
Copyright
© 2020, Nyberg and Wåhlin
This article is distributed under the terms of the Creative Commons Attribution License, which permits unrestricted use and redistribution provided that the original author and source are credited.
Metrics
-
- 1,543
- Page views
-
- 205
- Downloads
-
- 3
- Citations
Article citation count generated by polling the highest count across the following sources: Crossref, PubMed Central, Scopus.
Download links
A two-part list of links to download the article, or parts of the article, in various formats.
Downloads (link to download the article as PDF)
Open citations (links to open the citations from this article in various online reference manager services)
Cite this article (links to download the citations from this article in formats compatible with various reference manager tools)
Imaging: The many facets of brain aging
eLife 9:e56640.
https://doi.org/10.7554/eLife.56640
Further reading
-
- Neuroscience
The presence of global synchronization of vasomotion induced by oscillating visual stimuli was identified in the mouse brain. Endogenous autofluorescence was used and the vessel ‘shadow’ was quantified to evaluate the magnitude of the frequency-locked vasomotion. This method allows vasomotion to be easily quantified in non-transgenic wild-type mice using either the wide-field macro-zoom microscopy or the deep-brain fiber photometry methods. Vertical stripes horizontally oscillating at a low temporal frequency (0.25 Hz) were presented to the awake mouse, and oscillatory vasomotion locked to the temporal frequency of the visual stimulation was induced not only in the primary visual cortex but across a wide surface area of the cortex and the cerebellum. The visually induced vasomotion adapted to a wide range of stimulation parameters. Repeated trials of the visual stimulus presentations resulted in the plastic entrainment of vasomotion. Horizontally oscillating visual stimulus is known to induce horizontal optokinetic response (HOKR). The amplitude of the eye movement is known to increase with repeated training sessions, and the flocculus region of the cerebellum is known to be essential for this learning to occur. Here, we show a strong correlation between the average HOKR performance gain and the vasomotion entrainment magnitude in the cerebellar flocculus. Therefore, the plasticity of vasomotion and neuronal circuits appeared to occur in parallel. Efficient energy delivery by the entrained vasomotion may contribute to meeting the energy demand for increased coordinated neuronal activity and the subsequent neuronal circuit reorganization.
-
- Medicine
- Neuroscience
Background:
Ketamine has emerged as one of the most promising therapies for treatment-resistant depression. However, inter-individual variability in response to ketamine is still not well understood and it is unclear how ketamine’s molecular mechanisms connect to its neural and behavioral effects.
Methods:
We conducted a single-blind placebo-controlled study, with participants blinded to their treatment condition. 40 healthy participants received acute ketamine (initial bolus 0.23 mg/kg, continuous infusion 0.58 mg/kg/hr). We quantified resting-state functional connectivity via data-driven global brain connectivity and related it to individual ketamine-induced symptom variation and cortical gene expression targets.
Results:
We found that: (i) both the neural and behavioral effects of acute ketamine are multi-dimensional, reflecting robust inter-individual variability; (ii) ketamine’s data-driven principal neural gradient effect matched somatostatin (SST) and parvalbumin (PVALB) cortical gene expression patterns in humans, while the mean effect did not; and (iii) behavioral data-driven individual symptom variation mapped onto distinct neural gradients of ketamine, which were resolvable at the single-subject level.
Conclusions:
These results highlight the importance of considering individual behavioral and neural variation in response to ketamine. They also have implications for the development of individually precise pharmacological biomarkers for treatment selection in psychiatry.
Funding:
This study was supported by NIH grants DP5OD012109-01 (A.A.), 1U01MH121766 (A.A.), R01MH112746 (J.D.M.), 5R01MH112189 (A.A.), 5R01MH108590 (A.A.), NIAAA grant 2P50AA012870-11 (A.A.); NSF NeuroNex grant 2015276 (J.D.M.); Brain and Behavior Research Foundation Young Investigator Award (A.A.); SFARI Pilot Award (J.D.M., A.A.); Heffter Research Institute (Grant No. 1–190420) (FXV, KHP); Swiss Neuromatrix Foundation (Grant No. 2016–0111) (FXV, KHP); Swiss National Science Foundation under the framework of Neuron Cofund (Grant No. 01EW1908) (KHP); Usona Institute (2015 – 2056) (FXV).
Clinical trial number:


