Meta-Research: COVID-19 medical papers have fewer women first authors than expected
- Danish Centre for Studies in Research and Research Policy, Department of Political Science, Aarhus University, Denmark
- Department of Sociology, University of Copenhagen, Denmark
- Department of Radiation Oncology, Sidney Kimmel Cancer Center, Thomas Jefferson University, United States
- Department of Emergency Medicine, Thomas Jefferson University, United States
- Department of Radiation Oncology, University of Michigan, United States
- Center for Bioethics and Social Sciences in Medicine, University of Michigan, United States
Figures
Figure 1
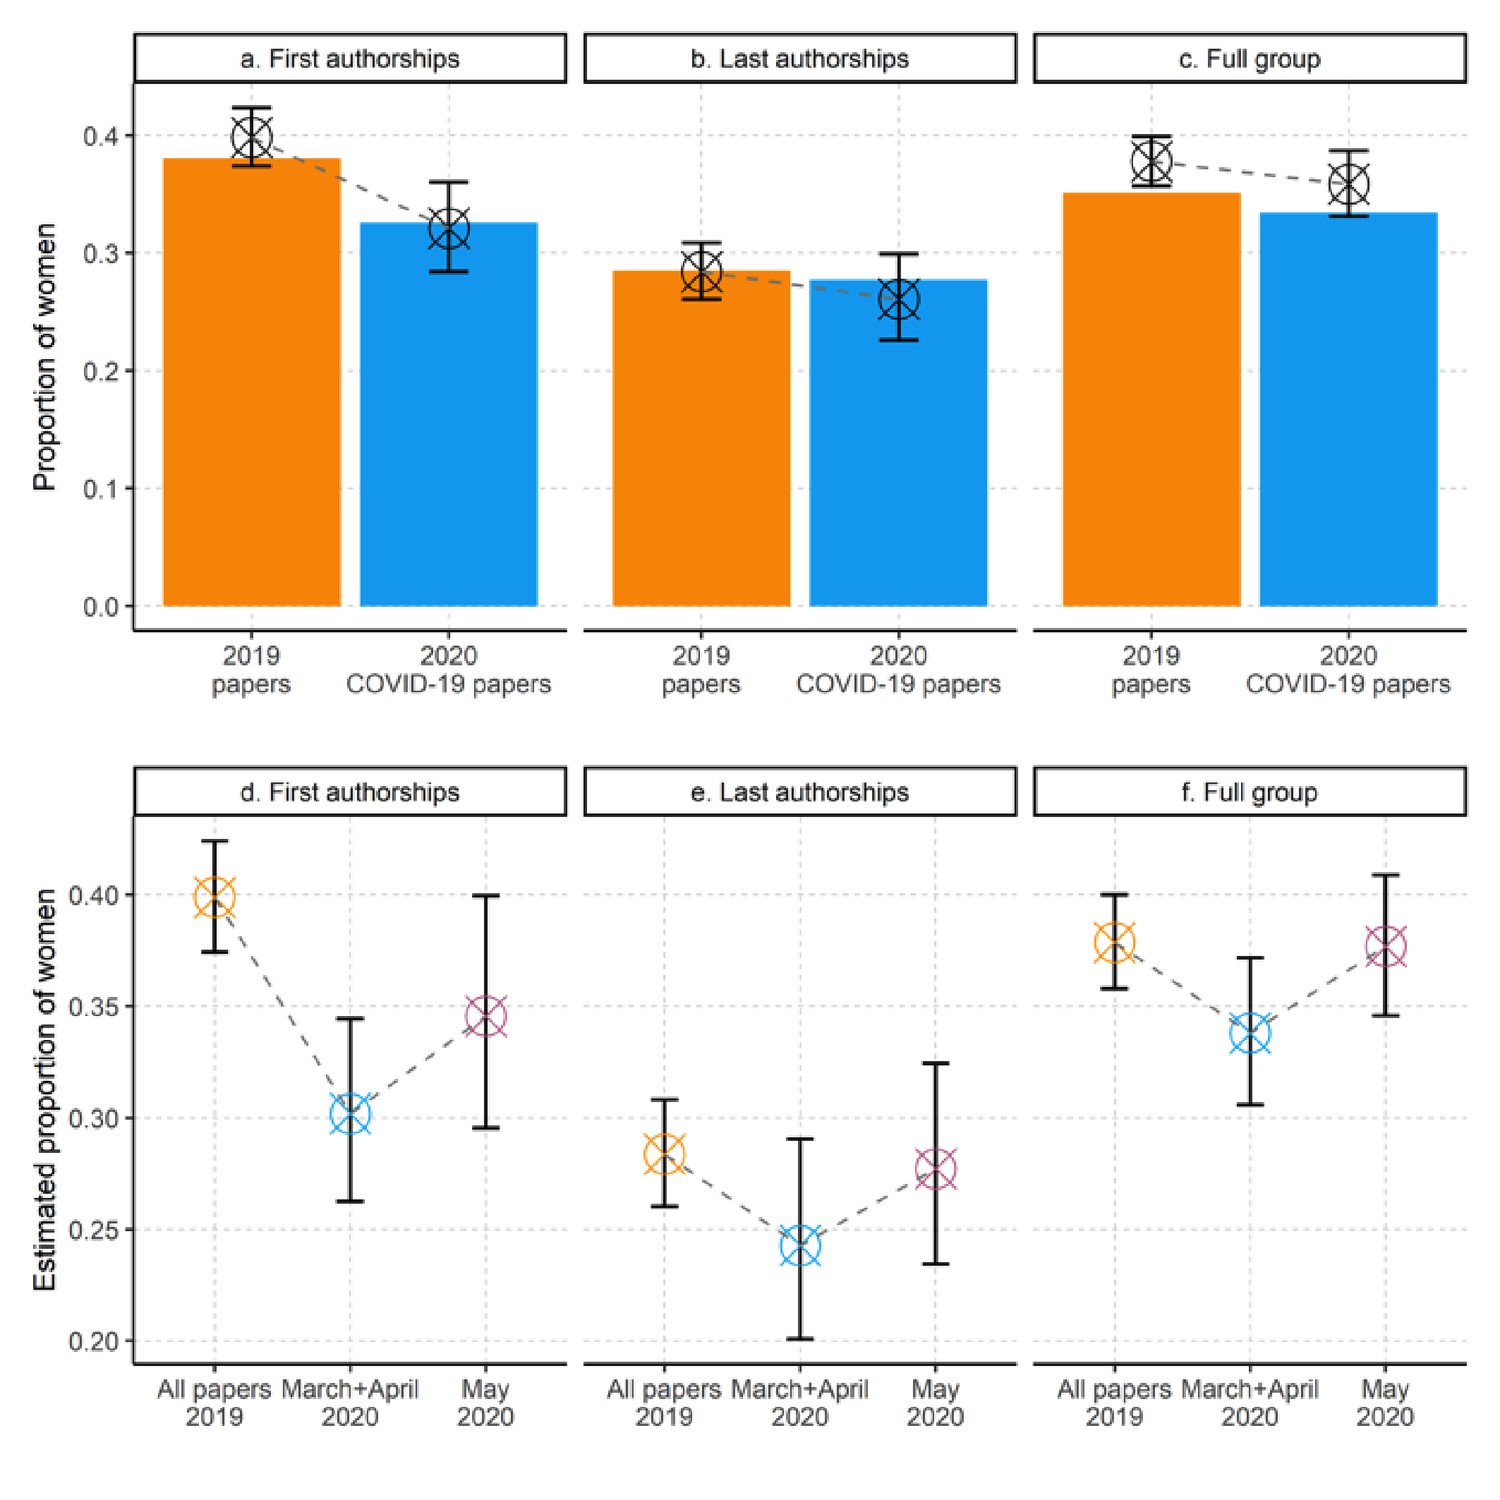
COVID-19 papers have fewer female authors than papers from 2019 published in the same journals.
(a–c) Observed (bars) and estimated (crosses and error-bars) proportions of women among authors of 1,893 US papers on COVID-19 and 85,373 papers published in the same journals in 2019. The bars show differences in the observed proportions of women in the first-author position (a), the last-author position (b), and any author position (c), for papers published in 2020 COVID-19 papers (blue bars) versus papers from the same journals in 2019 (orange bars). All three panels suggest a decrease in the observed proportion of women. The crosses and error bars show the adjusted means and 95% confidence intervals (CIs) derived from mixed regression models with scientific journal as random effect parameter. (d–f) Adjusted means (crosses) and 95% CIs (error bars) derived from mixed regression models for the proportion of women in the first-author position (d), last-author position (e) and any author position (f), for papers published in 2019 (left-most crosses and error bars in each panel), papers published in March and April 2020 (middle), and papers published in May 2020 (right). For all models, there is a drop in March and April, followed by a partial resurgence in May. However, the uncertainty of the estimates make these comparisons inconclusive. See Supplementary file 1 for details of the mixed regression models used to estimate adjusted means and 95% CIs.
Tables
Table 1
Proportion of women authors on 2019 papers and COVID-19 papers by specialty.
Number of observations, N, and proportion of women by author list position for journals grouped by their specialty. The grouped columns show results by journal specialty for COVID papers published in 2020 (four rightmost columns) in contrast to papers from the same journals in 2019. Only papers with a US-based first and/or last author and clear gender for first and last author are included.
| Journal specialty | 2019 papers | COVID-19 papers | ||||||
|---|---|---|---|---|---|---|---|---|
| N | Proportion of women | N | Proportion of women | |||||
| First author | Full group | Last author | First author | Full group | Last author | |||
| Dermatology | 1811 | 0.44 | 0.42 | 0.37 | 72 | 0.46 | 0.41 | 0.31 |
| Emergency medicine | 1283 | 0.32 | 0.30 | 0.22 | 54 | 0.31 | 0.25 | 0.13 |
| High impact general medicine | 7142 | 0.41 | 0.42 | 0.39 | 194 | 0.31 | 0.37 | 0.35 |
| Infectious diseases | 1404 | 0.45 | 0.42 | 0.34 | 44 | 0.20 | 0.32 | 0.34 |
| Internal medicine | 19,980 | 0.36 | 0.33 | 0.25 | 484 | 0.33 | 0.32 | 0.24 |
| Other basic sciences | 6975 | 0.42 | 0.38 | 0.29 | 135 | 0.33 | 0.34 | 0.28 |
| Other clinical sciences | 21,869 | 0.40 | 0.37 | 0.31 | 429 | 0.38 | 0.38 | 0.35 |
| Otolaryngology | 1063 | 0.32 | 0.29 | 0.21 | 106 | 0.28 | 0.29 | 0.24 |
| Pathology | 869 | 0.46 | 0.43 | 0.32 | 66 | 0.27 | 0.37 | 0.30 |
| Public health | 11,015 | 0.47 | 0.41 | 0.35 | 99 | 0.33 | 0.41 | 0.37 |
| Radiology | 2262 | 0.37 | 0.33 | 0.27 | 60 | 0.25 | 0.28 | 0.17 |
| Surgery | 9700 | 0.21 | 0.20 | 0.13 | 186 | 0.26 | 0.22 | 0.16 |
Additional files
-
Supplementary file 1
Details of the mixed regression models used to estimate the adjusted means and 95% confidence limits shown in Figure 1.
- https://cdn.elifesciences.org/articles/58807/elife-58807-supp1-v2.docx
-
Transparent reporting form
- https://cdn.elifesciences.org/articles/58807/elife-58807-transrepform-v2.pdf
Download links
A two-part list of links to download the article, or parts of the article, in various formats.
Downloads (link to download the article as PDF)
Open citations (links to open the citations from this article in various online reference manager services)
Cite this article (links to download the citations from this article in formats compatible with various reference manager tools)
Meta-Research: COVID-19 medical papers have fewer women first authors than expected
eLife 9:e58807.
https://doi.org/10.7554/eLife.58807


