Multi-contrast anatomical subcortical structures parcellation
- Integrative Model-based Cognitive Neuroscience research unit, University of Amsterdam, Netherlands
- Max-Planck Institute for Human Cognitive and Brain Sciences, Germany
- Psychology Department, Utrecht University, Netherlands
- Faculty of Archaeology, Leiden University, Netherlands
Figures
Figure 1
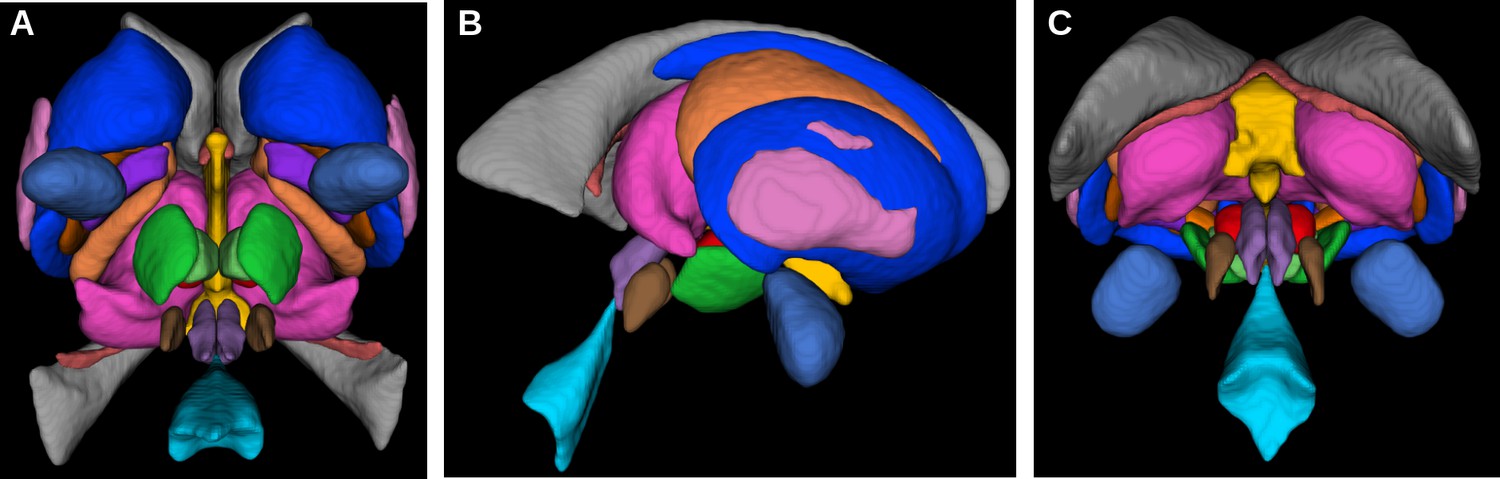
The 17 subcortical structures currently included in the parcellation algorithm in axial (A), sagittal (B), and coronal (C) views.
Figure 2
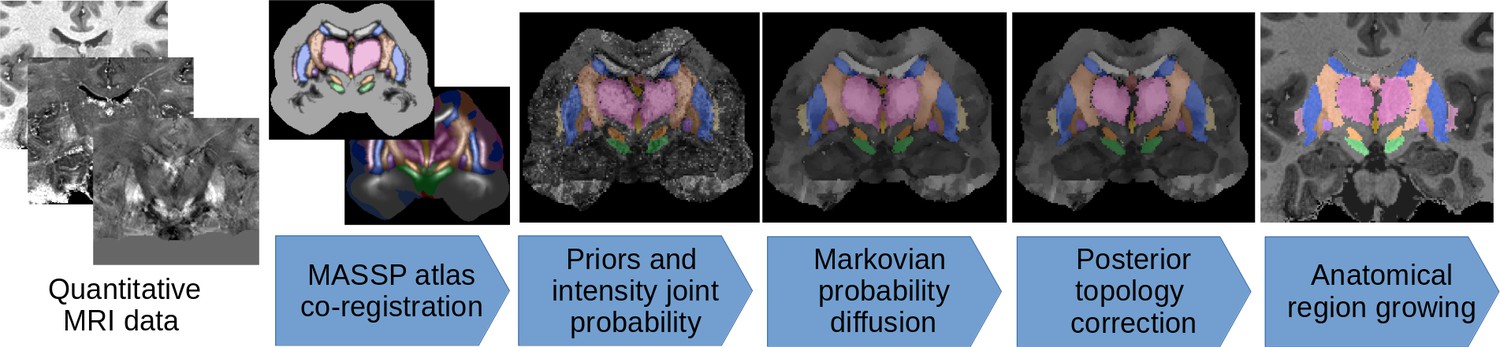
The MASSP parcellation pipeline.
Atlas priors for interfaces between structures are combined to the MRI data, regularized via probability diffusion and topology correction, and the final structure posteriors are jointly estimated by region growing.
Figure 3
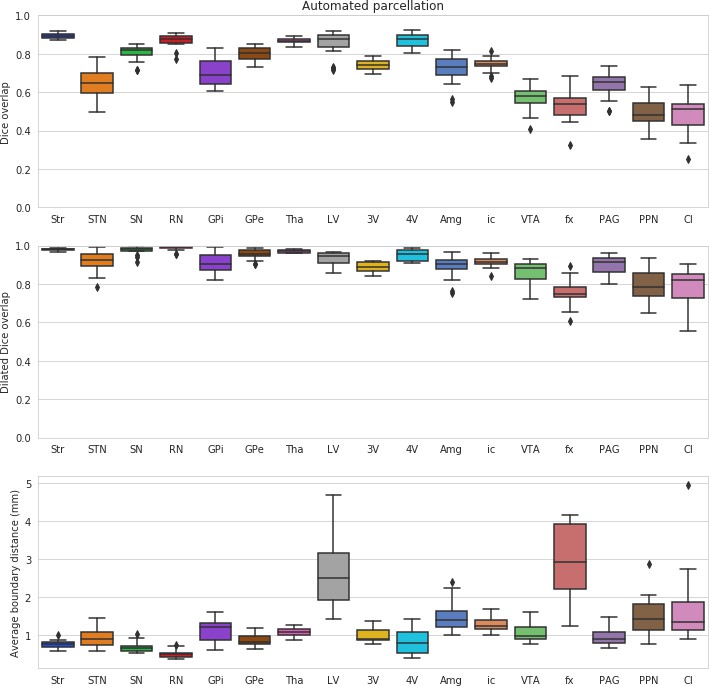
Leave-one-out validation of the structures parcellated by MASSP, compared to the human rater with most neuroanatomical expertise.
Scores for the left and right side are computed separately and then combined into box-and-whisker plots.
Figure 4
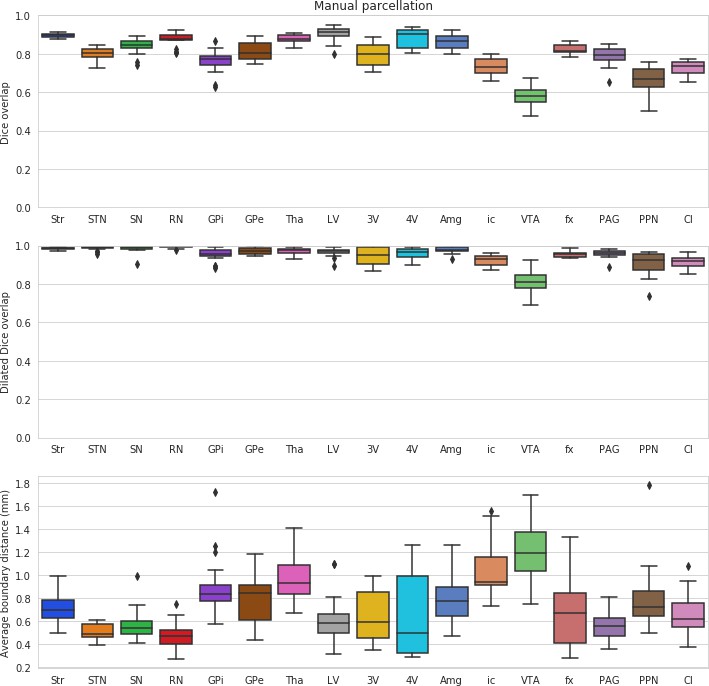
Inter-rater variability for the human expert raters.
Scores for the left and right side are computed separately and then combined into box-and-whisker plots.
Figure 5
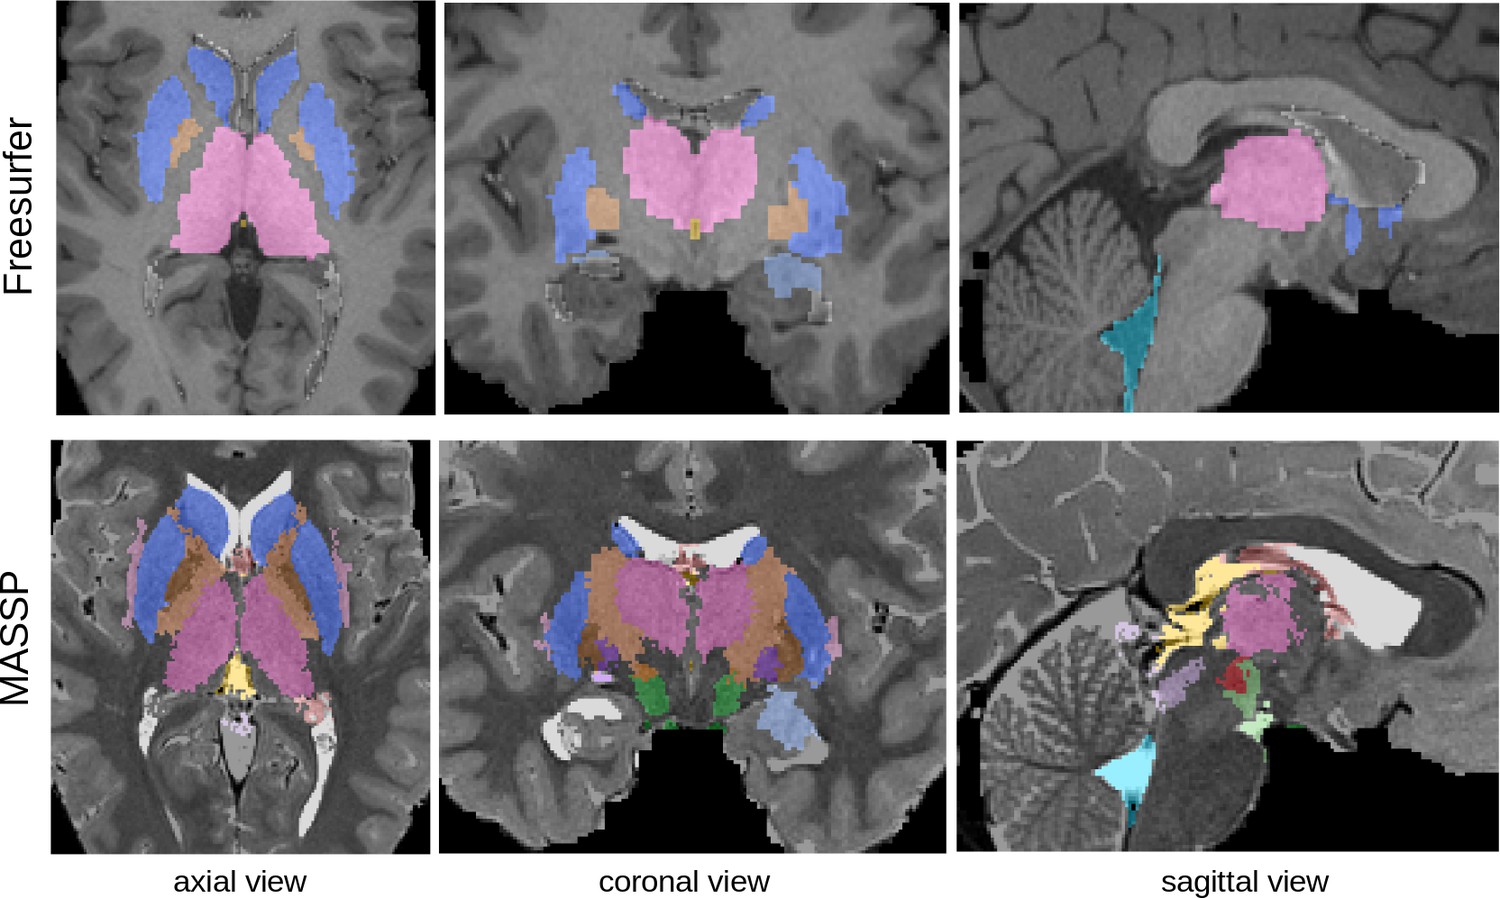
Parcellation with Freesurfer (top, on T1w image) and MASSP (bottom, on T2w image) on Human Connectome Project data.
MASSP priors were not derived from the contrasts, but transferred via a spatial mapping of the quantitative MRI intensities from AHEAD subjects.
Figure 6

MASSP parcellation scores as a function of increasing number of subjects included in the atlas.
Scores for the left and right side are computed separately and then combined into box-and-whisker plots.
Figure 7
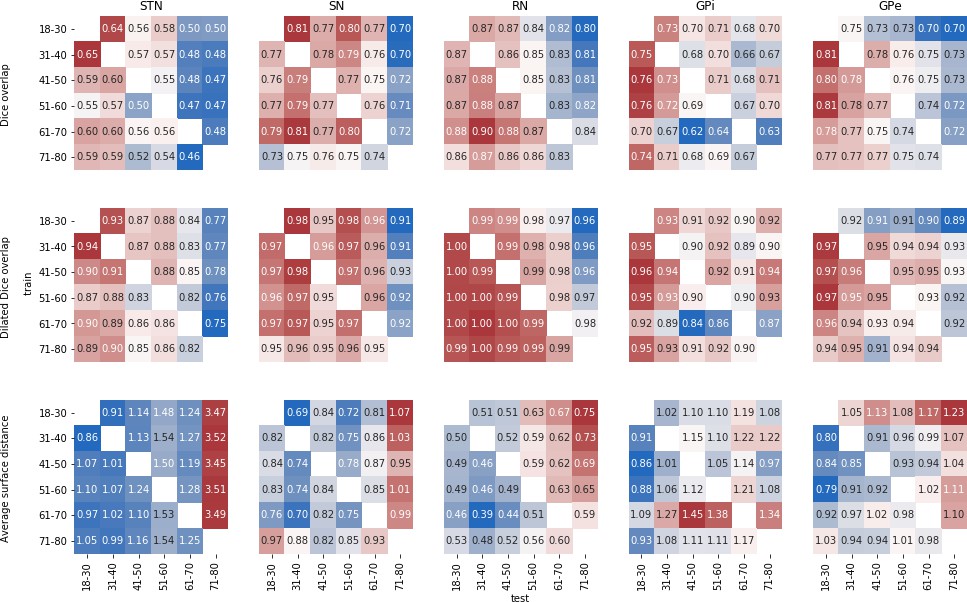
MASSP parcellation scores over the lifespan.
Each matrix show the average Dice overlap (top), dilated Dice overlap (middle), and average surface distance (bottom) for using one age group as prior (’train’) to parcellate another age group (’test’).
Figure 8

Regression of volume (log scale), structure thickness, R1, R2*, and QSM MRI parameters estimated using manual delineations versus MASSP automated parcellations.
Circles show individual data points, linear regression is indicated by a straight line, and 95% confidence interval is given as the shaded area. Pearson correlation coefficients are indicated when significant (p-value<0.01).
Figure 9
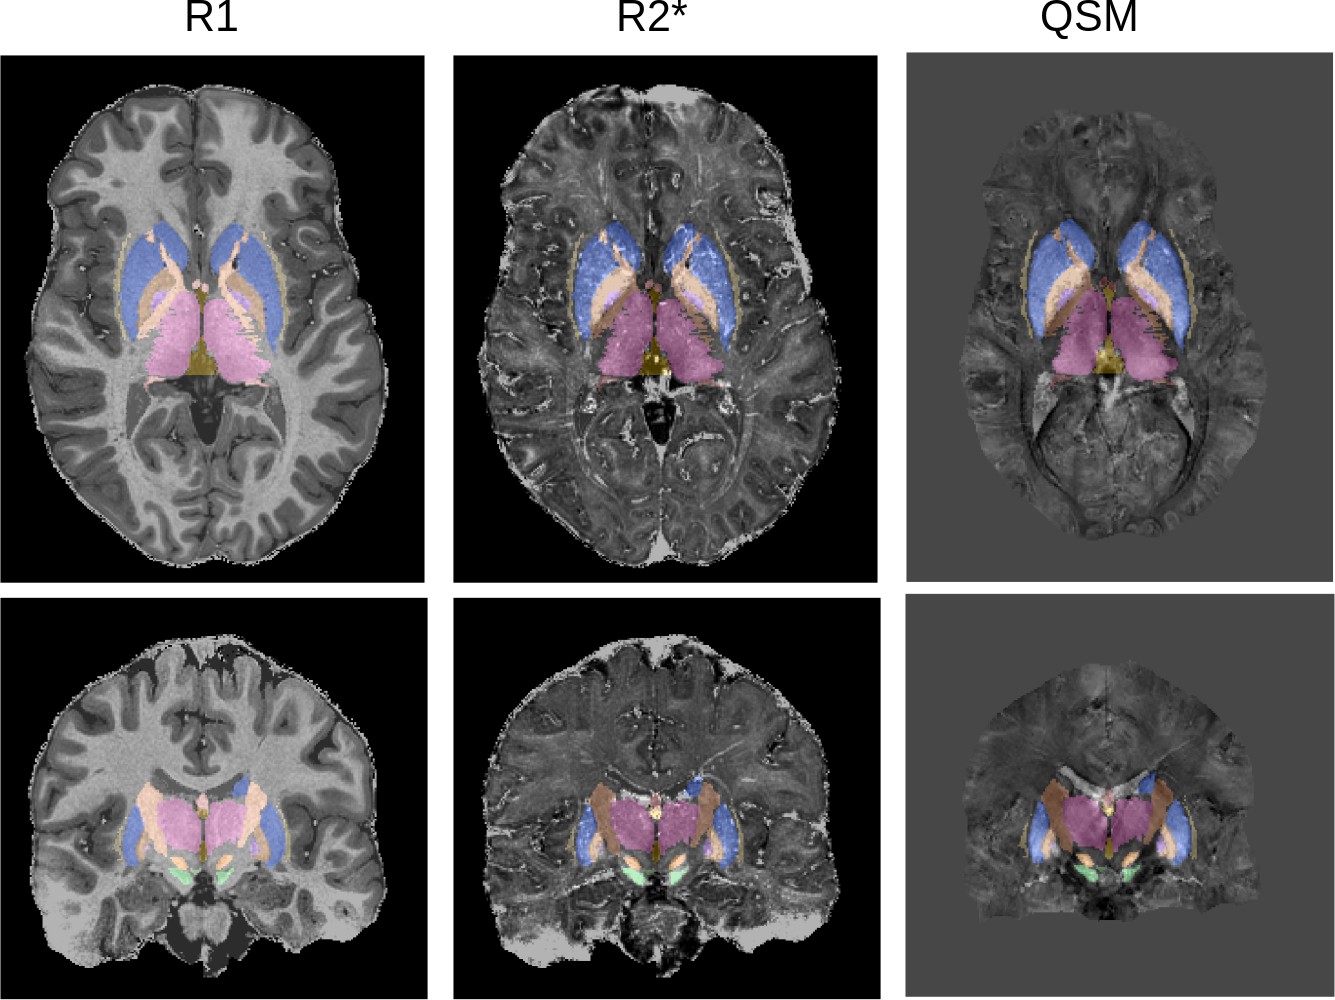
MP2RAGEME maps and delineations: quantitative R1 (left), quantitative R2* (middle), QSM (right).
Manual delineations for the 17 structures of interest are overlaid on all images.
Figure 10

Anatomical interface (A) and skeleton (B) priors derived from the 10 manually delineated subjects.
Figure 11
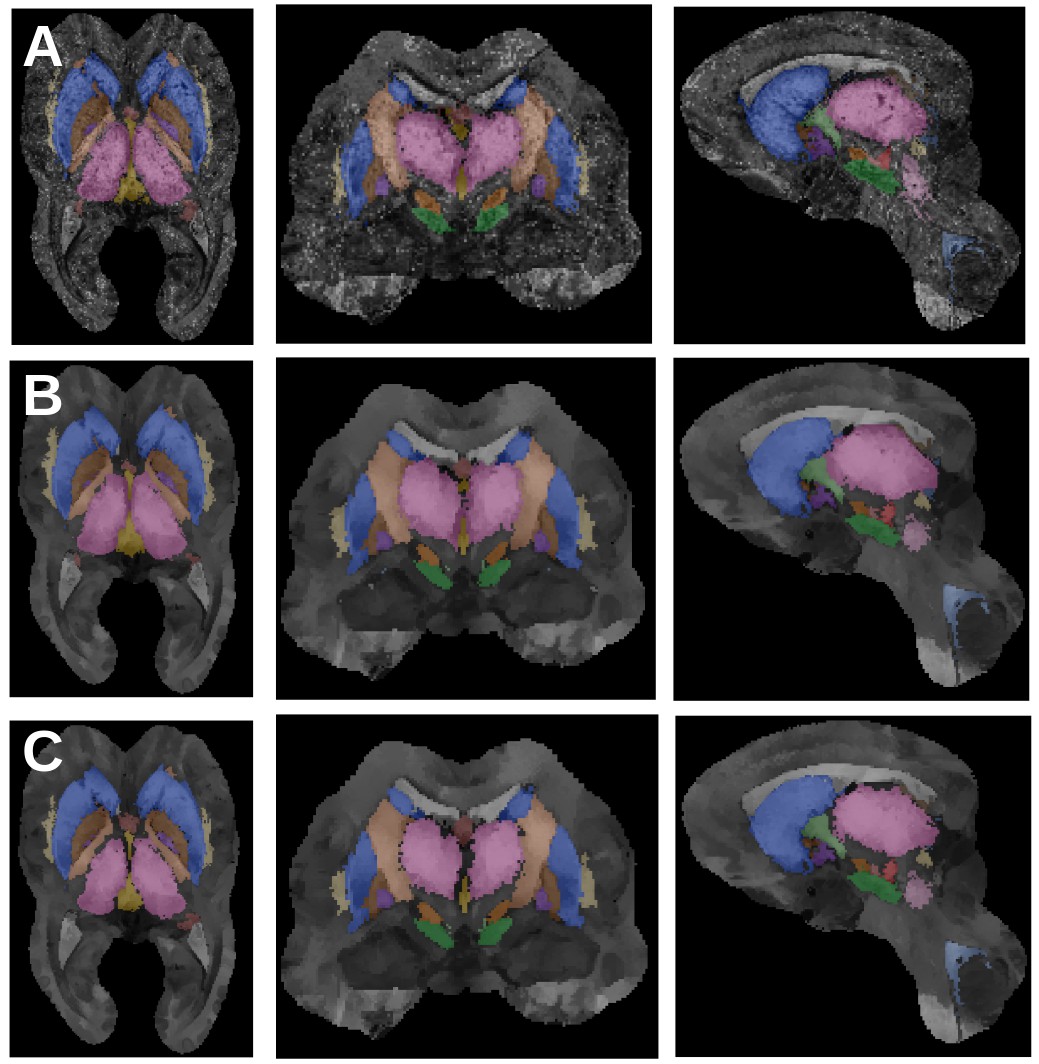
Successive parcellation results: (A) voxel-wise posteriors and parcellation, (B) diffused posteriors and parcellation, (C) topology-corrected posteriors and final region-growing parcellation.
Tables
Table 1
Mean overlap and distance measures for the leave-one-out validation.
| Str | STN | SN | RN | GPi | GPe | Tha | LV | 3V | 4V | Amg | ic | VTA | fx | PAG | PPN | Cl | |
|---|---|---|---|---|---|---|---|---|---|---|---|---|---|---|---|---|---|
| Dice overlap | |||||||||||||||||
| MASSP | 0.893 | 0.648 | 0.805 | 0.870 | 0.702 | 0.800 | 0.867 | 0.849 | 0.741 | 0.869 | 0.723 | 0.745 | 0.570 | 0.527 | 0.641 | 0.496 | 0.485 |
| Manual | 0.897 | 0.800 | 0.841 | 0.875 | 0.762 | 0.813 | 0.877 | 0.907 | 0.797 | 0.882 | 0.866 | 0.732 | 0.574 | 0.823 | 0.791 | 0.665 | 0.727 |
| Ratio | 0.995 | 0.811 | 0.957 | 0.996 | 0.925 | 0.987 | 0.989 | 0.936 | 0.936 | 0.988 | 0.836 | 1.020 | 0.994 | 0.641 | 0.814 | 0.754 | 0.664 |
| Dilated overlap | |||||||||||||||||
| MASSP | 0.982 | 0.919 | 0.977 | 0.991 | 0.909 | 0.956 | 0.970 | 0.929 | 0.890 | 0.951 | 0.891 | 0.915 | 0.863 | 0.756 | 0.897 | 0.795 | 0.789 |
| Manual | 0.987 | 0.988 | 0.985 | 0.995 | 0.953 | 0.972 | 0.970 | 0.967 | 0.944 | 0.961 | 0.978 | 0.924 | 0.818 | 0.957 | 0.960 | 0.910 | 0.914 |
| Ratio | 0.995 | 0.930 | 0.992 | 0.995 | 0.955 | 0.984 | 1.000 | 0.961 | 0.946 | 0.991 | 0.911 | 0.992 | 1.059 | 0.790 | 0.935 | 0.879 | 0.863 |
| Average surface distance | |||||||||||||||||
| MASSP | 0.750 | 0.911 | 0.676 | 0.491 | 1.140 | 0.863 | 1.058 | 2.690 | 0.994 | 0.817 | 1.476 | 1.275 | 1.074 | 2.950 | 0.955 | 1.484 | 1.685 |
| Manual | 0.723 | 0.508 | 0.571 | 0.482 | 0.902 | 0.804 | 0.971 | 0.615 | 0.637 | 0.671 | 0.779 | 1.045 | 1.204 | 0.703 | 0.555 | 0.801 | 0.670 |
| Ratio | 0.971 | 0.590 | 0.852 | 0.996 | 0.861 | 0.943 | 0.916 | 0.277 | 0.662 | 1.020 | 0.553 | 0.834 | 1.161 | 0.287 | 0.610 | 0.619 | 0.465 |
Table 2
Comparison with multi-atlas registration, Freesurfer, and FSL FIRST.
| Str | STN | SN | RN | GPi | GPe | Tha | LV | 3V | 4V | Amg | Ic | VTA | Fx | PAG | PPN | Cl | |
|---|---|---|---|---|---|---|---|---|---|---|---|---|---|---|---|---|---|
| Dice overlap | |||||||||||||||||
| MASSP | 0.893 | 0.648 | 0.805 | 0.870 | 0.702 | 0.800 | 0.867 | 0.849 | 0.741 | 0.869 | 0.723 | 0.745 | 0.570 | 0.527 | 0.641 | 0.496 | 0.485 |
| Multi-atlas | 0.855 | 0.662 | 0.760 | 0.820 | 0.742 | 0.796 | 0.859 | 0.734 | 0.660 | 0.691 | 0.761 | 0.718 | 0.626 | 0.478 | 0.674 | 0.539 | 0.398 |
| Freesurfer | 0.876 | 0.778 | 0.838 | 0.858 | 0.430 | 0.769 | 0.692 | ||||||||||
| FSL FIRST | 0.875 | 0.813 | 0.839 | 0.653 | |||||||||||||
| Dilated overlap | |||||||||||||||||
| MASSP | 0.982 | 0.919 | 0.977 | 0.991 | 0.909 | 0.956 | 0.970 | 0.929 | 0.890 | 0.951 | 0.891 | 0.915 | 0.863 | 0.756 | 0.897 | 0.795 | 0.789 |
| Multi-atlas | 0.976 | 0.938 | 0.968 | 0.989 | 0.947 | 0.968 | 0.970 | 0.920 | 0.920 | 0.908 | 0.921 | 0.939 | 0.924 | 0.798 | 0.943 | 0.871 | 0.811 |
| Freesurfer | 0.975 | 0.922 | 0.946 | 0.974 | 0.562 | 0.911 | 0.857 | ||||||||||
| FSL FIRST | 0.976 | 0.946 | 0.950 | 0.843 | |||||||||||||
| Average surface distance | |||||||||||||||||
| MASSP | 0.750 | 0.911 | 0.676 | 0.491 | 1.140 | 0.863 | 1.058 | 2.690 | 0.994 | 0.817 | 1.476 | 1.275 | 1.074 | 2.950 | 0.955 | 1.484 | 1.685 |
| Multi-atlas | 0.961 | 0.891 | 0.858 | 0.675 | 0.992 | 0.882 | 1.083 | 1.417 | 0.932 | 1.249 | 1.359 | 1.129 | 0.813 | 1.362 | 0.794 | 1.055 | 1.273 |
| Freesurfer | 0.770 | 1.211 | 1.405 | 0.685 | 4.071 | 1.361 | 1.749 | ||||||||||
| FSL FIRST | 0.867 | 1.143 | 1.675 | 1.746 | |||||||||||||
| Volume bias | |||||||||||||||||
| MASSP | 0.041 | 0.017 | -0.038 | 0.007 | 0.066 | 0.089 | 0.040 | 0.0470 | 0.121 | 0.047 | 0.078 | 0.183 | 0.032 | -0.016 | 0.026 | 0.009 | 0.023 |
| Multi-atlas | 0.020 | -0.087 | -0.009 | 0.031 | 0.009 | 0.014 | 0.020 | -0.003 | -0.007 | -0.092 | -0.038 | 0.055 | -0.067 | -0.264 | -0.090 | -0.269 | -0.376 |
| Freesurfer | 0.017 | 0.087 | 0.163 | 0.122 | -0.551 | 0.351 | 0.468 | ||||||||||
| FSL FIRST | -0.100 | -0.021 | 0.165 | -0.249 | |||||||||||||
Table 3
Test-retest comparison with Freesurfer on Human Connectome Project data.
| Str | STN | SN | RN | GPi | GPe | Tha | LV | 3V | 4V | Amg | ic | VTA | fx | PAG | PPN | Cl | |
|---|---|---|---|---|---|---|---|---|---|---|---|---|---|---|---|---|---|
| Dice overlap | |||||||||||||||||
| MASSP test-retest | 0.914 | 0.701 | 0.818 | 0.829 | 0.791 | 0.859 | 0.928 | 0.881 | 0.837 | 0.870 | 0.866 | 0.860 | 0.738 | 0.774 | 0.714 | 0.713 | 0.785 |
| Freesurfer test-retest | 0.898 | 0.770 | 0.919 | 0.894 | 0.842 | 0.849 | 0.852 | ||||||||||
| MASSP – Freesurfer | 0.876 | 0.778 | 0.838 | 0.858 | 0.430 | 0.769 | 0.692 | ||||||||||
| Dilated overlap | |||||||||||||||||
| MASSP test-retest | 0.987 | 0.939 | 0.977 | 0.978 | 0.963 | 0.977 | 0.990 | 0.980 | 0.979 | 0.986 | 0.981 | 0.973 | 0.969 | 0.961 | 0.965 | 0.972 | 0.966 |
| Freesurfer test-retest | 0.986 | 0.926 | 0.986 | 0.989 | 0.972 | 0.975 | 0.978 | ||||||||||
| MASSP – Freesurfer | 0.954 | 0.788 | 0.919 | 0.934 | 0.435 | 0.901 | 0.866 | ||||||||||
| Average surface distance | |||||||||||||||||
| MASSP test-retest | 0.513 | 0.528 | 0.467 | 0.461 | 0.532 | 0.508 | 0.488 | 0.509 | 0.391 | 0.419 | 0.533 | 0.536 | 0.431 | 0.464 | 0.428 | 0.402 | 0.433 |
| Freesurfer test-retest | 0.876 | 0.778 | 0.838 | 0.858 | 0.430 | 0.769 | 0.692 | ||||||||||
| MASSP – Freesurfer | 0.976 | 1.673 | 1.605 | 1.946 | 5.699 | 1.428 | 1.478 | ||||||||||
Table 4
Mean volume and quantitative MRI values for each age group.
| Age | Str | STN | SN | RN | GPi | GPe | Tha | LV | 3V | 4V | Amg | ic | VTA | fx | PAG | PPN | Cl |
|---|---|---|---|---|---|---|---|---|---|---|---|---|---|---|---|---|---|
| Volume () | |||||||||||||||||
| 18-40 | 10656 | 118 | 566 | 253 | 567 | 1366 | 7112 | 7524 | 1895 | 1391 | 1315 | 4335 | 254 | 1632 | 250 | 193 | 843 |
| 41-60 | 10572 | 124 | 583 | 256 | 586 | 1403 | 7492 | 8850 | 2024 | 1408 | 1363 | 4495 | 264 | 1808 | 255 | 195 | 830 |
| 61-80 | 10734 | 130 | 584 | 260 | 586 | 1397 | 7463 | 9142 | 2023 | 1407 | 1321 | 4407 | 272 | 1910 | 259 | 192 | 829 |
| Thickness () | |||||||||||||||||
| 18-40 | 5.94 | 1.89 | 2.55 | 4.64 | 3.09 | 3.56 | 8.31 | 4.27 | 2.77 | 4.03 | 4.81 | 4.06 | 1.69 | 2.06 | 1.78 | 1.92 | 1.79 |
| 41-60 | 5.47 | 1.86 | 2.66 | 4.58 | 2.96 | 3.41 | 8.28 | 5.08 | 2.95 | 3.89 | 4.85 | 4.19 | 1.76 | 1.96 | 1.84 | 1.86 | 1.80 |
| 61-80 | 5.22 | 1.83 | 2.60 | 4.11 | 2.92 | 3.22 | 8.28 | 4.90 | 3.18 | 4.06 | 4.73 | 4.19 | 1.80 | 1.97 | 1.90 | 1.95 | 1.82 |
| qR1 () | |||||||||||||||||
| 18-40 | 0.647 | 0.949 | 0.857 | 0.928 | 0.868 | 0.850 | 0.761 | 0.332 | 0.346 | 0.274 | 0.546 | 0.906 | 0.819 | 0.714 | 0.654 | 0.779 | 0.650 |
| 41-60 | 0.662 | 0.968 | 0.893 | 0.939 | 0.879 | 0.856 | 0.758 | 0.278 | 0.315 | 0.269 | 0.559 | 0.904 | 0.833 | 0.671 | 0.653 | 0.771 | 0.664 |
| 61-80 | 0.648 | 0.952 | 0.882 | 0.903 | 0.860 | 0.830 | 0.743 | 0.273 | 0.300 | 0.270 | 0.552 | 0.884 | 0.814 | 0.638 | 0.647 | 0.764 | 0.669 |
| qR2* () | |||||||||||||||||
| 18-40 | 43.8 | 67.1 | 67.8 | 63.2 | 75.2 | 79.6 | 38.1 | 14.7 | 18.9 | 9.0 | 25.5 | 36.8 | 39.2 | 37.4 | 25.9 | 32.7 | 32.6 |
| 41-60 | 50.4 | 74.1 | 74.1 | 77.1 | 80.2 | 87.9 | 40.3 | 8.4 | 12.4 | 11.7 | 28.1 | 38.7 | 42.8 | 37.4 | 28.0 | 33.4 | 36.9 |
| 61-80 | 51.8 | 77.0 | 72.5 | 73.8 | 77.8 | 87.0 | 40.1 | 8.5 | 10.2 | 12.0 | 30.1 | 39.6 | 52.6 | 35.7 | 28.4 | 34.2 | 35.4 |
| QSM () | |||||||||||||||||
| 18-40 | 0.0329 | 0.0609 | 0.0738 | 0.0717 | 0.1015 | 0.1150 | 0.0138 | 0.0130 | 0.0100 | 0.0279 | 0.0036 | −0.0234 | 0.0241 | 0.0079 | 0.0119 | 0.0135 | −0.0122 |
| 41-60 | 0.0400 | 0.0647 | 0.0713 | 0.0829 | 0.0984 | 0.1241 | 0.0134 | 0.0115 | 0.0025 | 0.0234 | 0.0085 | −0.0226 | 0.0201 | 0.0079 | 0.0089 | 0.0099 | −0.0110 |
| 61-80 | 0.0411 | 0.0705 | 0.0610 | 0.0738 | 0.0925 | 0.1249 | 0.0064 | 0.0089 | −0.0034 | 0.0236 | 0.0061 | −0.0243 | 0.0177 | 0.0100 | 0.0039 | 0.0096 | −0.0091 |
Additional files
Download links
A two-part list of links to download the article, or parts of the article, in various formats.
Downloads (link to download the article as PDF)
Open citations (links to open the citations from this article in various online reference manager services)
Cite this article (links to download the citations from this article in formats compatible with various reference manager tools)
Multi-contrast anatomical subcortical structures parcellation
eLife 9:e59430.
https://doi.org/10.7554/eLife.59430


