RETRACTED: Amino acid synthesis loss in parasitoid wasps and other hymenopterans
- State Key Laboratory of Rice Biology & Ministry of Agricultural and Rural Affairs Key Laboratory of Molecular Biology of Crop Pathogens and Insects, Institute of Insect Sciences, Zhejiang University, China
- Department of Biology, University of Rochester, United States
- Division of Plant Sciences, College of Agriculture, Food and Natural Resources, University of Missouri, United States
Figures
Figure 1

Hymenoptera genome evolution and comparative genomic analysis.
(A) A female C. chilonis attacking its host C. suppressalis and the cocoons of C. chilonis. (B) Hymenoptera phylogeny and orthology assignment based on genome data. The phylogenetic tree was based on 2291 single-copy proteins. Red flour beetle T. castaneum was used as the outgroup. Divergence time for each node is represented by gray bars at the node, the range of the bar indicated the 95% confidence interval of the divergence time. Bars are subdivided to represent different types of orthology clusters, as indicated. Universal single-copy genes are single-copy across all species analyzed by us, and absence or duplication in a single genome was allowed; Universal multiple-copy genes represent other universal genes; Specific duplication represents specific duplication genes; Species-specific genes represent species-specific genes with only one copy in the genome; Dispensable clusters represent the remaining genes. (C) Amino acid identity of pairwise species. (D) Gene collinearity analysis between three braconid wasps (using scaffolds that contain more than five genes) with MCScanX. The heavy bars represent all the scaffolds linked together in an artificial order. In C. chilonis and M. demolitor pair, 6335 genes constituted 497 synteny blocks; In C. chilonis and M. cingulum pair, 946 genes constituted 127 synteny blocks.
-
Figure 1—source data 1
This file includes the phylogeny tree file in Figure 1B.
- https://cdn.elifesciences.org/articles/59795/elife-59795-fig1-data1-v2.xlsx
-
Figure 1—source data 2
This table includes the orthology assignment based on genome data.
- https://cdn.elifesciences.org/articles/59795/elife-59795-fig1-data2-v2.xlsx
-
Figure 1—source data 3
This table includes the amino acid identity of pairwise species.
- https://cdn.elifesciences.org/articles/59795/elife-59795-fig1-data3-v2.xlsx
-
Figure 1—source data 4
This table includes the gene collinearity pairs among C. chilonis, M. cingulum and M. demolitor.
- https://cdn.elifesciences.org/articles/59795/elife-59795-fig1-data4-v2.xlsx
Figure 2
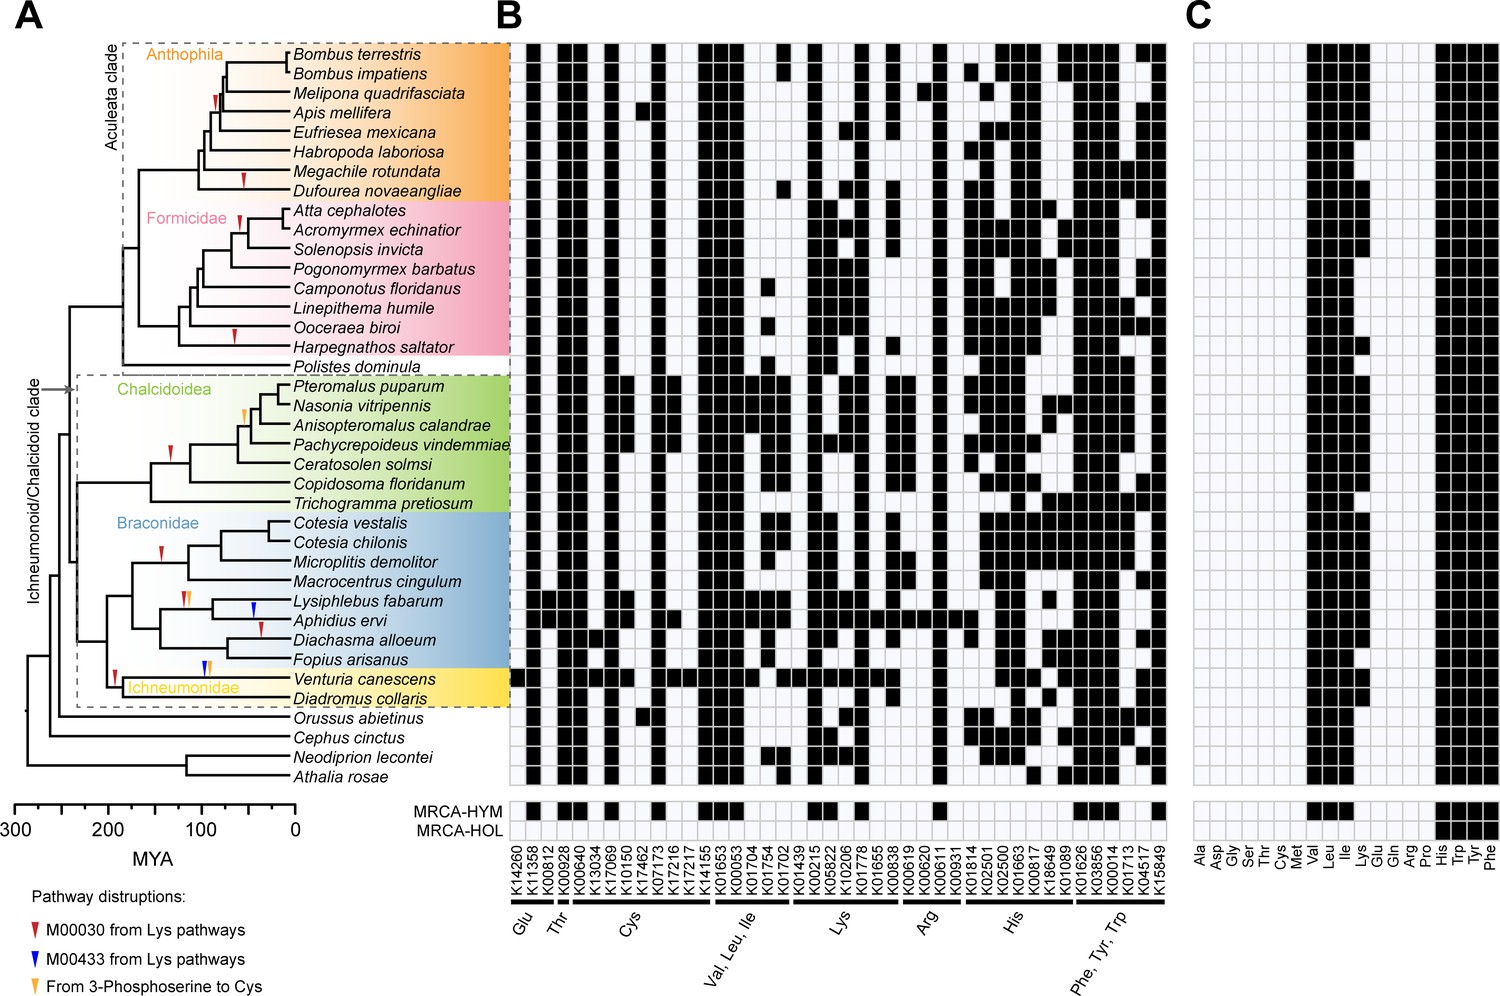
Pathway disruptions and independent gene losses in the amino acid biosynthetic pathways and loss of amino acid biosynthetic capability in Hymenoptera.
(A) Phylogenetic tree of 38 hymenopteran insects and pathway disruptions during the Hymenoptera evolution. In total, we have documented 14 independent disruptions of the amino acid synthetic pathways in hymenopterans, 10 in Ichneumonoid/Chalcidoid clade and four in the Aculeata clade. These independent pathway disruptions were showed as triangles on the branches. (B) Independent gene losses in amino acid biosynthetic pathways (white, present; black, lost). In Hymenoptera, 164 independent gene losses were found, 77 in the Chalcidoid/Ichneumonoid clade and 63 in the Aculeate clade. (C) Amino acid biosynthetic capability of each species was evaluated in terms of combined metabolic pathways for each amino acid (white, present; black, lost). The most recent common ancestor (MRCA) states of Hymenoptera (HYM) and Holometabola (HOL) were reconstructed using 13 additional outgroups to Hymenoptera.
-
Figure 2—source data 1
This file includes the phylogeny tree file in Figure 2A.
- https://cdn.elifesciences.org/articles/59795/elife-59795-fig2-data1-v2.xlsx
-
Figure 2—source data 2
Genes in amino acid biosynthetic pathways, '+' means present, 'x' means lost.
- https://cdn.elifesciences.org/articles/59795/elife-59795-fig2-data2-v2.xlsx
-
Figure 2—source data 3
Amino acid biosynthetic capability of each species, '+' means present, 'x' means lost.
- https://cdn.elifesciences.org/articles/59795/elife-59795-fig2-data3-v2.xlsx
Figure 3

Amino acid biosynthetic pathways that have been disrupted in the most recent common ancestor (MRCA) of Holometabola, MRCA of Hymenoptera, MRCA of Braconidae and MRCA of Cotesia.
We defined a pathway disruption as the loss of one or more genes required for amino acid synthesis in the pathway (KEGG modules). The KEGG modules in black box mean the novel disruptions compared to the outgroups. The amino acid biosynthetic pathways are redrawn from KEGG pathway, map01230. The gene losses caused the pathway disruptions during the Hymenoptera evolution are shown in colorful arrows, corresponding to the pathway disruption events shown in Figure 2A.
Figure 4 with 1 supplement

C. chilonis loses the ability to synthesize eight amino acids.
(A) Gene loss in amino acid biosynthetic pathways in C. chilonis. BlastKOALA web server and iPathCons tool were used for re-constructing the amino acid biosynthetic pathway in C. chilonis with annotated C. chilonis protein coding genes. For those genes missing in the first step, we searched them in whole genome assembly and PacBio long reads by TBLASTN (see Materials and methods). In total, 46 genes were found to be missing in the amino acid biosynthesis pathway for C. chilonis, thus disrupting the biosynthesis of eight amino acids (Lys, Trp, Phe, Tyr, Ile, Leu, Val, His). Full line indicates the reaction exists in C. chilonis, while dotted line indicates the interaction cannot be found. Amino acid names in red can be synthesized by C. chilonis, names in gray with strikethrough cannot be synthesized due to the lost genes on each dotted line. (B) In vitro rearing of C. chilonis. Five days after parasitism, larvae were put on the membrane of a transwell chamber; then the transwell was placed in the well containing 250 μl of Cotesia rearing medium so that the wasp larvae could reach the nutrients (see Materials and methods). (C) Survival rates of C. chilonis larvae developed on 11 different rearing media, respectively. Positive control: Grace's Insect Medium, containing 20 amino acids (see Materials and methods, n = 30); Negative control uses positive control medium minus the eight amino acids that C. chilonis cannot synthesize, Lys, Trp, Phe, Tyr, Ile, Leu, Val, His, n = 30; Single amino acid deficiencies use control media minus only one amino acid, indicated by '-' superscript, for example Gly deficiency (Gly-) indicates excluding glycine only. Gehan-Breslow-Wilcoxon test was used for survival rate statistical analyses. The Benjamini-Hochberg method was used for multiple testing correction. The statistical results of pairwise group comparisons are indicated.
-
Figure 4—source data 1
Genes in amino acid biosynthetic pathways of C. chilonis.
- https://cdn.elifesciences.org/articles/59795/elife-59795-fig4-data1-v2.xlsx
-
Figure 4—source data 2
This table includes the survival rates of C. chilonis larvae developed on 11 different rearing media.
- https://cdn.elifesciences.org/articles/59795/elife-59795-fig4-data2-v2.xlsx
Figure 4—figure supplement 1
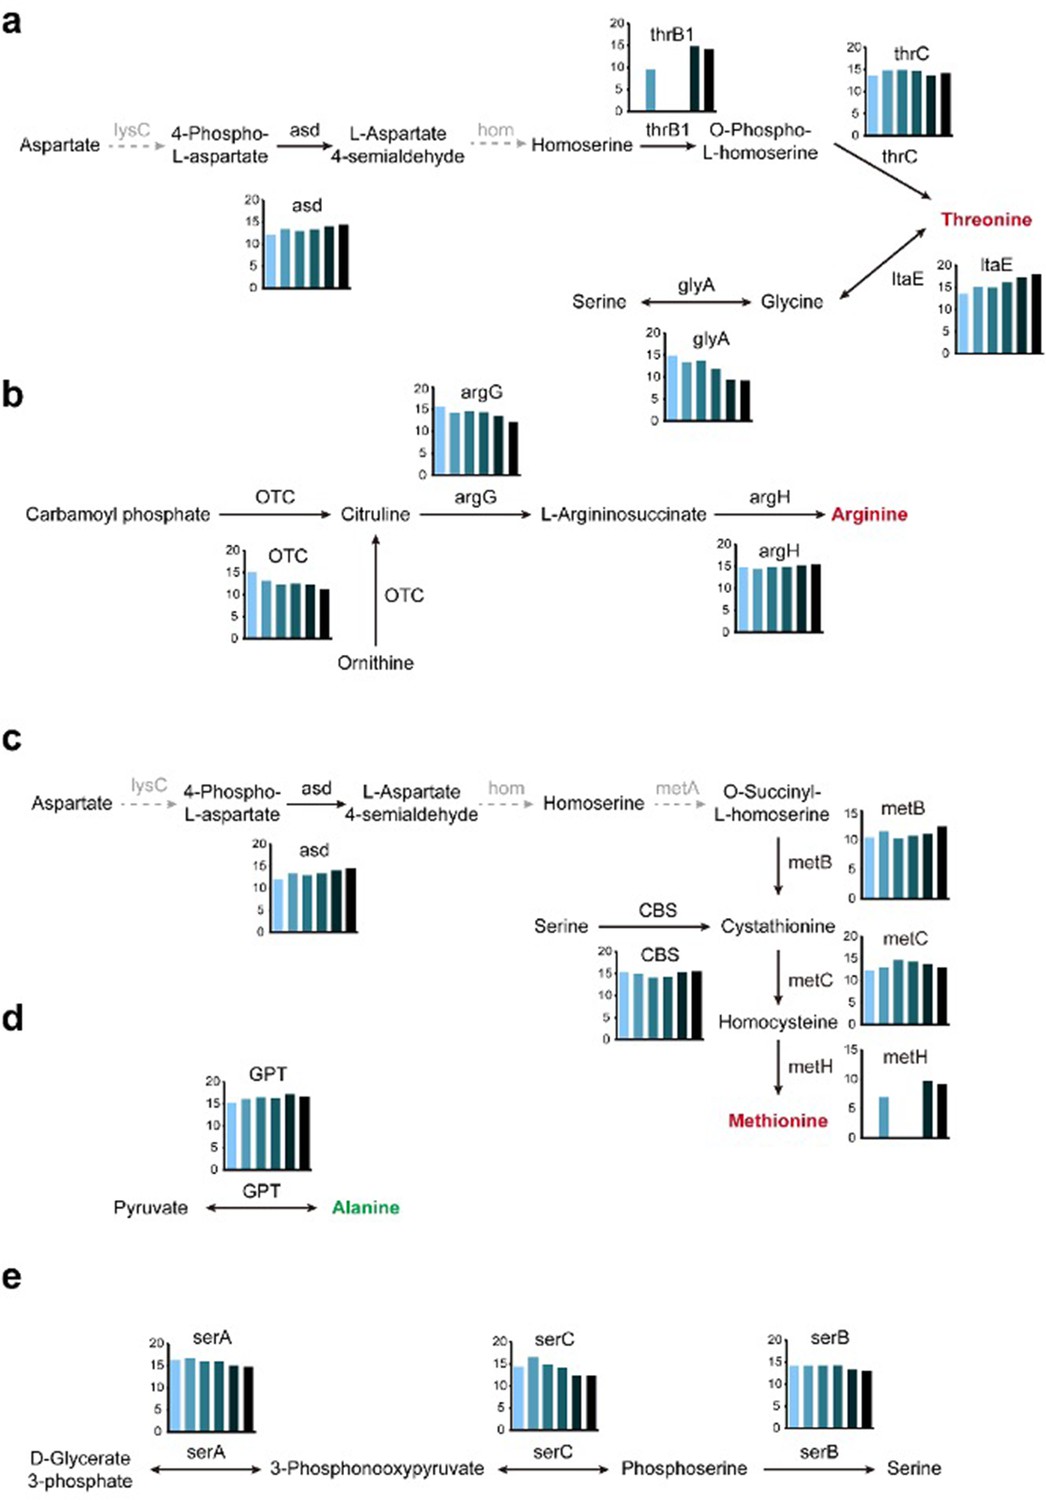
Activation of amino acid biosynthetic pathways.
Threonine (A), arginine (B), and methionine (C) are generally regarded as essential amino acids in C. chilonis, while alanine (D) and serine (E) are non-essential amino acids. The gray arrows mean the gene loss. Gene expression at different development stages (from left to right, early larvae, later larvae, female pupa, male pupa, female adult, and male adult) as measured by quantification of transcription levels (log2FPKM) is shown in the histograms.
Figure 5 with 1 supplement
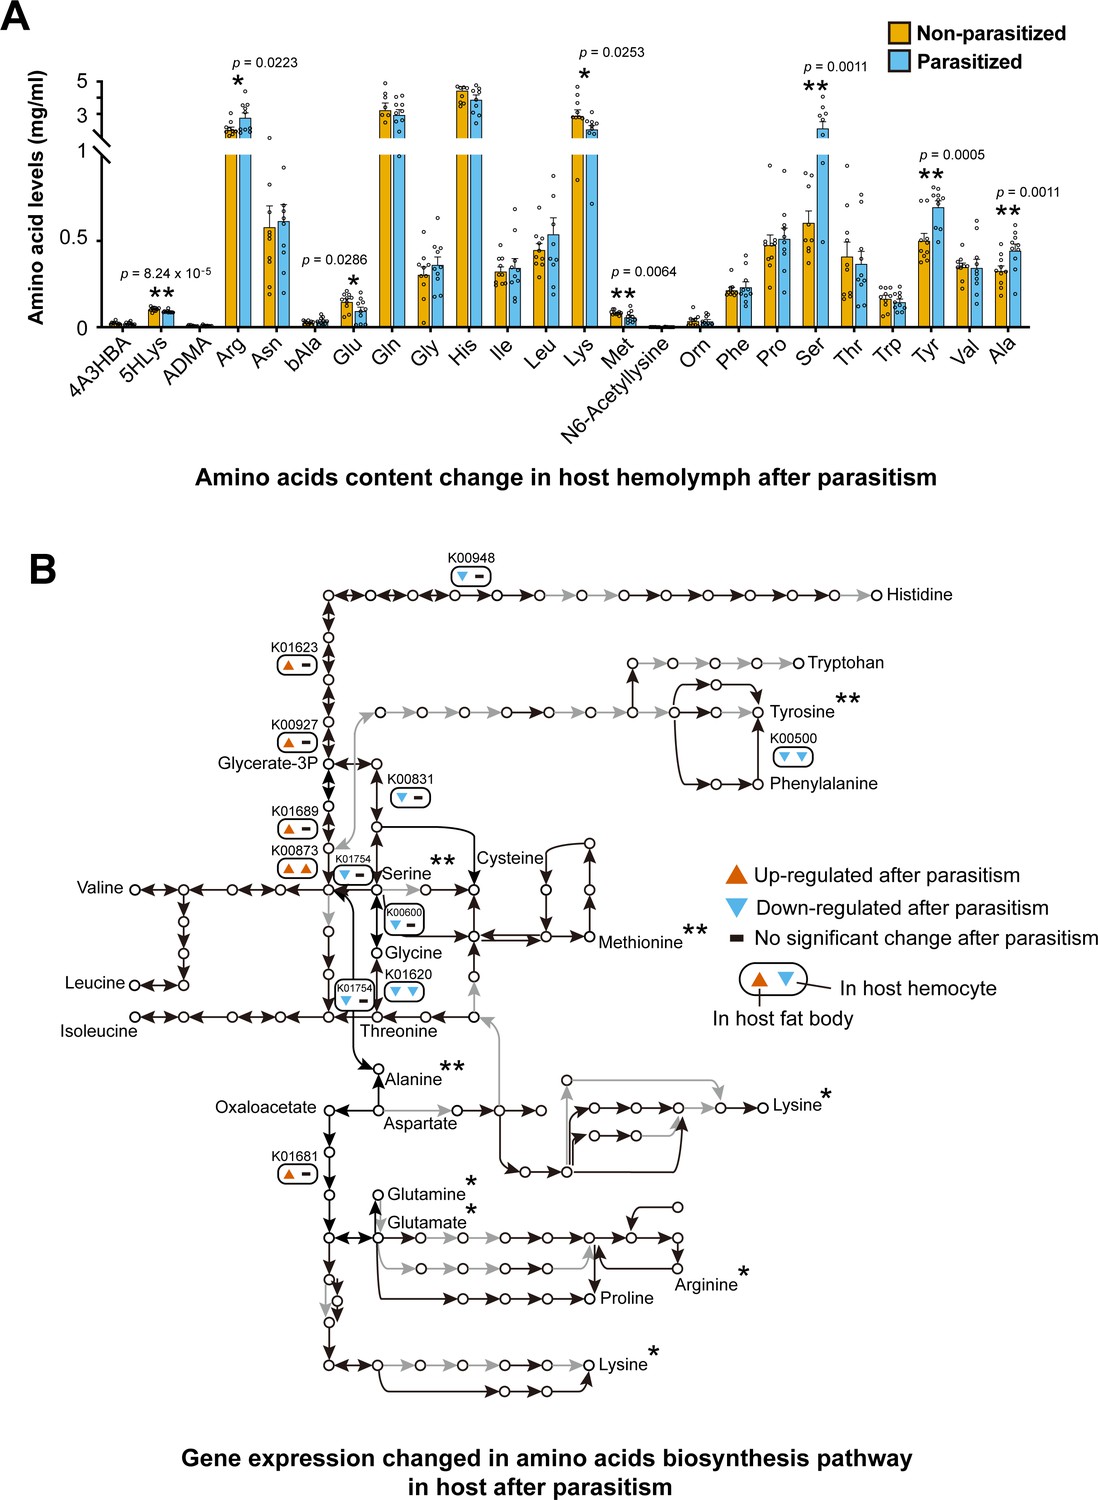
Parasitism by C. chilonis influences the host amino acid synthetic pathway and free amino acid levels in host hemolymph.
(A) Free amino acids levels in host hemolymph were changed after parasitism. UPLC-MS/MS analysis was used. Host hemolymph was collected 3 days after parasitism. The detection for each treatment were repeated 10 times. Student’s t-test was used for statistical analysis of amino acid changes. (B) Gene expression of amino acid biosynthetic pathways was changed 2 days after parasitism. Black line indicates the reaction exists in host, while grey line indicates the interaction cannot be found. Up- and down-regulated genes were considered if there was a fold change ≥2 and p-adjusted <0.05 in host fat body and hemocyte transcriptome data. Only the genes with significantly expression changes are showed. The asterisk indicates that the concentration of amino acids was significantly changed three days after parasitism. *Significant difference at p<0.05, **at p<0.01.
-
Figure 5—source data 1
This table includes the free amino acids levels in host hemolymph.
- https://cdn.elifesciences.org/articles/59795/elife-59795-fig5-data1-v2.xlsx
-
Figure 5—source data 2
This table includes the host’s differentially expressed genes of amino acid biosynthetic pathways after parasitism.
- https://cdn.elifesciences.org/articles/59795/elife-59795-fig5-data2-v2.xlsx
Figure 5—figure supplement 1
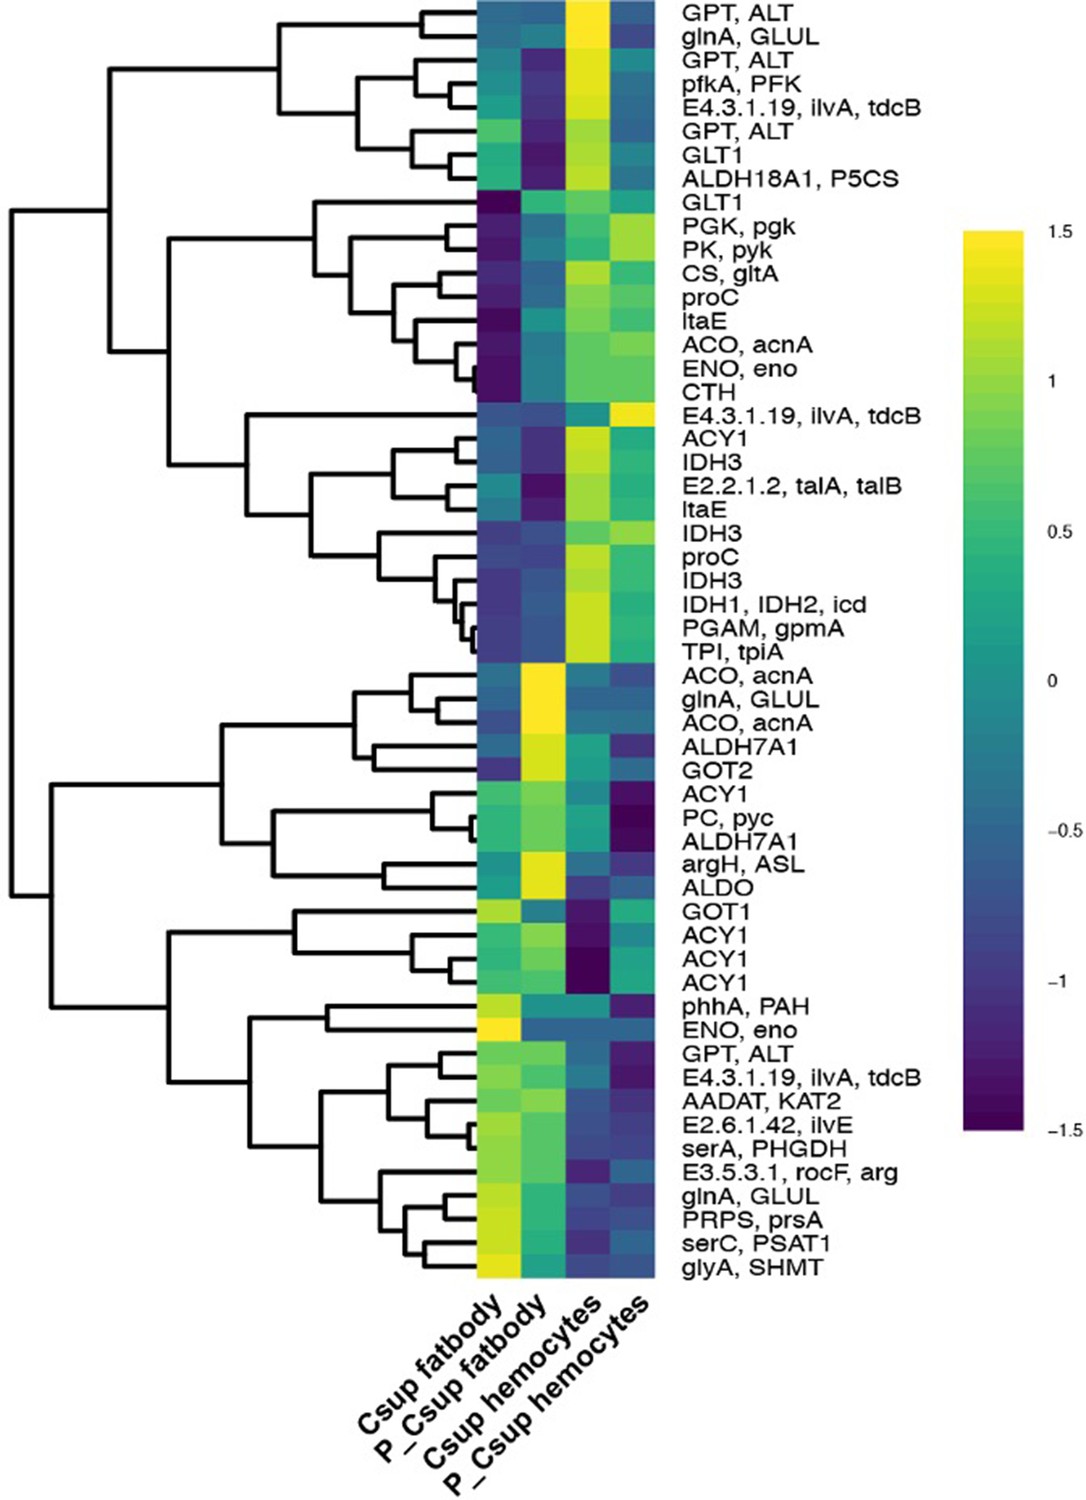
Influence of parasitism on gene expression of the amino acid biosynthetic pathways in fat body and hemocytes of the host C. suppressalis.
Figure 6 with 2 supplements
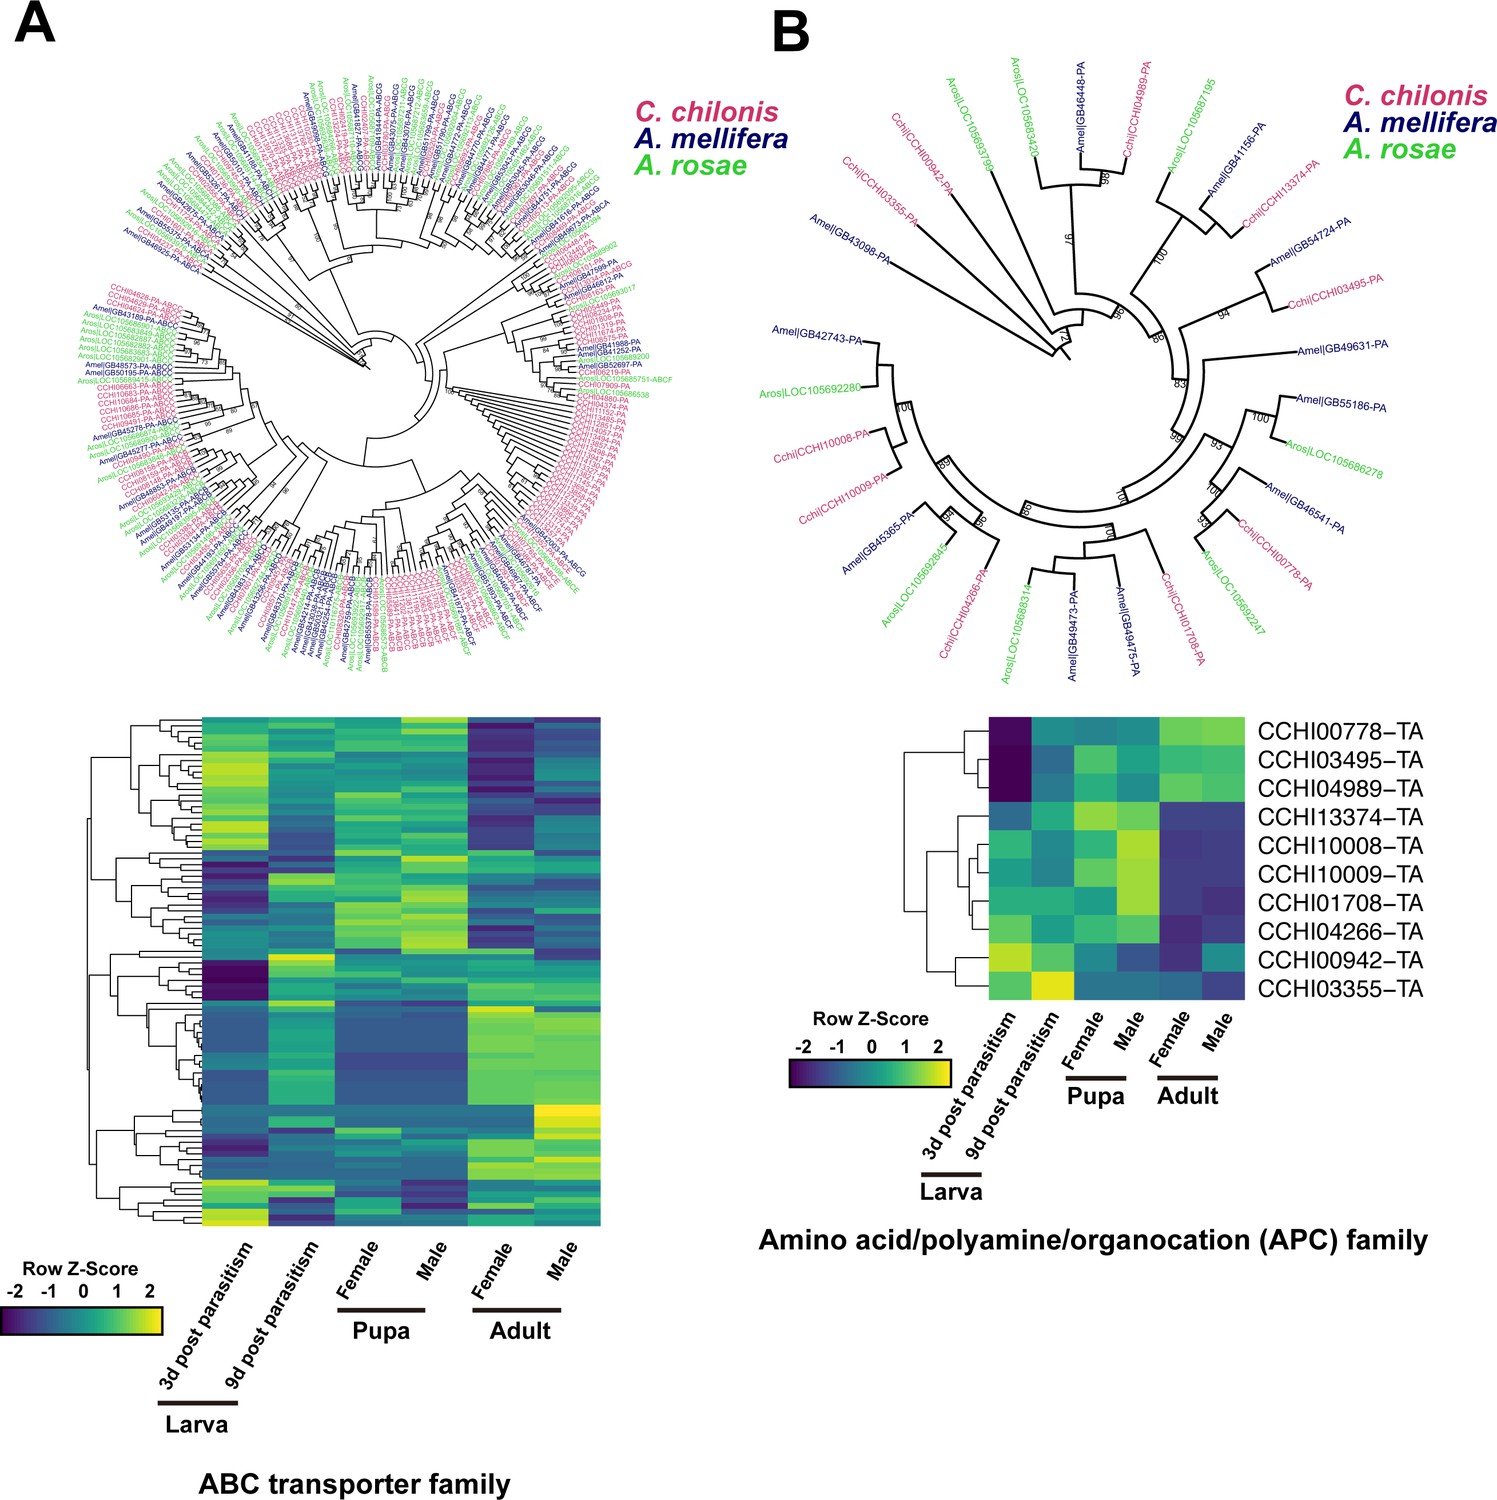
Amino acid transport genes in parasitoid wasp C. chilonis.
(A) ABC transporter genes of C. chilonis. A total of 103 ABC transporter genes were identified in the C. chilonis genome. The ABC transporter gene family was significantly expanded in C. chilonis as revealed by phylogenetic comparison with the honeybee A. mellifera and the sawfly A. rosae. Heatmap showed the expression patterns of these 103 ABC transporter genes at different developmental stages. (B) Amino acid/polyamine/organocation (APC) family of C. chilonis. A total of 10 APC genes were found in C. chilonis genome. Phylogenetic analysis showed APCs were not expanded in C. chilonis compared with honeybee and sawfly. Transcriptome analysis showed 7 APCs were highly expressed at both larval and pupal stages, suggesting the amino acid transport ability was active at these two development stages. Yellow represents higher expression values while dark blue represents lower expression.
-
Figure 6—source data 1
This file includes the phylogeny tree file of ABC transporter genes in Figure 6A.
- https://cdn.elifesciences.org/articles/59795/elife-59795-fig6-data1-v2.xlsx
-
Figure 6—source data 2
This file includes the phylogeny tree file of APC genes in Figure 6B.
- https://cdn.elifesciences.org/articles/59795/elife-59795-fig6-data2-v2.xlsx
-
Figure 6—source data 3
This file includes the gene expression levels (FPKM) of ABC transporter genes in C. chilonis.
- https://cdn.elifesciences.org/articles/59795/elife-59795-fig6-data3-v2.xlsx
-
Figure 6—source data 4
This file includes the gene expression levels (FPKM) of APC genes in C. chilonis.
- https://cdn.elifesciences.org/articles/59795/elife-59795-fig6-data4-v2.xlsx
Figure 6—figure supplement 1
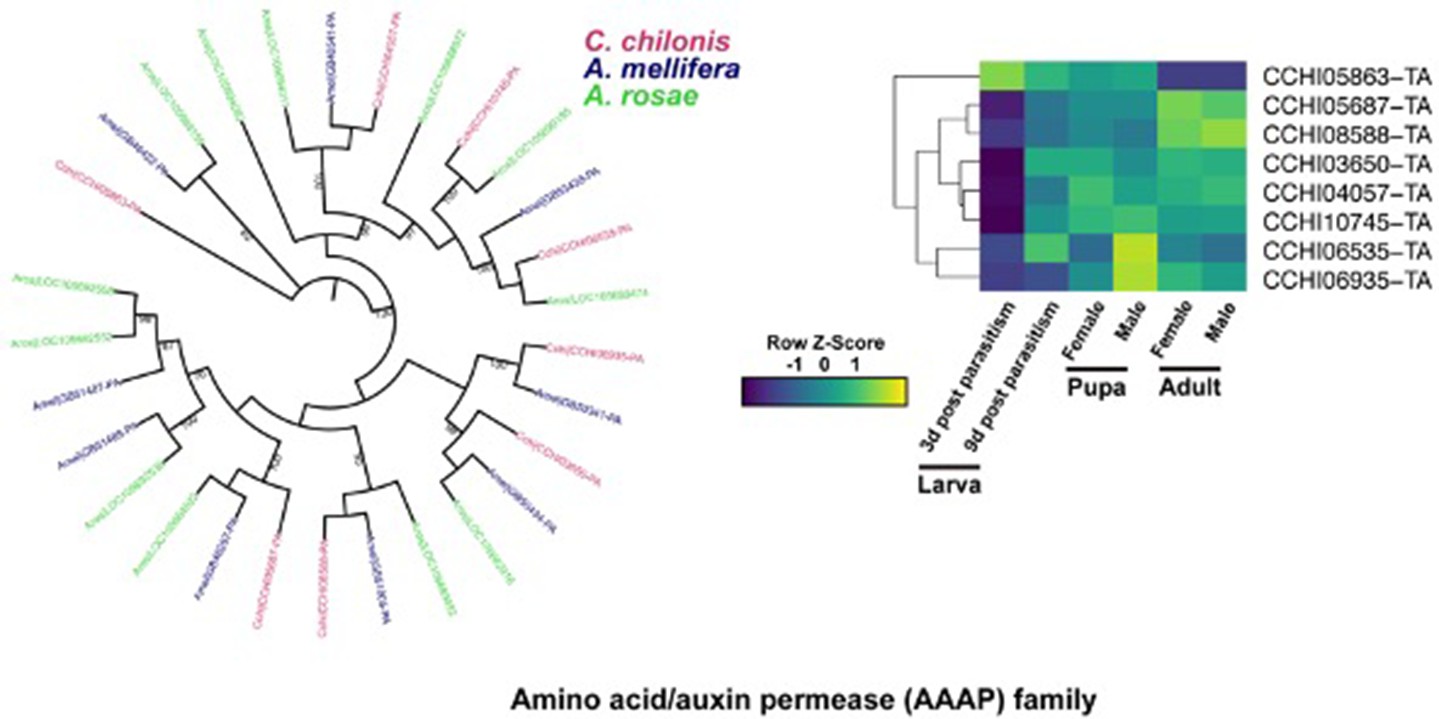
Phylogenetic relationships of the AAAP family and gene expression in C. chilonis at different development stages.
Figure 6—figure supplement 2
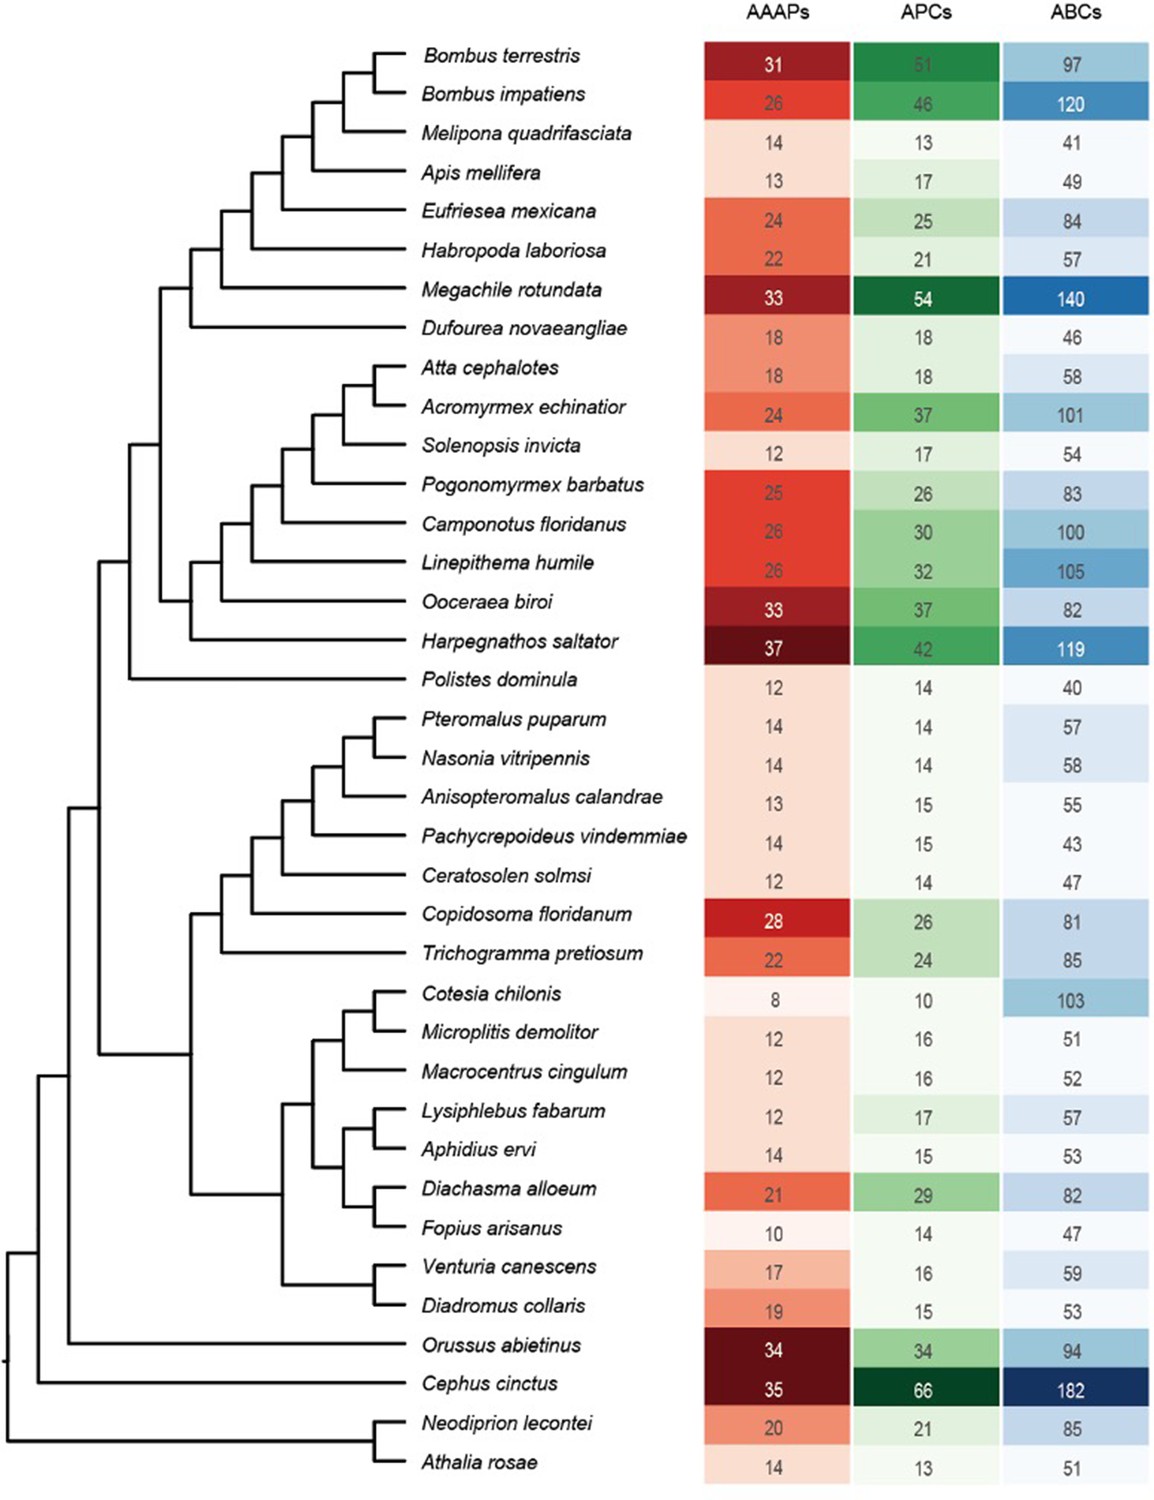
Number of predicted ABC transporter genes, APC family and AAAP family across hymenopteran lineages.
Additional files
-
Supplementary file 1
Supplementary Table 1.
Genes in amino acid biosynthetic pathways (KEGG map01230), '+' means present, 'x' means lost.
- https://cdn.elifesciences.org/articles/59795/elife-59795-supp1-v2.xlsx
-
Supplementary file 2
Supplementary Tables 1 – 16.
- https://cdn.elifesciences.org/articles/59795/elife-59795-supp2-v2.docx
-
Transparent reporting form
- https://cdn.elifesciences.org/articles/59795/elife-59795-transrepform-v2.docx
Download links
A two-part list of links to download the article, or parts of the article, in various formats.
Downloads (link to download the article as PDF)
Open citations (links to open the citations from this article in various online reference manager services)
Cite this article (links to download the citations from this article in formats compatible with various reference manager tools)
RETRACTED: Amino acid synthesis loss in parasitoid wasps and other hymenopterans
eLife 9:e59795.
https://doi.org/10.7554/eLife.59795


