Metabolomic profiling of rare cell populations isolated by flow cytometry from tissues
- Children’s Research Institute and Department of Pediatrics, University of Texas Southwestern Medical Center, United States
- Howard Hughes Medical Institute, University of Texas Southwestern Medical Center, United States
Figures
Figure 1 with 1 supplement
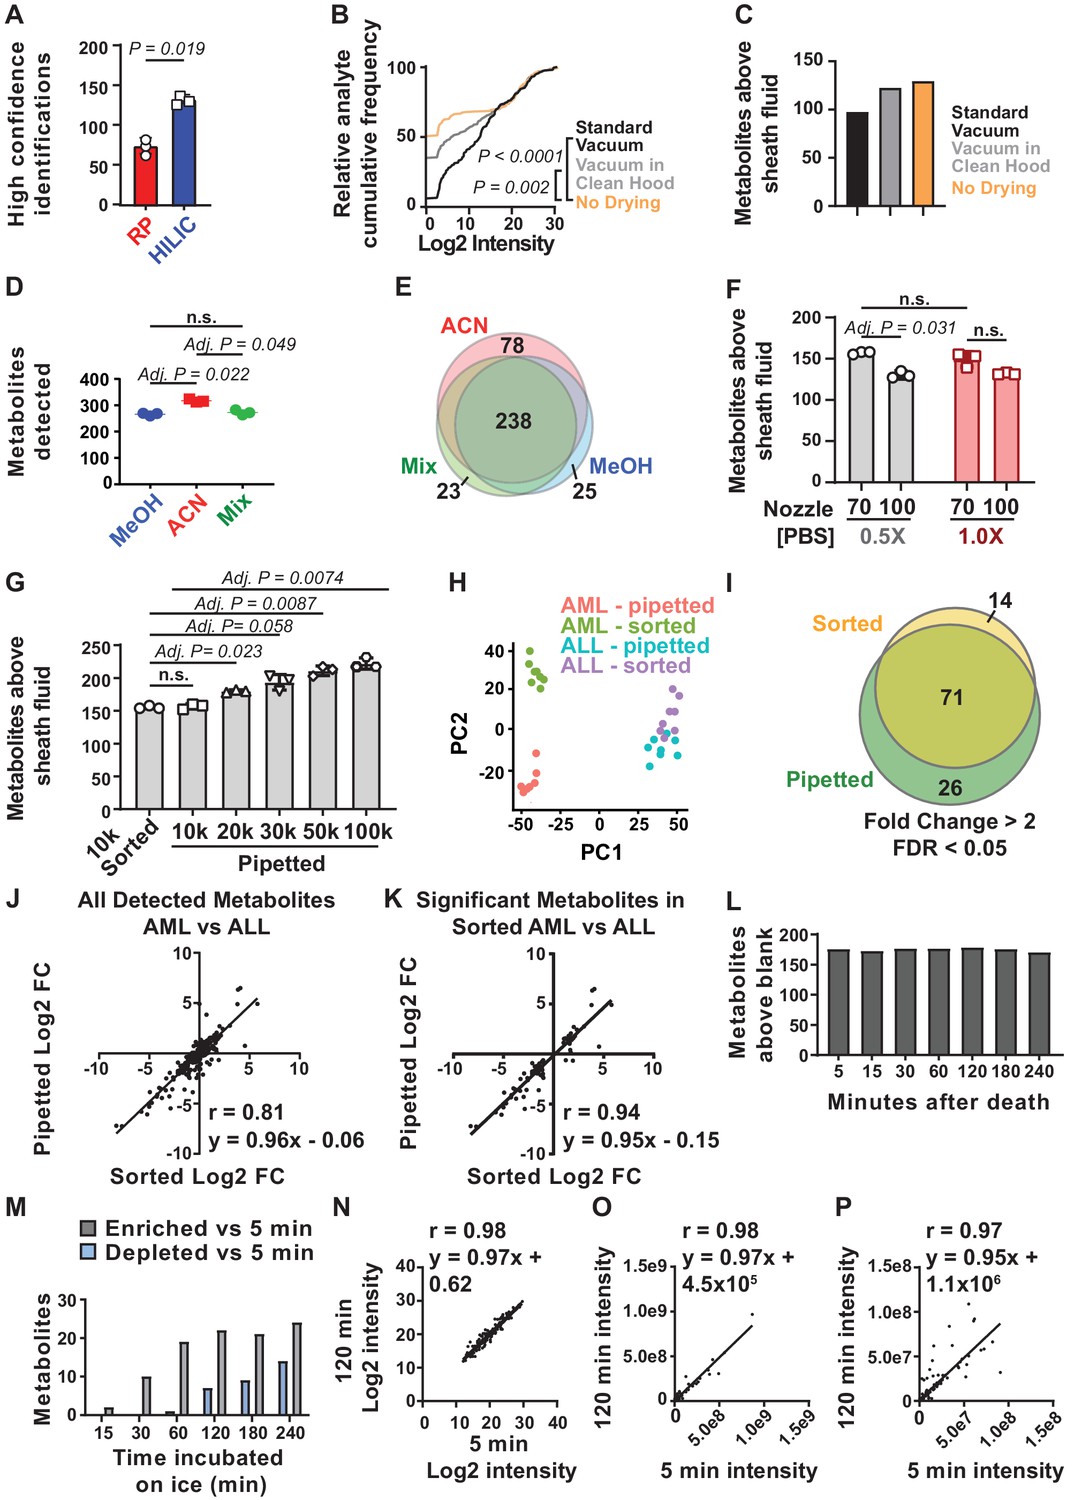
Sample processing and chromatography parameters.
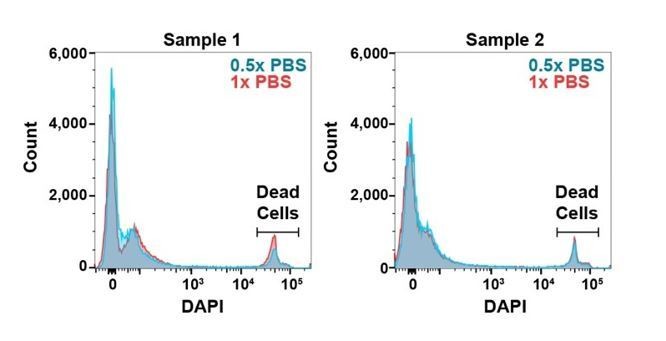
(A) The number of metabolites identified with high confidence spectral database matching in whole bone marrow (WBM) samples after HILIC or reverse phase chromatography (n = 3 replicates per group from one experiment). (B) Average peak intensities in sheath fluid background samples after drying with a standard vacuum concentrator, a vacuum concentrator in a positive pressure HEPA-filtered clean hood, or with no drying (n = 5 replicates per treatment from one experiment). (C) Number of metabolites significantly above sheath fluid background in 10,000 sorted WBM cells after drying with a standard vacuum concentrator, a vacuum concentrator in a clean hood, or with no drying (n = 5 replicates per treatment from one experiment). The threshold for statistical significance relative to background or other samples was always set at fold change >2 and false discovery rate (FDR) < 0.05, unless otherwise indicated. (D) Metabolites detected in 100,000 WBM cells extracted with 80% acetonitrile in water (ACN), 80% methanol in water (MeOH), or 40% ACN plus 40% MeOH in water (Mix) (n = 3 replicates per treatment from one experiment). (E) Overlap in metabolites detected with each extraction solvent (n = 3 replicates per treatment from one experiment). (F) Number of metabolites significantly above background in 10,000 WBM cells sorted using a 70 or 100 μm nozzle, and 0.5× or 1.0× phosphate buffered saline (PBS) sheath fluid (n = 5 replicates per treatment in each of three independent experiments; the metabolites that significantly differed between 0.5× PBS versus 1× PBS sheath fluid are listed in Figure 1—source data 2, Supplementary Table 1). (G) Number of metabolites significantly above background in 10,000 sorted WBM cells or 10,000–100,000 pipetted WBM cells (n = 5 replicates per treatment in each of three independent experiments). (H–K): (H) Principal component analysis of 10,000 sorted or pipetted HNT-34 AML (AML) cells or DND-41 T-ALL (ALL) cells (one experiment with n = 8 replicates per treatment; the metabolites that significantly differed between sorted and pipetted AML cells and between sorted and pipetted ALL cells are shown in Figure 1—source data 3, Supplementary Table 2 and Figure 1—source data 4, Supplementary Table 3). Figure 1—source data 8 shows the raw metabolomics data for the comparison of AML to ALL cells. (I) Metabolites that significantly changed between AML and ALL cells in sorted versus pipetted samples (listed in Figure 1—source data 5, Supplementary Table 4). (J, K) Correlation between log2 fold changes (in AML versus ALL cells) in sorted versus pipetted samples for all detected metabolites (J) and metabolites that significantly differed between sorted AML and ALL cells (K). (L–P): (L) Number of metabolites above background in 10,000 pipetted WBM cell samples at various times after the death of the mouse (one experiment with n = 5 replicates per time point). (M) Number of metabolites that significantly increased or decreased at each time point relative to the 5 min time point (the metabolites are listed in Figure 1—source data 6, Supplementary Table 5). (N–P) Log2-transformed (N), non-transformed (O), and non-transformed intensity values for metabolites <1×10⁸ (P) in the 5 versus 120 min samples. The statistical significance of differences between treatments was assessed using a paired t-test (A), a Kolmogorov–Smirnov test (B) followed by Holm–Sidak’s multiple comparisons adjustment, repeated measures one-way ANOVA followed by Tukey’s (D) or Dunnett’s (G) multiple comparisons adjustment, repeated measures two-way ANOVA followed by Sidak’s multiple comparisons adjustment (F), or Spearman correlation analysis (J, K, N–P). All statistical tests were two-sided. Data represent mean ± SD. See also Figure 1—figure supplement 1.
-
Figure 1—source data 1
All source data for Figure 1.
- https://cdn.elifesciences.org/articles/61980/elife-61980-fig1-data1-v2.xlsx
-
Figure 1—source data 2
Supplementary table 1A-B.
Metabolites enriched or depleted in cells sorted using 1× phosphate buffered saline (PBS) sheath fluid vs 0.5× PBS sheath fluid (fold change >2 and false discovery rate [FDR] < 0.05). Supplementary table 1b. Metabolites enriched or depleted in cells sorted using 1× PBS sheath fluid vs 0.5× PBS sheath fluid (fold change = 1.5–2 and FDR < 0.05). Correlation analysis of metabolite levels from 1× PBS versus 0.5× PBS samples: Spearman r = 0.995, y = 1.3 × −2142387. These metabolites were not significantly enriched in any metabolic pathway by pathway enrichment analysis.
- https://cdn.elifesciences.org/articles/61980/elife-61980-fig1-data2-v2.xlsx
-
Figure 1—source data 3
Supplementary table 2A-B.
Metabolites enriched or depleted in sorted vs pipetted AML cells (fold change >2 and false discovery rate [FDR] < 0.05). Correlation analysis of sorted versus pipetted AML samples: spearman r = 0.997, y = 1.1 × +214263. Metabolites that differed between sorted and pipetted AML cells were significantly enriched in ‘cysteine and methionine metabolism’. Supplementary table 2b. Metabolites enriched or depleted in sorted versus pipetted AML cells (fold change = 1.5–2 and FDR < 0.05).
- https://cdn.elifesciences.org/articles/61980/elife-61980-fig1-data3-v2.xlsx
-
Figure 1—source data 4
Supplementary table 3A-B.
Metabolites enriched or depleted in sorted vs pipetted ALL cells (fold change >2 and false discovery rate [FDR] < 0.05). Correlation analysis: Spearman r = 0.999, y = 1.1 × –436390. The metabolites were not significantly enriched in any metabolic pathway. Supplementary table 3b. Metabolites enriched or depleted in sorted versus pipetted ALL cells (fold change = 1.5–2 and FDR < 0.05).
- https://cdn.elifesciences.org/articles/61980/elife-61980-fig1-data4-v2.xlsx
-
Figure 1—source data 5
Supplementary table 4A-B.
Metabolites that significantly differed between AML and ALL cells in both sorted and pipetted samples, sorted samples only, or pipetted samples only. Metabolites that significantly differed between AML and ALL cells in both sorted and pipetted samples were significantly enriched in ‘glycerophospholipid metabolism’. No pathways were enriched among metabolites that differed in only sorted samples or only in pipetted samples. Supplementary table 4b. Metabolites that significantly differed between sorted AML and ALL cells or pipetted AML and ALL cells and for which fold change was between 1.5 and 2 in either the sorted or pipetted samples (FDR < 0.05).
- https://cdn.elifesciences.org/articles/61980/elife-61980-fig1-data5-v2.xlsx
-
Figure 1—source data 6
Supplementary table 5.
Metabolites enriched or depleted at various time points after the incubation of cell suspensions on ice. The fold change cutoff is indicated in the left column. All are false discovery rate (FDR) < 0.05. Correlation analysis: 5 min versus 15 min: Spearman r = 0.998; 5 min versus 30 min: Spearman r = 0.996; 5 min versus 60 min: Spearman r = 0.992.
- https://cdn.elifesciences.org/articles/61980/elife-61980-fig1-data6-v2.xlsx
-
Figure 1—source data 7
Supplementary table 6A-B.
Metabolites enriched or depleted in whole bone marrow (WBM) cells isolated from cells suspended in phosphate buffered saline (PBS) versus Hank's Buffered Salt Solution (HBSS) (fold change >2 and false discovery rate [FDR] > 0.05). Correlation analysis: Spearman r = 0.960, y = 0.92 × +1759331. These metabolites were not significantly enriched in any metabolic pathway. Supplementary table 6b. Metabolites enriched or depleted in WBM cells isolated from cells suspended in PBS versus HBSS (fold change = 1.5–2 and FDR < 0.05).
- https://cdn.elifesciences.org/articles/61980/elife-61980-fig1-data7-v2.xlsx
-
Figure 1—source data 8
The raw metabolomic analyses from experiments comparing AML and ALL cells (Figure 1H–K).
These files contain the raw counts for each metabolite in each sample and the statistical comparisons between samples for each metabolite.
- https://cdn.elifesciences.org/articles/61980/elife-61980-fig1-data8-v2.xlsx
Figure 1—figure supplement 1
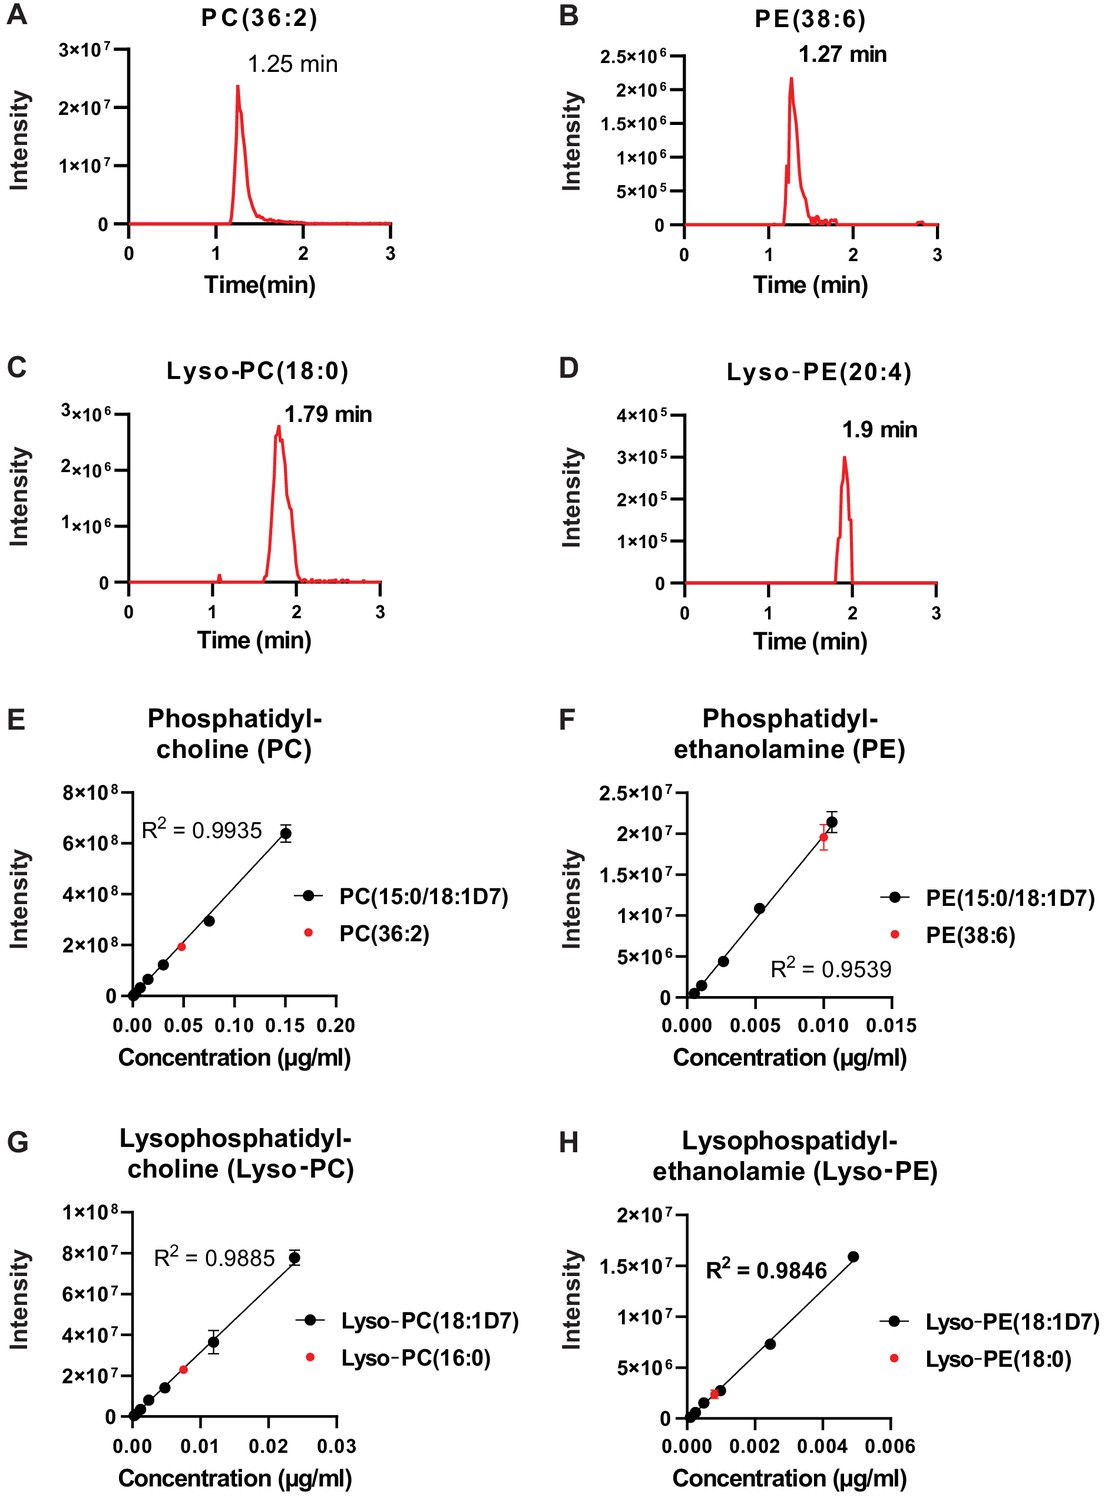
Chromatographic performance of lipids separated by HILIC.
(A–D) Representative chromatograms for (A) phosphatidylcholine (PC [36:2]), (B) phosphatidylethanolamine (PE [38:6]), (C) lysophosphatidylcholine (Lyso-PC [18:0]), and (D) lysophosphatidylethanolamine (Lyso-PE [20:4]). (E–H) Standard curves of isotopically labeled lipids from four classes of lipids we detected (black) and the corresponding endogenous lipid (red) for (E) phosphatidylcholine, (F) phosphatidylethanolamine, (G) lysophosphatidylcholine, and (H) lysophosphatidylethanolamine (n = 3 replicates, data represent mean ± SD).
-
Figure 1—figure supplement 1—source data 1
Source data for Figure 1—figure supplement 1.
- https://cdn.elifesciences.org/articles/61980/elife-61980-fig1-figsupp1-data1-v2.xlsx
Figure 2 with 2 supplements

Metabolic differences between hematopoietic stem cell (HSC)/multipotent progenitors (MPPs) and whole bone marrow (WBM) cells.
(A) Metabolites significantly above background in 10,000 sorted HSC/MPPs or WBM cells (n = 3–7 replicates per treatment in each of four independent experiments; fold change >2 and false discovery rate [FDR] < 0.05). (B) Metabolites that were significantly depleted (left) or enriched (right) in HSC/MPPs as compared to WBM cells (fold change >2.5, FDR < 0.01; all metabolites with fold change >2.0 and FDR < 0.05 are listed in Figure 2—source data 2, Supplementary Table 1). Data in (A) represent mean ± SD. A comparison of these differences to those observed by Agathocleous et al., 2017 between HSCs and WBM cells is shown in Figure 2—figure supplement 1and a summary of the differences in lipid species is shown in Figure 2—figure supplement 2.
-
Figure 2—source data 1
All source data for Figure 2.
- https://cdn.elifesciences.org/articles/61980/elife-61980-fig2-data1-v2.xlsx
-
Figure 2—source data 2
Supplementary table 1.
Metabolites enriched or depleted in sorted hematopoietic stem cell (HSC)/multipotent progenitors (MPPs) as compared to whole bone marrow (WBM) cells (fold change >2 and false discovery rate [FDR] < 0.05).
- https://cdn.elifesciences.org/articles/61980/elife-61980-fig2-data2-v2.xlsx
Figure 2—figure supplement 1
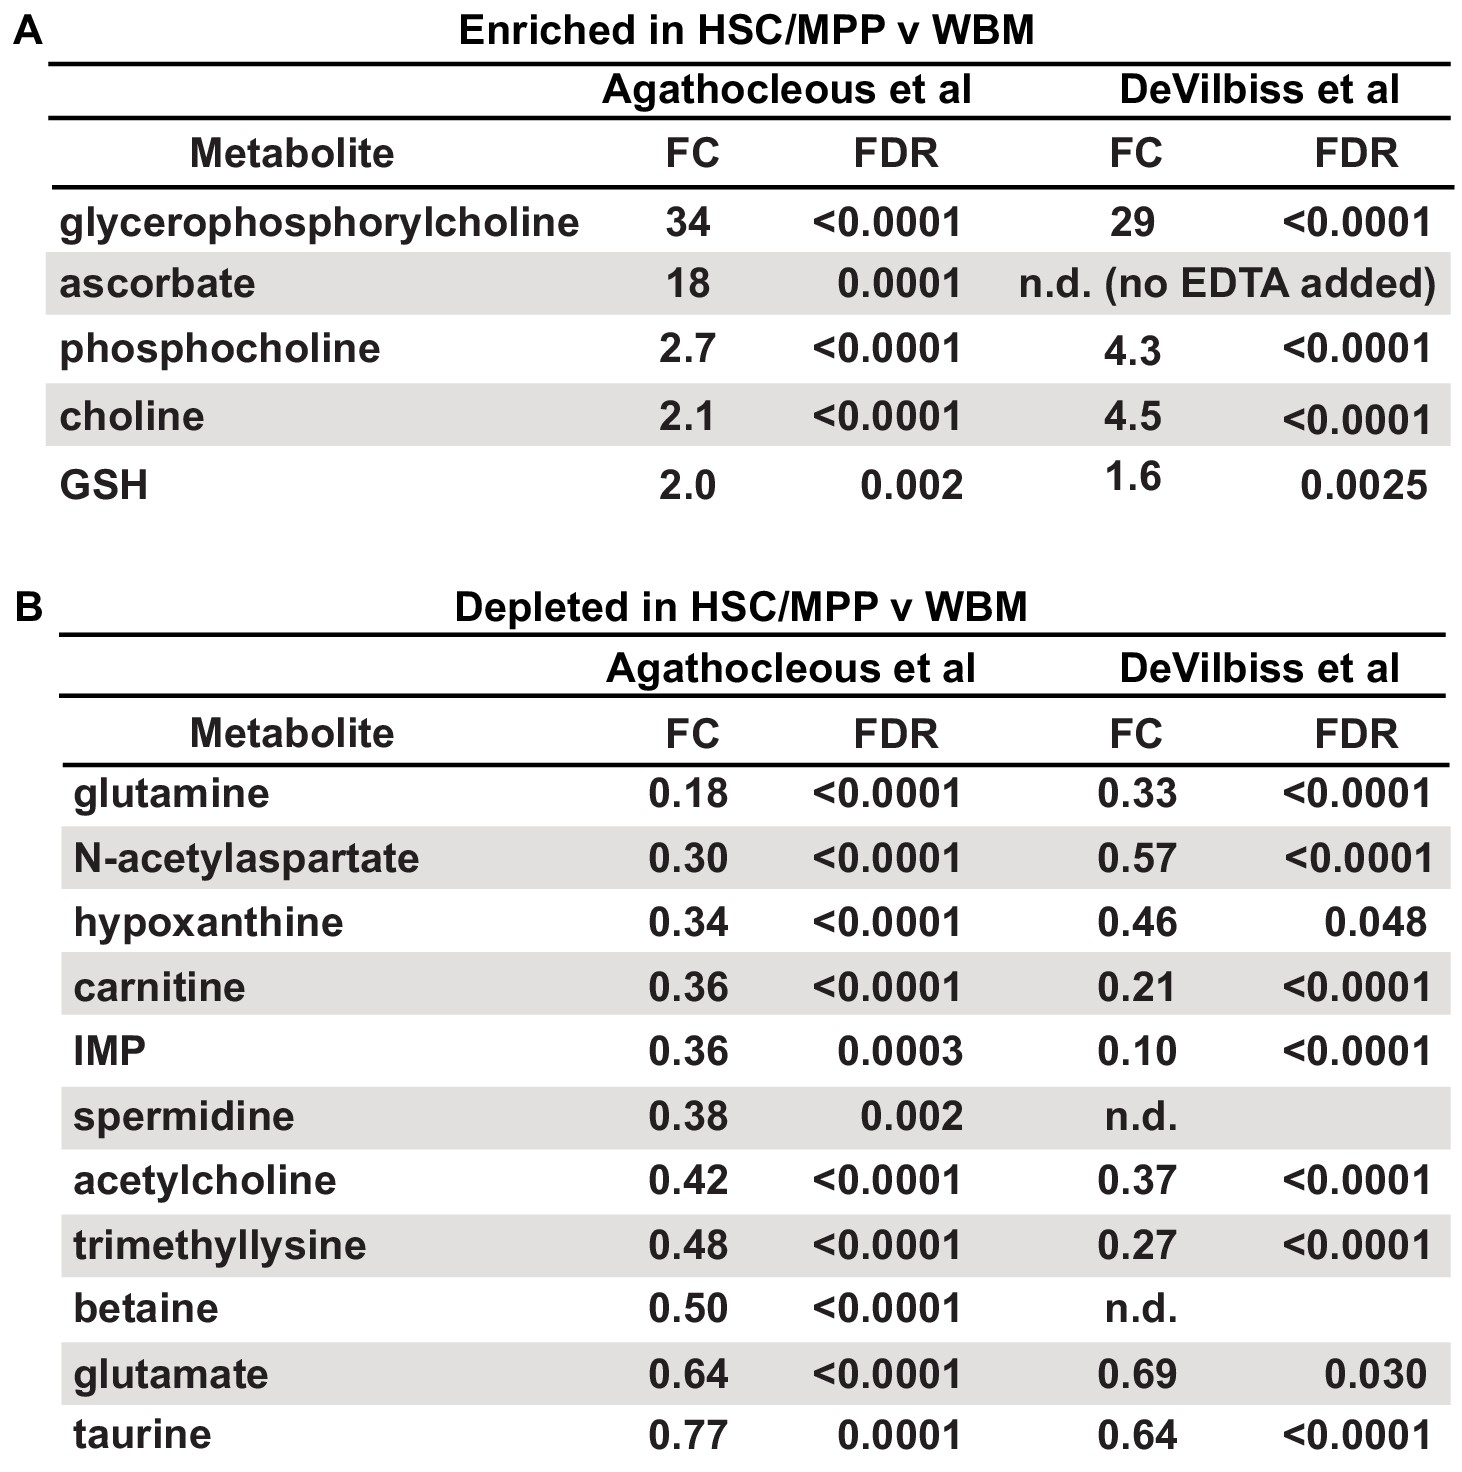
Metabolites that were detected as differing between hematopoietic stem cells (HSCs)/multipotent progenitors (MPPs) and whole bone marrow (WBM) cells using the Agathocleous et al.'s method (Agathocleous et al., 2017) versus the method described in this study.
Metabolites identified by Agathocleous et al. as (A) enriched or (B) depleted in HSC/MPPs as compared to WBM cells and the results obtained for the same metabolites in the current study (data are from Figure 2).
Figure 2—figure supplement 2

Glycerophospholipids are enriched in hematopoietic stem cell (HSC)/multipotent progenitors (MPPs) as compared to whole bone marrow (WBM) cells.
(A) Schematic of glycerophospholipid metabolism and (B) list of phosphatidylcholines (PC), phosphatidylethanolamines (PE), phosphatidylserines (PS), Lyso-PCs, and Lyso-PEs detected in 10,000 HSCs/MPPs or WBM cells by our method. Red metabolites were enriched in HSC/MPPs and blue metabolites were depleted in HSC/MPPs. Purple metabolites were detected but not significantly changed. Black metabolites were not detected (n = 11 replicates per cell population from a total of four independent experiments).
Figure 3 with 1 supplement
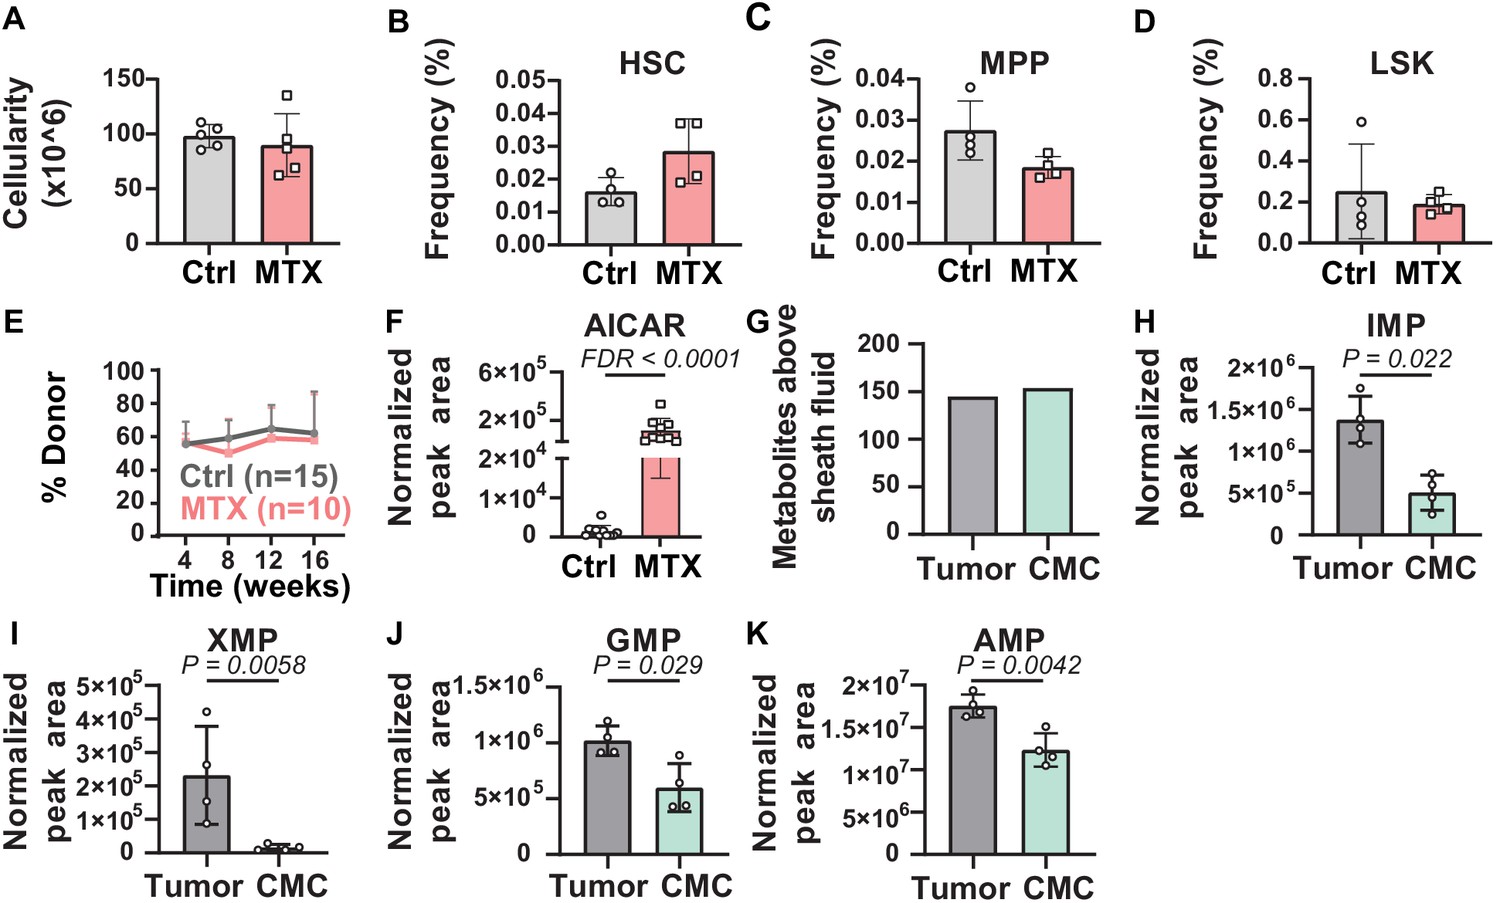
Metabolic differences between methotrexate-treated and control hematopoietic stem cells (HSCs) or circulating melanoma cells and primary tumors.
(A–D) Bone marrow cellularity (A) and the frequencies of CD150+CD48-Lin-Sca1+c-kit+ HSCs (B), CD150-CD48-Lin-Sca1+c-kit+multipotent progenitors (MPPs) (C), and Lin-Sca1+c-kit+ cells (D) in femurs and tibias from mice treated with methotrexate or vehicle control (n = 5 mice per treatment from two independent experiments). (E) Percentage of nucleated blood cells that were donor-derived after competitive transplantation of bone marrow cells from methotrexate-treated versus control mice into irradiated recipients (two independent experiments). (F) AICAR levels in HSC/MPPs from mice treated with methotrexate or vehicle (11 control samples and 9 MTX samples from four independent experiments). (G) Metabolites detected above background in primary tumor cells or circulating melanoma cells (n = 3 or four replicates per treatment in one experiment; fold change >2 and false discovery rate [FDR] < 0.05). (H–K) Levels of the purines inosine monophosphate (IMP) (H), xanthosine monophosphate (XMP) (I), guanosine monophosphate (GMP) (J), and adenosine monophosphate (AMP) (K) in primary tumor and circulating melanoma cells. Statistical significance was assessed by t-test (A), repeated measures two-way ANOVA (B–D), or mixed effects analysis (E) followed by Sidak’s multiple comparisons adjustment. All tests were two-sided. Data represent mean ± SD. The flow cytometry gates used to isolate each cell population are shown in Figure 3—figure supplement 1. All of the metabolites that differed between circulating melanoma cells and subcutaneous tumor cells are listed in Figure 3—source data 2, Supplementary table 1.
-
Figure 3—source data 1
All source data for Figure 3.
- https://cdn.elifesciences.org/articles/61980/elife-61980-fig3-data1-v2.xlsx
-
Figure 3—source data 2
Supplementary table 1.
Metabolites that differed between circulating melanoma cells and melanoma cells from primary subcutaneous tumors in xenografted mice (fold change >2 and p<0.05).
- https://cdn.elifesciences.org/articles/61980/elife-61980-fig3-data2-v2.xlsx
Figure 3—figure supplement 1

Flow cytometry gating strategies.
(A) Flow cytometry gating strategies for isolating CD150+CD48-Lin-Sca1+c-kit+ hematopoietic stem cells (HSCs; 0.0057% of bone marrow cells), CD150-CD48-Lin-Sca1+c-kit+multipotent progenitors (MPPs; 0.0047% of bone marrow cells), and Lin-Sca1+c-kit+ cells (0.19% of bone marrow cells). (B) Flow cytometry gating strategy for isolating live HLA+DsRed+mTer119-mCD45-mCD31- human melanoma cells from mechanically dissociated subcutaneous tumors from xenografted NSG mice (all melanomas were tagged with stable DsRed expression). (C) Flow cytometry gating strategy for isolating live HLA+DsRed+mTer119-mCD45-mCD31- circulating melanoma cells from the blood of xenografted NSG mice.
Figure 4
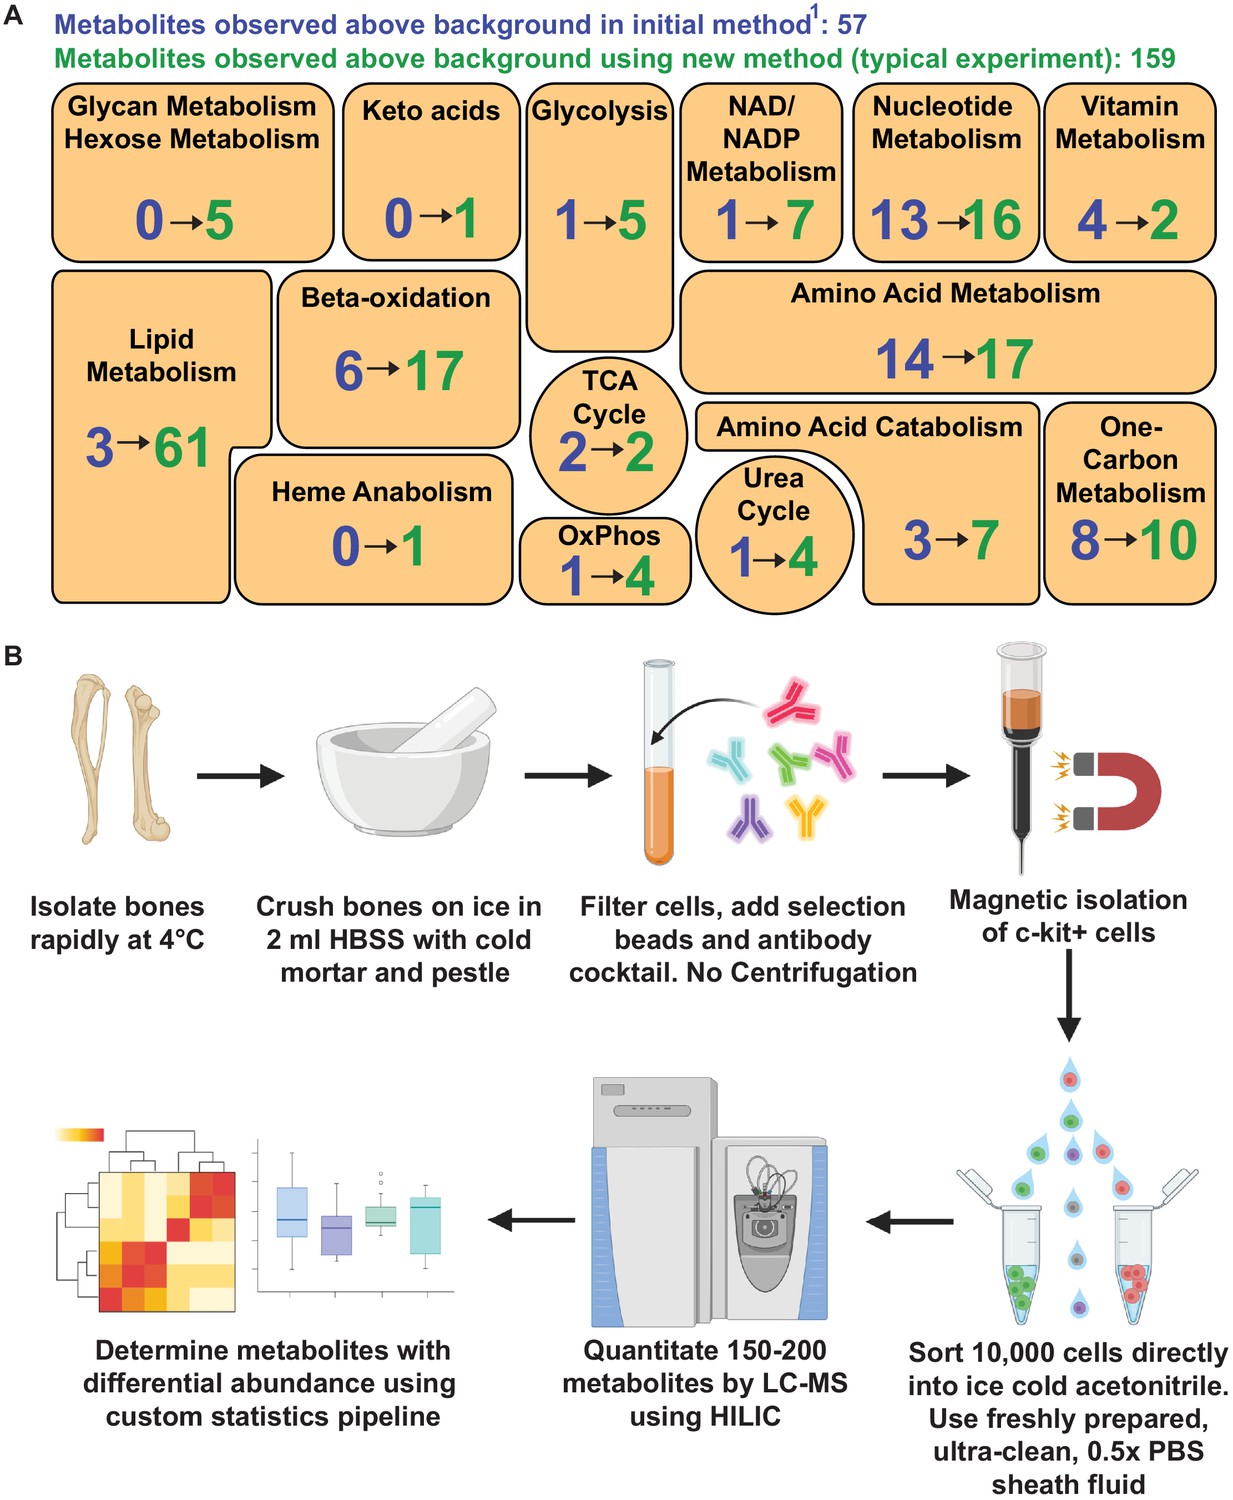
Metabolomic profiling of hematopoietic stem cells (HSCs) isolated by flow cytometry.
(A) Overview of the method. (B) Metabolites detected above background in 10,000 HSCs/multipotent progenitors (MPPs) in this study (green numbers, 159 metabolites total) as compared to our prior study using a different method (Agathocleous et al., 2017) (blue numbers, 57 metabolites total). These data are from one experiment, representative of four independent experiments. Metabolites detected above background were calculated by comparing three whole bone marrow (WBM) or three HSC/MPP samples to three sheath fluid blanks (fold change >2, false discovery rate [FDR] < 0.05).
-
Figure 4—source data 1
All source data for Figure 4.
- https://cdn.elifesciences.org/articles/61980/elife-61980-fig4-data1-v2.xlsx
Author response image 1
Tables
Key resources table
| Reagent type (species) or resource | Designation | Source or reference | Identifiers | Additional information |
|---|---|---|---|---|
| Chemical compound, drug | Phosphate Buffered Saline Tablet | Sigma | Cat# P4417-100TAB | |
| Chemical compound, drug | Methanol, Optima grade for LC/MS | Fisher Scientific | Cat# A456-4 | |
| Chemical compound, drug | Acetonitrile, Optima Grade for LCMS | Fisher Scientific | Cat# A955-4 | |
| Chemical compound, drug | MeOH, Optima Grade for LCMS | Fisher Scientific | Cat# A456-4 | |
| Chemical compound, drug | Water, Optima Grade for LCMS | Fisher Scientific | Cat# W6-4 | |
| Commercial assay, kit | LS magnetic enrichment columns | Miltenyi | Cat# 130-042-401 | |
| Commercial assay, kit | MidiMACS separator | Miltenyi | Cat# 130-042-301 | |
| Other | Plastic microfuge tube opener | USA Scientific | Cat# 1400–1508 | For minimizing metabolite contamination when opening microfuge tubes |
| Antibody | FITC anti-mouse B220, clone: RA3-6B2 (rat monoclonal) | Tonbo | Cat# 35–0452 U500, RRID:AB_2621690 | Dilution: 1:400 For bone marrow HSC isolation by flow cytometry |
| Antibody | FITC anti-mouse Gr-1, clone: RB6-8C5 (rat monoclonal) | Tonbo | Cat# 35–5931 U500, RRID:AB_2621721 | Dilution: 1:400 For bone marrow HSC isolation by flow cytometry |
| Antibody | FITC anti-mouse Terr119, clone: TER-119 (rat monoclonal) | Tonbo | Cat# 35–5921 U500, RRID:AB_2621720 | Dilution: 1:400 For bone marrow HSC isolation by flow cytometry |
| Antibody | FITC anti-mouse CD2, clone: RM2-5 (rat monoclonal) | Tonbo | Cat# 35–0021 T100, RRID:AB_2621657 | Dilution: 1:400 For bone marrow HSC isolation by flow cytometry |
| Antibody | FITC anti-mouse CD3, clone: 17A2 (rat monoclonal) | Tonbo | Cat# 35–0032 U100, RRID:AB_2621660 | Dilution: 1:400 For bone marrow HSC isolation by flow cytometry |
| Antibody | FITC anti-mouse CD5, clone: 53–7.3 (rat monoclonal) | Biolegend | Cat# 100606, RRID:AB_312735 | Dilution: 1:400 For bone marrow HSC isolation by flow cytometry |
| Antibody | FITC anti-mouse CD8α, clone: 53–6.7 (rat monoclonal) | Tonbo | Cat# 35–0081 U500, RRID:AB_2621671 | Dilution 1:400 For bone marrow HSC isolation by flow cytometry |
| Antibody | APC-e780 anti-mouse c-kit, clone: 2B8 (rat monoclonal) | eBiosciences | Cat# 47-1171-82, RRID:AB_1272177 | Dilution: 1:200 For bone marrow HSC isolation by flow cytometry |
| Antibody | PerCP-Cy5.5 anti-mouse Sca-1, clone: D7 (rat monoclonal) | BioLegend | Cat# 108124, RRID:AB_893615 | Dilution 1:200 |
| Antibody | APC anti-mouse CD48, clone: HM48-1 (Armenian hamster monoclonal) | eBiosciences | Cat# 17-0481-82, RRID:AB_469408 | Dilution 1:200 |
| Antibody | PE anti-mouse CD150, clone: TC15-12F12.2 (rat monoclonal) | BioLegend | Cat# 115904, RRID:AB_313683 | Dilution 1:200 |
| Antibody | APC anti-Mouse CD45, clone: 30-F11 (rat monoclonal) | Tonbo | Cat# 20–0451 U100, RRID:AB_2621573 | Dilution 1:100 |
| Antibody | APC anti-Mouse CD31 (PECAM-1), clone: 390 (rat monoclonal) | Biolegend | Cat# 102410, RRID:AB_312905 | Dilution 1:100 |
| Antibody | APC anti-Mouse Ter119, clone: Ter119 (rat monoclonal) | Tonbo | Cat# 20–5921 U100, RRID:AB_2621609 | Dilution 1:100 |
| Antibody | FITC anti-Human HLA-A, B, C, clone: G46-2.6 (mouse monoclonal) | BD Biosciences | Cat# 555552, RRID:AB_395935 | Dilution 1:20 |
| Antibody | Anti-Mouse c-Kit, conjugated to para-magnetic beads, clone: 3C11 (rat monoclonal) | Miltenyi | Cat# 130-091-224, RRID:AB_2753213 | (60 µl) 60 µl beads per3 × 108 whole bone marrow cells |
| Antibody | Anti-Mouse CD45, conjugated to para-magnetic beads, clone: 30-F11 (rat monoclonal) | Miltenyi | Cat# 130-052-301, RRID:AB_2877061 | (3 µl) 3 µl beads per1 × 106 whole bone marrow cells |
| Chemical compound, drug | DAPI | Sigma-Aldrich | Cat# D8417-10mg | 1 µg/ml for flow cytometry |
| Cell line | Human – HNT-34 AML cell line | Provided by Jian Xu’s Laboratory at Children’s Research Institute at UT Southwestern Medical Center. Original source: DSMZ | ACC 600, RRID: CVCL_2071 | |
| Cell line | Human DND-41 cell line | Provided by Jian Xu’s Laboratory at Children’s Research Institute at UT Southwestern Medical Center. Original source: Hui Feng, M.D./Ph.D.; Boston University | RRID: CVCL_2022 | |
| Cell line | Human melanoma xenograft M405 | Sci Trans Med 4:159ra PMCID:PMC4501487 | M405 | |
| Strain, strain background | NOD.CB17-Prkdcscid Il2rgtm1Wjl/Szj (NSG) mice | Jackson laboratories | 005557, RRID:IMSR_JAX:005557 | |
| Strain, strain background | C57BL/Ka Thy1.1 mice | Derived from Henry Kaplan’s laboratory at Stanford University | N/A | |
| Other | ZIC-pHILIC column (2.1 × 150, 5 μm) | Millipore Sigma | Cat# 1504600001 | |
| Software, algorithm | Omics Data Analyzer (ODA) | This manuscript | https://git.biohpc.swmed.edu/CRI/ODA | See Materials and methods, section ‘Statistical analysis of metabolomics data’ |
| Software, algorithm | Graphpad Prism V8.3 | Graphpad | RRID:SCR_002798 | |
| Software, algorithm | FlowJo V10.7.1 | BD Biosciences | RRID:SCR_008520 | |
| Software, algorithm | Freestyle V1.5 | Thermo Scientific | N/A | |
| Software, algorithm | Trace Finder V4.0 | Thermo Scientific | N/A | |
| Software, algorithm | Compound Discoverer V3.1 | Thermo Scientific | N/A | |
| Chemical compound, drug | Formic Acid Optima | Fisher | Cat# A11750 | |
| Chemical compound, drug | Ammonium acetate, Optima | Fisher | Cat# A11450 | |
| Chemical compound, drug | Ammonium hydroxide, Optima | Fisher scientific | Cat# A470-250 | |
| Chemical compound, drug | Methotrexate | Selleck Chem | Cat# S1210 | |
| Chemical compound, drug | SplashMix | Avanti | Cat# 330707 |
Additional files
Download links
A two-part list of links to download the article, or parts of the article, in various formats.
Downloads (link to download the article as PDF)
Open citations (links to open the citations from this article in various online reference manager services)
Cite this article (links to download the citations from this article in formats compatible with various reference manager tools)
Metabolomic profiling of rare cell populations isolated by flow cytometry from tissues
eLife 10:e61980.
https://doi.org/10.7554/eLife.61980


