Cancer immunotherapy by NC410, a LAIR-2 Fc protein blocking human LAIR-collagen interaction
- Center for Translational Immunology, University Medical Center Utrecht, Utrecht University, Netherlands
- Oncode Institute, Netherlands
- NextCure, United States
- Nordic Bioscience, Denmark
- Department of Pathology, University Medical Center Utrecht, Utrecht University, Netherlands
Figures
Figure 1 with 1 supplement
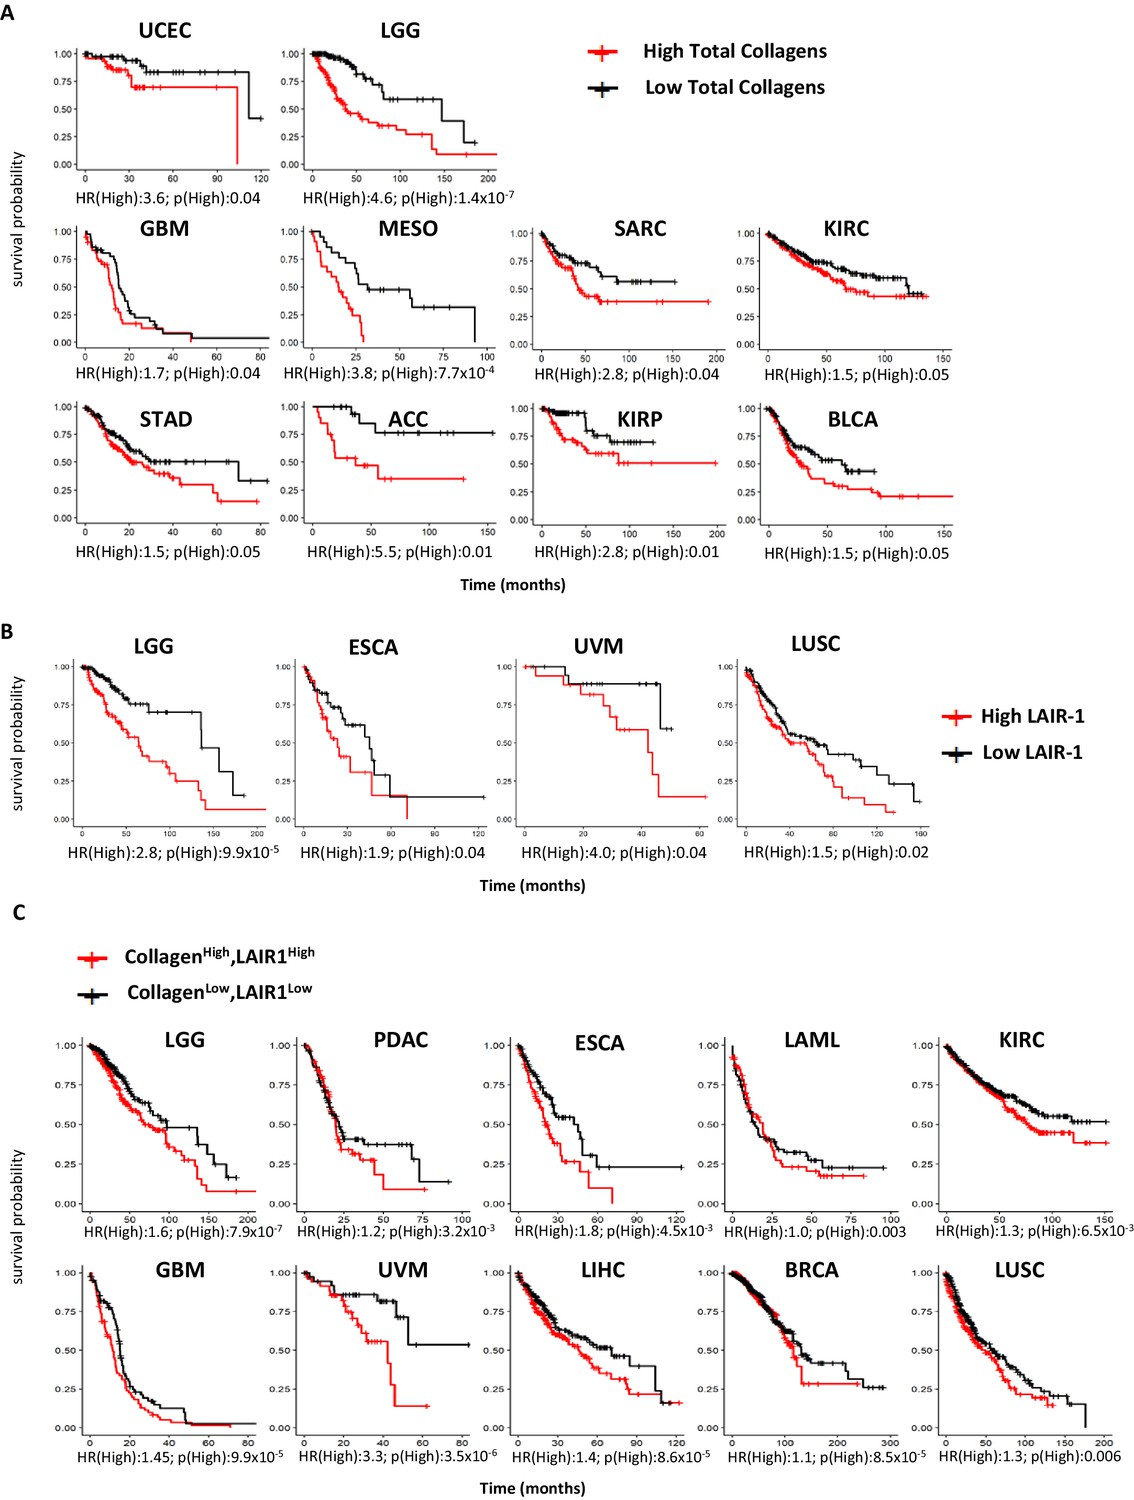
High expression of total collagens and LAIR-1 is associated with reduced overall survival.
The expression of 43 collagen genes, LAIR-1 and LAIR-2 in normal (gray) and tumor tissue (red) were queried using TCGA database. (A) The expression of 43 different collagen genes was assessed together for association with overall survival. The log2 transformed average collagen expression was divided into four quantiles individually for each tumor type. The patients in lower quantile (black) were considered as individuals with low expression and those in the upper quantile (red) were considered as those with high expression, respectively. Tumor types in which poor overall survival associated with collagen overexpression are shown: uterine corpus endometrial carcinoma (UCEC), brain lower grade glioma (LGG), glioblastoma multiforme (GBM), mesothelioma (MESO), sarcoma (SARC), kidney renal clear cell carcinoma (KIRC), stomach adenocarcinoma (STAD), adrenocortical carcinoma (ACC), kidney renal papillary cell carcinoma (KIRP) and bladder urothelial carcinoma (BLCA). (B) Patients were grouped into four quantiles with low 25% quantile (black) and high 25% quantile (red) of LAIR-1 mRNA expression compared for overall survival analysis. Esophageal carcinoma (ESCA), uveal melanoma (UVM) and lung squamous cell carcinoma (LUSC). (C) Collagen expression and LAIR-1 expression were assessed together for association with overall survival. Patients in the lower 25% quantile for both average collagen and LAIR-1 were grouped in the collagenlowLAIR-1low (black), and as collagenhighLAIR-1high if they were in the high 25% quantile (red) for both collagen and LAIR-1. Pancreatic adenocarcinoma (PDAC), acute myeloid leukemia (LAML), liver hepatocellular carcinoma (LIHC) and breast invasive carcinoma (BRCA). Hazards ratio indicating if high expression is associated with poor survival (HR(High)), and p-value (p(High)) indicating the significance of association was determined using Wald test as indicated on the x-axis.
Figure 1—figure supplement 1
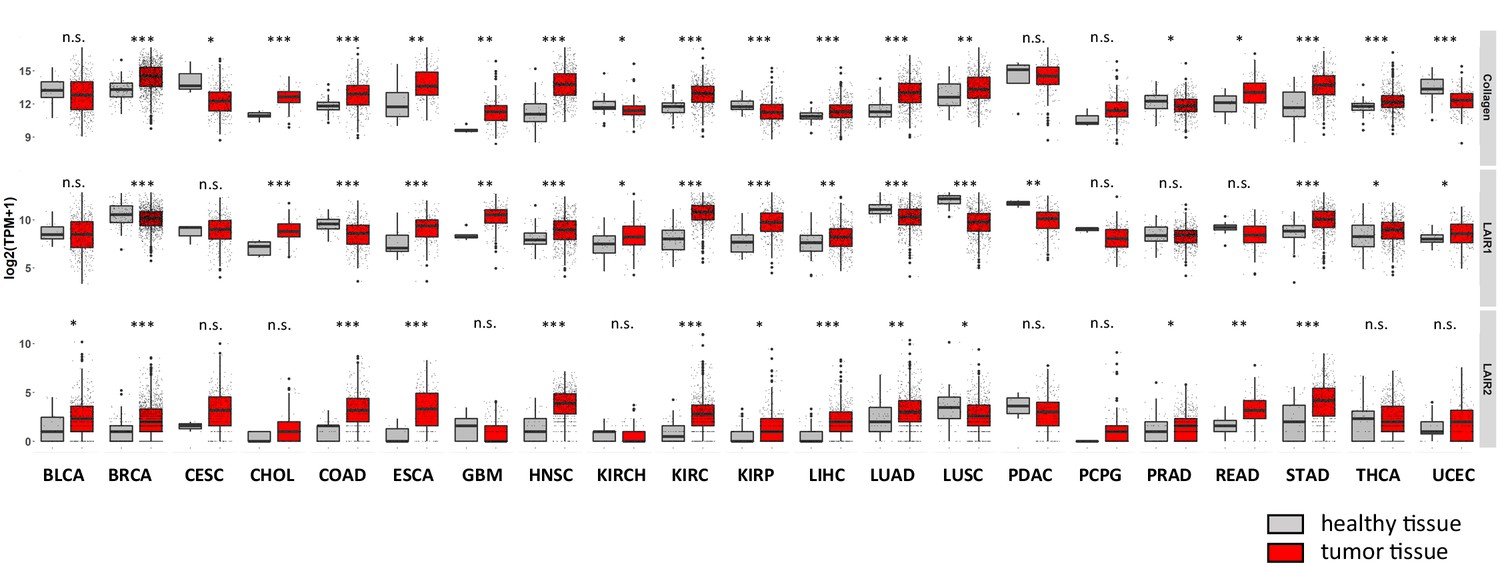
Expression of total collagens, LAIR-1 and LAIR-2 in healthy and tumor tissues.
The expression of total collagens (43 collagen chains), LAIR-1 and LAIR-2 in normal (gray) and tumor tissue (red) was queried using TCGA database: bladder urothelial carcinoma (BLCA), breast invasive carcinoma (BRCA), cervical squamous cell carcinoma and endocervical adenocarcinoma (CESC), cholangiocarcinoma (CHOL), colon adenocarcinoma (COAD), esophageal carcinoma (ESCA), glioblastoma multiforme (GBM), head and neck squamous cell carcinoma (HNSC), kidney chromophobe (KICH), kidney renal clear cell carcinoma (KIRC), kidney renal papillary cell carcinoma (KIRP), liver hepatocellular carcinoma (LIHC), lung adenocarcinoma (LUAD), lung squamous cell carcinoma (LUSC), pancreatic adenocarcinoma (PDAC), pheochromocytoma and paraganglioma (PCPG), prostate adenocarcinoma (PRAD), rectum adenocarcinoma (READ), stomach adenocarcinoma (STAD), thyroid carcinoma (THCA) and uterine corpus endometrial carcinoma (UCEC). *p<0.05, **p<0.01, ***p<0.001, multiple comparisons correction.
Figure 2 with 1 supplement
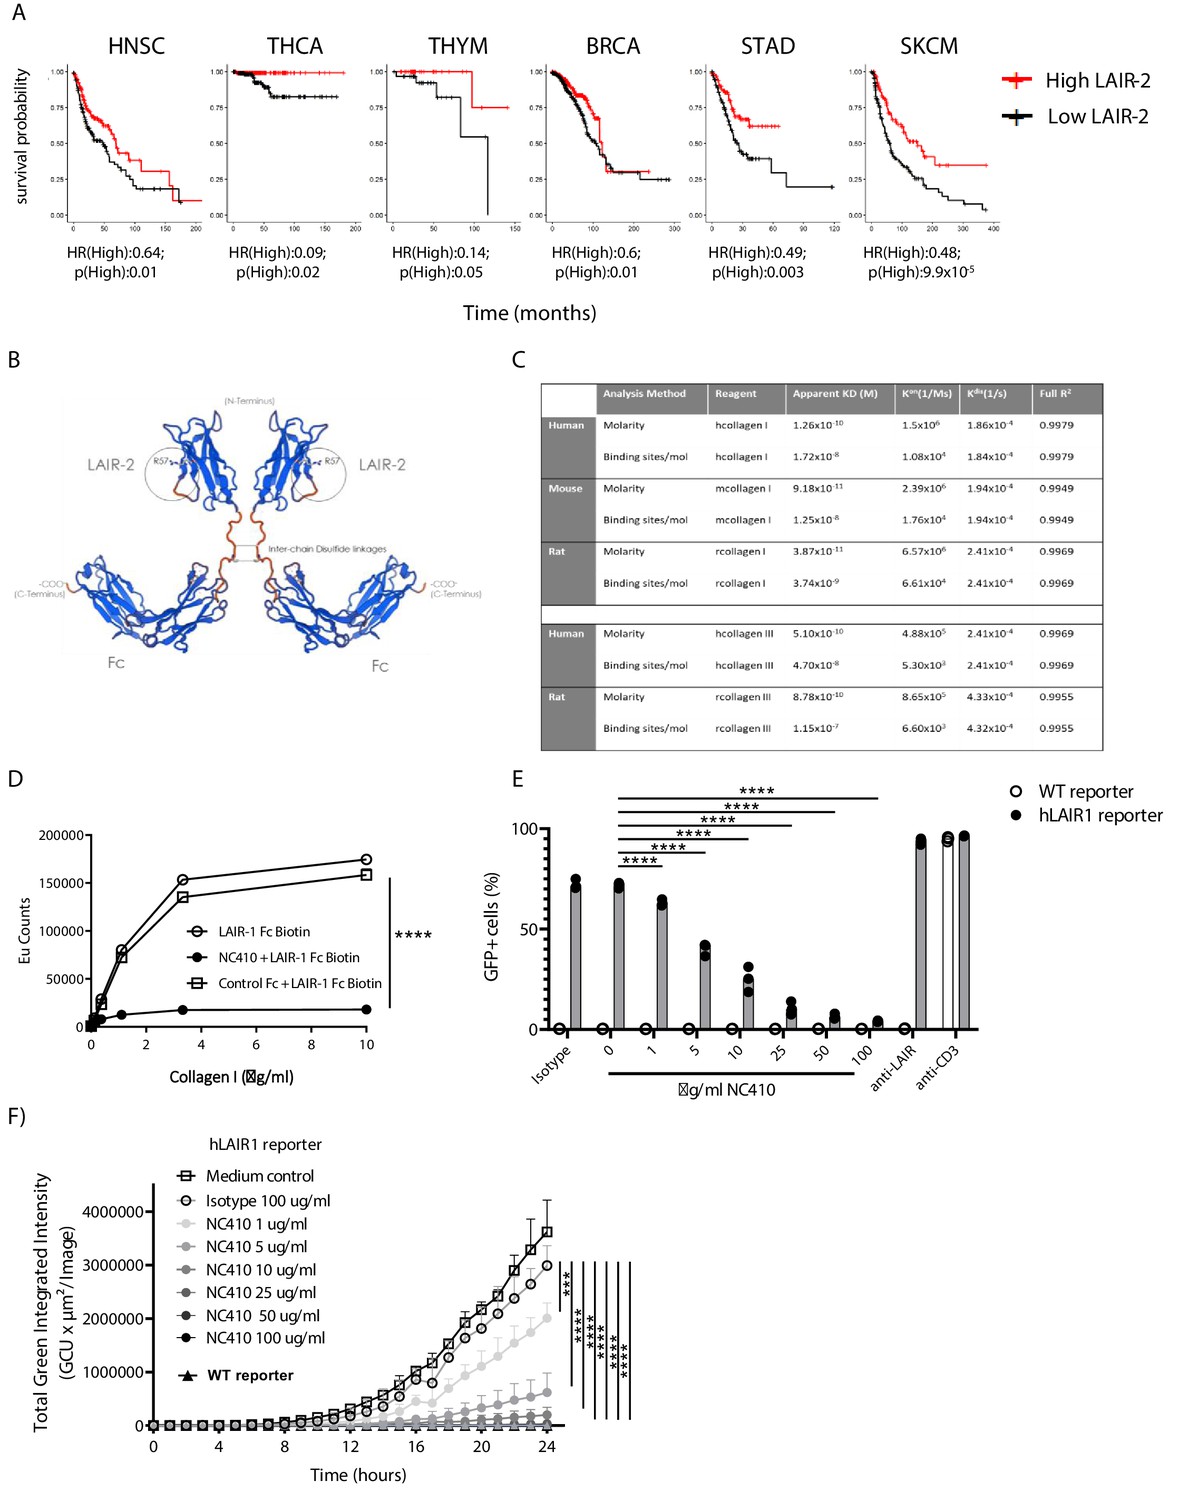
Development of NC410, a LAIR-2 Fc protein that blocks LAIR-1-collagen interaction.
(A) LAIR-2 overexpression is associated with improved overall survival in some tumors: head and neck squamous cell carcinoma (HNSC), thyroid carcinoma (THCA), thymoma (THYM) and skin cutaneous melanoma (SKCM). Patients were grouped in low 25% quantile (black) and high 25% quantile (red) of LAIR-2 mRNA expression for overall survival analysis. Hazards ratio indicating if high expression is associated with poor survival (HR(High)), and p-value (p(High)) indicating the significance of association was determined using Wald test as indicated. (B) NC410 is a biologic fusing LAIR-2 with a functional IgG1 to generate a dimeric fusion protein. (C) Avidity characterization of NC410 to human, mouse and rat collagen I and III as measured by Octet analysis. (D) Indicated amounts of collagen I were plate coated, and the binding of soluble LAIR-1 was inhibited by NC410. Asterisks indicate statistical significance (****p<0.0001, two-way ANOVA). (E, F) The human LAIR-1 (hLAIR-1) extracellular domain was fused with CD3z and stably expressed in a cell line containing an NFAT-GFP pathway reporter. LAIR-1 ligation and CD3 ligation induce NFAT-GFP signaling. A parental cell line containing the CD3 NFAT-GFP reporter without LAIR-1 was used as control (WT). NC410 protein was added at increasing concentrations and inhibited human collagen I (5 µg/mL)-mediated NFAT-GFP signaling through LAIR-1 binding by (E) FACS analysis and (F) Incucyte microscopy. Total green integrated intensity of WT and hLAIR-1 reporter cells is shown over time. Points represent the median of n = 3 (with experimental triplicates in each independently performed experiment), and the whiskers indicate the 95% confidence interval (CI). Isotype control was used at the highest concentration (100 µg/mL) and showed no inhibition of NFAT-GFP signaling. Anti-human LAIR (8A8 clone) and anti-mouse CD3 were used as positive controls. Closed circles in (F) indicate NC410 treatment, and open circles indicate control treatment. Significant differences between different treatment groups of hLAIR-1 reporter cells are indicated (and tested using a two-way ANOVA with Dunnett’s correction). In all plots: *p≤0.05, **p≤0.01, ***p≤0.001, ****p≤0.0001.
Figure 2—figure supplement 1
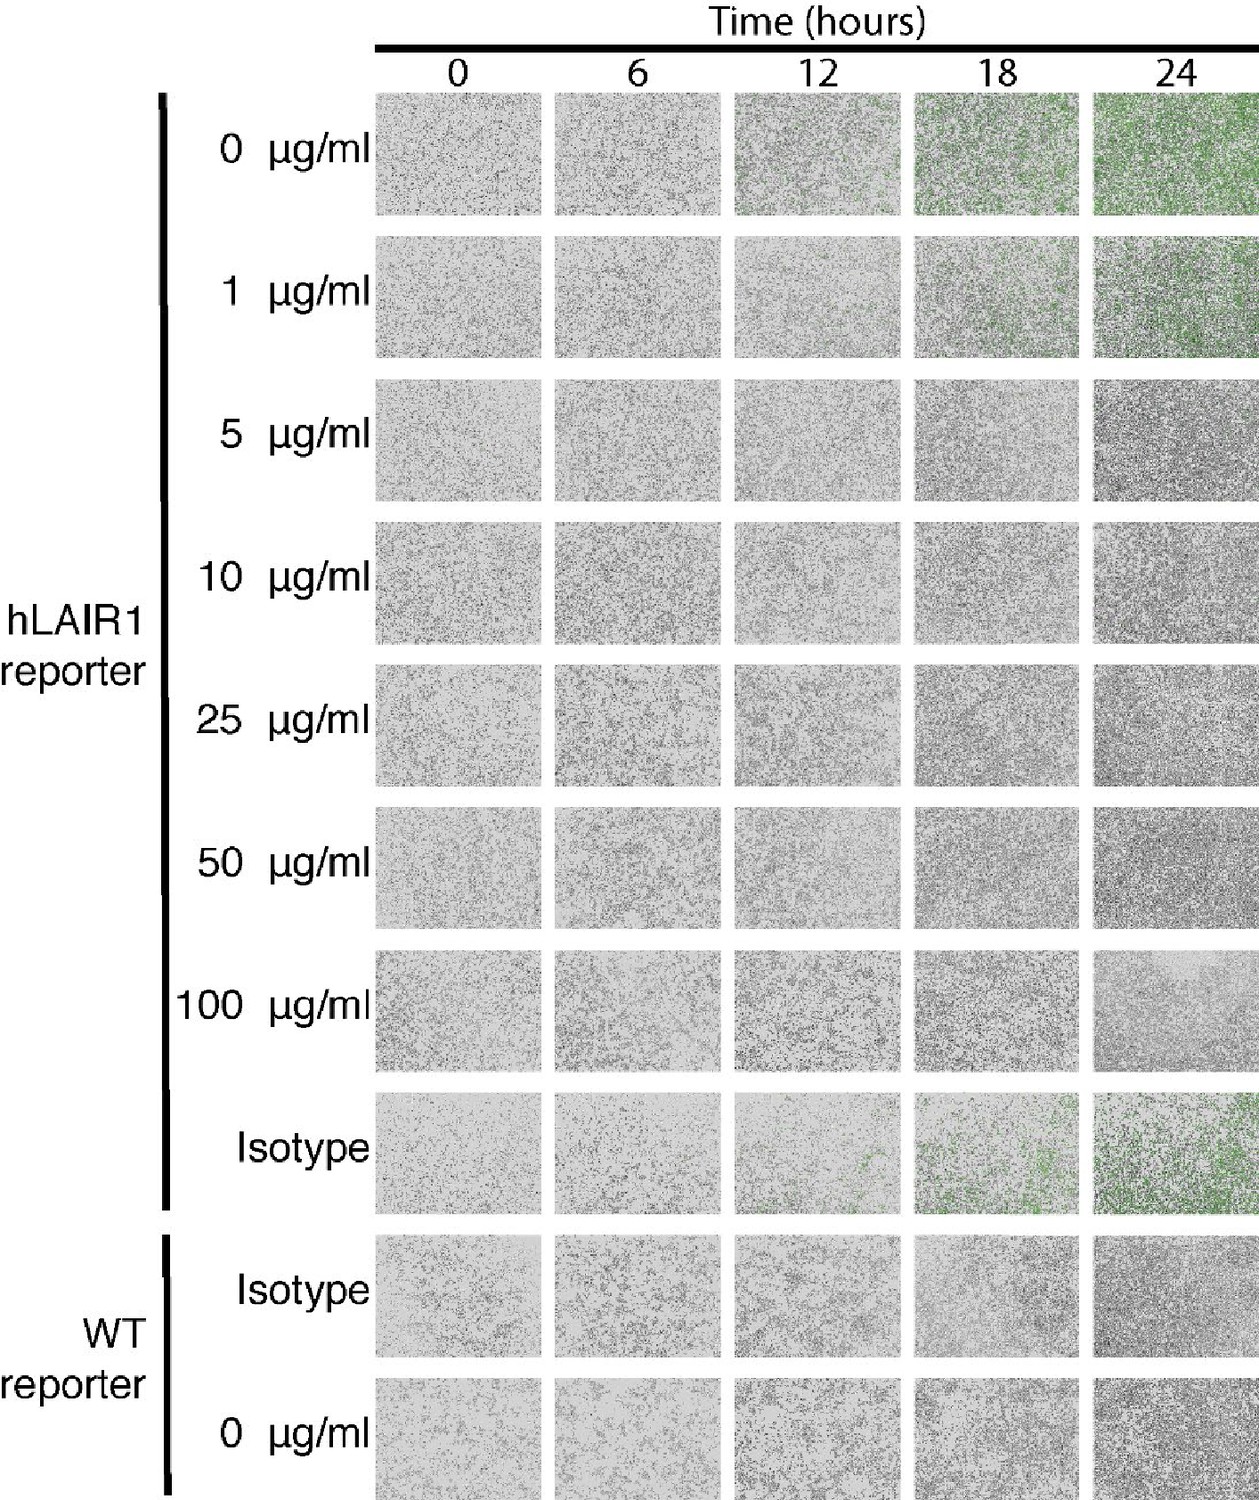
NC410 blocks LAIR-1 functional interactions with collagen.
NC410 dose-response measured by Incucyte imaging during 24 hr. Representative microscopic images (10×) of WT and hLAIR-1 reporter cells over time. NC410 protein was added at increasing concentrations and inhibited collagen I (5 µg/mL)-mediated NFAT-GFP signaling through LAIR-1 binding. Isotype control was used at the highest concentration (100 µg/mL) and showed no inhibition of NFAT-GFP signaling. Pictures were taken every 1 hr for 24 hr. Representative images from one out of three independently performed experiments (each with experimental triplicates).
Figure 3 with 4 supplements
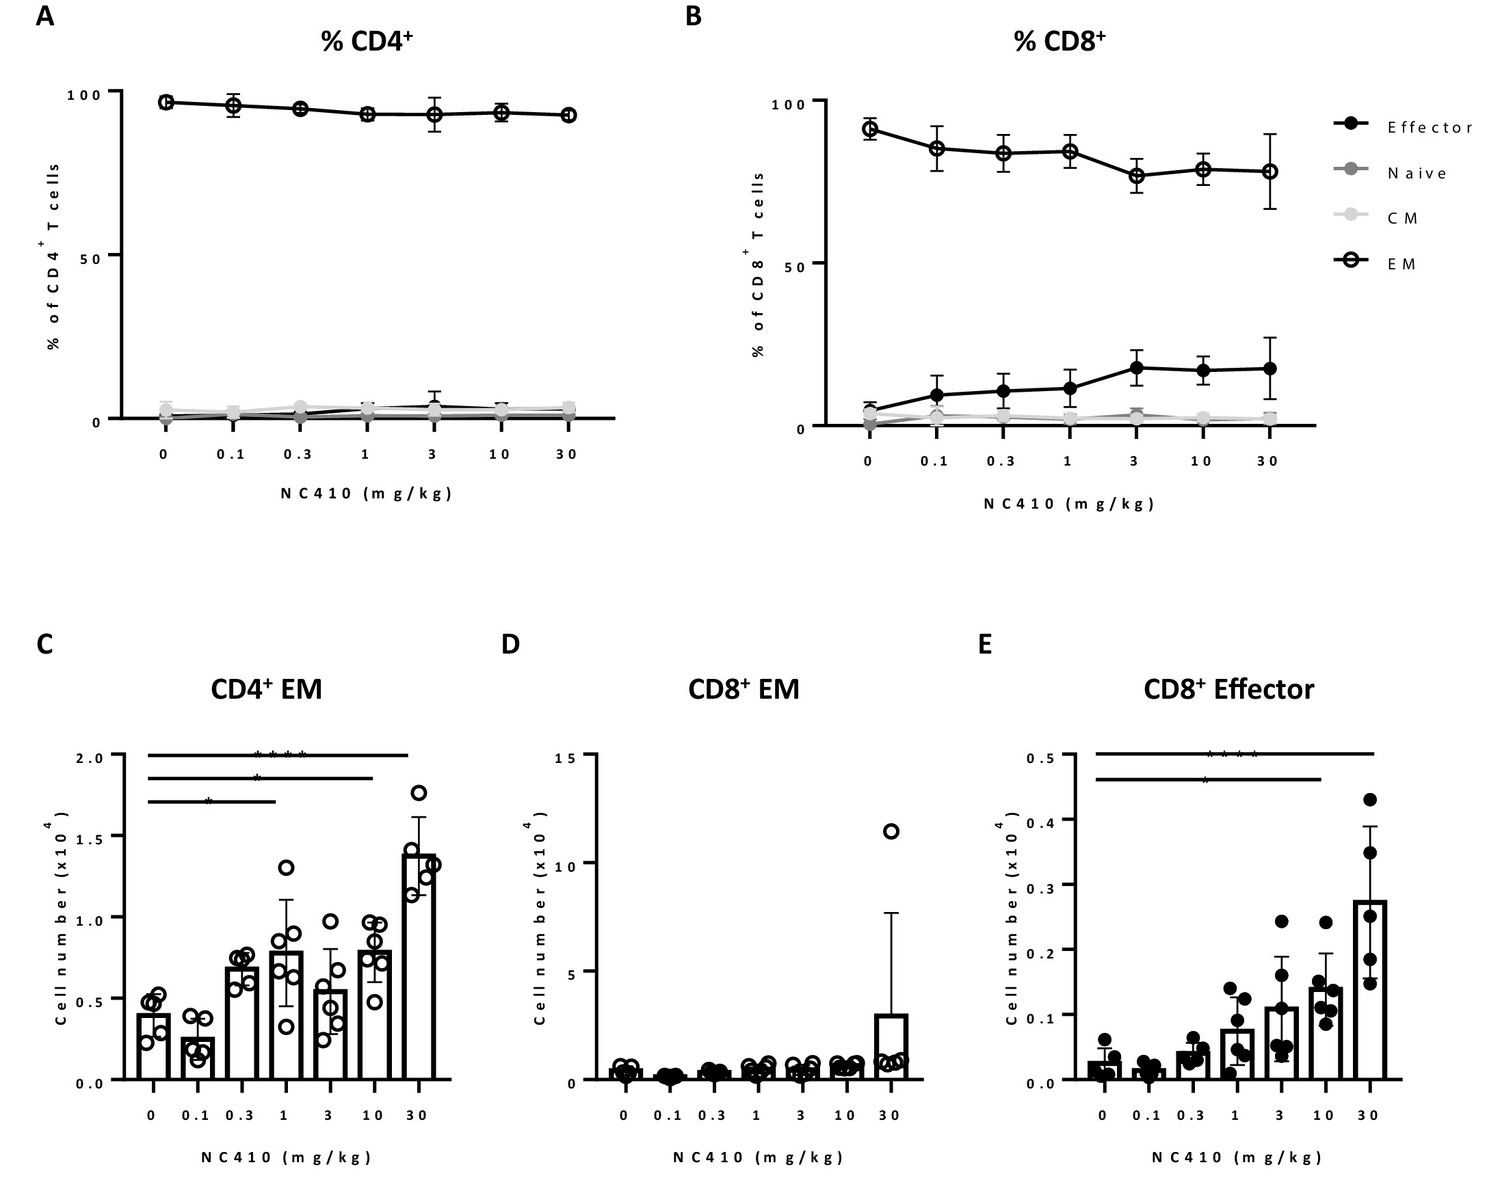
NC410 therapy promotes human T cell expansion in a xenogeneic-graft versus-host disease model.
In a non-tumor model, 1 × 10⁷ total human peripheral blood mononuclear cells were adoptively transferred intravenously to NSG mice (N = 6/group) on day 0. Mice were treated with indicated doses of NC410 by intravenous injection on days 0 and 2. On day 6, mice were euthanized and spleens were analyzed for naïve (CD45RA+CCR7+), central memory (CM, CD45RA-CCR7+), effector memory (EM, CD45RA-CCR7-) and effector (CD45RA+CCR7-) CD4+ (A) and CD8+ (B) T cell populations. The graph shows the percentage of T cell subpopulations as a percentage of total human T cells. (C–E) Cell counts of (C) CD4+EM, (D) CD8+EM and (E) CD8+ effector T cells in the spleen. The graphs show the means ± SD (error bars). Asterisks indicate statistical significance: *p<0.05, **p<0.01, ***p<0.001, ****p<0.0001, one-way ANOVA followed by Tukey’s multiple comparisons.
Figure 3—figure supplement 1
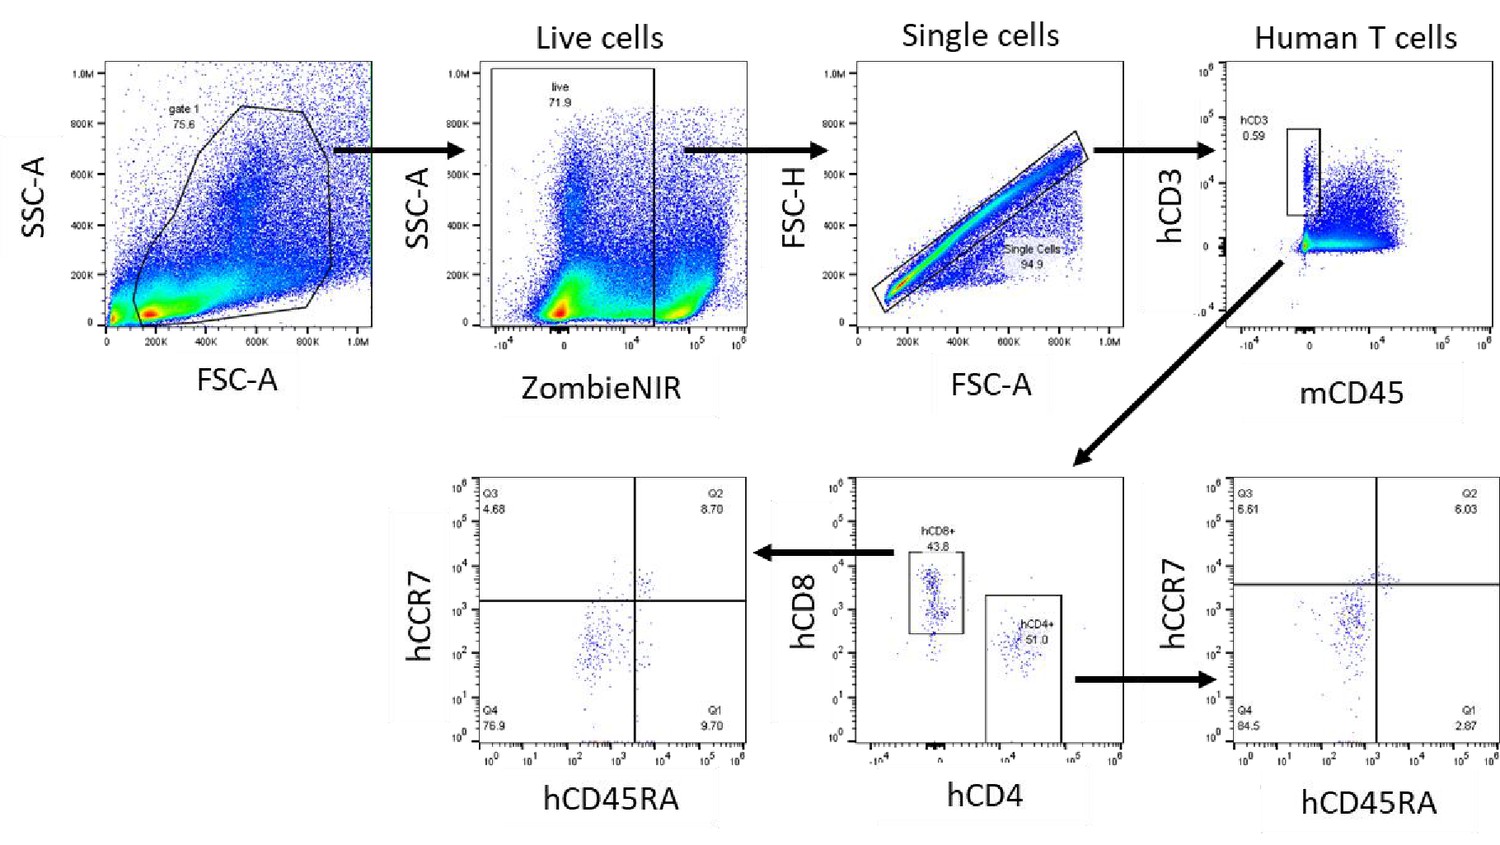
Gating strategy to identify human naïve, memory and effector memory T cell subsets in an NSG non-tumor mouse model.
Human peripheral blood mononuclear cells were transferred into NSG mice, and at day 6 post transfer human T cells subsets were analyzed in the spleen based on CD45RA and CCR7 expression (naïve CD45RA+CCR7+; effector memory CD45RA-CCR7-; central memory CD45RA-CCR7+ and effector CD45RA+CCR7-).
Figure 3—figure supplement 2
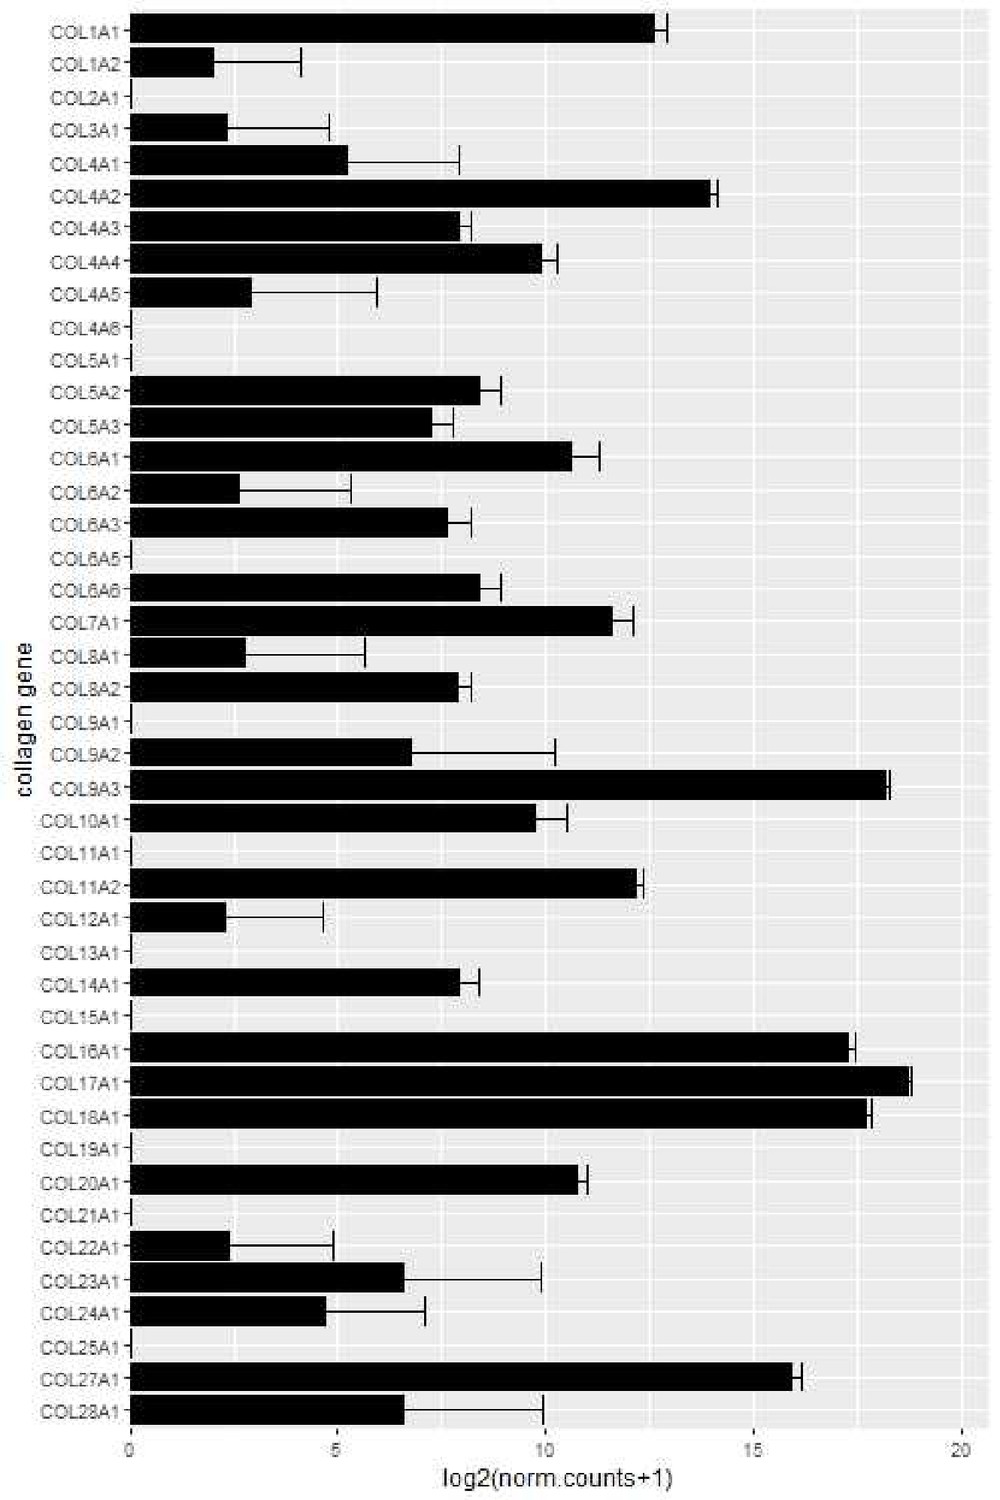
HT-29 mRNA collagen expression by RNA sequencing.
For collagen gene expression analysis of HT-29 cells, data was acquired from the public dataset GSE41586 (https://pubmed.ncbi.nlm.nih.gov/23902433/). Raw count data of untreated HT-29 cells was retrieved and normalized using the DESeq2 package (v1.28.1) in R (v4.0.2). Data was then log2 transformed and plotted using the ggplot package (v3.3.2).
Figure 3—figure supplement 3
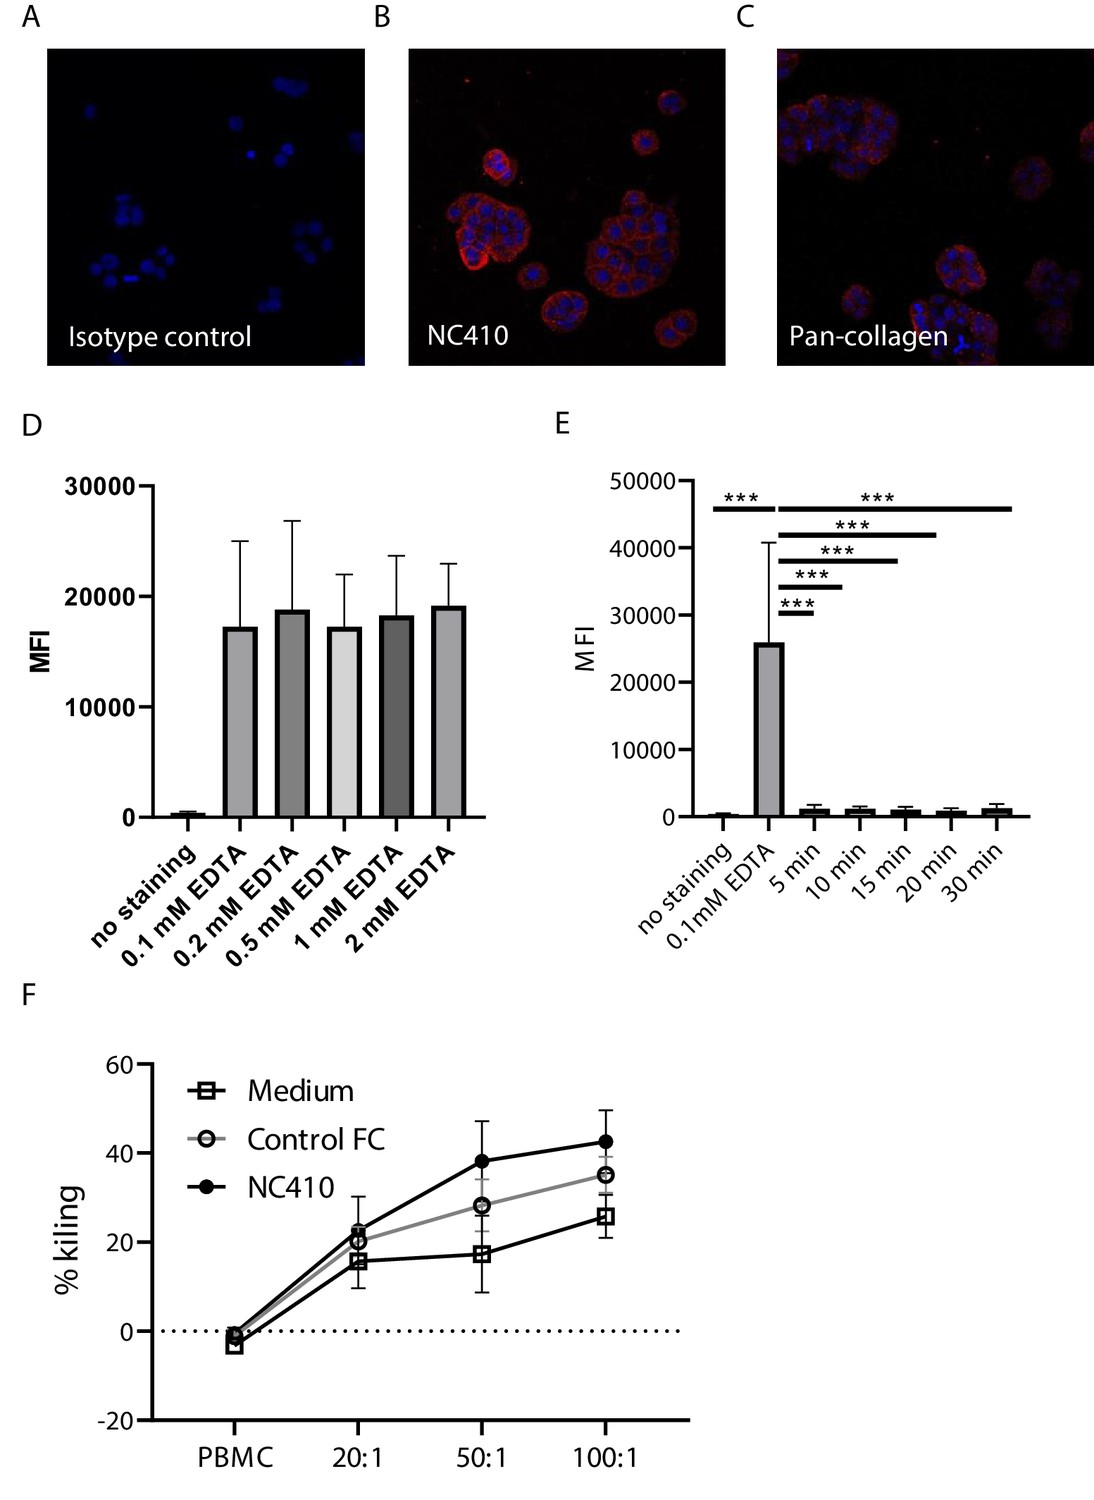
NC410 binds to collagens on HT-29 cells but does not induce antibody-dependent cellular cytotoxicity.
Immunofluorescence analysis of HT-29 cells stained with (A) isotype control, (B) NC410 or (C) pan-collagen antibody. 40× magnification (D) HT-29 cells were removed from culture flasks using increasing concentrations of EDTA for 10 min. Mean fluorescence intensity (MFI) of NC410 staining is shown, demonstrating that EDTA-treated HT-29 cells keep surface collagen expression. (E) HT-29 cells treated with 0.1 mM collagenase lose NC410 binding. Data from three independently performed experiments. (F) In vitro chromium release assay after 24 hr using HT-29 and peripheral blood mononuclear cells at three different effector to target ratios. 20:1 and 50:1 n = 16 and 100:1 n = 25 in 17 independently performed experiments. Closed circles indicate NC410 treatment, and open circles indicate control treatment. The graphs show the means ± SD (error bars). ***p<0.001, two-way ANOVA with Dunnett’s correction.
Figure 3—figure supplement 4
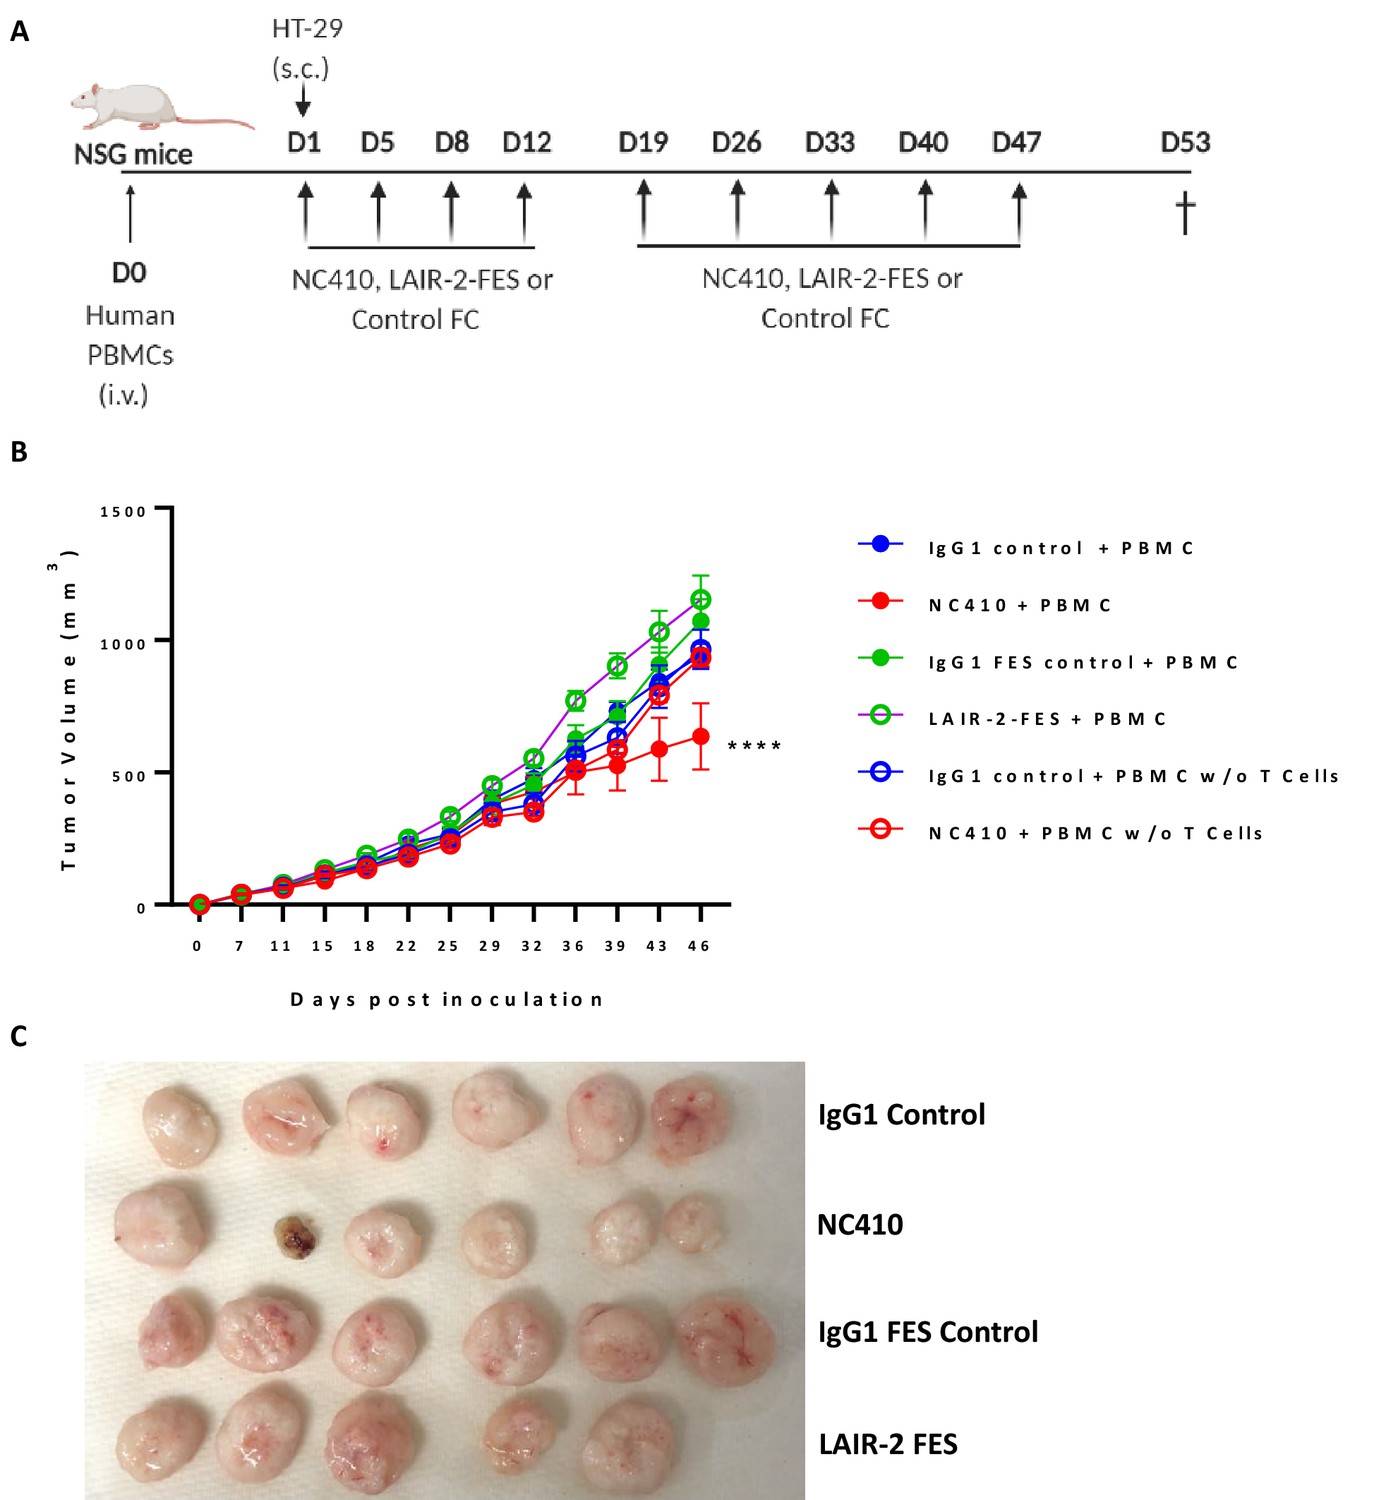
NC410 anti-tumor activity is dependent on T cells and an active IgG1 Fc.
(A) Humanized tumor model (A) of HT-29 tumor injected subcutaneously in the presence of human peripheral blood mononuclear cells (PBMCs). 1 × 10⁷ total human PBMCs with or without T cell depletion were adoptively transferred intravenously to NSG mice (N = 5 or 6/group) on day 0. 1 × 10⁶ HT-29 tumor cells were injected subcutaneously with Matrigel on day 1. Mice were treated with NC410, LAIR-2-FES (Fc dead FES mutant NC410) or controls by intraperitoneal injection, Q4D × 4 doses followed by Q7D until endpoint. Tumor growth was monitored two times a week. (B) Analysis of tumor growth. Asterisks indicate statistical significance compared to control. The graphs show the means ± SD (error bars). ****p<0.0001, two-way ANOVA followed by Tukey’s multiple comparisons. (C) The images of tumors obtained from PBMC-transferred mice on day 53.
Figure 4
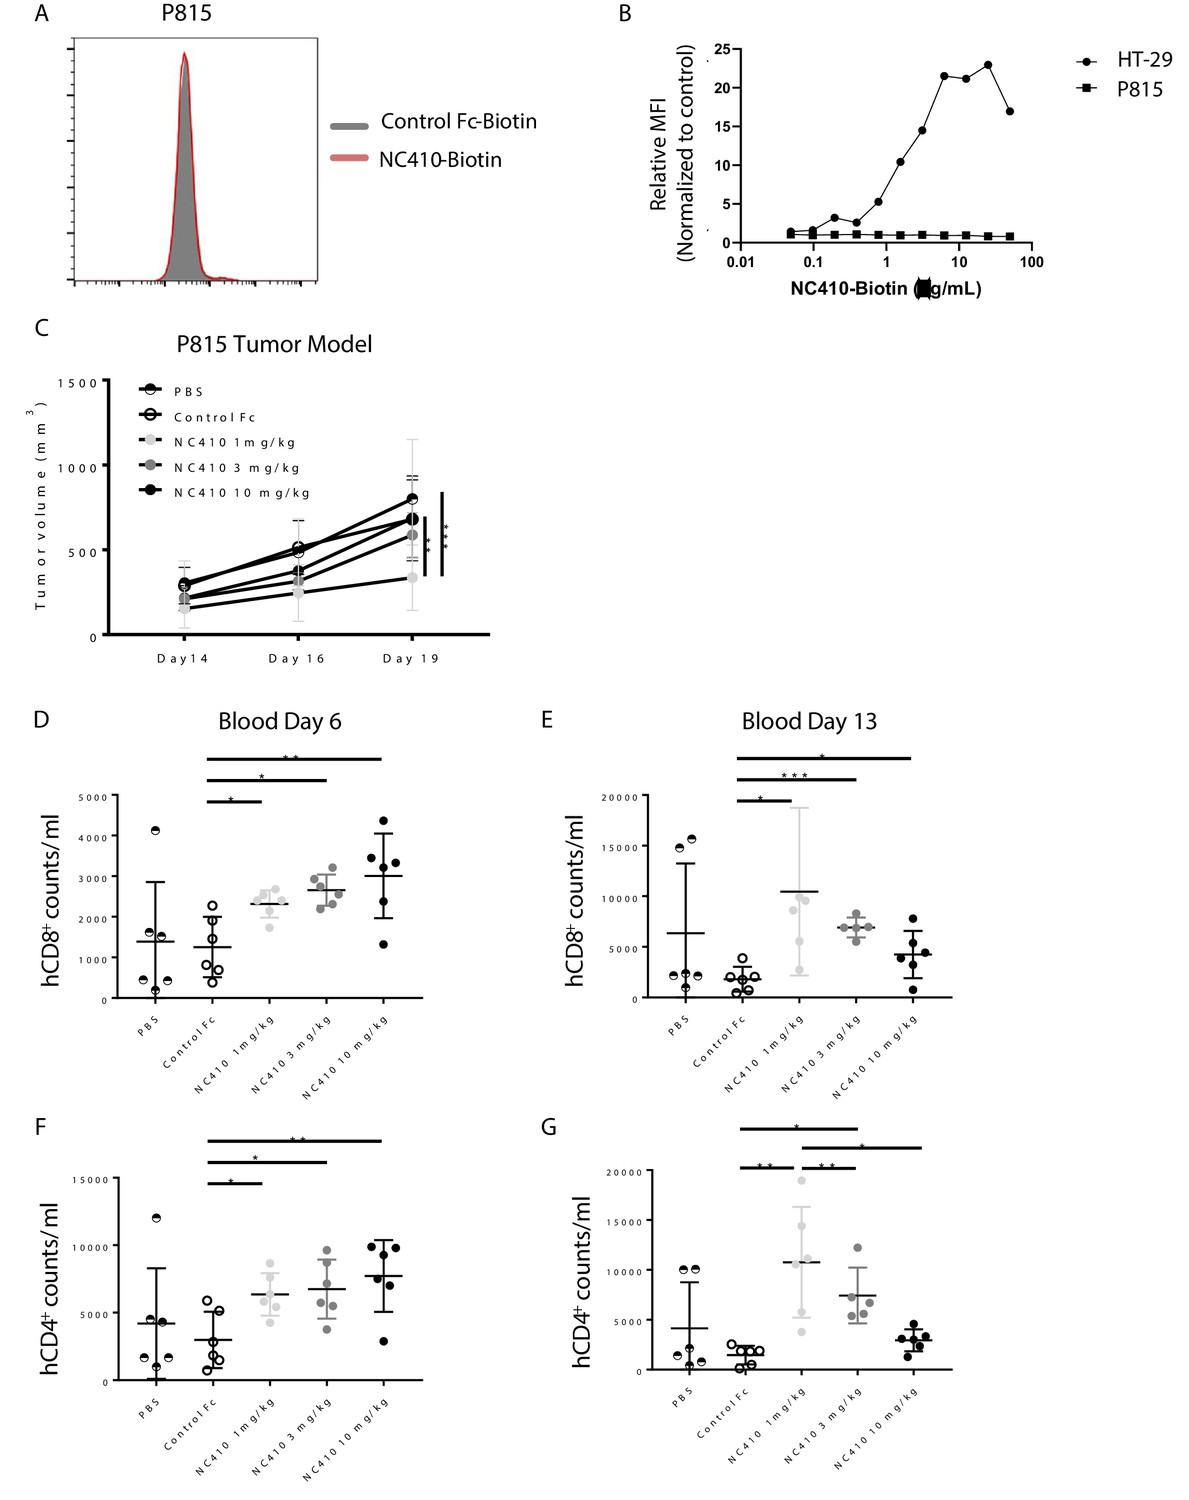
NC410 therapy controls in vivo tumor growth of tumor cells that do not express collagen.
(A) Histogram plot showing mouse P815 tumor cells stained with NC410-biotin or control Fc-biotin. (B) Mouse P815 cells and human HT-29 cells were stained with titrated concentrations of NC410-biotin. (C) 1.5 × 10⁷ total human peripheral blood mononuclear cells were adoptively transferred by intravenous injection to NSG mouse on day 0, and 2 × 10⁵ P815 tumor cells in Matrigel were injected subcutaneously on day 1. Mice were treated on days 1 and 3 with indicated dose of NC410 or control IgG1 (10 mg/kg) by intraperitoneal injection (N = 6/group). P815 tumor was measured every 2–3 days with a caliper, and tumor volume was calculated. Asterisks indicate statistical significance: **p<0.01, ***p<0.001, two-way ANOVA with Sidak multiple comparisons correction. (D–G) CD8+ (D, E) and CD4+ (F, G) T cell analysis of cell numbers in blood on days 6 (D, F) and 13 (E, G). The graphs show the means ± SD (error bars). Asterisks indicate statistical significance: *p<0.05 **p<0.01 ***p<0.001, two-way ANOVA with Sidak multiple comparisons correction.
Figure 5
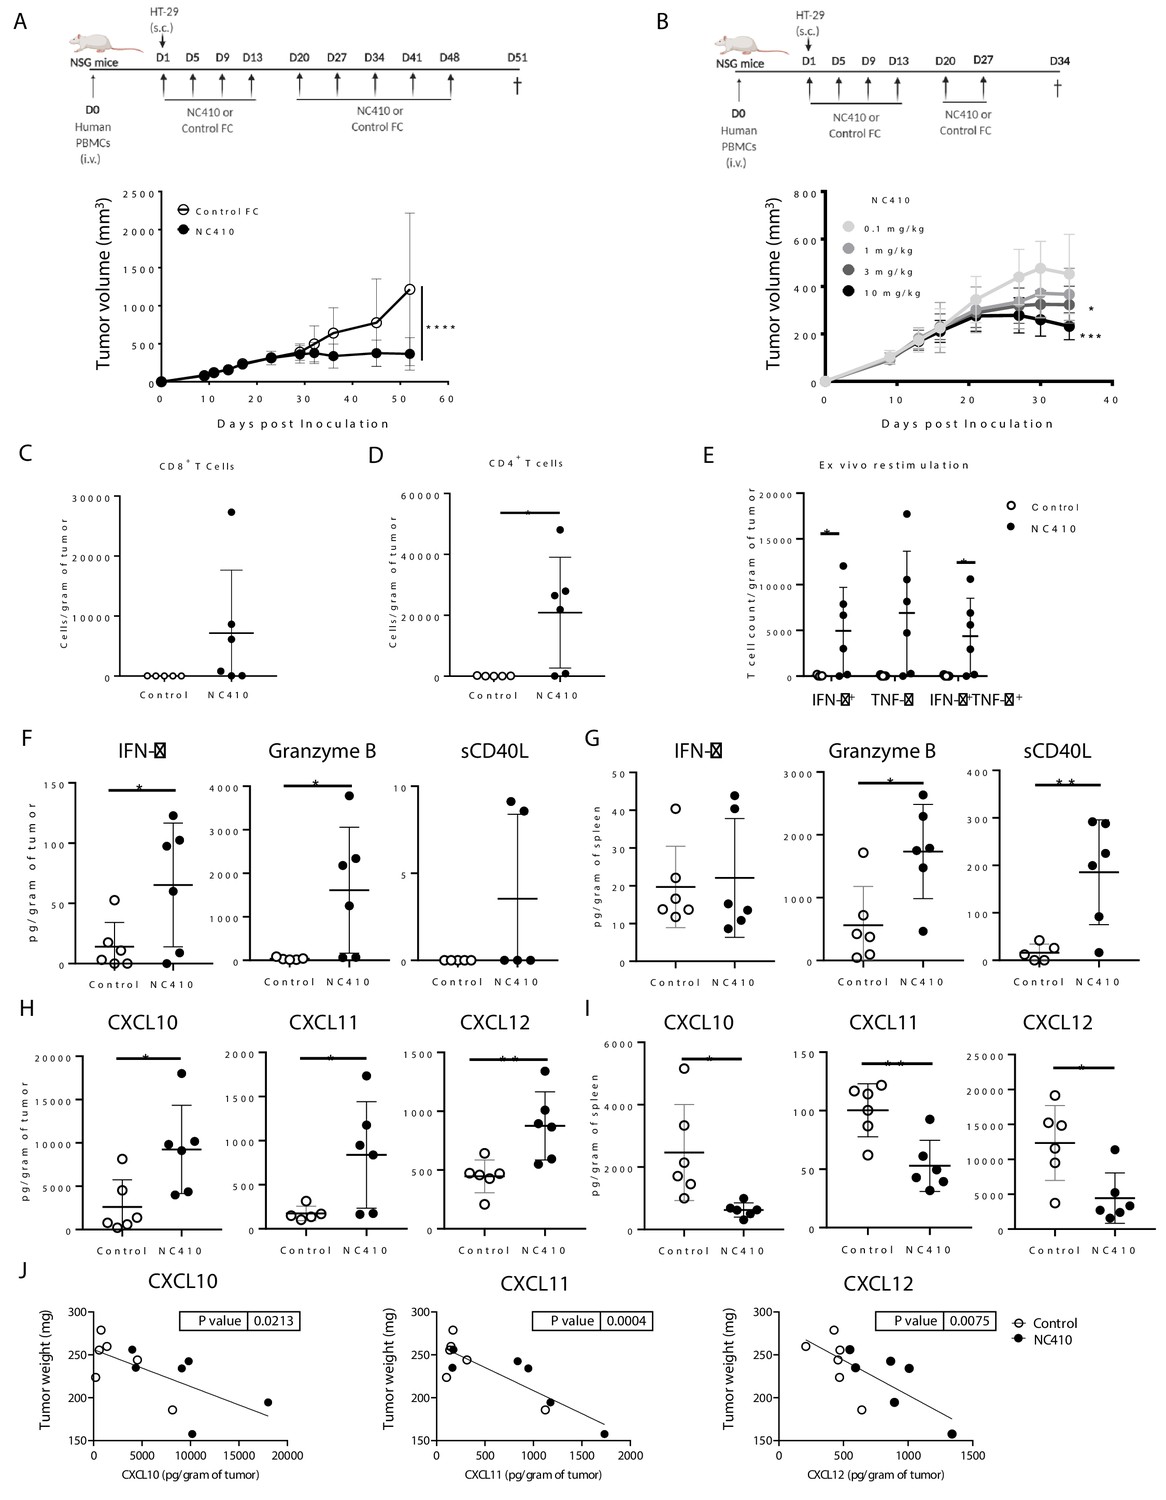
NC410 promotes T cell anti-tumor immunity in an HT-29 humanized tumor model.
(A) Humanized tumor model of HT-29 tumor cells injected subcutaneously in the presence of human peripheral blood mononuclear cells (PBMCs). 2 × 10⁷ total human PBMCs were adoptively transferred intravenously to NSG mice (N = 6/group) on day 0. 1 × 10⁶ HT-29 tumor cells were injected subcutaneously with Matrigel on day 1. Mice were treated with 10 mg/kg NC410 or control by intraperitoneal injection, Q4D × 4 doses followed by Q7D until endpoint. Tumor growth was monitored 1–3 times a week. Asterisks indicate statistical significance: ****p<0.0001, two-way ANOVA with Sidak multiple comparisons correction. (B) Dose-dependent effect of NC410 (N = 6/group). Experimental conditions are the same as (A), with different doses of NC410. Asterisks indicate statistical significance: *p<0.05, ***p<0.001, two-way ANOVA with Tukey's multiple comparisons correction. (C–G) On day 27 after treatment with 10 mg/mL NC410, tumor and spleen tissues were isolated for tumor-infiltrating T cells (TILs) and cytokine analysis. (C) CD4+ and (D) CD8+ TIL cell numbers in the tumor. The cell number was counted by flow cytometry and normalized to weight (gram) of tumor tissue. Asterisks indicate statistical significance: *p<0.05, two-tailed t-test. (E) Cytokine production by TILs following ex vivo restimulation with phorbol 12-myristate 13-acetate (PMA) and ionomycin for 5 hr. Cells were intracellularly stained for IFN-γ and TNF-α, and the indicated cell populations were counted by flow cytometry and normalized to weight (gram) of tumor tissue. Asterisks indicate statistical significance: *p<0.05, two-tailed t-test. (F–I) Tissue lysate protein was extracted from tumor and spleen tissues. Analysis of tumor (F, H) and spleen (G, I) for cytokines (F, G) and chemokines (H, I) for analysis of local and systemic effects, respectively. Cytokines and chemokines were analyzed by Luminex and presented as the relative levels normalized to weight (gram) of tissue. (J) CXCL10, CXCL11 and CXCL12 correlation with tumor weight. The graphs show the means ± SD (error bars). Asterisks indicate statistical significance: *p<0.05, **p<0.01, two-tailed t-test.
Figure 6
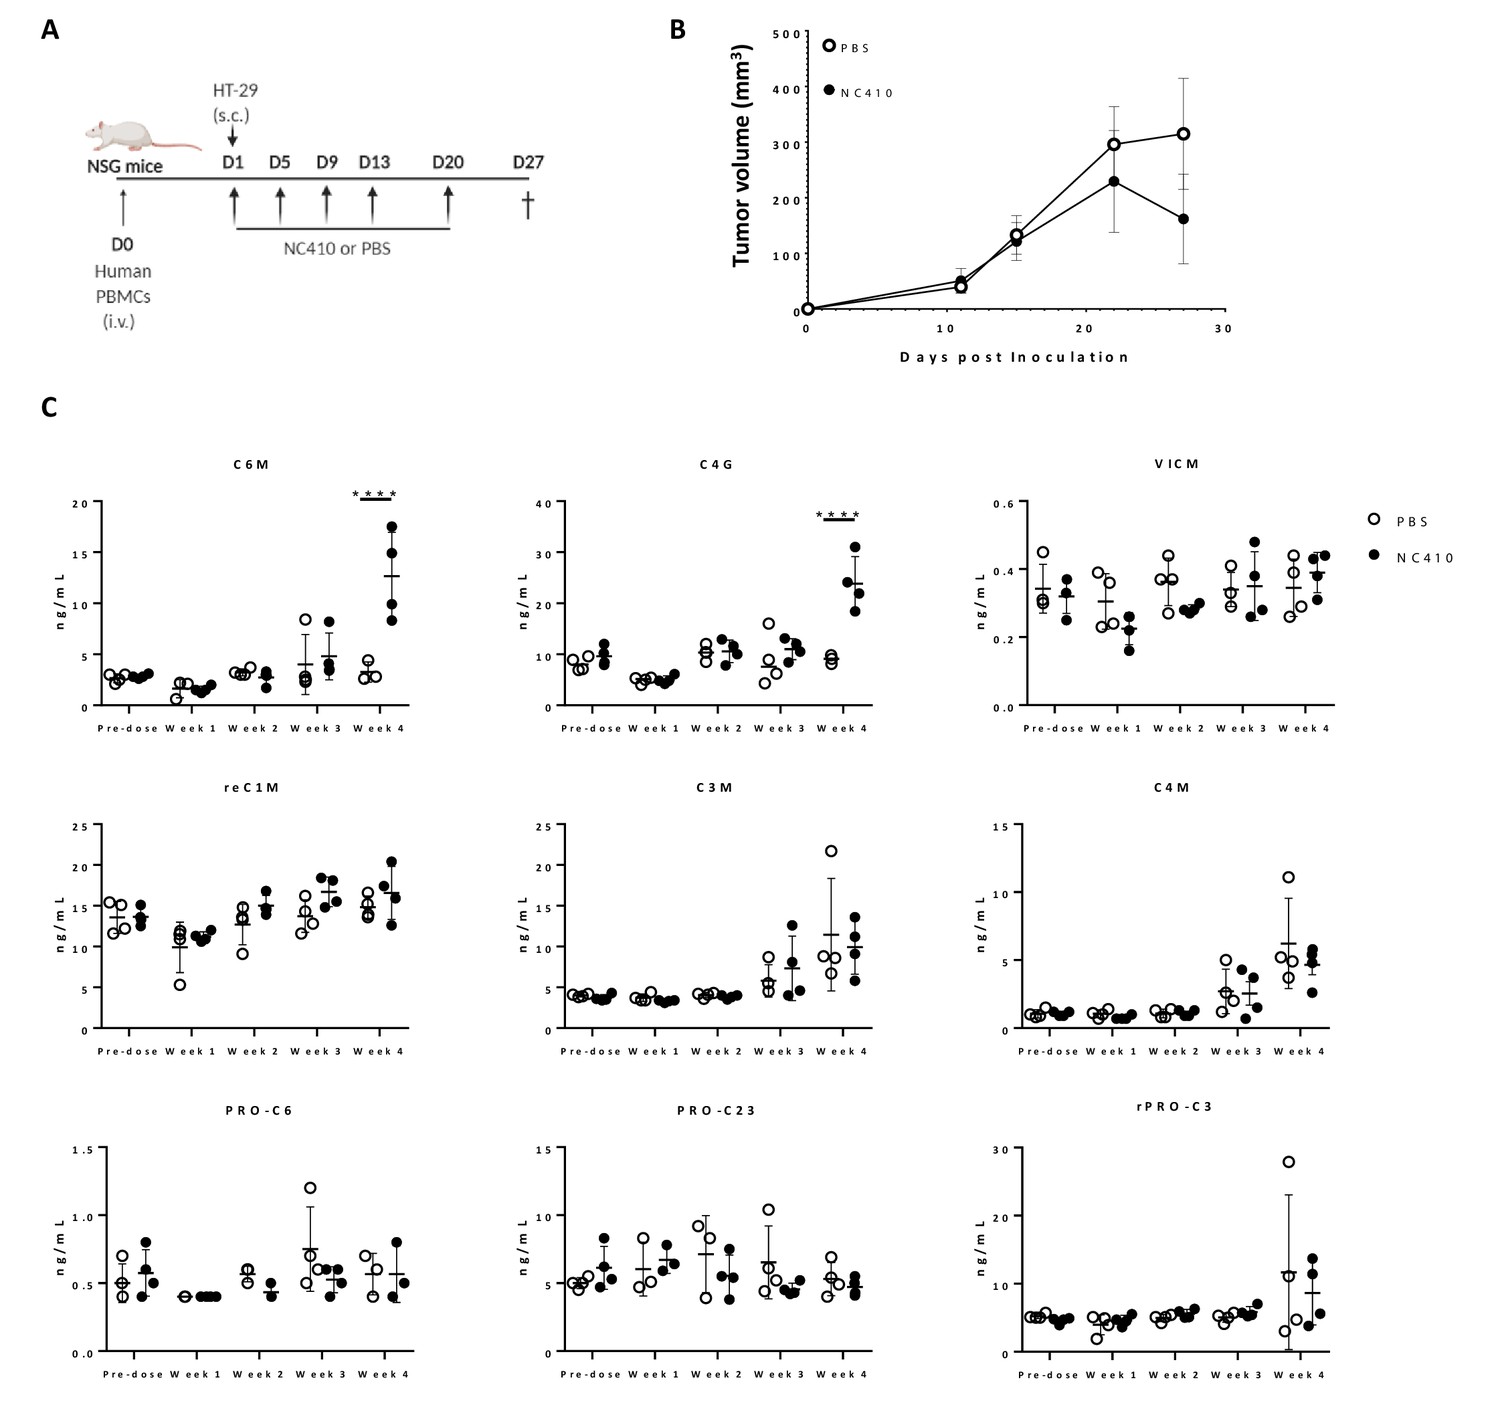
NC410 increases collagen degradation products that correlate with tumor regression.
(A) Schematic representation of the humanized murine tumor model used. HT-29 tumor was injected subcutaneously in the presence of human peripheral blood mononuclear cells. Mice were treated with NC410 or control by intraperitoneal injection, Q4D × 4 doses followed by Q7D until endpoint. Mice were bled prior to start of experiment and weekly for 4 weeks. (B) Tumor growth kinetics with NC410. Asterisks indicate statistical significance: *p<0.05, ****p<0.0001, two-way ANOVA with Sidak multiple comparisons. (C) Analysis of collagen degradation products in serum at baseline, at weeks 1, 2, 3 and 4. reC1M: neo-epitope of MMP-2,9,13-mediated degradation of type I collagen; C3M: type III collagen degradation by MMP; C4M: type IV collagen degradation by MMP; C6M: neo-epitope of MMP-2-mediated degradation of type VI collagen; PRO-C3: pro-peptide of type III collagen/ECM formation/fibroblast activity; PRO-C6: pro-peptide of type VI collagen; VICM: neo-epitope of MMP-2,8, trypsin-mediated degradation of citrullinated vimentin; C4G: type IV collagen degraded by granzyme B (T cell activity/infiltration); closed circles indicate NC410 treatment, and open circles indicate control treatment. The graphs show the means ± SD (error bars). Asterisks indicate statistical significance: ****p<0.0001, two-way ANOVA followed with Sidak multiple comparisons.
Figure 7 with 4 supplements
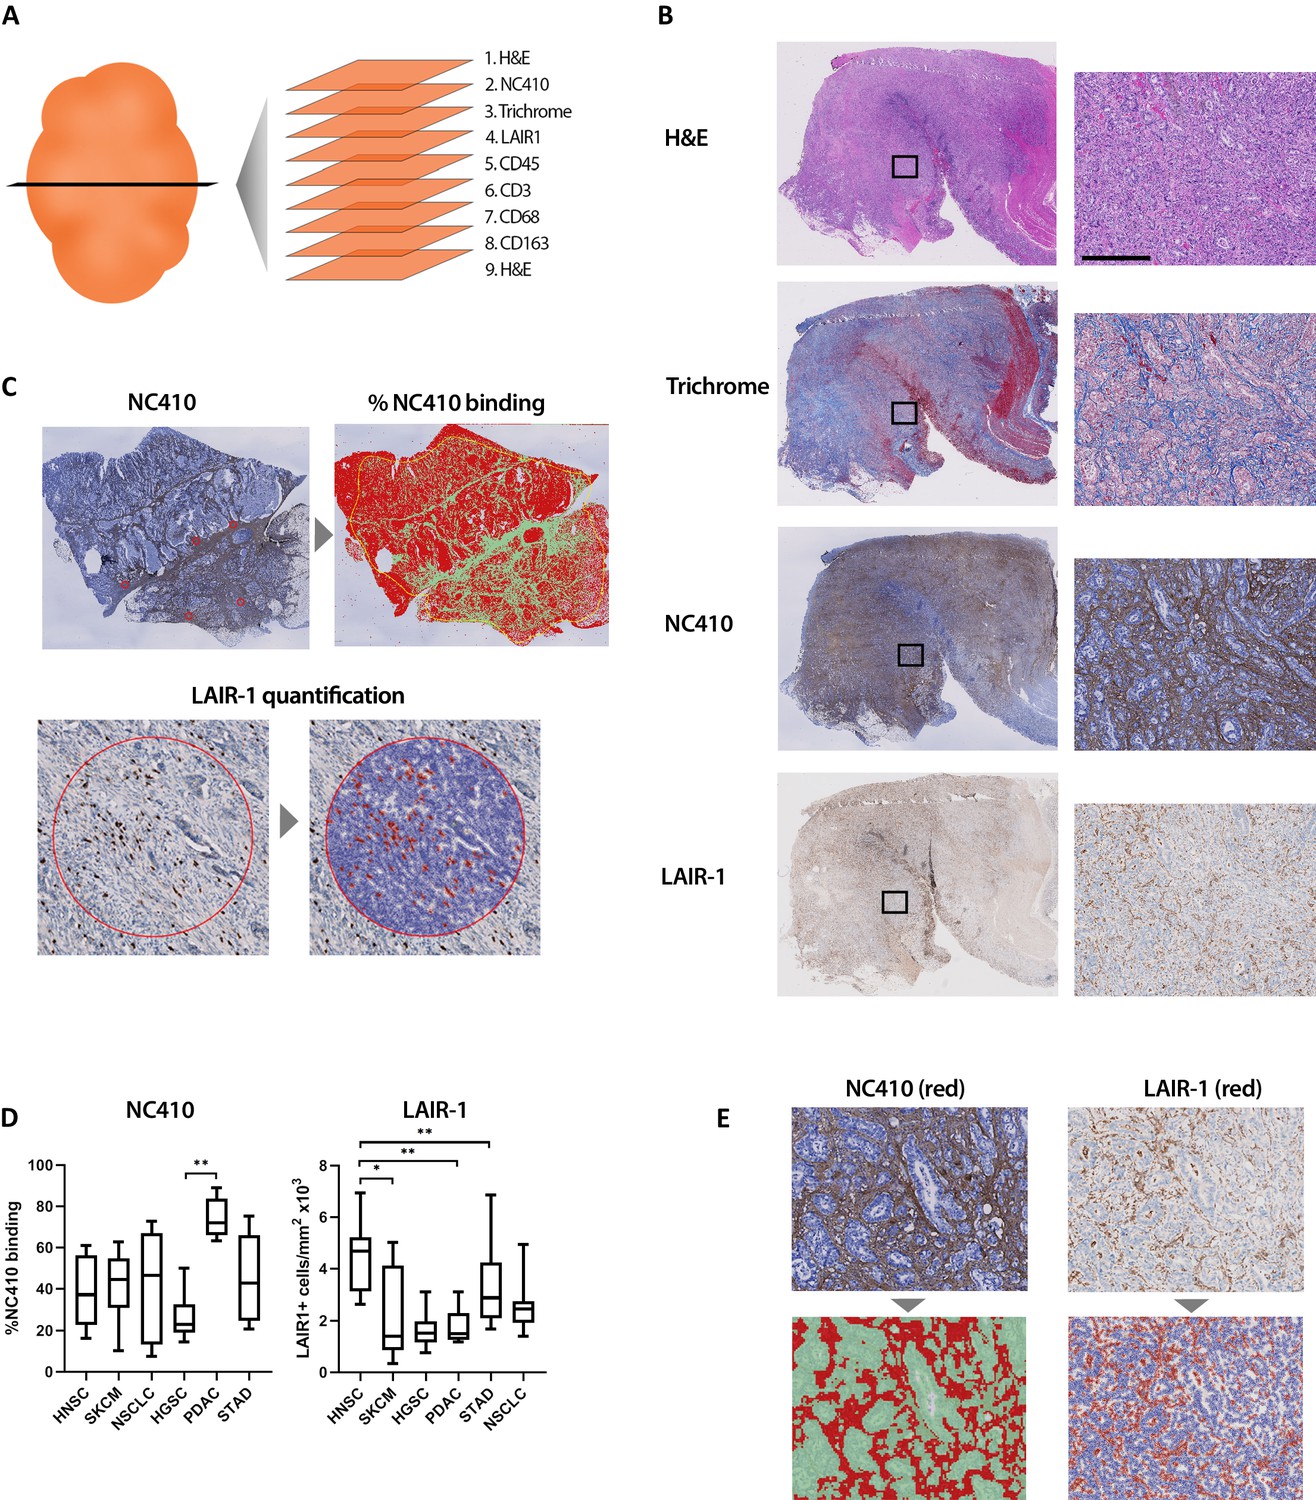
Immunohistochemical characterization of LAIR-1+ cells and LAIR-2 Fc binding in primary human tumors.
(A) Schematic representation of the immunohistochemical stainings performed. (B) Representative hematoxylin and eosin (H&E), Masson Trichrome, NC410 and LAIR-1 staining in a stomach tumor specimen. (C) Representative NC410 and LAIR-1 analysis. The percentage of NC410 binding to tissue within a tumor was calculated by dividing the NC410+ stained area by the total tumor area. The number of LAIR-1+ cells was calculated by dividing the total number of positive cells within five regions of interest (ROIs) by the total surface in mm2 of these ROIs. (D) Quantification of LAIR-1 and NC410 staining of 9–10 patients per tumor type across six different tumor types (head and neck squamous cell carcinoma [HNSC], skin cutaneous melanoma [SKCM], non-small cell lung carcinoma [NSCLC], high-grade serous ovarian carcinoma [HGSC], pancreatic adenocarcinoma [PDAC] and stomach adenocarcinoma [STAD]). (E) Higher magnification pictures of stomach cancer specimens show LAIR-1+ cells (depicted in red, right side) co-localizing with NC410-positive areas (depicted in red, left side).
Figure 7—figure supplement 1
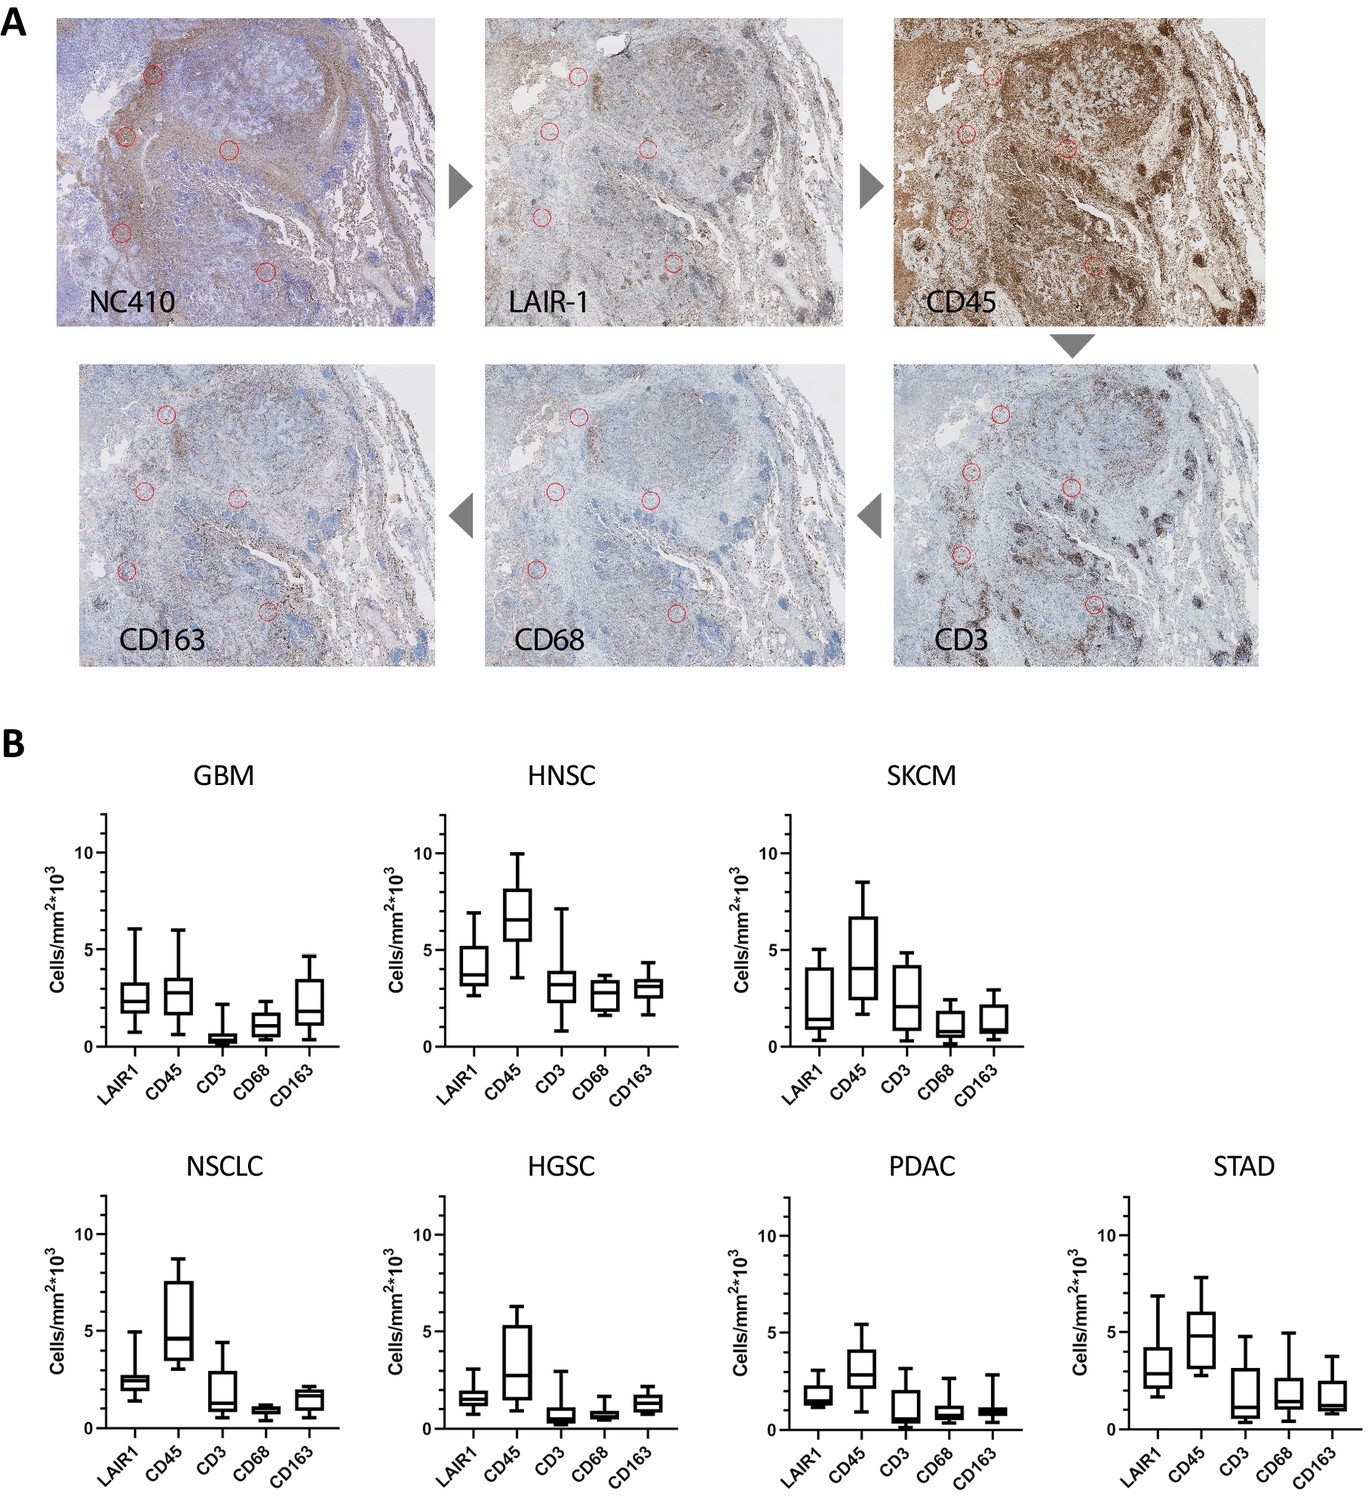
Characterization of LAIR-1+ cells in primary human tumors.
(A) Representative NC410, LAIR-1, CD45, CD3, CD68 and CD163 staining in a stomach tumor specimen. For quantification of the immune cell counts, regions of interest (ROIs) were annotated on the tissue slides by drawing circles with a diameter of 600 µm at five random spots within the NC410-positive part of the tumor. Positive cells were quantified using the Positive Cell Detection tool. (B) Number of positive LAIR-1 mAb, CD45, CD3, CD68 and CD163 cells is shown across seven different tumor types (glioblastoma [GBM], head and neck squamous cell carcinoma [HNSC], skin cutaneous melanoma [SKCM], non-small cell lung carcinoma [NSCLC], high-grade serous ovarian carcinoma [HGSC], pancreatic adenocarcinoma [PDAC] and stomach adenocarcinoma [STAD]).
Figure 7—figure supplement 2
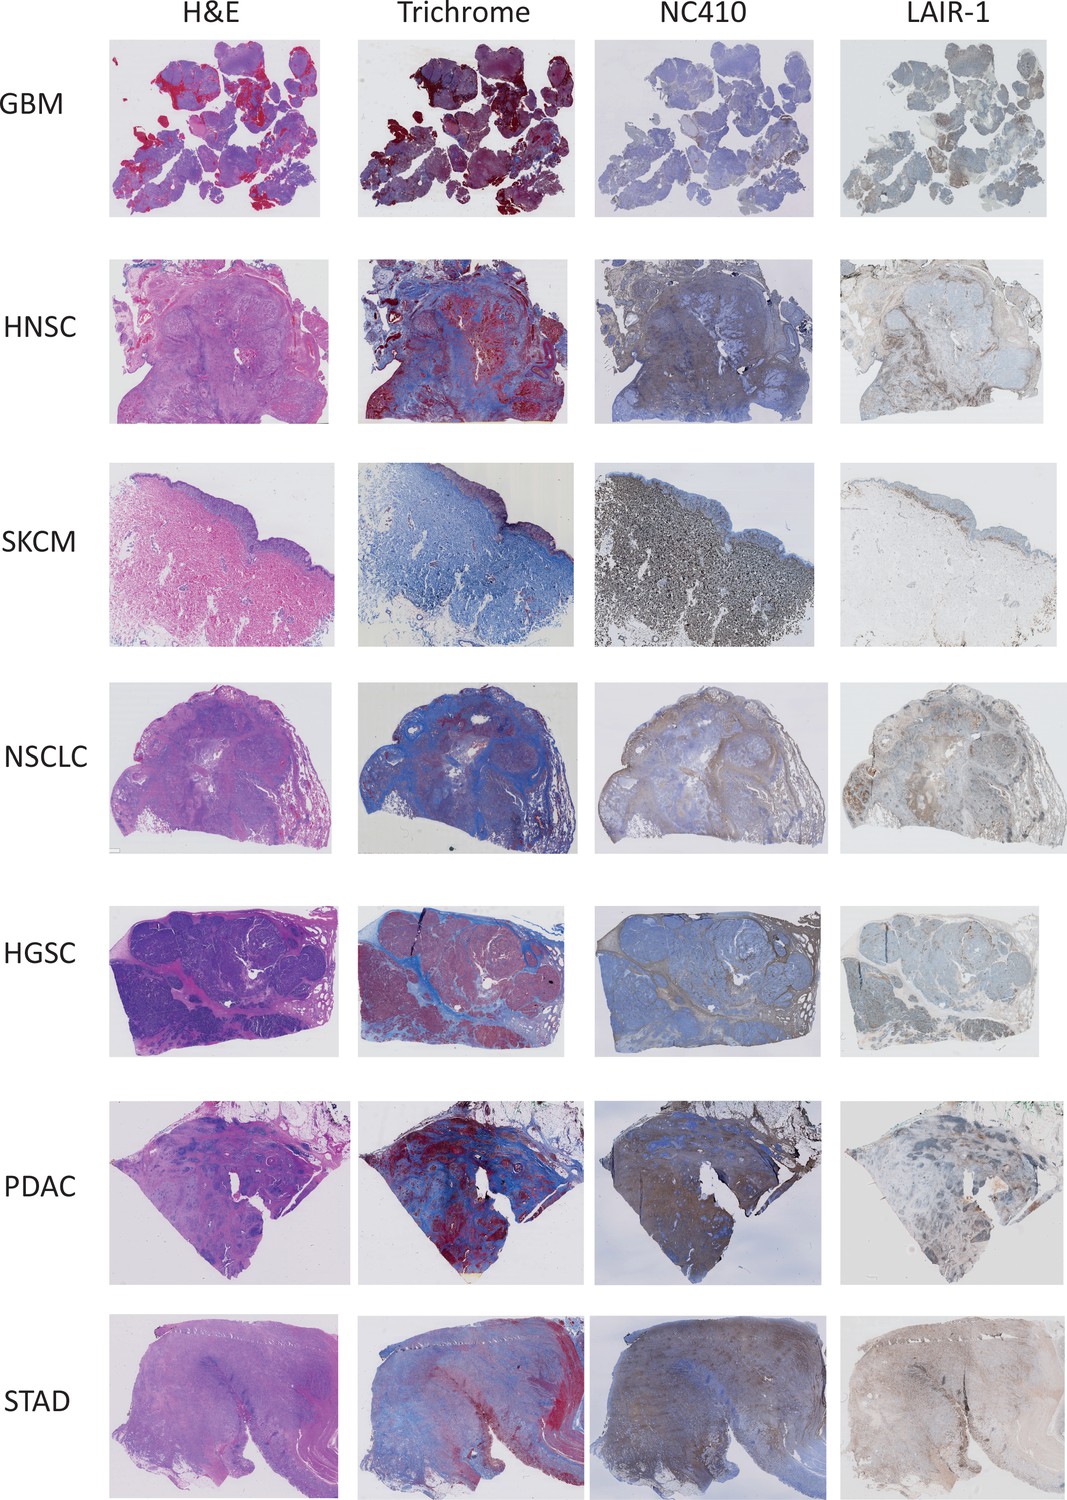
Immunohistochemical analysis of primary human tumors.
Representative hematoxylin and eosin (H&E), Masson Trichrome, NC410 and LAIR-1 staining for seven different tumor types (glioblastoma [GBM], head and neck squamous cell carcinoma [HNSC], skin cutaneous melanoma [SKCM], non-small cell lung carcinoma [NSCLC], high-grade serous ovarian carcinoma [HGSC], pancreatic adenocarcinoma [PDAC] and stomach adenocarcinoma [STAD]).
Figure 7—figure supplement 3
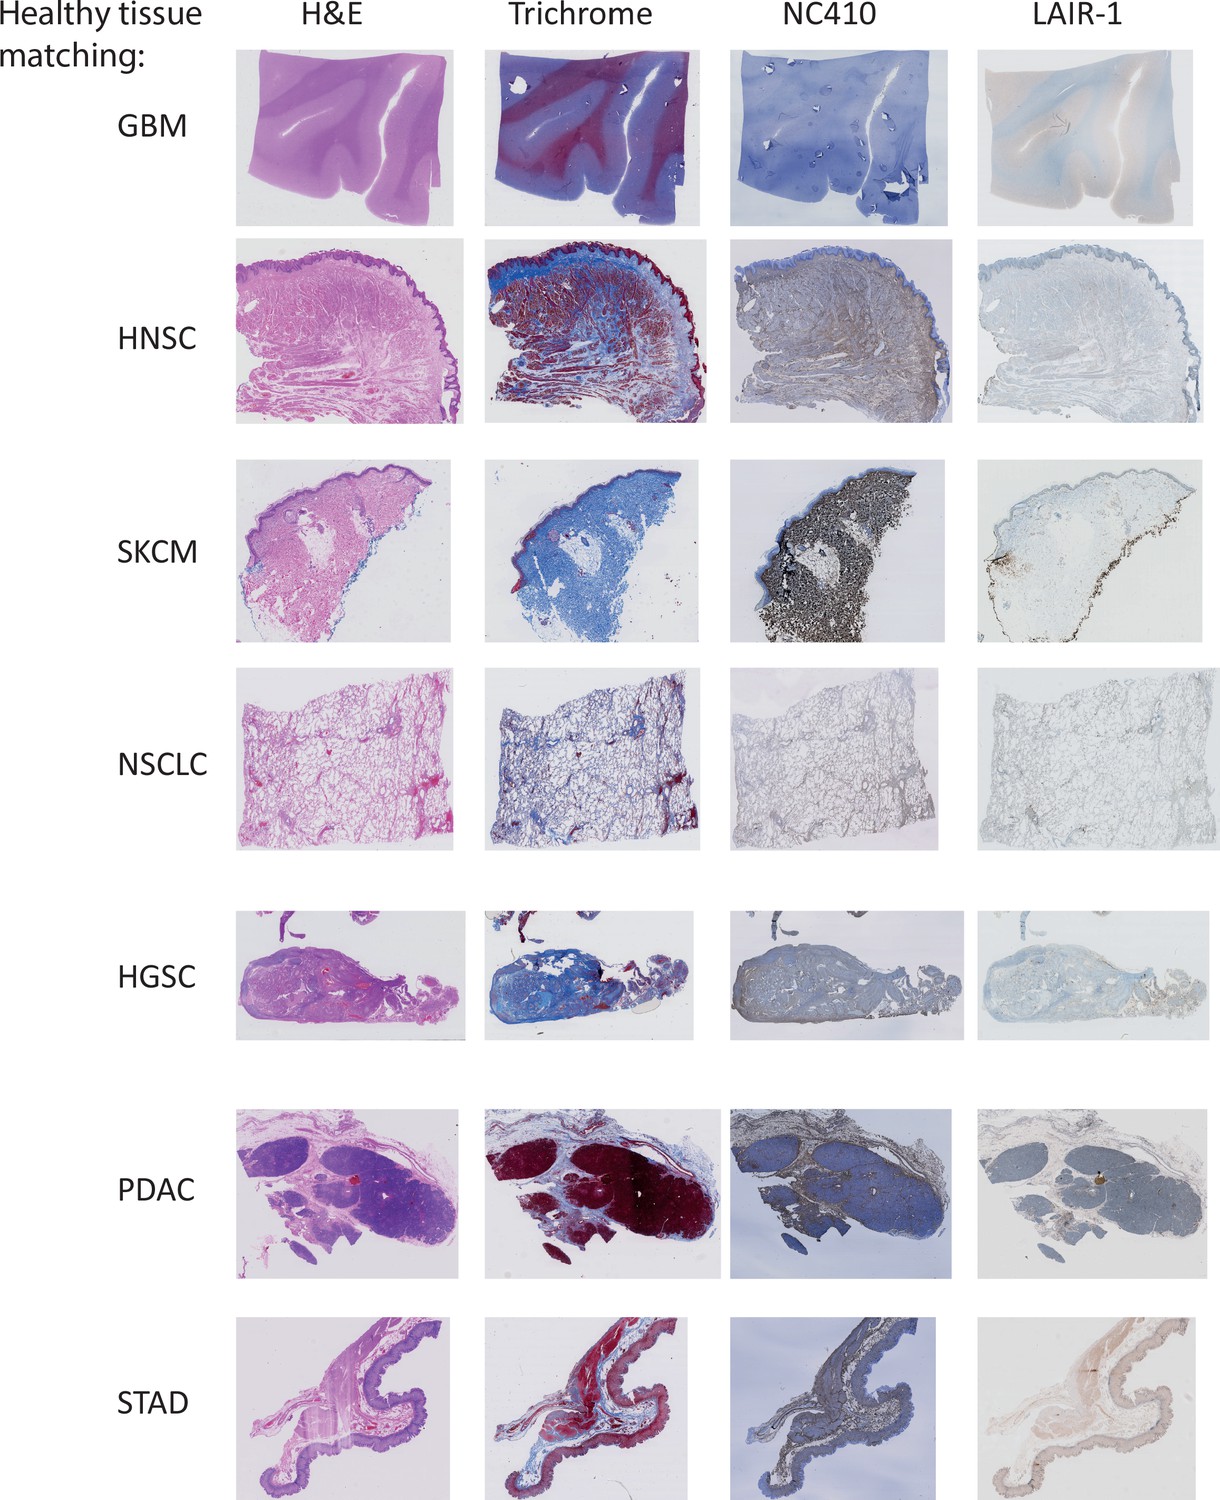
Immunohistochemical analysis of healthy tissues.
Representative hematoxylin and eosin (H&E), Masson Trichrome, NC410 and LAIR-1 staining for healthy tissue matching the tumors used in Figure 7—figure supplement 2.
Figure 7—figure supplement 4
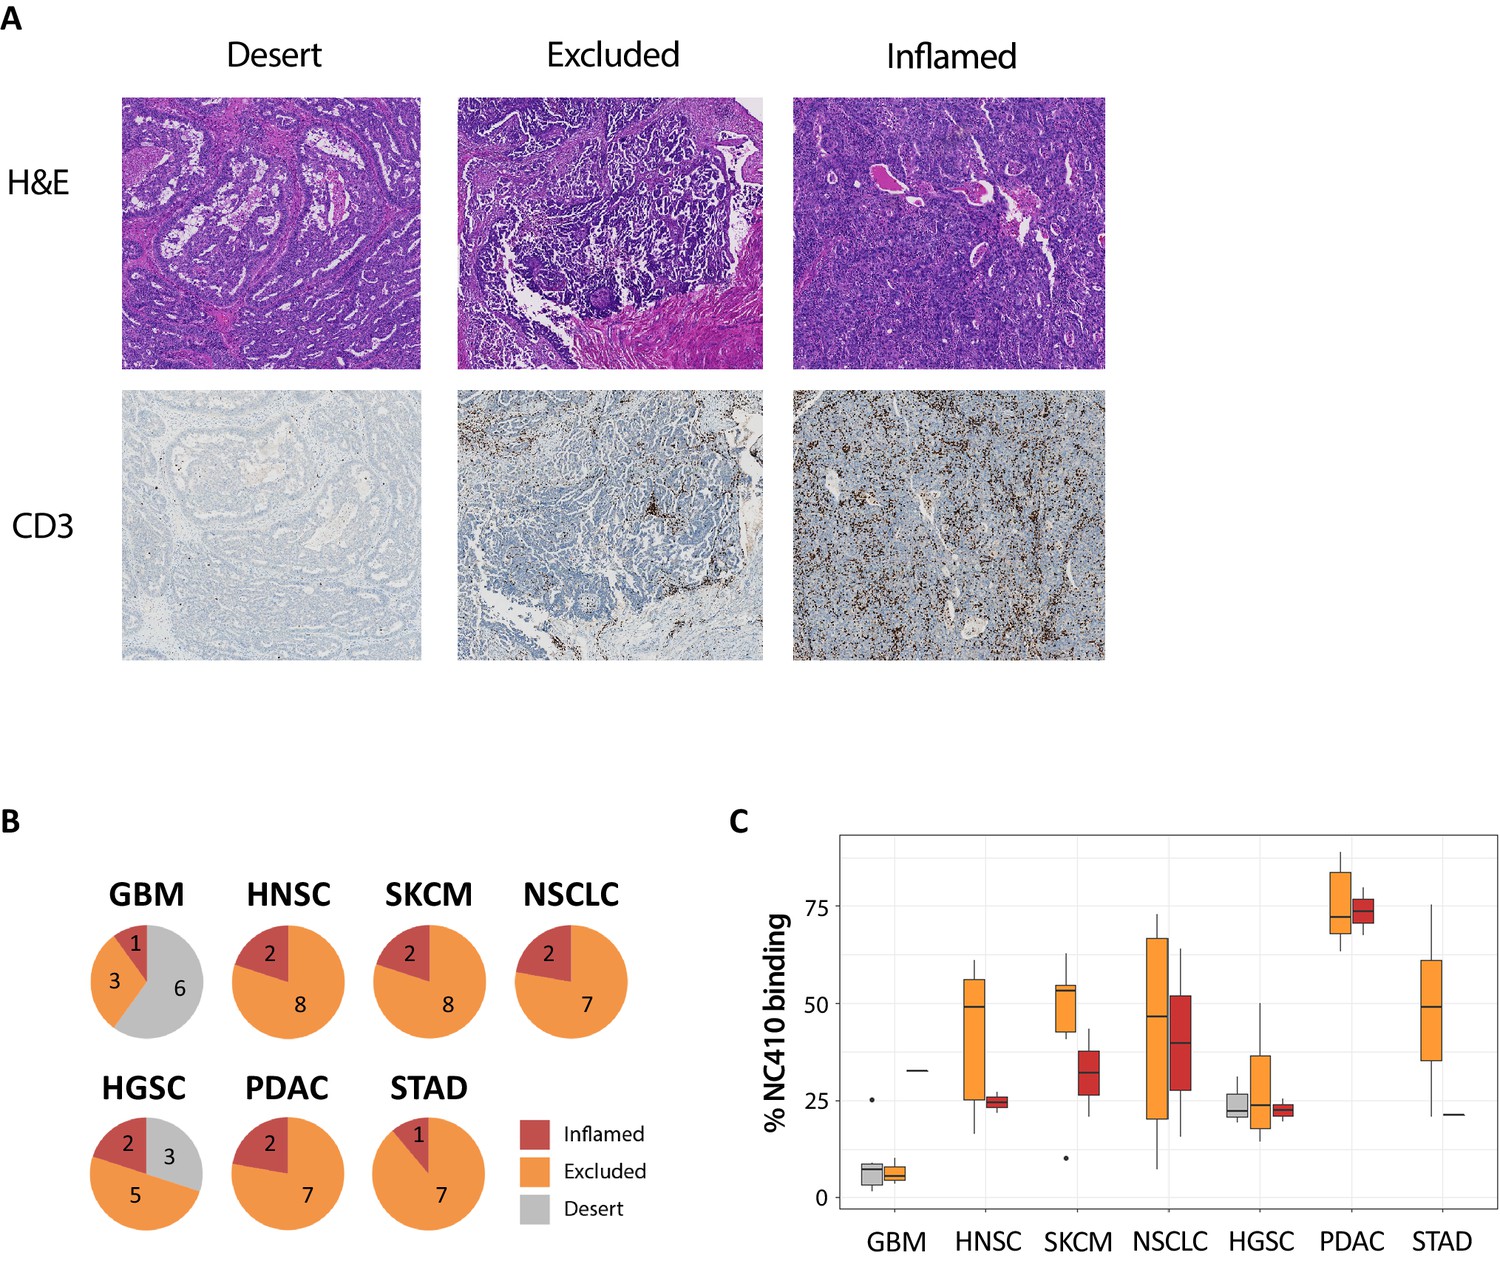
NC410 preferentially binds to tumors with an immune-excluded phenotype.
(A) Representative image of the three different immune phenotypes, immune-desert, immune-excluded and immune-inflamed, in a high-grade serous ovarian carcinoma (HGSC) specimen. (B) Patients within each tumor type as shown were characterized into immune-desert, immune-excluded and immune-inflamed based on CD3+ T cell presence and localization. (C) Quantification of NC410 staining across the different immune phenotypes in the seven different tumor types analyzed.
Tables
Key resources table
| Reagent type (species) or resource | Designation | Source or reference | Identifiers | Additional information |
|---|---|---|---|---|
| Genetic reagent (Mus musculus) | NOD-SCID IL2Rγnull | Jackson Labs | Stock #: 005557, RRID:IMSR_JAX:005557 | Female mice |
| Biological sample (Homo sapiens) | Human PBMCs | In vitro studies – healthy donors in agreement with ethical committee of the University Medical Center Utrecht In vivo studies – Leukopaks (StemCell) | ||
| Cell line (M. musculus) | hLAIR-1 reporter cell line | Meyaard Lab | 2B4 T cell hybridoma cells transduced with a NFAT-GFP reporter and hLAIR-1-CD3ζ | |
| Cell line (M. musculus) | WT reporter cell line | Meyaard Lab | 2B4 T cell hybridoma cells transduced with a NFAT-GFP reporter | |
| Cell line (Homo sapiens) | HT-29 | ATCC | ATCC HTB-38 (RRID:CVCL_0320) | |
| Cell line (M. musculus) | P815 | ATCC | ATCC TIB-64 (RRID:CVCL_2154) | |
| Cell line (Cricetulus griseus) | CHO cells | Lonza | CHOK1SV, RRID:CVCL_DR97 | CHOK1-SV-GS (glutamine synthase)-KO cells |
| Antibody | Anti-human CD45-BV421 (mouse monoclonal) | ThermoFisher Scientific | Cat number: 50-166-070 | (Flow cytometry: 1:40) |
| Antibody | Anti-mouse CD45-APC (rat monoclonal) | ThermoFisher Scientific | Cat number: 17-0451-82 | (Flow cytometry: 1:200) |
| Antibody | Anti-human CD3-PerCP.Cy5.5 (mouse monoclonal) | ThermoFisher Scientific | Cat number: 45-0037-42 | (Flow cytometry: 1:40) |
| Antibody | Anti-human CD8-AF488 (rat monoclonal) | ThermoFisher Scientific | Cat number: 53-0081-82 | (Flow cytometry: 1:40) |
| Antibody | Anti-human CD4-BV711 (mouse monoclonal) | Biolegend | Cat number: 300558 | (Flow cytometry: 1:40) |
| Antibody | Anti-Human CD45RA- eF450 (mouse monoclonal) | ThermoFisher | Cat number: 48-0458-42 | (Flow cytometry: 1:40) |
| Antibody | Anti-human CCR7-PE (mouse monoclonal) | Biolegend | Cat number: 353204 | (Flow cytometry: 1:40) |
| Antibody | Anti-human TNF-α-PE (mouse monoclonal) | ThermoFisher Scientific | Cat number: 12-7349-41 | (Flow cytometry: 1:40) |
| Antibody | Anti-human IFN-ɣ-PECy7 (rat monoclonal) | ThermoFisher Scientific | Cat number: 25-7311-41 | (Flow cytometry: 1:40) |
| Antibody | Anti-human LAIR-1 (rabbit polyclonal) | ATLAS antibodies | Cat number: HPA011155 | (Immunohistochemistry: 1:500) |
| Antibody | Anti-human LAIR-1 (mouse monoclonal) | BD Pharmingen | Cat number: 550810 | (Immunohistochemistry: 1:100) |
| Antibody | NC410-biotin | This paper/NextCure | See Materials and methods (Immunohistochemistry: 1:500) | |
| Antibody | Anti-human CD45 (mouse monoclonal) | DAKO | Cat number: GA751 | (Immunohistochemistry: 1:25) |
| Antibody | Anti-human CD3 (rabbit polyclonal) | DAKO | Cat number: GA503 | (Immunohistochemistry: 1:100) |
| Antibody | Anti-human CD68 (mouse monoclonal) | Novocastra | Cat number: NCL-L-CD68 | (Immunohistochemistry: 1:1600) |
| Antibody | Anti-human CD163 (mouse monoclonal) | Novocastra | Cat number: NCL-L-CD163 | (Immunohistochemistry: 1:800) |
| Antibody | Pan-collagen antibody (rabbit polyclonal) | ThermoFisher Scientific | Cat number: PA1-85324 | (Immunofluorescence: 1:200) |
| Antibody | Streptavidin APC | eBioscience | Cat number: 17-4317-82 | (Flow cytometry: 1:200) |
| Antibody | IgG1-AlexaFluor 594 | ThermoFisher Scientific | Cat number: A-21125 | (Immunofluorescence: 1:200) |
| Antibody | Streptavidin AlexaFluor 594 | ThermoFisher Scientific | Cat number: S11227 | (Immunofluorescence: 1:2000) |
| Peptide, recombinant protein | LAIR-1 FC | This paper/NextCure | See Materials and methods LAIR-1- Fc, LAIR-2-Fc (NC410) and LAIR-2-Fc (NC410) FES generation | |
| Peptide, recombinant protein | LAIR-2 FC | This paper/NextCure | See Materials and methods LAIR-1- Fc, LAIR-2-Fc (NC410) and LAIR-2-Fc (NC410) FES generation | |
| Peptide, recombinant protein | LAIR-2 FES | This paper/NextCure | See Materials and methods LAIR-1- Fc, LAIR-2-Fc (NC410) and LAIR-2-Fc (NC410) FES generation | |
| Peptide, recombinant protein | Human collagen I | R&D Systems; Stem Cell | Cat number: 6220 CL-020 (R&D); 07005 (StemCell) | |
| Peptide, recombinant protein | Mouse collagen I | Ray Biotech | Cat number: DF-01-0058 | |
| Peptide, recombinant protein | Rat collagen I | Yo Protein | Cat number: ABIN628947 | |
| Peptide, recombinant protein | Human collagen III | R&D Systems | Cat number: 7294 CL-020 | |
| Peptide, recombinant protein | Rat collagen III | Yo Protein | Cat number: ABIN377054 | |
| Commercial assay/kit | mouse tumor dissociation kit | Miltenyi | Cat number: 130-096-730, RRID:SCR_020285 | |
| Commercial assay/kit | Cell Stimulation Cocktail plus protein transport inhibitors | ThermoFisher Scientific | Cat number: 00-4970-93 | |
| Commercial assay/kit | Cytofix/CytoPerm Plus Fixation/Permeabilization Kit | BD | Cat number: 555028 | |
| Commercial assay/kit | Singleplex Luminex Protein Assay Kit | ThermoFisher Scientific | Cat number: EPX010-10420-901 | |
| Commercial assay/kit | Human T cell positive selection kit | StemCell | Cat number: 17851 | |
| Commercial assay/kit | Optiview DAB IHC detection kit | Ventana kit | Cat number: 760–700 | |
| Other | Zombie NIR viability dye | Biolegend | Cat number: 423105 | |
| Other | ACK lysis buffer | KD medical | Cat number: 50-101-9080 | |
| Other | RIPA Lysis buffer | ThermoFisher Scientific | Cat number: 89900 | |
| Other | proteinase inhibitor | Roche | Cat number: 4693116001 | |
| Other | DNase | Millipore | Cat number: 69182–3 | |
| Other | Collagenase (from Clostridium histolyticum) | Sigma | Cat number: C0130 | |
| Other | Triton X-100 | Roche | Cat number: 10789704001 | |
| Other | EZ-Link NHS-PEG4-Biotin | ThermoFisher | Cat number: 21329 | |
| Other | ZebaSpin Desalting Columns | ThermoFisher | Cat number: 87770 | |
| Other | DELFIA wash buffer | PerkinElmer | Cat number: 1244-114 | |
| Other | DELFIA enhancement solution | PerkinElmer | Cat number: 4001-0010 | |
| Other | Europium-labeled Streptavidin | PerkinElmer | Cat number: 1244-360 | |
| Other | Masson’s Trichrome | Abcam | Cat number: Ab150686 | |
| Other | Hematoxylin | Sigma-Aldrich chemie | Cat number: 51275-1L | |
| Other | DAPI VectaShield hardset | Vector Lab | Cat number: H-1500-10, RRID:AB_2336788 | |
| Software, algorithm | QuPath version 0.2.0 | QuPath | RRID:SCR_018257 | |
| Software, algorithm | GraphPad Prism 8.0 | GraphPad Prism | RRID:SCR_002798 | |
| Software, algorithm | TCGA database (https://cancergenome.nih.gov/) | RRID:SCR_003193 | R codes for TCGA analysis Files can be found in the supplied Source code files |
Additional files
-
Source code 1
Survival curves comparing individuals with high collagen expression against individuals with low collagen expression.
Expression values corresponding to 43 collagen genes in tumor were obtained and averaged for each individual. The collagen expression from various individuals was divided into four quantiles. The individuals with expression values less than or equal to the first quantile were regarded as low expression, and those with values greater than or equal to the third quantile were considered as high expression. The association between expression (high/low) and their survival was assessed using Kaplan–Meier method. The survival curves were drawn using ggsurvplot function in the survminer package in R. The cancers where p-value was less than 0.05 were considered significant and are displayed.
- https://cdn.elifesciences.org/articles/62927/elife-62927-code1-v2.zip
-
Source code 2
Average collagen expression in normal and tumor across various cancers.
The expression values corresponding to 43 different collagen proteins are queried from the TCGA database. TCGA consists of 33 projects corresponding to 33 different cancers, which can individually be queried for expression of genes. For each cancer, expression of collagen genes in cancer and normal (where available) was queried individually. The expression across all collagens was averaged in tumor and normal and displayed as a bar graph in different cancers.
- https://cdn.elifesciences.org/articles/62927/elife-62927-code2-v2.zip
-
Source code 3
Average LAIR-1/2 expression in normal and tumor across various cancers.
Expression of LAIR-1/2 is queried from the TCGA database. Expression of LAIR-1/2 in normal and tumor is displayed as bar graphs in each cancer.
- https://cdn.elifesciences.org/articles/62927/elife-62927-code3-v2.zip
-
Source code 4
Survival curves comparing individuals with high LAIR-1/2 expression against individuals with low LAIR-1/2 expression.
LAIR-1/2 expression was obtained for each individual and divided into four quantiles. The individuals with expression values less than or equal to the first quantile were regarded as low expression, and those with values greater than or equal to the third quantile were considered as high expression. The association between expression (high/low) and their survival was assessed using Kaplan–Meier method, and the cancers where p-value was less than 0.05 are displayed.
- https://cdn.elifesciences.org/articles/62927/elife-62927-code4-v2.zip
-
Source code 5
Survival curves comparing individuals with high collagen, high LAIR-1 expression against individuals with low collagen, low LAIR-1 expression.
Two-way analysis involved dividing average collagen expression across individuals into low and high categories based on the quantiles as Source code 4. Similarly, LAIR-1 expression was also divided into low and high categories based on quantiles. The individuals with high LAIR-1 and high collagen expression were considered high group, and those with low LAIR-1 and low collagen expression were considered low group. Survival based on expression of these two categories was evaluated using Kaplan–Meier method, and the cancers where p-value was less than 0.05 is displayed.
- https://cdn.elifesciences.org/articles/62927/elife-62927-code5-v2.zip
-
Transparent reporting form
- https://cdn.elifesciences.org/articles/62927/elife-62927-transrepform-v2.pdf
Download links
A two-part list of links to download the article, or parts of the article, in various formats.
Downloads (link to download the article as PDF)
Open citations (links to open the citations from this article in various online reference manager services)
Cite this article (links to download the citations from this article in formats compatible with various reference manager tools)
Cancer immunotherapy by NC410, a LAIR-2 Fc protein blocking human LAIR-collagen interaction
eLife 10:e62927.
https://doi.org/10.7554/eLife.62927


