Stable transplantation of human mitochondrial DNA by high-throughput, pressurized isolated mitochondrial delivery
- Molecular Biology Interdepartmental Doctoral Program, University of California, Los Angeles, United States
- Department of Pathology and Laboratory Medicine, David Geffen School of Medicine, University of California, Los Angeles, United States
- Department of Mechanical and Aerospace Engineering, University of California, Los Angeles, United States
- NanoCav, LLC, United States
- NantBio, Inc, and ImmunityBio, Inc, United States
- NantOmics, LLC, United States
- California NanoSystems Institute, University of California, Los Angeles, United States
- Department of Bioengineering, University of California, Los Angeles, United States
- Eli and Edythe Broad Center of Regenerative Medicine and Stem Cell Research University of California, Los Angeles, United States
- Department of Pediatrics, David Geffen School of Medicine, University of California, Los Angeles, United States
- Jonsson Comprehensive Cancer Center, David Geffen School of Medicine, University of California, Los Angeles, United States
Figures
Figure 1 with 1 supplement
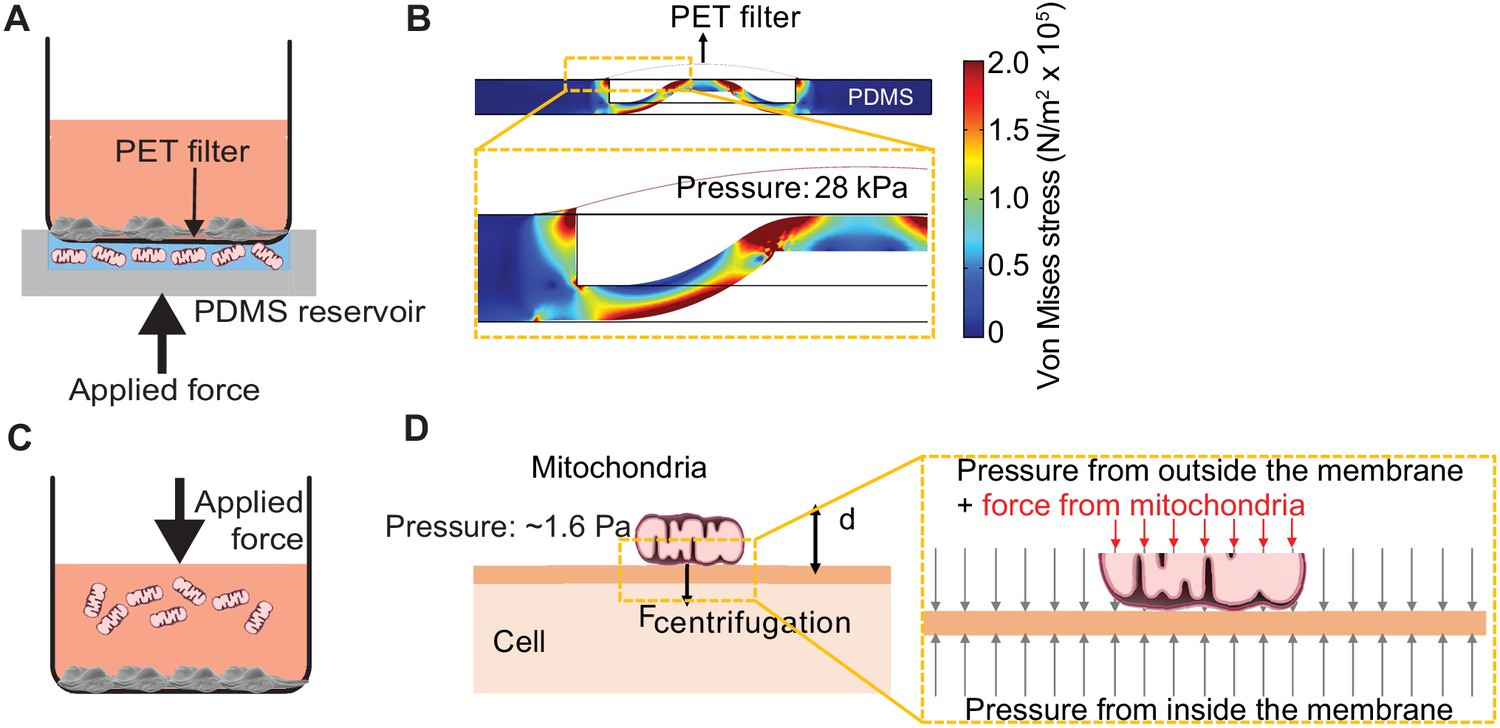
Pressure simulations of mitochondrial transfer tools.
(A) Schematic of MitoPunch apparatus. Recipient cells (1 × 10⁵) are seeded on a porous polyester (PET) membrane ~24 hr before delivery. A freshly isolated suspension of mitochondria in 1× Dulbecco's Phosphate Buffered Saline (DPBS) with calcium and magnesium, pH 7.4, is loaded into the polydimethylsiloxane (PDMS) chamber and the filter insert is sealed over the PDMS before activation of the mechanical plunger to pressurize the apparatus and deliver the mitochondrial suspension into recipient cells. (B) Numerical simulation showing the pressure inside the PDMS chamber reaching 28 kPa with piston activation. COMSOL file used to model MitoPunch pressure is available in Figure 1—source data 1. (C) Schematic of MitoCeption technique. Recipient cells (1 × 10⁵) are seeded on wells of a 6-well dish ~24 hr before delivery. A freshly isolated suspension of mitochondria in 1× DPBS with calcium and magnesium, pH 7.4, is pipetted into the cell medium before the plate is centrifuged at 1500 × g for 15 min at 4°C. The plate is incubated in a 37°C incubator for 2 hr before being centrifuged again at 1500 × g for 15 min at 4°C. (D) MitoCeption pressure model and calculated pressure exerted by isolated mitochondria on recipient cells during delivery.
-
Figure 1—source data 1
Numerical simulation of MitoPunch pressure generation during mitochondrial delivery.
- https://cdn.elifesciences.org/articles/63102/elife-63102-fig1-data1-v2.zip
Figure 1—figure supplement 1
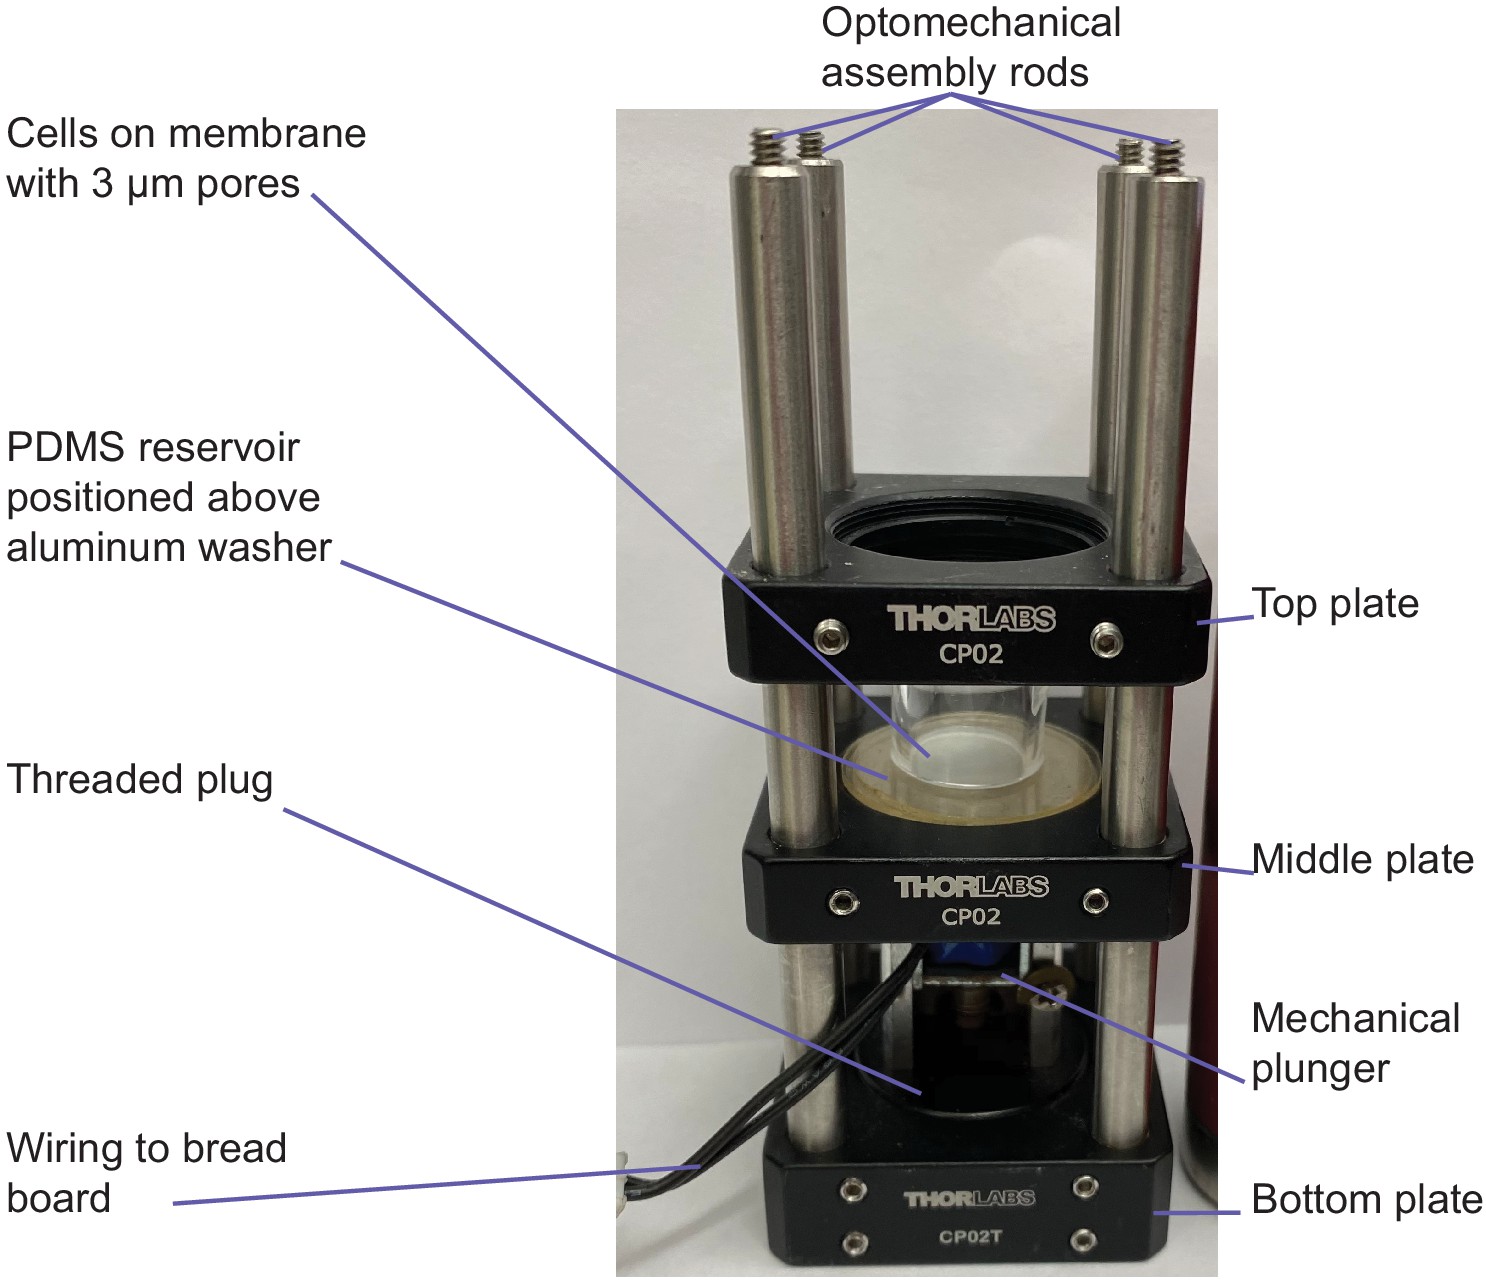
Annotated MitoPunch apparatus.
Annotated image of the MitoPunch apparatus. Labeled parts are described in the Materials and methods to assist with construction of the apparatus.
Figure 2 with 1 supplement
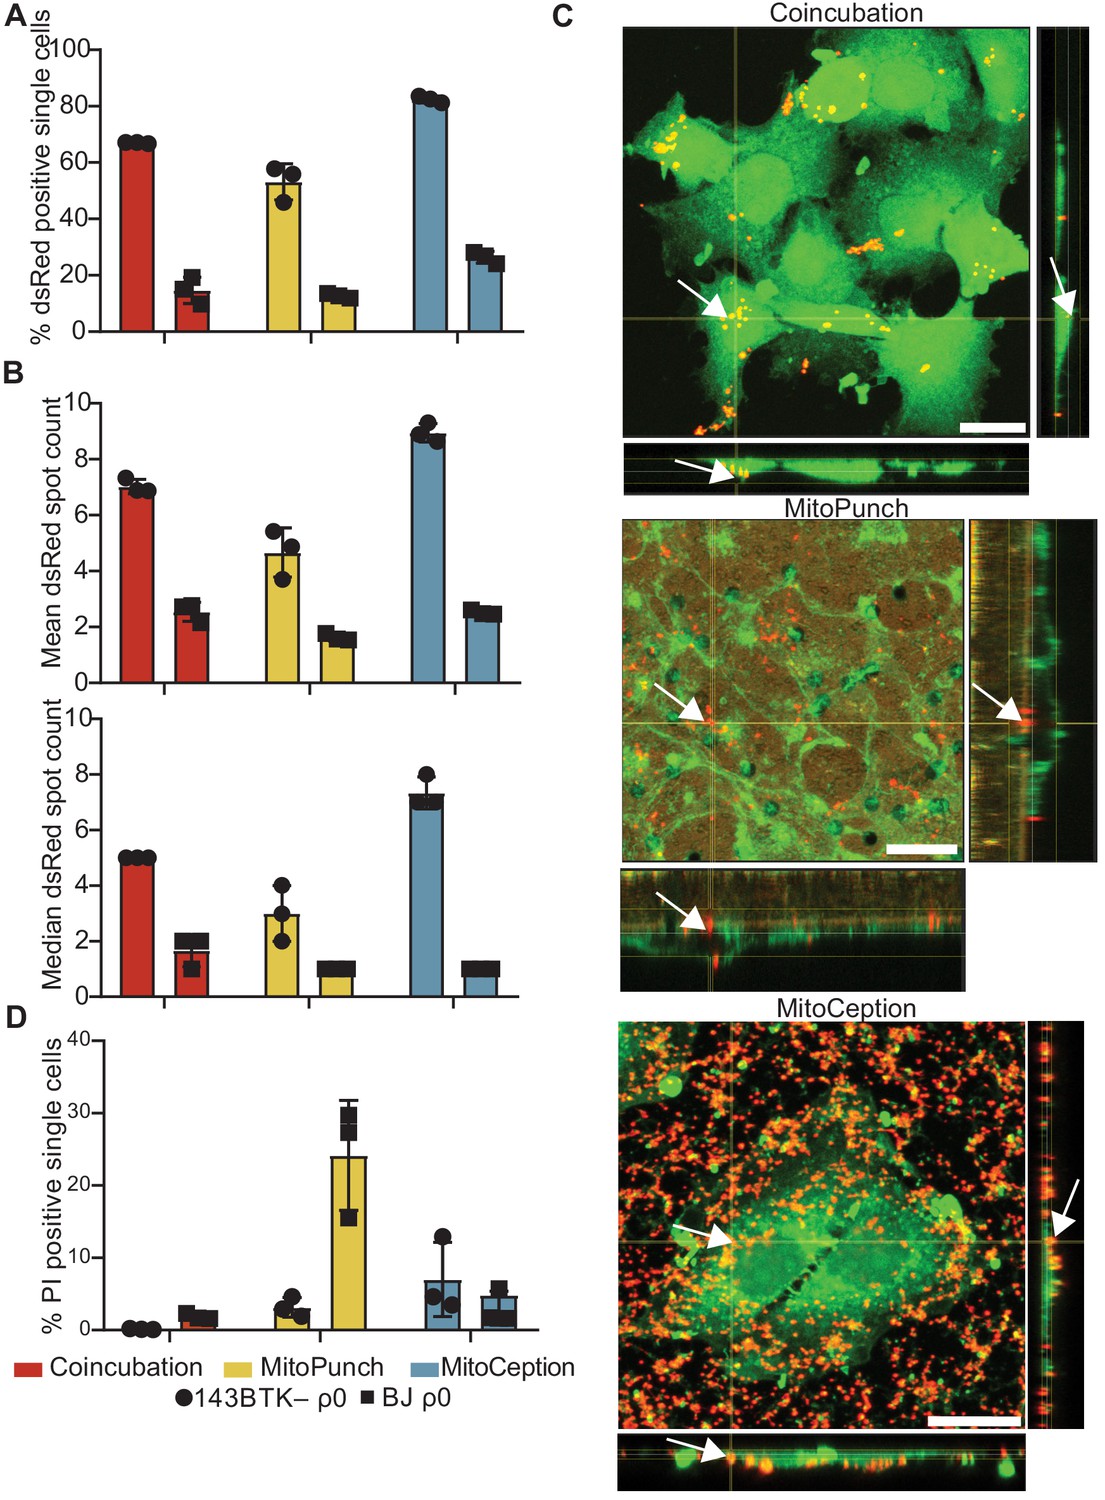
MitoPunch delivers isolated mitochondria to recipient cells.
(A) Quantification of flow cytometry results measuring the association of dsRed mitochondria with 143BTK– ρ0 and BJ ρ0 single recipient cells following mitochondrial transfer. (B) Mean and median dsRed spot count quantification of ImageStream data. (C) Sequential Z-stacks of confocal microscopy of 143BTK– ρ0 cells delivered isolated HEK293T-derived dsRed mitochondria by coincubation, MitoPunch, and MitoCeption and fixed 15 min following transfer. Arrows indicate representative mitochondria interacting with recipient cells. Transferred dsRed mitochondria are labeled in red. Plasma membranes are labeled in green, stained with CellMask Green plasma membrane stain in coincubation and MitoCeption and with wheat germ agglutinin plasma membrane stain in MitoPunch. Scale bars indicate 15 µm. (D) Quantification of flow cytometry measurements of fluorescence in 143BTK– ρ0 and BJ ρ0 single cells following propidium iodide transfer by coincubation, MitoPunch, and MitoCeption. Error bars represent SD of three technical replicates in all figures.
Figure 2—figure supplement 1
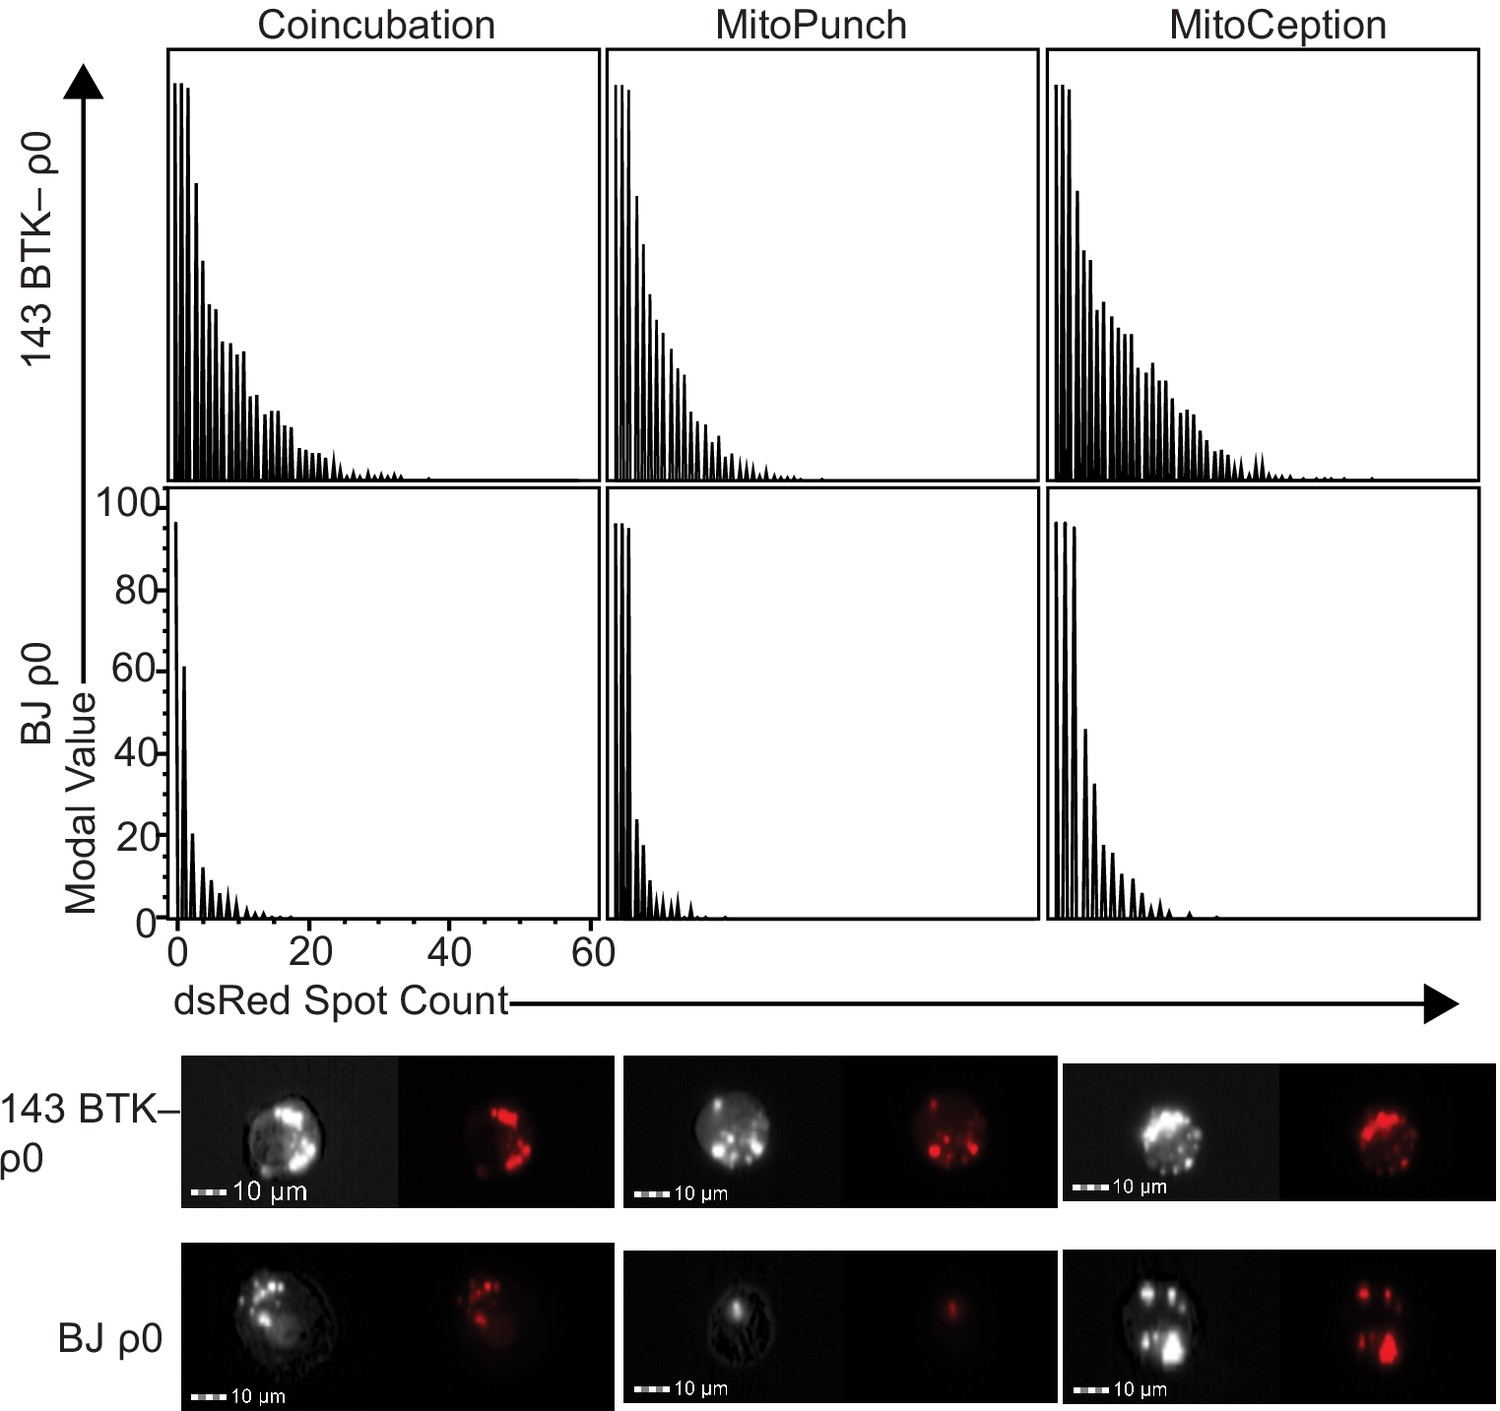
Mitochondrial spot quantification.
Representative spot count distributions, bright-field images, and PE channel fluorescent images from ImageStream imaging flow cytometry representing the number of dsRed spots associated with 143BTK– ρ0 and BJ ρ0 cells 2 hr after mitochondrial transfer by coincubation, MitoPunch, and MitoCeption. Imaging flow cytometry data is represented as histograms normalized to the mode of each data set. Scale bars indicate 10 µm.
Figure 3 with 6 supplements

Stable retention of transplanted mitochondrial DNA (mtDNA) into transformed and replication-limited cells.
(A) Workflow for stable isolated mitochondrial recipient (SIMR) cell generation by mitochondrial transfer into ρ0 cells. (B) Representative fixed and crystal violet stained 10 cm plate image following MitoPunch and SIMR cell selection used for SIMR clone generation quantification. (C) Quantification of crystal violet stained 143BTK– ρ0 and BJ ρ0 SIMR clones. Error bars represent SD of three technical replicates. (D) Quantification of crystal violet stained 143BTK– ρ0 and BJ ρ0 SIMR clones formed by MitoPunch actuated with indicated voltages after uridine-free selection. Error bars represent SD of three technical replicates with the exception of BJ ρ0 5 V transfer, which shows two replicates. (E) Quantification of crystal violet stained 143BTK– ρ0 and BJ ρ0 SIMR clones formed by MitoCeption with indicated centripetal forces after uridine-free selection. Error bars represent SD of three technical replicates.
Figure 3—figure supplement 1
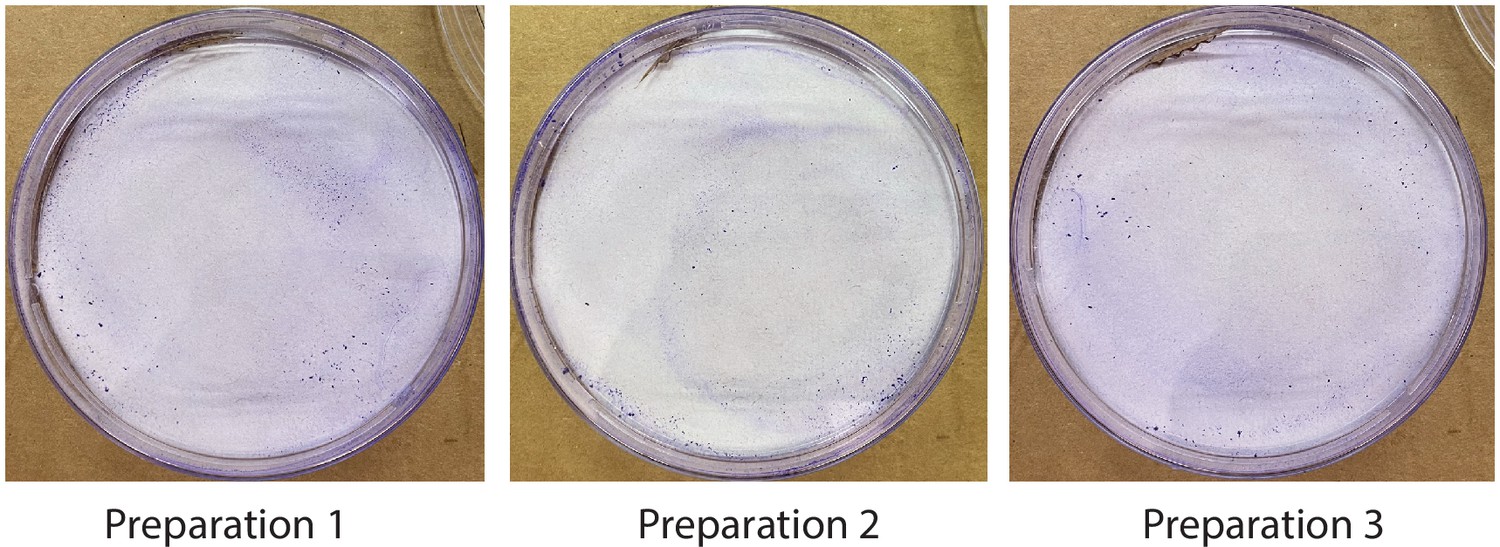
Verification of surviving mitochondrial donor cells following mitochondrial isolation.
Images of three crystal violet stained 10 cm plates seeded with isolated mitochondria from ~1.5 × 10⁷ HEK293T dsRed donor cells taken from three independent mitochondrial isolations following dialyzed medium selection. Pictures were taken on a circular white disk matted within a cardboard frame for clarity.
Figure 3—figure supplement 2
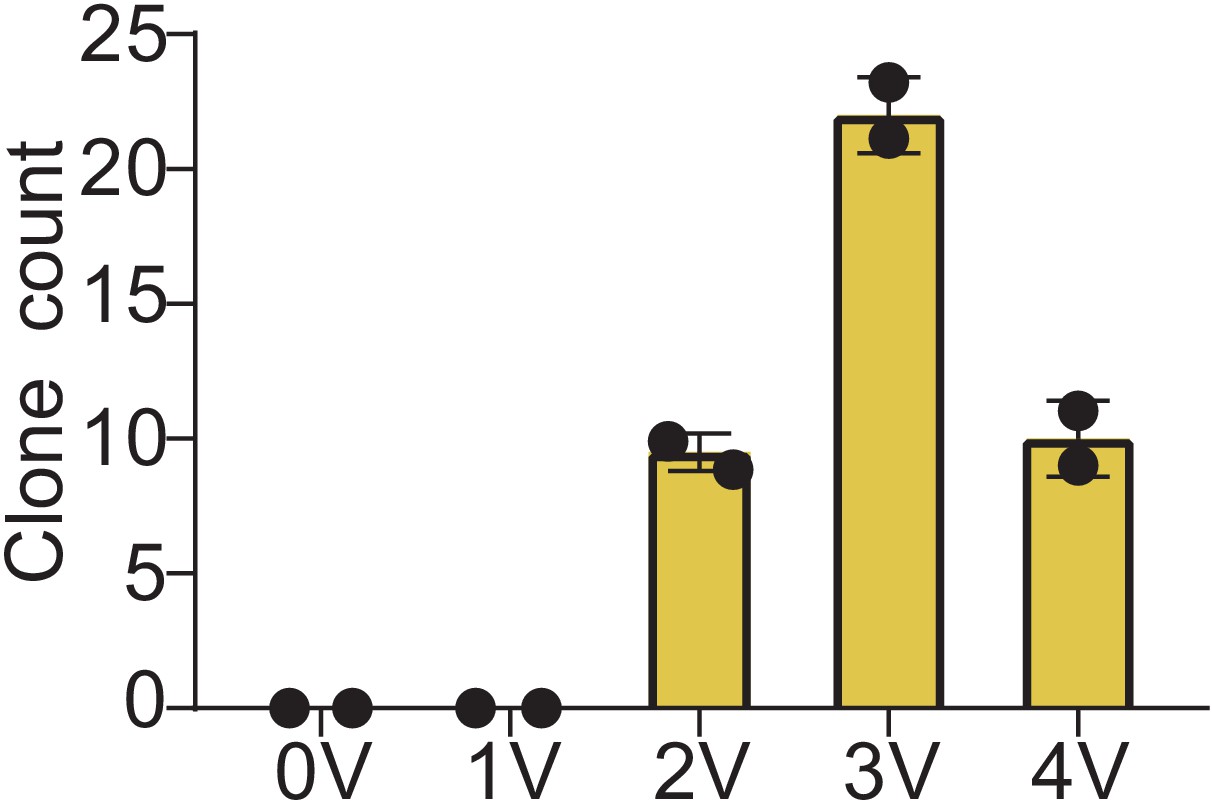
MitoPunch generates stable isolated mitochondrial recipient (SIMR) clones in immortalized mouse cells.
Quantification of crystal violet stained B16 ρ0 SIMR clones formed by MitoPunch transfer of isolated L929 mitochondria actuated with indicated voltages after SIMR cell selection. Error bars indicate the range between the technical duplicates.
Figure 3—figure supplement 3
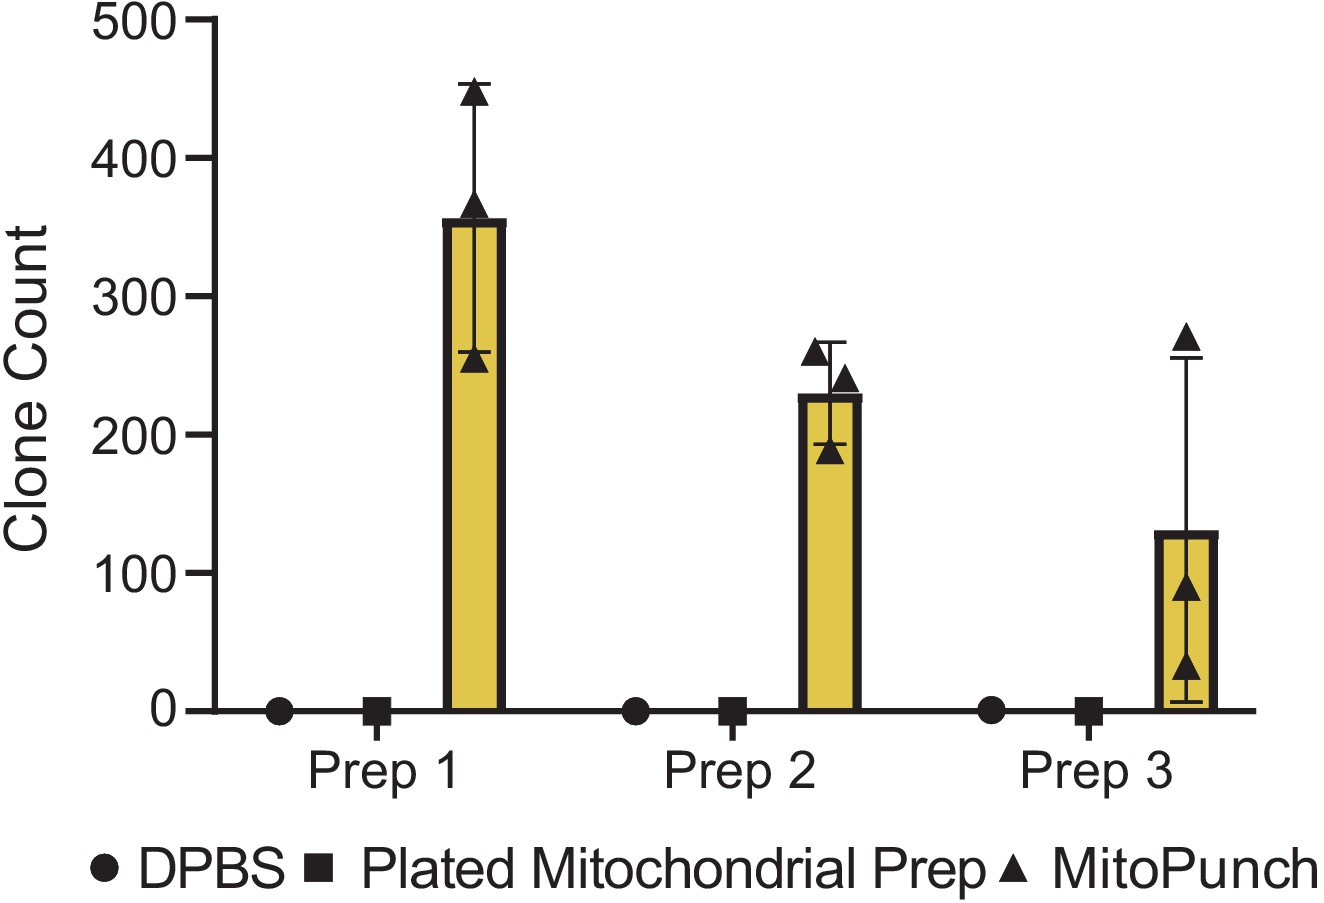
Quantification of MitoPunch reproducibility.
Quantification of crystal violet stained 143BTK– ρ0 stable isolated mitochondrial recipient (SIMR) clones generated in technical triplicate from three independent HEK293T dsRed mitochondrial donor cell preparations plotted alongside technical singlet DPBS delivery and plated mitochondrial preparation controls (Figure 3—figure supplement 1).
Figure 3—figure supplement 4
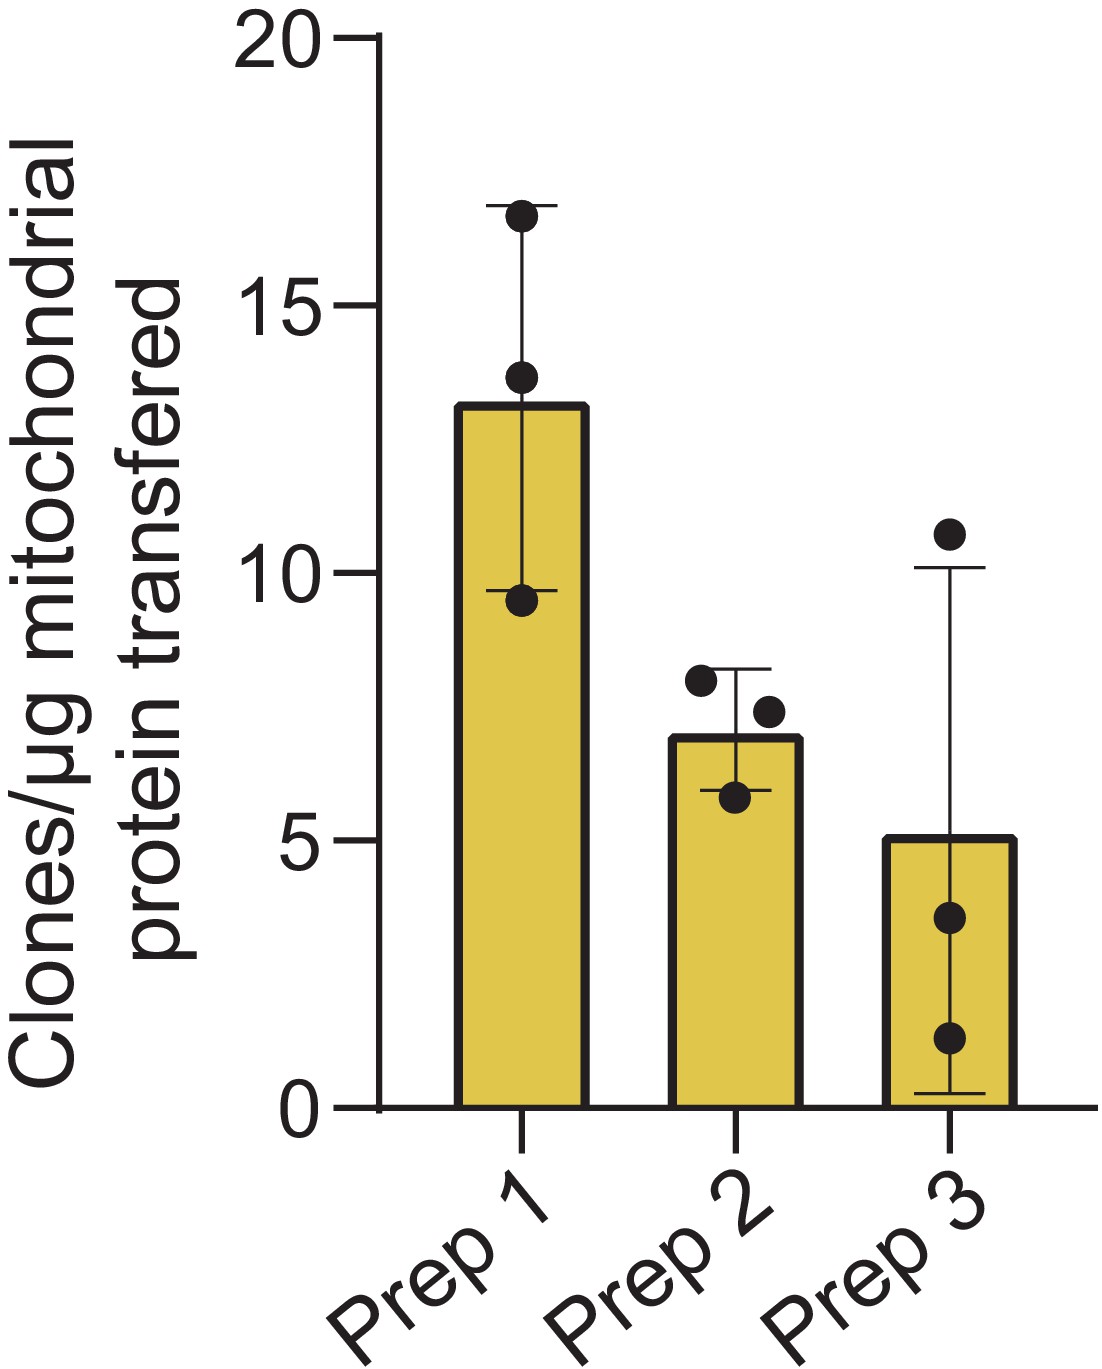
Quantification of MitoPunch reproducibility relative to mitochondrial mass transferred.
Quantification of crystal violet stained 143BTK– ρ0 stable isolated mitochondrial recipient (SIMR) clones generated in technical triplicate from three independent HEK293T dsRed mitochondrial donor cell preparations plotted as number of SIMR clones generated per µg isolated mitochondrial protein loaded into the polydimethylsiloxane (PDMS) reservoir.
The mass of isolated mitochondria per 120 µL of isolated mitochondrial suspension for the three preparations are as follows: Prep 1–27 µg, Prep 2–33 µg, Prep 3–25 µg.
Figure 3—figure supplement 5
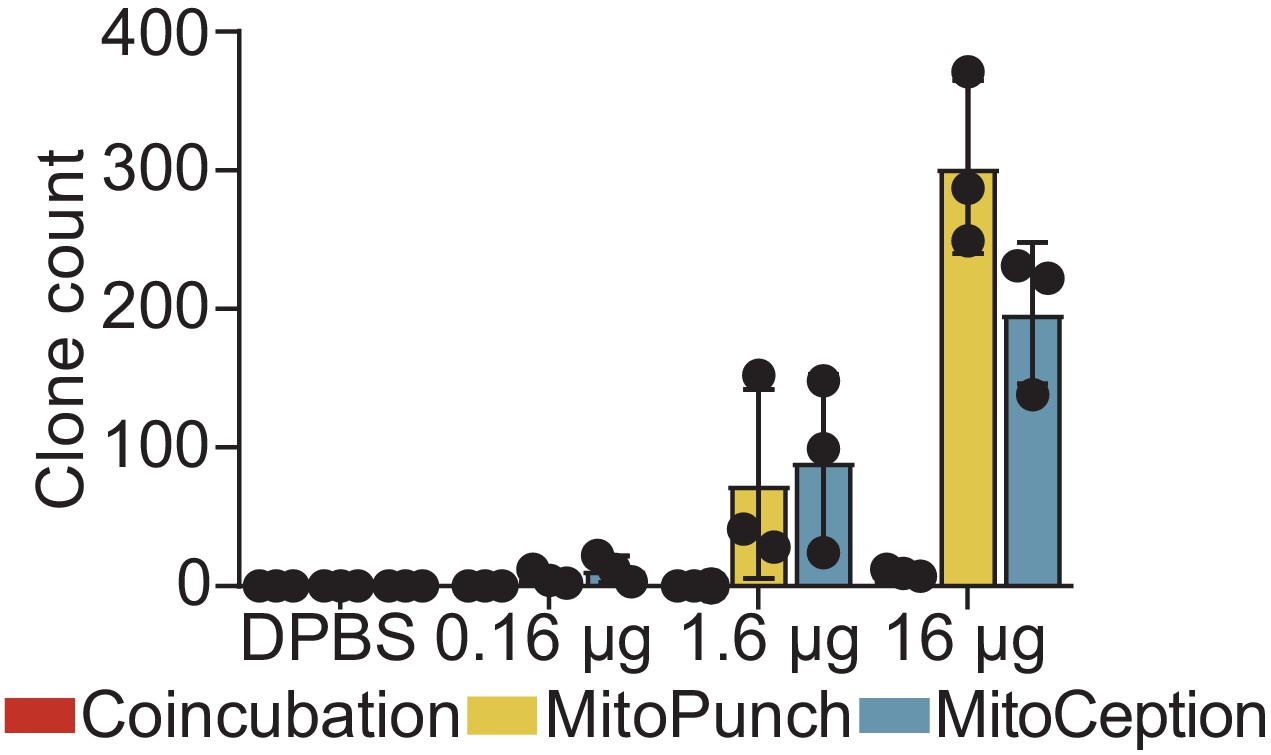
Quantification of stable isolated mitochondrial recipient (SIMR) generation efficiency by delivering different masses of isolated mitochondria.
Quantification of crystal violet stained 143BTK– ρ0 SIMR clones using indicated concentrations of mitochondrial suspension following 7 days of culture in SIMR selection medium. Error bars represent SD of three technical replicates.
Figure 3—figure supplement 6
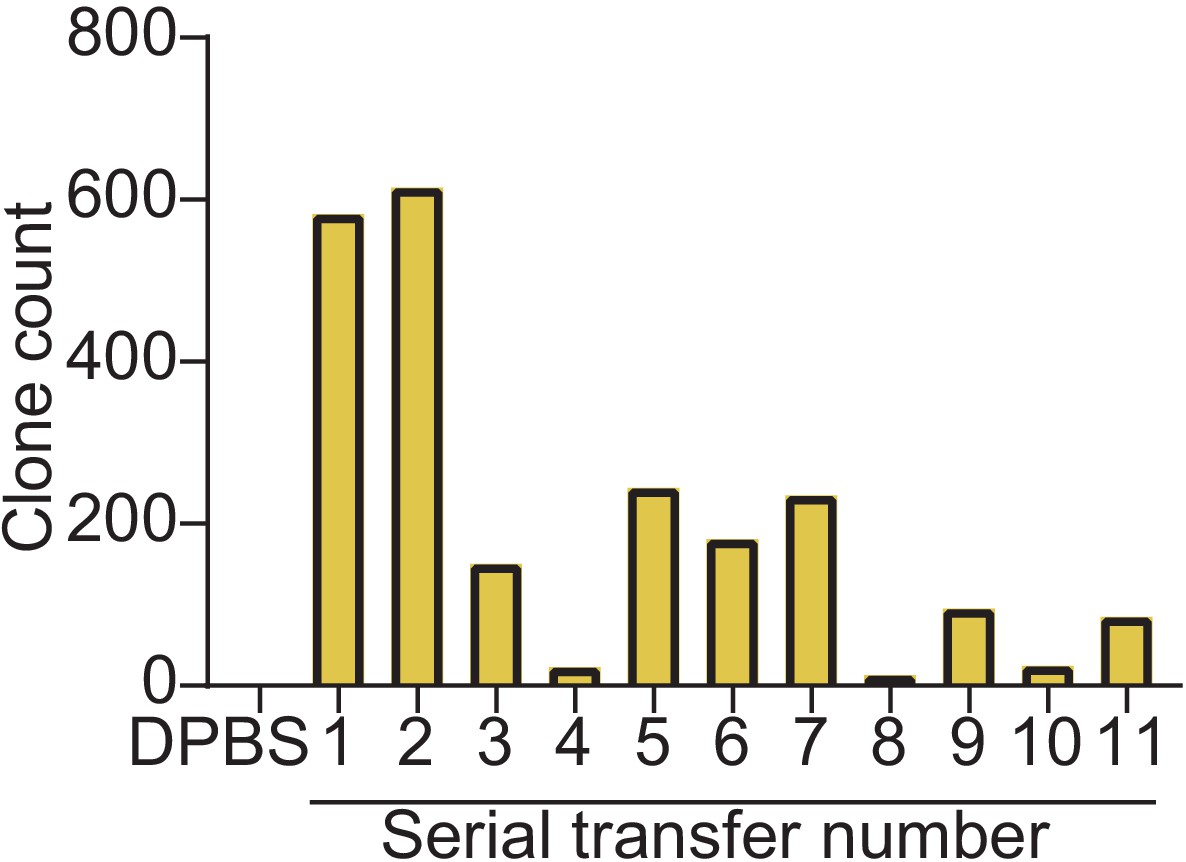
Quantification of MitoPunch stable isolated mitochondrial recipient (SIMR) generation by serial deliveries using one isolated mitochondrial aliquot.
Quantification of crystal violet stained SIMR clones formed by serial MitoPunch deliveries of HEK293T dsRed mitochondria into 143BTK– ρ0 recipient cells using the same used mitochondrial sample remaining in the polydimethylsiloxane (PDMS) reservoir after the preceding delivery.
Figure 4 with 2 supplements
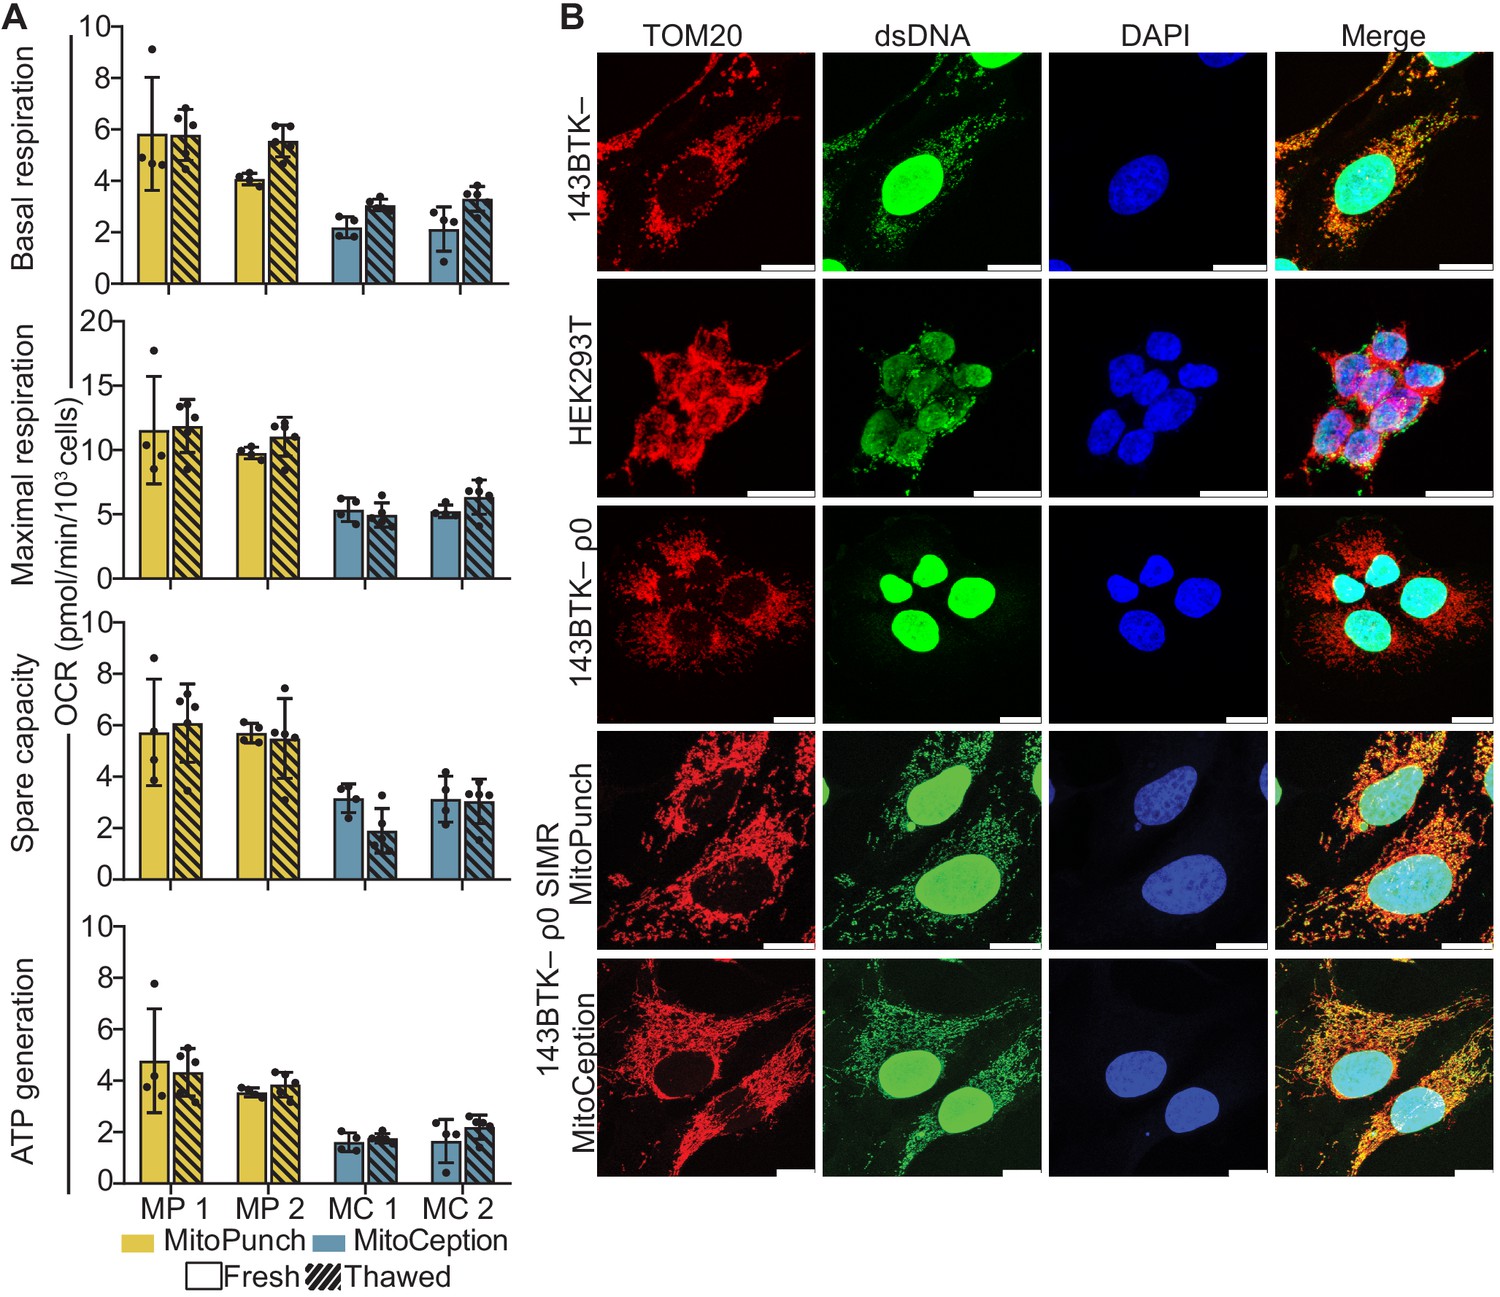
Mitochondrial DNA (mtDNA) transplantation rescues ρ0 mitochondrial phenotypes.
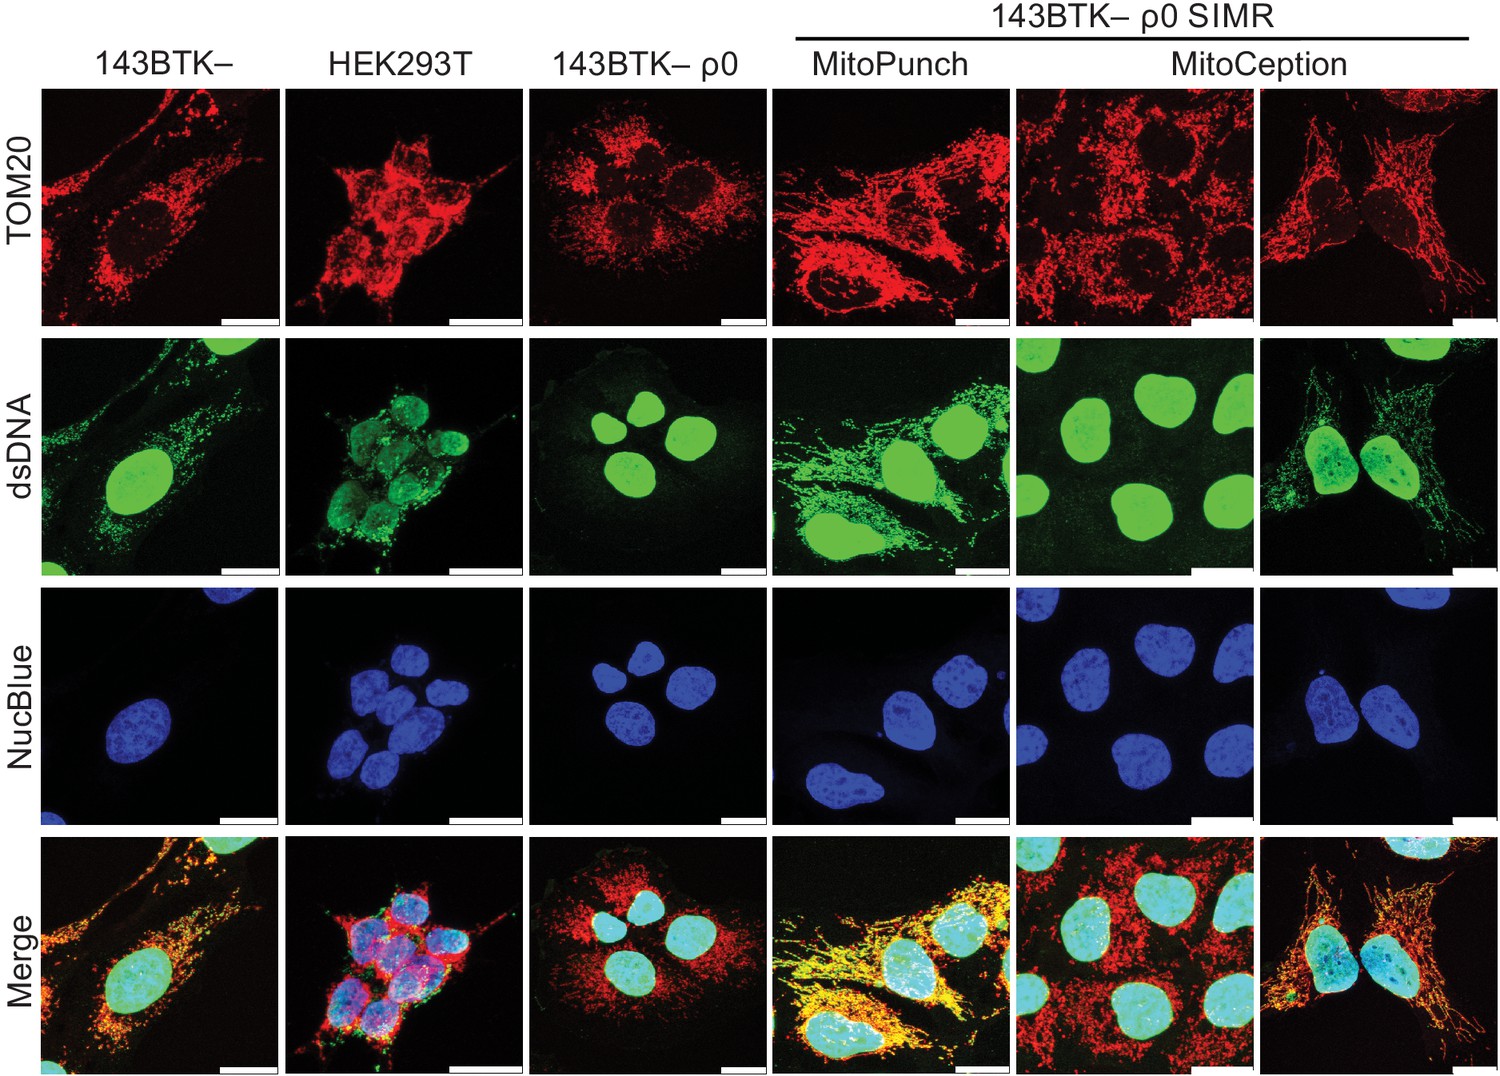
(A) Oxygen consumption rate (OCR) quantification of basal and maximal respiration, spare respiratory capacity, and ATP generation from two independent 143BTK– ρ0 + HEK293T stable isolated mitochondrial recipient (SIMR) clones generated by MitoPunch and MitoCeption. Cross-hatched data indicate clones that were frozen and thawed twice each. Error bars represent SD of four technical replicates for fresh SIMR cell measurements and five for thawed SIMR cell measurements. (B) Confocal microscopy of representative 143BTK– ρ0 + HEK293T SIMR clones compared to 143BTK– parental, HEK293T dsRed mitochondrial donor, and 143BTK– ρ0 controls. Mitochondria were stained with anti-TOM20 antibody and labeled red, double-stranded DNA was stained with anti-dsDNA antibody and labeled green, and cell nuclei were stained with NucBlue (Hoechst 33342) and labeled blue. Scale bars indicate 15 µm.
Figure 4—figure supplement 1
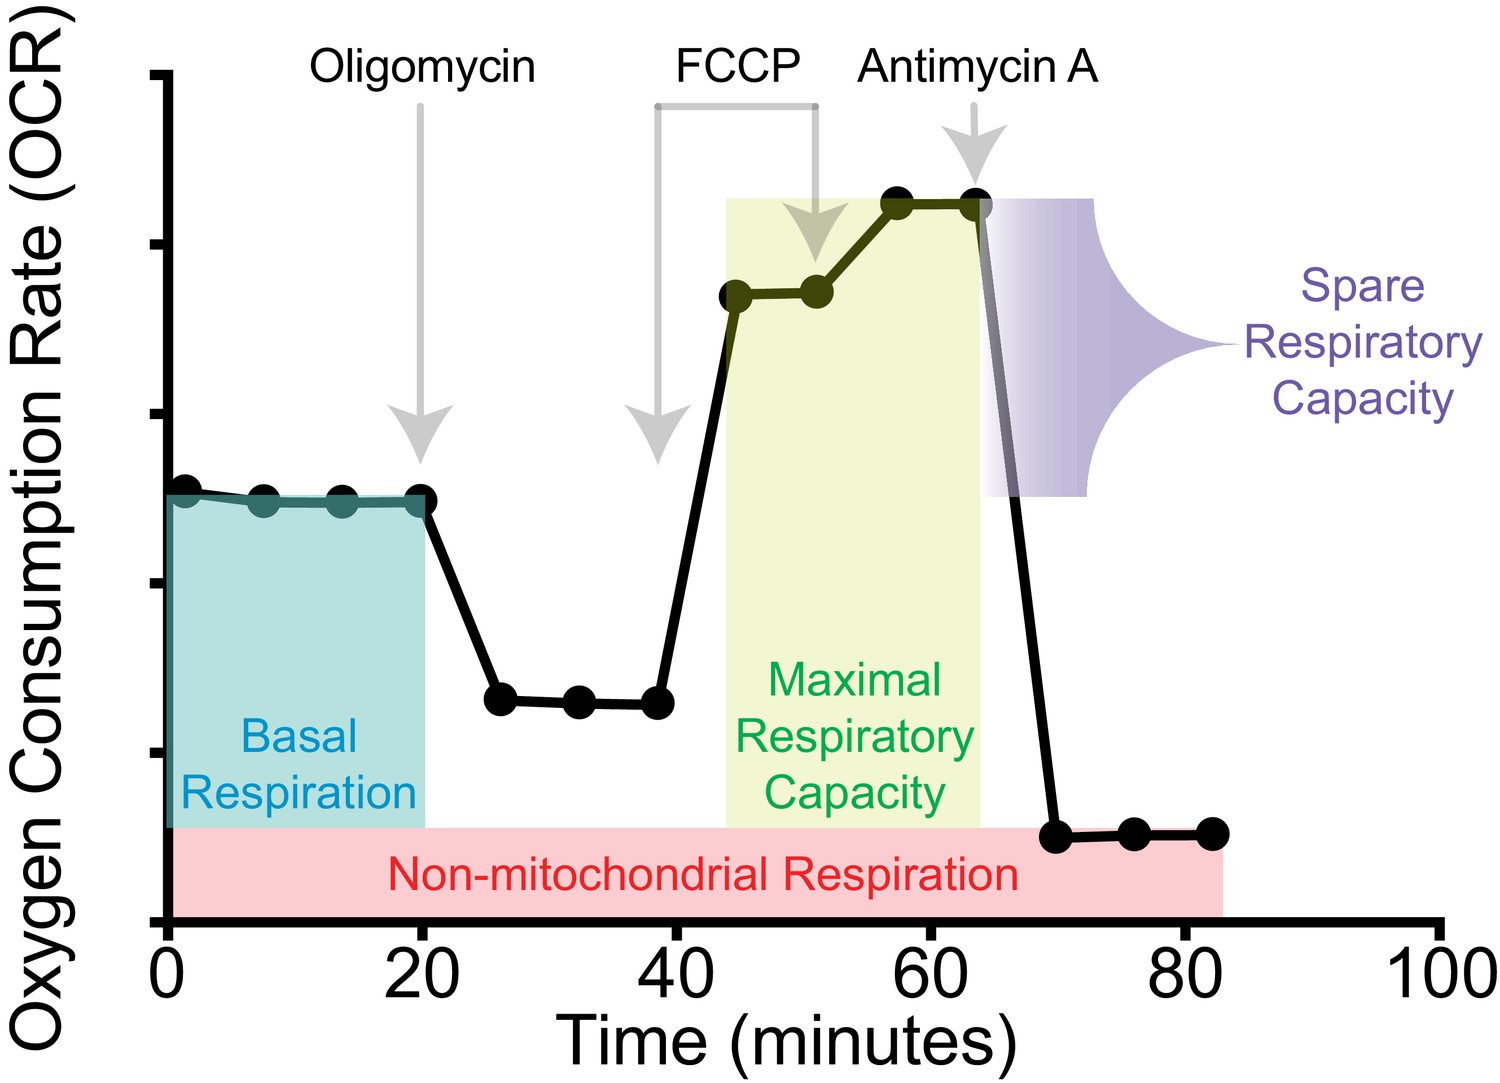
Schematic of the Seahorse Mito Stress Test.
Annotated plot of oxygen consumption as a function of time, including the identity and timing of drugs injected over the course of a Seahorse Mito Stress Test measurement. Annotations indicate how OXPHOS parameters presented in Figure 4A are quantified.
Figure 4—figure supplement 2
Confocal microscopy of stable isolated mitochondrial recipient (SIMR) lines.
Confocal microscopy of SIMR clones formed in 143BTK– ρ0 cells with 143BTK– parental, HEK293T dsRed mitochondrial donor, and 143BTK– ρ0 controls. The MitoCeption SIMR clone data on the left represents the SIMR line that lost respiration following freeze-thaw. Mitochondria were stained with anti-TOM20 antibody and labeled red, double-stranded DNA was stained with anti-dsDNA antibody and labeled green, and cell nuclei were stained with NucBlue (Hoechst 33342)and labeled blue. The 143BTK–, 143BTK– ρ0, and HEK293T dsRed control images are the same images used in Figure 4B. Scale bars indicate 15 µm.
Tables
Key resources table
| Reagent type (species) or resource | Designation | Source or reference | Identifiers | Additional information |
|---|---|---|---|---|
| Cell line (Homo sapiens) | 143 BTK– ρ0 osteosarcoma | Patananan et al., 2020, ATCC | Cat. #CRL-8303; RRID:CVCL_9W36 | |
| Cell line (Homo sapiens) | 143 BTK– osteosarcoma | ATCC | Cat. #CRL-8303; RRID:CVCL_9W36 | |
| Cell line (Homo sapiens) | BJ ρ0 foreskin fibroblast (male) | Patananan et al., 2020 ATCC | Cat. #CRL-2522; RRID:CVCL_3653 | |
| Cell line (Homo sapiens) | HEK293T dsRed | Miyata et al., 2014 | A gift from the laboratory of Dr. Carla Koehler | |
| Cell line (M. musculus) | B16 ρ0 melanoma | Dong et al., 2017 | A gift from the laboratory of Dr. Michael Berridge | |
| Cell line (M. musculus) | L929 fibroblasts | ATCC | Cat. #CCLl-1 | |
| Antibody | Anti-TOMM20 (Rabbit monoclonal) | Abcam | Cat. #ab78547 RRID:AB_2043078 | IF(1:1000) |
| Antibody | Anti-dsDNA (Mouse monoclonal) | Abcam | Cat. #ab27156 RRID:AB_470907 | IF(1:1000) |
| Antibody | Anti-rabbit IgG (Donkey polyclonal) | Thermo Fisher Scientific | Cat. #A-31573 RRID:AB_2536183 | IF(1:100) |
| Antibody | Anti-mouse IgG (Donkey polyclonal) | Thermo Fisher Scientific | Cat. #A-21202 RRID:AB_141607 | IF(1:100) |
| Commercial assay or kit | Qproteome Mitochondria Isolation kit | Qiagen | Cat. #37612 | |
| Commercial assay or kit | BCA protein assay | Thermo Fisher | Cat. #23225 | |
| Chemical compound, drug | Propidium iodide | Thermo Fisher Scientific | Cat. #P1304MP | |
| Chemical compound, drug | Accutase | Thermo Fisher Scientific | Cat. #A1110501 | |
| Chemical compound, drug | 16% paraformaldehyde | Thermo Fisher Scientific | Cat. #28906 | |
| Chemical compound, drug | Triton-X 100 | Sigma | Cat. #X100 | |
| Chemical compound, drug | ProLong Gold Antifade Mountant with DAPI | Invitrogen | Cat. #P3691 | |
| Chemical compound, drug | ProLong Glass Antifade Mountant with NucBlue Stain | Thermo Fisher Scientific | Cat. #P36985 | |
| Chemical compound, drug | Uridine | Thermo Fisher Scientific | Cat. #AC140770250 | |
| Chemical compound, drug | Galactose | Sigma-Aldrich | Cat. #G5388-100G | |
| Chemical compound, drug | CellMask Green PM | Molecular Probes | Cat. #C37608 | |
| Chemical compound, drug | Alexa Fluor 488 conjugated Wheat Germ Agglutinin | Invitrogen | Cat. #W11261 | |
| Chemical compound, drug | Crystal violet | Thermo Fisher Scientific | Cat. #C581-25 | |
| Software, algorithm | Wave 2.6.2 | Agilent | RRID:SCR_014526 | |
| Software, algorithm | FlowJo 10.6.2 | BD Biosciences | RRID:SCR_008520 | |
| Software, algorithm | IDEAS 6.2 | Luminex | ||
| Software, algorithm | Multiphysics 5.3 | COMSOL | RRID:SCR_014767 | |
| Software, algorithm | Imaris Viewer 9.5.1 | Oxford Instruments | RRID:SCR_007370 | |
| Software, algorithm | Imaris File Converter 9.5.1 | Oxford Instruments | RRID:SCR_007370 | |
| Software, algorithm | Prism v.8 | Graphpad | RRID:SCR_002798 | |
| Software, algorithm | LAS X Lite 3.7.1.21655 | Leica | ||
| Software, algorithm | FIJI | Schindelin et al., 2012 | ||
| Other | Dialyzed FBS | Life Technologies | Cat#26400–044 | |
| Other | 12–well 3.0 µm Transparent PET Membrane | Corning | Cat#353181 | |
| Other | Glass coverslips | Zeiss | Cat#474030–9000 | |
| Other | V3 96-well plate | Agilent | Cat#101085–004 | |
| Other | Variable voltage MitoPunch apparatus | ImmunityBio | Inquiries regarding this device can be made to the corresponding author |
Additional files
Download links
A two-part list of links to download the article, or parts of the article, in various formats.
Downloads (link to download the article as PDF)
Open citations (links to open the citations from this article in various online reference manager services)
Cite this article (links to download the citations from this article in formats compatible with various reference manager tools)
Stable transplantation of human mitochondrial DNA by high-throughput, pressurized isolated mitochondrial delivery
eLife 10:e63102.
https://doi.org/10.7554/eLife.63102


