Phosphorylation of luminal region of the SUN-domain protein Mps3 promotes nuclear envelope localization during meiosis
- Institute for Protein Research, Osaka University, Japan
- Kyoto Pharmaceutical University, Japan
Figures
Figure 1 with 9 supplements
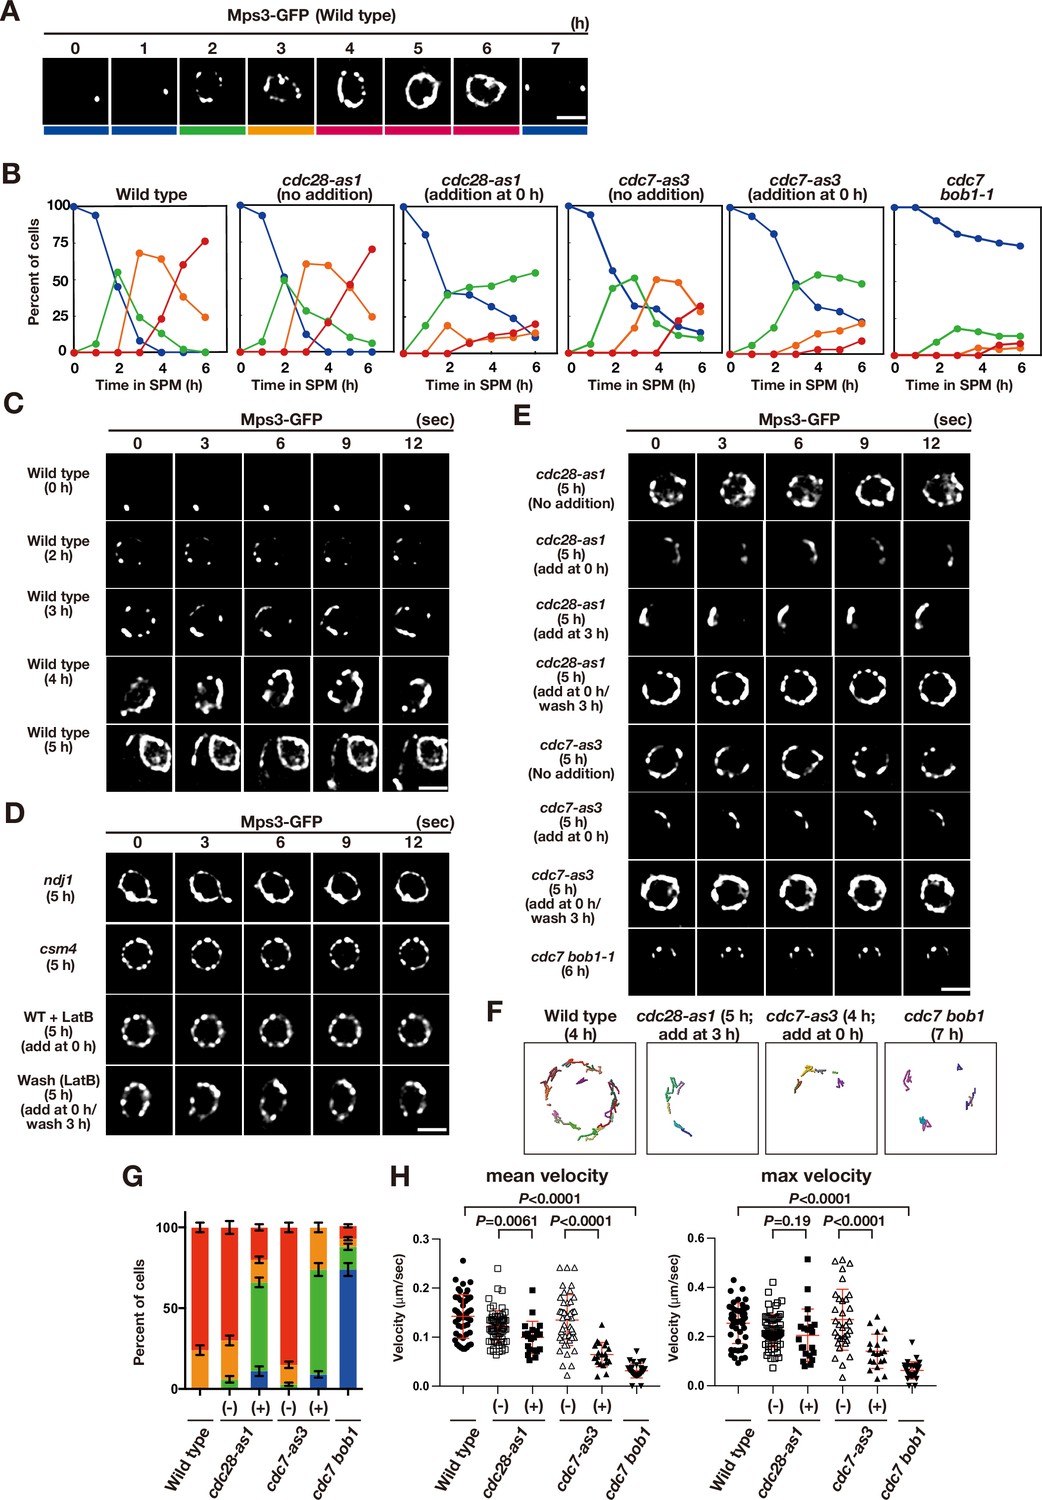
Meiotic Mps3 localization and movement on NEs.
(A) Mps3-GFP localization was analyzed in wild-type cells (PRY64) at various time points during meiosis. Representative images at each time are shown. Bottom color bars indicate classes of Mps3-localization in (B). Bar indicates 2 μm. (B) Based on Mps3-GFP localization, cells with Mps3-GFP were classified into four classes (A) and quantified: single Mps3 focus (blue), 2–5 foci (green), more than five foci/patches (orange), and coverage of the Mps3 signal on NE (red). At each time point, more than 100 nuclei were counted. The graphs are a representative of two independent time courses. (C) Time-lapse analysis of Mps3-GFP in the wild-type strain (PRY64) at different time points in meiosis. A single focal plane of a cell every 3 s is shown. See Figure 1—videos 1–4. (D) Time-lapse analysis of Mps3-GFP in various strains at different time points in meiosis. A single focal plane of a cell was analyzed every 3 s. The inhibitor LatB (30 μM) was added at 0 h. See Figure 1—video 5. While washing, the inhibitor was washed at 5 h, and the cells were analyzed at 6 h. Wild type, PRY64; ndj1, PRY192; csm4, PRY198. (E) Time-lapse analysis of Mps3-GFP in the cdc28-as1 mutant (PRY71) treated with or without the inhibitor 1NM-PP1 (0.5 μM) at 5 h during meiosis. The inhibitor was added at 0 h (second panels) or 3 h (third panels). While washing (fourth panels), the inhibitor was added at 0 h and washed at 3 h, and the cells were analyzed at 5 h. Time-lapse analysis of Mps3-GFP in the cdc7-as3 mutant (PRY260) treated with or without the inhibitor PP1 (15 μM). The cdc7 bob1-1 mutant (PRY115) was analyzed at 6 h. See Figure 1—videos 6–8. (F) Tracking of Mps3-GFP in wild type, cdc28-as1 (PRY71 with the inhibitor), cdc7-as3 (PRY260 with the inhibitor), and cdc7 bob1-1 (PRY115). Tracking was monitored for all Mps3 foci/patches in a single cell for 20 s at 4 or 5 h in SPM. Each line represents tracking of the foci at a single focal plane. (G) Percentages of cells with different classes of Mps3-GFP were quantified at 5 h under different conditions (triplicates, Error bars show standard deviation; s.d.); single Mps3 focus (blue), 2–5 foci (green), more than five foci/patches (orange), and coverage of the Mps3 signal on NE (red). (H) Velocity of Mps3-GFP foci or patches was quantified. Time-lapse images were taken for every second in 20 s. Mps3-GFP foci or patches were identified as shown in Materials and Methods and followed for their tracks. For each track, an average velocity and maximum velocity were calculated. More than 20 cells were analyzed for the quantification. Red lines show mean with s.d. p-Values were calculated using Mann-Whitney’s U-test.
-
Figure 1—source data 1
Source data for Figure 1.
- https://cdn.elifesciences.org/articles/63119/elife-63119-fig1-data1-v2.xlsx
Figure 1—figure supplement 1
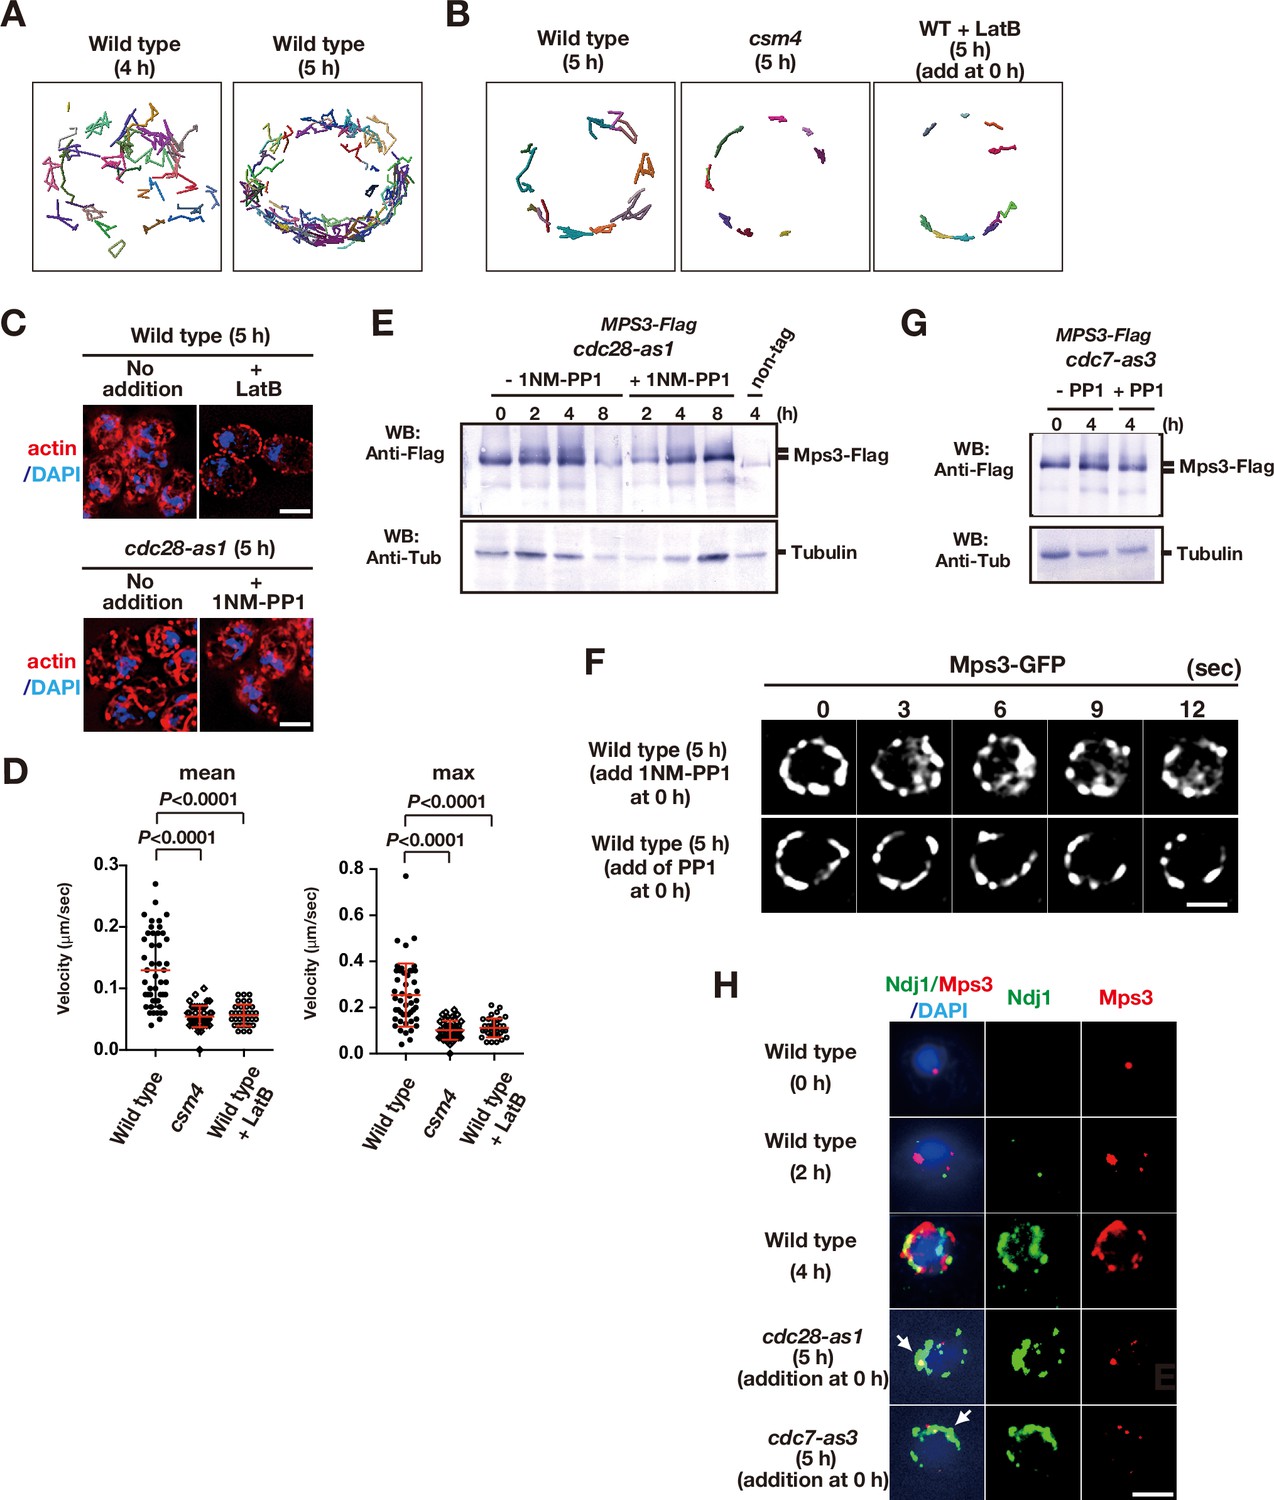
Meiotic movements of Mps3 and Rap1 in the presence of the inhibitors.
(A) Tracking of Mps3-GFP in wild type. Tracking was monitored for all Mps3 foci/patches in a single cell (PRY64) for 120 s. Each line with different colors, representing a single focus/patch, show tracking of the objects at a single focal plane. (B) Tracking of Mps3-GFP in wild type. Tracking was monitored for all Mps3 foci/patches in a single cell (PRY64) for 20 s. See (A). (C) Cytoplasmic actin cables were visualized by Phalloidin (red) and DAPI (purple) staining of cdc28-as1 (PRY68) cells after 5 h of incubation in SPM both without (left) or with (middle) its inhibitor 1NM-PP1 from 0 h. As a control, the mutant cells were treated with 30 μM of latrunculin B (LatB) at 4 h and analysed for actin staining at 5 h (right). Bar indicates 2 μm. (D) Velocity of Mps3-GFP foci or patches were quantified. Methods are shown in Figure 1H. More than 20 cells were analyzed for the quantification. Red lines show mean with s.d. p-Values were calculated using Man-Whitney’s U-test. (E) Western blotting analysis of Mps3-Flag protein. Cell lysates from the cdc28-as1 (PRY13) cells at different times in meiosis. The cdc28-as1 cells treated with or without 1NM-PP1 from 0 h. Tubulin is a control. (F) To check the off-target of two inhibitors, 1NM-PP1 and PP1, wild-type diploid cells (HKY404) with Mps3-GFP were grown in the presence of each inhibitor (0.5 μM of 1NM-PP1, top panels; 15 μM PP1, bottom panels). The inhibitors were added at 0 h (second panels) and time-lapse images were examined in 5 h-incubation with SPM. The two inhibitors did not affect rapid movement of Mps3-GFP foci on NEs. Bar indicates 2 μm. (G) Western blotting analysis of Mps3-Flag protein. Cell lysates from the cdc7-as3 (PRY72) cells at 0 and 5 h in meiosis. The cdc7-as3 cells treated with or without PP1 from 0 h and collected at 5 h. Tubulin is a control. (H) Whole-cell staining analysis of Mps3-Flag and Ndj1. Various cells were stained with anti-Flag for Mps3-Flag (red) and anti-HA for Ndj1 (green) at the nuclear periphery at indicated times. cdc28-as1 (PRY13) and cdc7-as3 (PRY72) cells were treated with their inhibitor from 0 h and examined at the indicated times. Wild type, HKY404.
Figure 1—video 1
Mps3-GFP in a wild-type cell at 0 h in SPM.
Figure 1—video 2
Mps3-GFP in a wild-type cell at 4 h in SPM.
Figure 1—video 3
Mps3-GFP in a wild-type cell at 5 h in SPM, showing deformation.
Figure 1—video 4
Mps3-GFP in a wild-type cell at 5 h in SPM, showing protrusion.
Figure 1—video 5
Mps3-GFP in a wild-type cell treated with LatB (0 h) at 5 h in SPM.
Figure 1—video 6
Mps3-GFP in cdc28-as1 cells treated with 1NM-PP1 (0 h) at 5 h in SPM.
Figure 1—video 7
Mps3-GFP in a cdc7-as3 cell treated with PP1 (0 h) at 5 h in SPM.
Figure 1—video 8
Mps3-GFP in a cdc7 bob1-1 cell at 5 h in SPM.
Figure 2 with 6 supplements
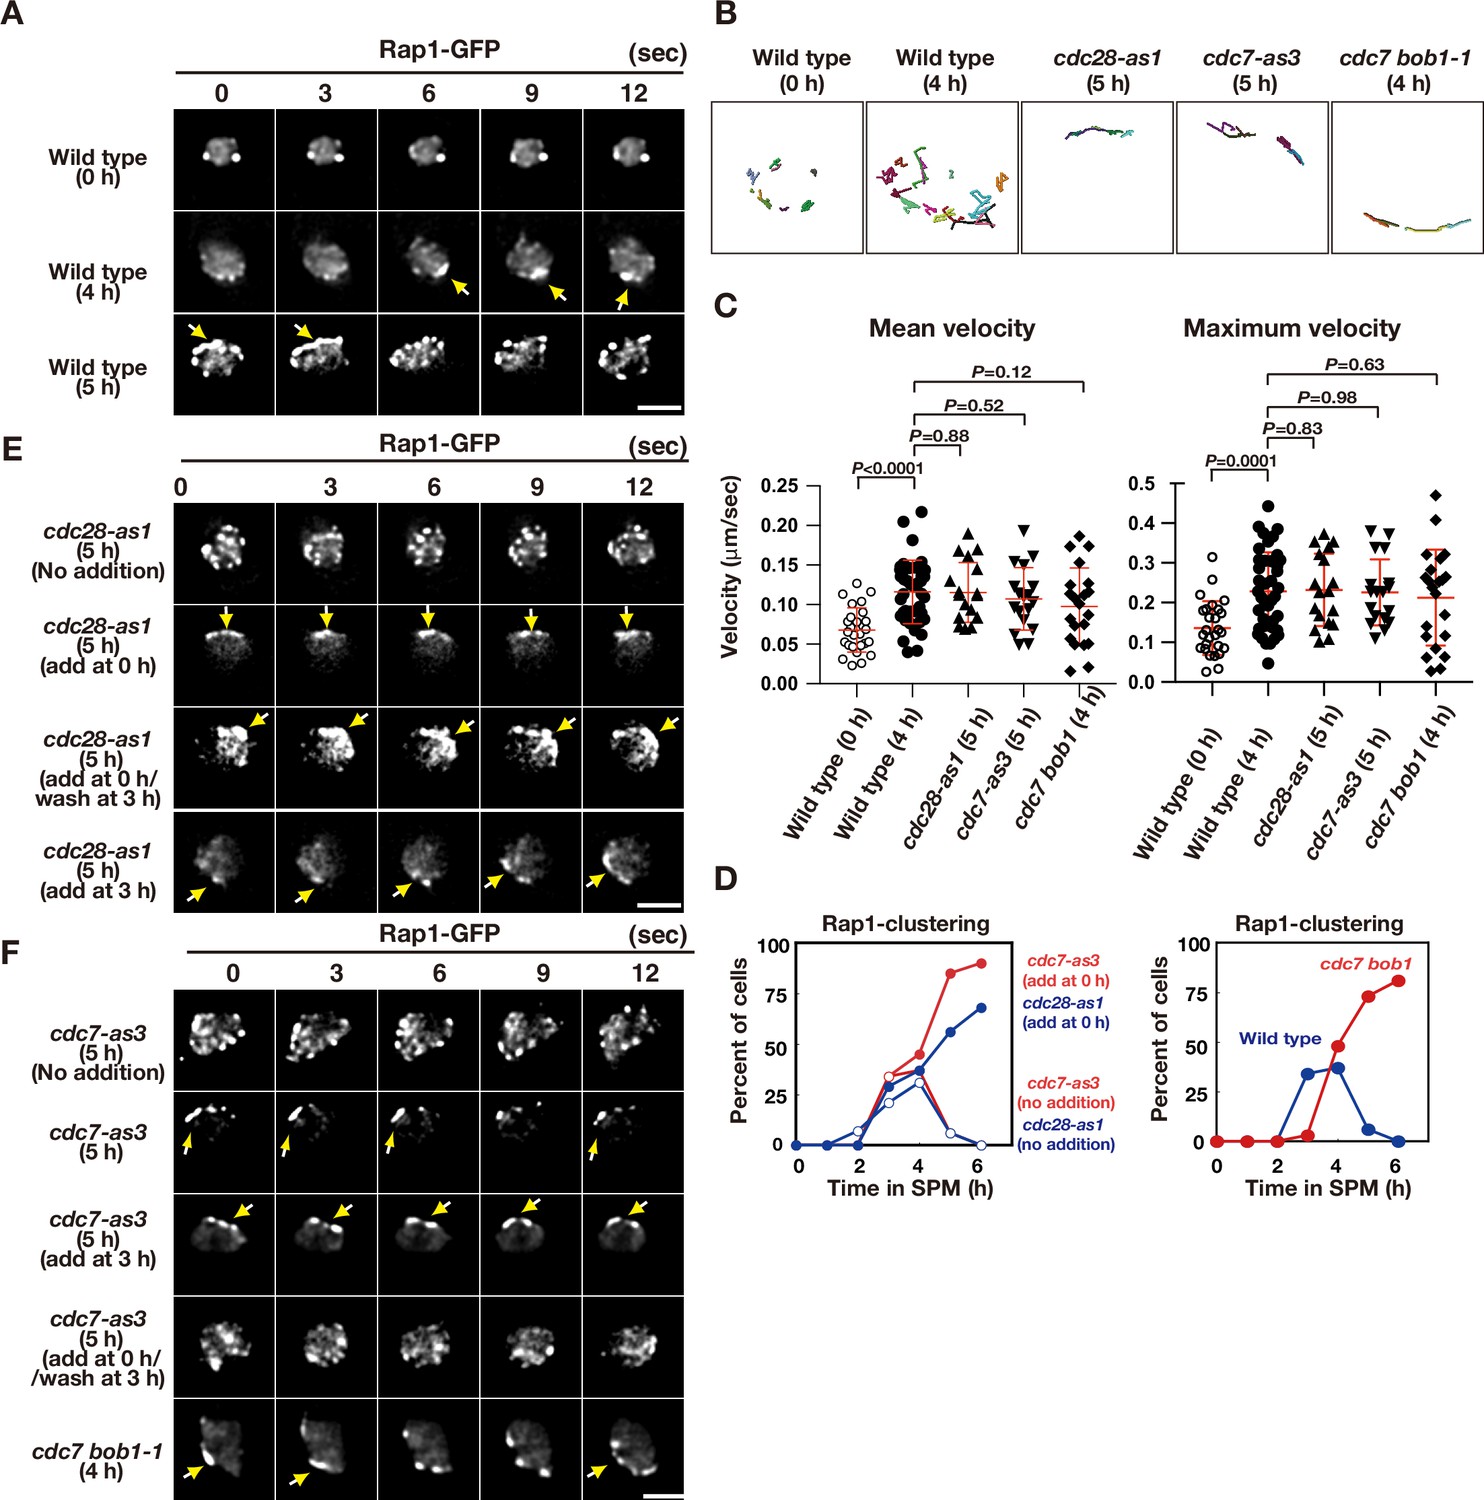
Meiotic telomere movement in cdk and ddk mutants.
(A) Time-lapse analysis of Rap1-GFP in wild type (HKY167) at different time points during meiosis. An image of a single focal plane of each mutant cell was taken every 3 s. Clustering of telomeres is shown by yellow arrows. Bar indicates 2 μm. See Figure 2—videos 1 and 2. (B) Tracking of Rap1-GFP in wild type (0 and 4 h), cdc28-as1 (with the inhibitor), and cdc7-as3 (with the inhibitor). Tracking was monitored for all Rap1 foci in a single cell for 20 s. Each line represents tracking of the center of foci at a single focal plane. (C) Velocity of Rap1-GFP foci or patches were quantified. Time-lapse images were taken for every second in 20 s. Rap1-GFP foci or patches were identified as shown in Methods and followed for their tracks. For each track, an average velocity and maximum velocity were calculated. More than 20 cells were analyzed for the quantification. Red lines show mean with s.d. p-Values were calculated using Man-Whitney’s U-test. (D) Kinetics of telomere clustering during meiosis were quantified. At each time point, more than 150 nuclei were counted for clustering of telomeres (arrows in A, E, F). The graphs are a representative of two independent time course. (left) cdc28-as1 with 1NM-PP1, blue closed circles; cdc28-as1 without 1NM-PP1, blue closed circles; cdc7-as3 with PP1, red closed circles; cdc7-as3 without PP1, red closed circles. (right) wild type, blue closed circles; cdc7 bob1-1, red closed circles. (E) Time-lapse analysis of Rap1-GFP in various strains (cdc28-as1, PRY68) at different time points during meiosis. An image of a single focal plane of each mutant cell was taken every 3 s. The inhibitors (final 0.5 μM of 1NM-PP1) were added at 0 h (second panels) or 3 h (third panels). While washing (bottom panels), the inhibitor was added at 0 h and washed at 3 h, and the cells were analyzed at 5 h. Clustering of telomeres is shown by yellow arrows. Bar indicates 2 μm. See Figure 2—video 3. (F) Time-lapse analysis of Rap1-GFP in various strains (cdc7-as3, PRY79; cdc7 bob1-1, PRY116) at different time points during meiosis. An image of a single focal plane of each mutant cell was taken every 3 s. For the cdc7-as3 mutant, the inhibitors (final 15 μM PP1, respectively) were added at 0 h (second panels) or 3 h (third panels). While washing (bottom panels), the inhibitor was added at 0 h and washed at 3 h, and the cells were analyzed at 5 h. Clustering of telomeres is shown by yellow arrows. Bar indicates 2 μm. See Figure 2—video 4 and Figure 2—video 5.
-
Figure 2—source data 1
Source data for Figure 2.
- https://cdn.elifesciences.org/articles/63119/elife-63119-fig2-data1-v2.xlsx
Figure 2—figure supplement 1

Meiotic movements of Mps3 in the presence of the inhibitors.
To check the off-target of two inhibitors, 1NM-PP1 and PP1, wild-type diploid cells (HKY167) with Rap1-GFP were grown in the presence of each inhibitor (0.5 μM of 1NM-PP1, top panels; 15 μM PP1, bottom panels). The inhibitors were added at 0 h (second panels) and time-lapse images were examined in 5 h-incubation with SPM. The two inhibitors did not affect rapid movement of Rap1-GFP foci on NEs. Bar indicates 2 μm.
Figure 2—video 1
Rap1-GFP in a wild-type cell at 0 h in SPM.
Figure 2—video 2
Rap1-GFP in a wild-type cells at 4 h in SPM.
Figure 2—video 3
Rap1-GFP in a cdc28-as1 cell treated with 1NM-PP1 (0 h) at 5 h in SPM.
Figure 2—video 4
Rap1-GFP in a cdc7-as3 cell treated with PP1 (0 h) at 5 h in SPM.
Figure 2—video 5
Rap1-GFP in a cdc7 bob1-1 cell at 5 h in SPM.
Figure 3 with 1 supplement
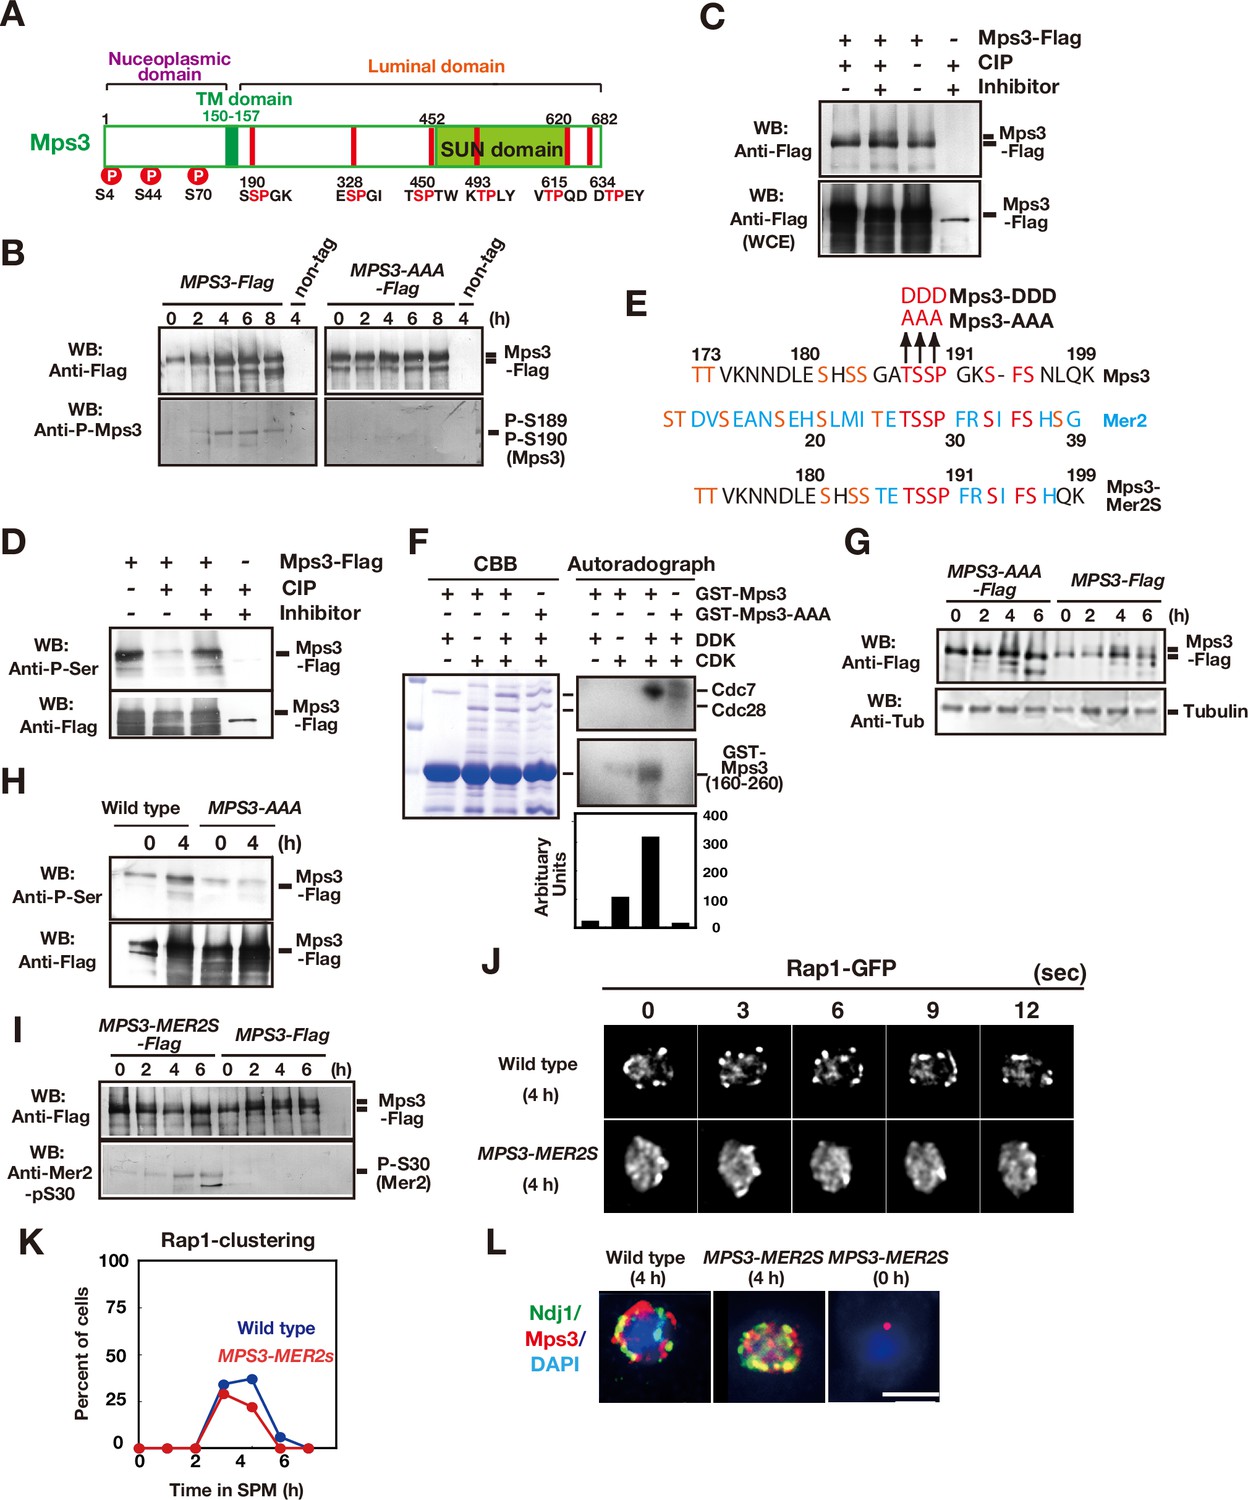
Mps3 is phosphorylated in luminal region.
(A) Schematic representation of the Mps3 protein. The putative transmembrane (TM) region (dark green) and SUN domain (green) are shown with three known phosphorylation sites (red circles) in nucleoplasmic region (Lanz et al., 2021). The position of a CDK consensus site (S/TP) is shown in red lines with aa sequence on the bottom. All the six sites are located in a luminal region of Mps3. (B) Western blotting of the Mps3-Flag protein during meiosis. Wild-type (left, HKY404) and mps3-AAA mutant (middle, PRY163) proteinwere analyzed at different time points. Fractions immunoprecipitated with anti-Flag antibody were probed with anti-Flag antibody (top) as well as a phospho-specific antibody (bottom) that recognized T189 and S190 phosphorylation. (C) In vivo phosphorylation was confirmed by a decreased band shift of Mps3-Flag protein purified from meiotic cell lysates (4 h incubation with SPM) using the anti-Flag antibody. After immuno-precipitation, the precipitate was incubated with 1 unit of CIP for one hour either in the presence or absence of phosphatase inhibitors. Mps3-Flag was detected using anti-Flag (M2) antibody. (D) Affinity-purified-Mps3-Flag from meiotic cell lysates (4 h incubation with SPM) using anti-Flag column was treated with CIP as described in (A) and was probed with anti-Phospho-Serine antibody (Qiagen). During incubation, Mps3 protein was degraded extensively (bottom). (E) Sequence homology of an Mps3 region with a CDK/DDK phosphorylation site of the Mer2 protein. Identical amino acids are shown in red. Putative CDK or DDK phosphorylation sites are shown in orange. Unique amino acid sequence in Mer2 is shown in pale blue. The substitutions (mps3-AAA, MPS3-DDD, and MPS3-MER2S) for the putative phosphorylation sites of Mps3 are shown on the top. (F) In vitro phosphorylation analysis of GST-Mps3 fusion proteins. Purified wild-type GST-Mps3 and GST-Mps3-AAA fragments (shown on the left by Coomassie staining) were incubated with different combinations of partially purified the Cdc28–Clb5 complex and/or Cdc7–Dbf4 kinase complexes in the presence of γ-32P-ATP. After 1 h incubation, proteins were fractionated on a SDS-PAGE gel and analyzed using a phosphorimager for incorporation of 32P in the Mps3 fragments (right bottom) and Cdc28/Cdc7 protein (right top). Cdc7 was phosphorylated by CDK. Quantification is shown below the autoradiogram. (G) Western blotting of Mps3 and tubulin at various times in meiosis. Cell lysates from the MPS3-Flag (right, HKY404) and MPS3-AAA-Flag (left, PRY163) strains were analyzed by western blotting using anti-Flag and anti-tubulin antibodies. The wild-type Mps3 protein shows band shift during meiosis for example at 4 and 6 h. (H) Reactivity of wild-type Mps3-Flag and Mps3-AAA mutant protein to anti-phospho-serine antibody was examined by western blotting. wild type Mps3-Flag and Mps3-AAA mutant protein at each time point were IPed and probed with the antibody. While wild type Mps3-Flag shows an increase reactivity to the antibody, Mps3-AAA-Flag did not increase the reactivity in meiosis (4 h) compared to mitosis (0 h). (I) Western blotting of the Mps3-Flag protein during meiosis. Wild-type (left, HKY404) and MPS3-MER2S proteins (right, PRY514) were analyzed at different time points. Fractions immunoprecipitated with anti-Flag antibody were probed with anti-Flag and anti-Mer2-phospho-S30 antibodies. (J) Rap1-GFP dynamics at 4 h of meiosis analyzed in MPS3-MER2s (PRY518) and wild-type (HKY167) strains. (K) Kinetics of Rap1 clustering in each strain is shown in G. Counting was performed as described in Figure 2D. Blue, wild type; red, MPS3-MER2S. (L) Localization of Ndj1-HA (green), Mps3-Mer2S-Flag (red), and DAPI (dark blue) was analyzed by whole cell staining of PRY514. Bar indicates 2 μm.
-
Figure 3—source data 1
Source data for Figure 3.
- https://cdn.elifesciences.org/articles/63119/elife-63119-fig3-data1-v2.xlsx
-
Figure 3—source data 2
Source data for Figure 3.
- https://cdn.elifesciences.org/articles/63119/elife-63119-fig3-data2-v2.zip
Figure 3—figure supplement 1
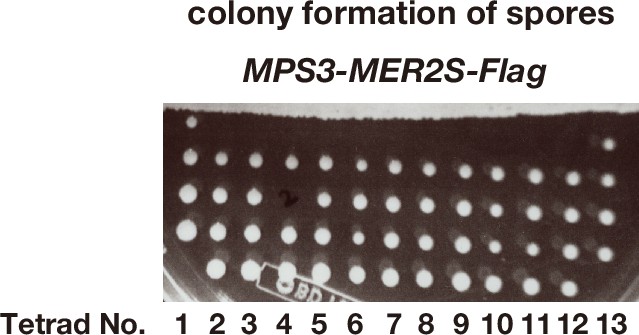
MPS3-MER2S-Flag shows wild-type spore viability.
Image of a part of a tetrad dissection plate of spores from MPS3-MER2S-Flag diploid cells (n = 13). After the dissection, the plate was incubated at 30°C for 2 days. One spore in one tetrad (No. 3) did not generate a colony.
Figure 4 with 5 supplements
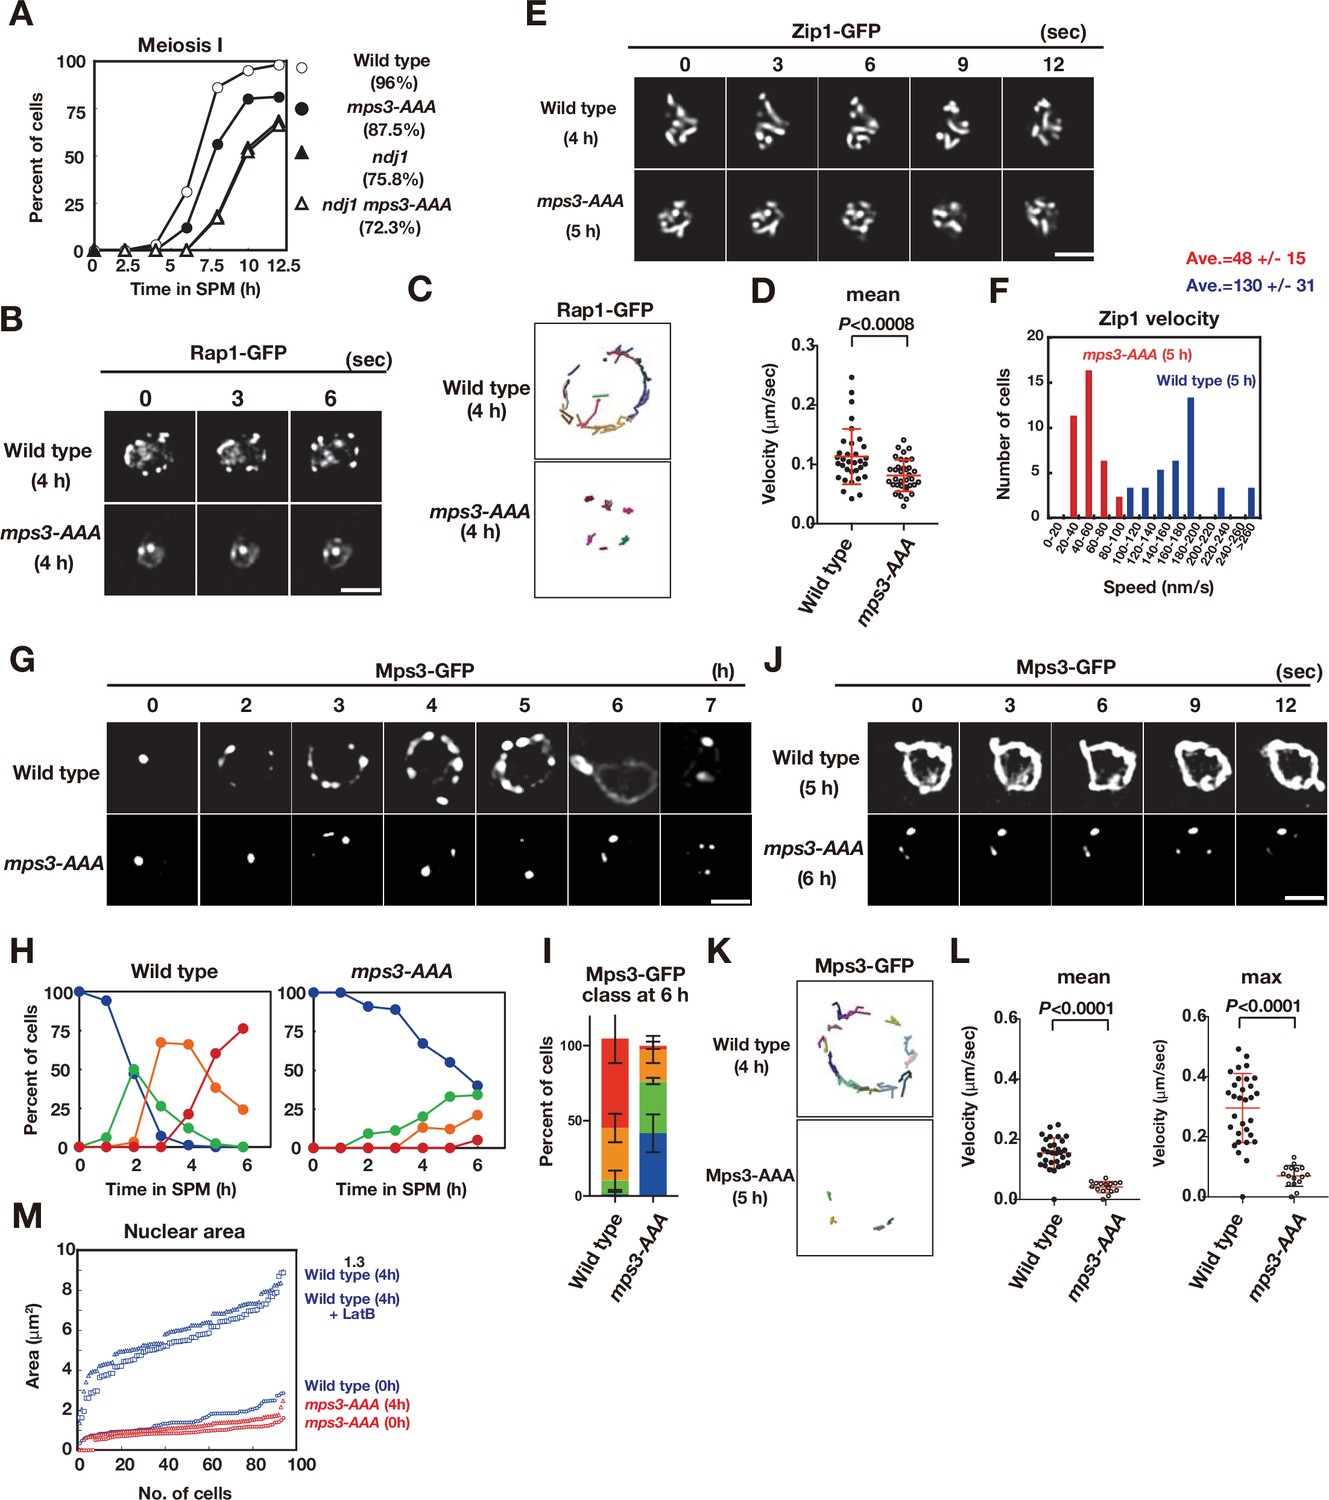
The mps3-AAA mutant impairs telomere and NE expansion.
(A) Meiosis division was analyzed by DAPI staining for various strains. More than 100 cells were counted for divisions. The graphs are a representative of two independent time course. Spore viability of each strain is shown in parenthesis. At least 100 asci were dissected for each strain. (B) Time-lapse analysis of Rap1-GFP in the wild-type (HKY167) and mps3-AAA (PRY138) strains at different time points in meiosis. A single focal plane of a cell was analyzed every 3 s. A tethering defect was observed in the mps3-AAA strains. Bar indicates 2 μm. See Figure 4—video 1 for mps3-AAA. (C) Tracking of Rap1-GFP in wild type and mps3-AAA for 20 s. See Materials and methods in Figure 2B. (D) Velocity of Rap1-GFP foci or patches were quantified. See Materials and Methods in Figure 2C. Red lines show mean with s.d. p-Values were calculated using Man-Whitney’s U-test. (E) Time-lapse analysis of Zip1-GFP in wild type (SEY672) and mps3-AAA (PRY332). mps3-AAA. See Figure 4—videos 2 and 3. (F) Tracing of Zip1-GFP shows a step size of each Zip1-GFP line. Step size per given time is converted into the relative velocity of chromosomes. n = 35. Blue bars; wild type; red bars, mps3-AAA. (G) Localization of wild-type Mps3-GFP (PRY64) and Mps3-AAA-GFP (PRY186) proteins in a cell at different time points in meiosis. (H) Kinetics of Mps3 distribution. Based on Mps3-GFP morphology, cells with Mps3-GFP were classified into four classes and quantified: 2–5 foci (green), more than five foci/patches (orange), and coverage on NE (red). See Figure 1B for quantification. (I) Percentages of cells with different classes of Mps3-GFP were quantified at 5 h in different conditions (triplicates, Error bars show standard deviation; s.d.); single Mps3 focus (blue), 2–5 foci (green), more than five foci/patches (orange), and coverage of the Mps3 signal on NE (red). (J) Time-lapse analysis of wild type and Mps3-AAA-GFP during meiosis. See Figure 4—video 4 for Mps3-AAA-GFP. (K) Tracking of Mps3-GFP in wild type and mps3-AAA for 20 s. See Figure 1F for quantification. (L) Velocity of Mps3-GFP foci or patches were quantified. Methods are shown in Figure 1H. More than 20 cells were analyzed for the quantification. Red lines show mean with s.d. p-Values were calculated using Man-Whitney’s U-test. (M) The maximum sectional area of each nucleus was measured using the Velocity program. Each area of the 96 nuclei is ranked in the figure. Graphs for wild type and mps3-AAA at 0 and 4 h as well as wild type treated with LatB are shown.
-
Figure 4—source data 1
Source data for Figure 4.
- https://cdn.elifesciences.org/articles/63119/elife-63119-fig4-data1-v2.xlsx
Figure 4—figure supplement 1
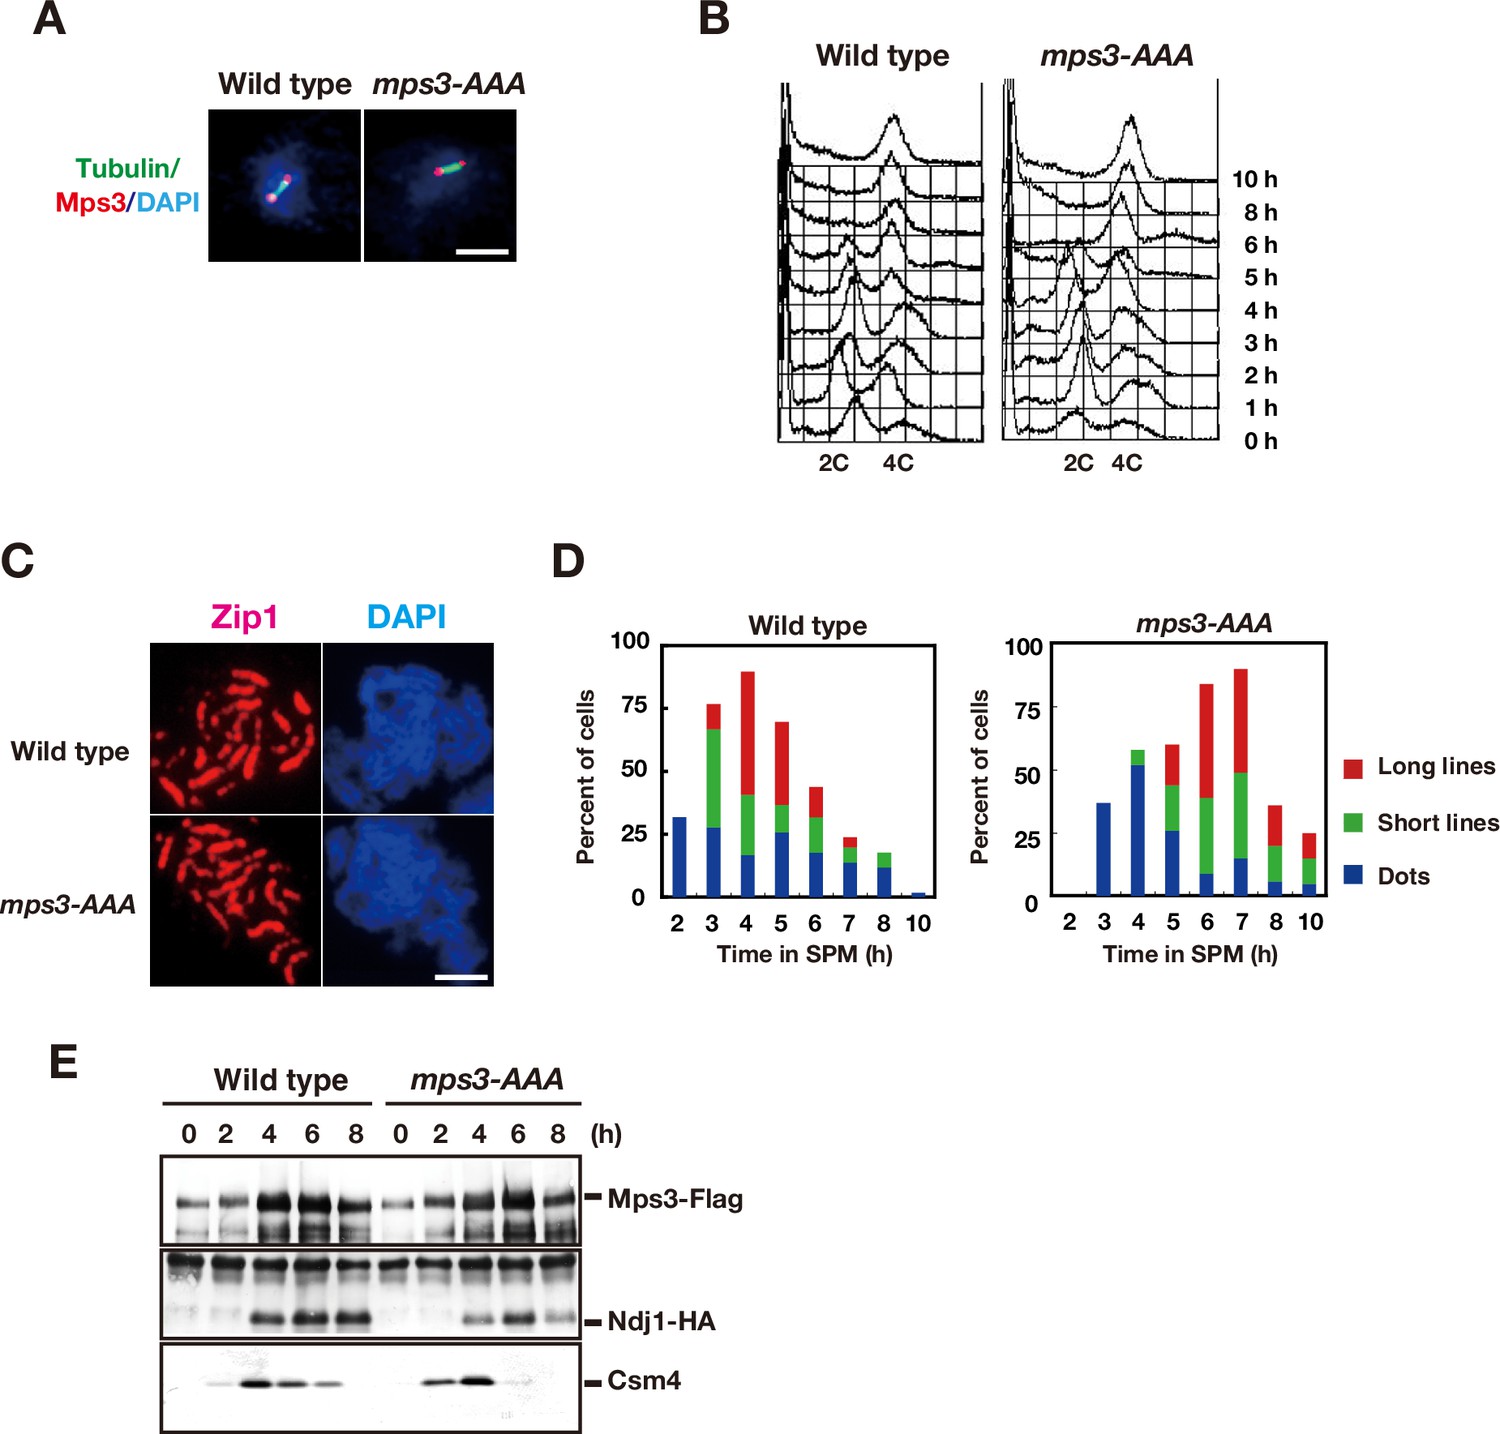
CDK and DDK are necessary for Mps3 localization on NE.
(A) Whole cell staining of Mps3-Flag and Tubulin. Wild type (MSY832/833) and the mps3-AAA mutant (PRY122) cells in mitosis were stained with anti-Flag (red) and anti-tubulin (green). Representative images with short spindles with two Mps3 foci are shown. Bar indicates 2 μm. (B) FACS analysis of DNA contents in wild type and the mps3-AAA mutant cells at indicated times. Cells at each time point were fixed and stained with propidium iodide (PI) and analyzed by FACS after the sonication. (C) Immunostaining analysis of meiotic chromosome proteins. For SC formation, Zip1 localization (red) with DAPI (blue) image is also analyzed for wild type (top) and mps3-AAA mutant strains (bottom) at 4 h. (D) Kinetics of SC formation. SC elongation was analyzed by staining Zip1 protein. Class I (blue) contains Zip1 dots, Class II (green) contains partial lines of Zip1, and Class III (red) contains fully elongated Zip1 lines. At each time point, more than 50 nuclei were counted. The graphs are a representative of two independent time course. (E) Interaction of Mps3-Flag with Ndj1-HA and Csm4 in the mps3-AAA mutant was confirmed by immuno-precipitation using anti-Flag antibodies. IPed fractions of cells with Mps3-Flag (left, HKY404) or Mps3-AAA-Flag (right, PRY163) at each time point were probed with anti-Flag (top), anti-HA (middle) and anti-Csm4 antibodies.
Figure 4—video 1
Rap1-GFP in mps3-AAA cells at 5 h in SPM.
Figure 4—video 2
Zip1-GFP in a wild-type cell at 5 h in SPM.
Figure 4—video 3
Zip1-GFP in mps3-AAA cells at 6 h in SPM.
Figure 4—video 4
Mps3-AAA-GFP at 5 h in SPM.
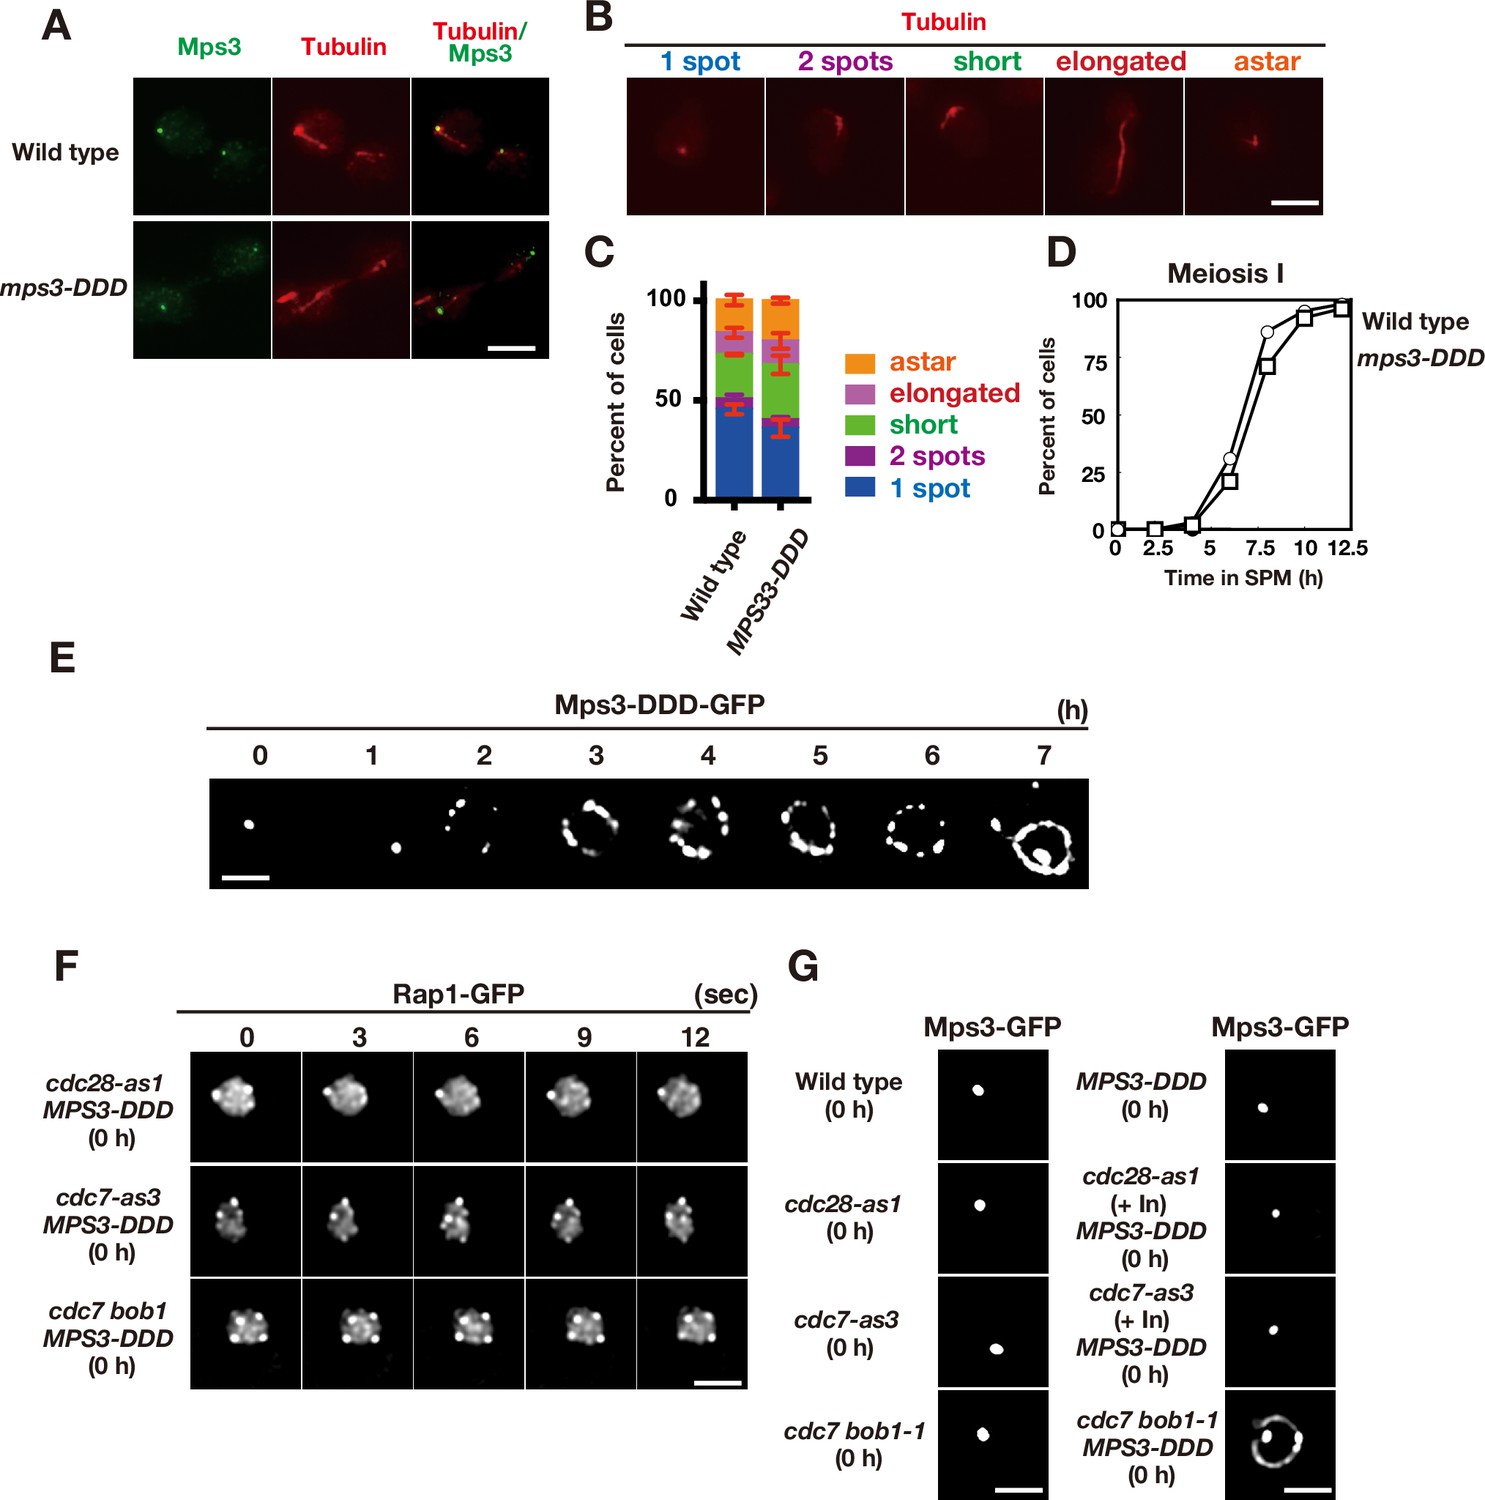
Figure 5 with 9 supplements
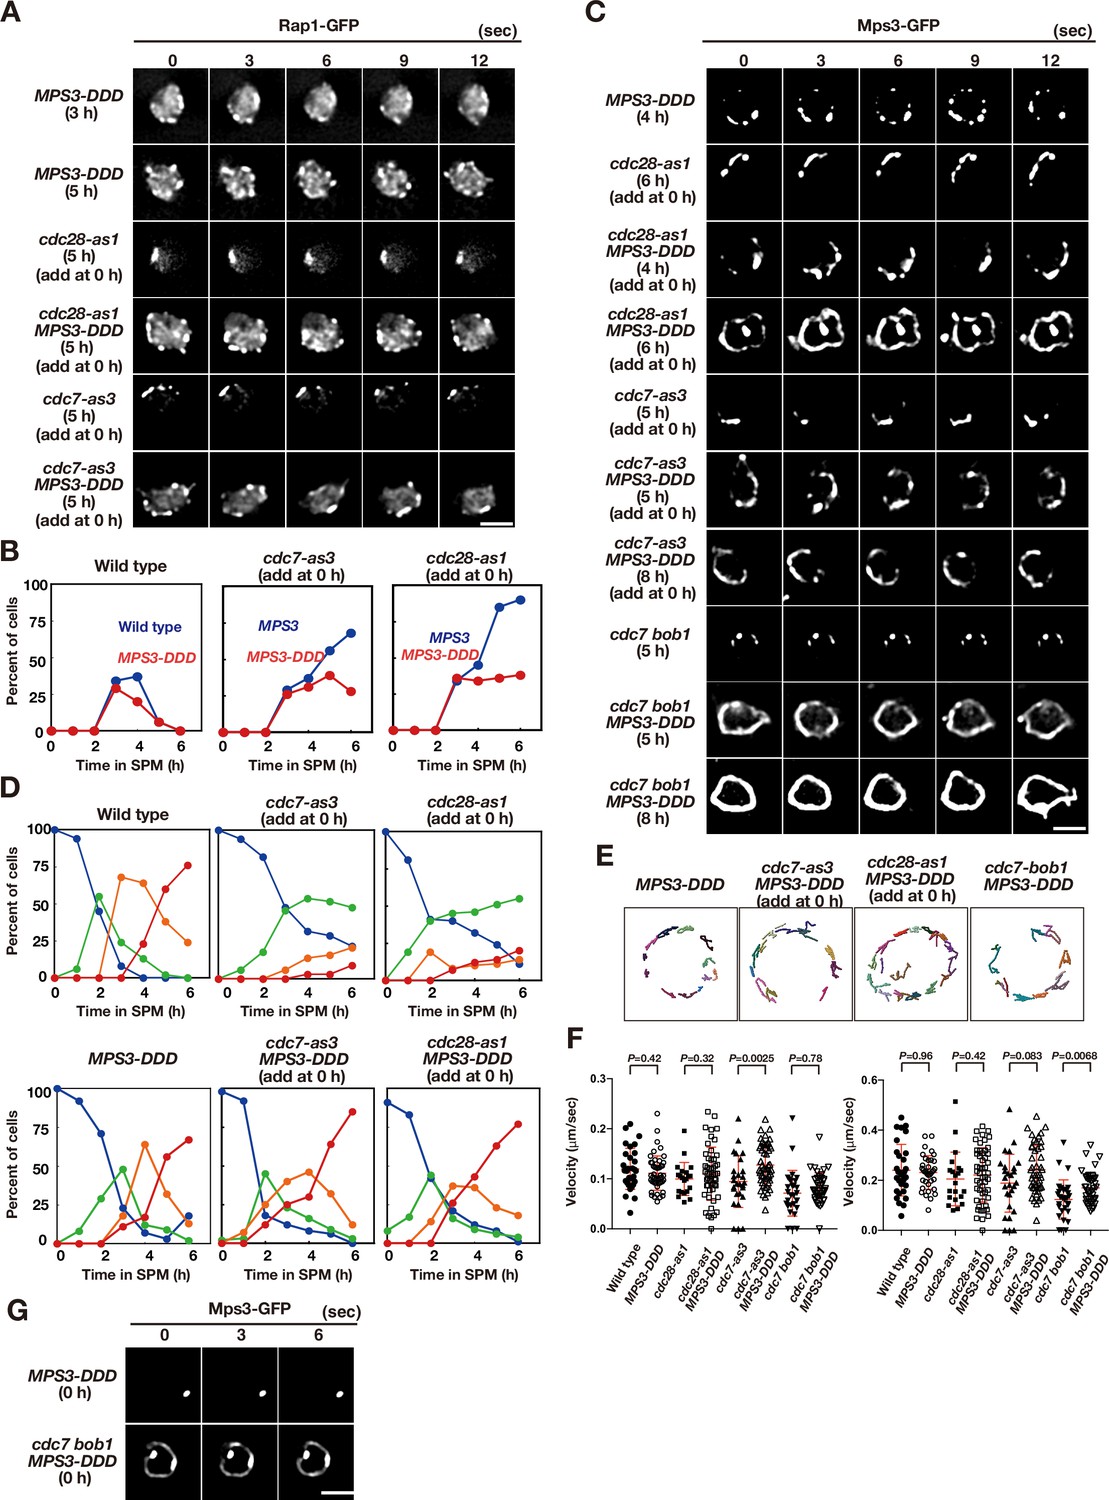
Acid amino acids in lumen of Mps3 can suppress CDK and DDK defects.
(A) Time-lapse analysis of Rap1-GFP in a phosphomimetic allele of MPS3, MPS3-DDD (PRY211), with a different combination of cdc28-as1 (PRY211), cdc7-as3 (PRY301), and cdc7 bob1-1 (PRY272) mutations in meiosis. A single focal plane of a cell was analyzed at every 3 s. Bar indicates 2 μm. See Figure 5—videos 2–5. (B) Kinetics of clustering of telomere as Rap1-clusters was studied in cdc7-as3 (left, PRY309) and cdc28-as1 (right, PRY303) in the presence of its specific inhibitors. Wild type (blue, HKY167) and MPS3-DDD (PRY236) with the allele was used. (C) Time-lapse analysis of Mps3-DDD-GFP with different mutant alleles and in treatment with a specific inhibitor at different time points in meiosis. See Figure 5—videos 1 and 6–8. (D) Kinetics of Mps3. Based on Mps3-GFP morphology, cells with Mps3-GFP were classified into four classes and quantified: single Mps3 focus (blue), 2–3 foci (green), 4–5 foci (orange), and more than five foci (red). See Figure 1B for quantification. Graphs for wild type, cdc28-as1, and cdc7-as3 cells are the same as in Figure 1B. (E) Tracking of Mps3-GFP in MPS3-DDD, cdc28-as1 MPS3-DDD (with 1NM-PP1), cdc7-as3 MPS3-DDD (with PP1), and cdc7 bob1-1MPS3-DDD for 20 s. (F) Velocity of Mps3-GFP foci or patches were quantified. Methods are shown in Figure 1H. More than 20 cells were analyzed for the quantification. Red lines show mean with s.d. p-Values were calculated using Man-Whitney’s U-test. (G) Time-lapse analysis of Mps3-DDD-GFP with different mutant alleles during vegetative growth.
-
Figure 5—source data 1
Source data for Figure 5.
- https://cdn.elifesciences.org/articles/63119/elife-63119-fig5-data1-v2.xlsx
Figure 5—figure supplement 1
Meiotic phenotypes of MPS3-DDD mutants.
(A) Whole cell staining of Mps3-Flag and Tubulin. Wild type (MSY832/833) and the mps3-DDD mutant (PRY122) cells during vegetative growth were stained with anti-Flag (red) and anti-tubulin (green). Representative images with short spindles with two Mps3 foci are shown. Bar indicates 2 μm. (B) Different classes of tubulin staining (red) in vegetative yeast cells.(C) Cells with different tubulin classes (B) were counted (n = 30) and percentages of each class in wild type and the MPS3-DDD strains (PRY201) are shown (n = 3). Error bars show s.d. (D) Meiosis I division was analyzed by DAPI staining for wild type and the MPS3-DDD strains (PRY201). At each time point, more than 100 nuclei were counted. The graphs are a representative of two independent time course. (E) Localization of Mps3-DDD-GFP protein in MPS3-DDD (PRY201) at different time points. Bar indicates 2 μm. (F) Localization of Mps3-DDD-GFP protein in wild type, cdc28-as1 (with 1NM-PP1; PRY301) and cdc7-as3 (with PP1; PRY272) at 0 h. Bar indicates 2 μm. (G) An image of Rap1-GFP in the mps3-DDD strains with a different combination of cdc28-as1, cdc7-as3 or cdc7 bob1-1 mutations in mitosis (0 h). A single-focal plane of a cell was analyzed at every 3 s. Bar indicates 2 μm.
Figure 5—video 1
Mps3-DDD-GFP at 5 h in SPM.
Figure 5—video 2
Rap1-GFP in MPS3-DDD cells at 5 h in SPM.
Figure 5—video 3
Rap1-GFP in a cdc28-as1 MPS3-DDD cell treated with 1NM-PP1 (0 h) at 5 h in SPM.
Figure 5—video 4
Rap1-GFP in a cdc7-as3 MPS3-DDD cell treated with PP1 (0 h) at 5 h in SPM.
Figure 5—video 5
Rap1-GFP in a cdc7 bob1-1 MPS3-DDD cell at 5 h in SPM.
Figure 5—video 6
Mps3-DDD -GFP in a cdc28-as1 MPS3-DDD cell treated with 1NM-PP1 (0 h) at 5 h in SPM.
Figure 5—video 7
Mps3-DDD -GFP in a cdc7-as3 MPS3-DDD cell treated with PP1 (0 h) at 5 h in SPM.
Figure 5—video 8
Mps3-DDD -GFP in a cdc7 bob1-1 MPS3-DDD cell at 5 h in SPM.
Figure 6
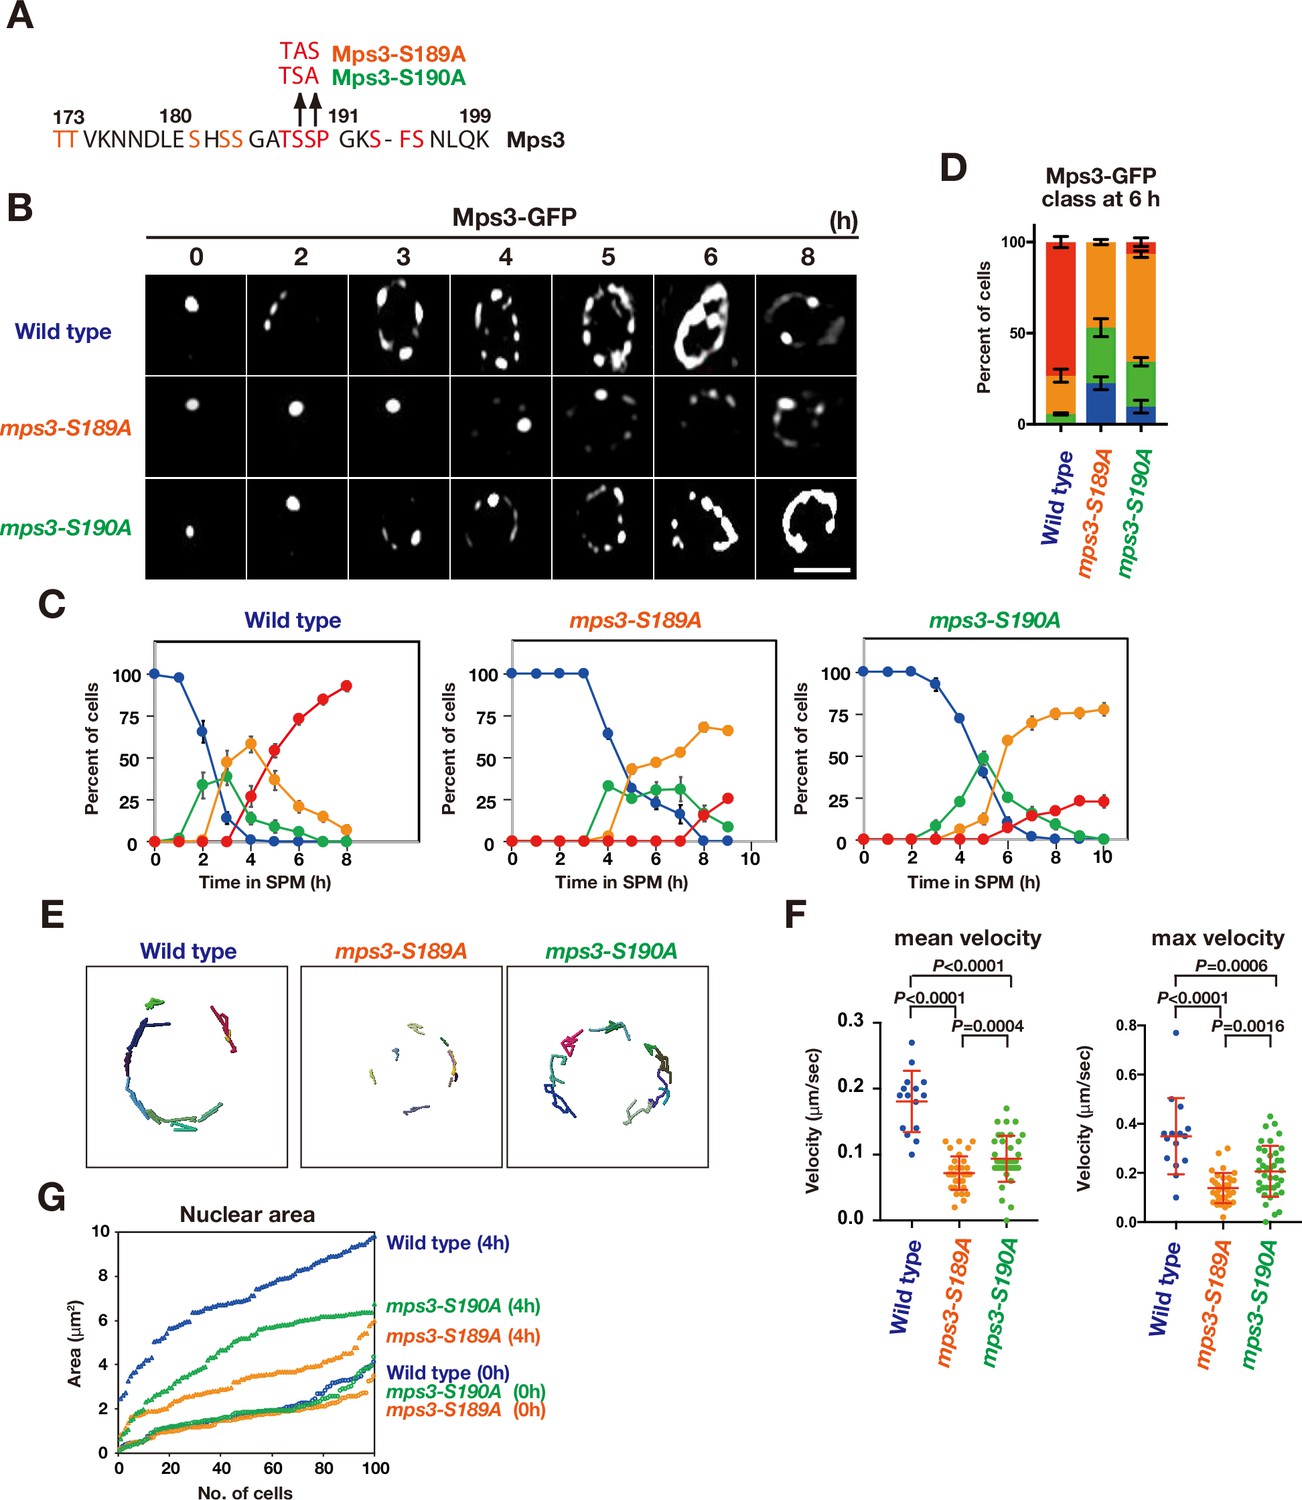
The mps3-S189A and -S190A mutants show a defect in NE localization.
(A) Amino acid sequences of Mps3 with amino acid substitution in the mps3-S189A and mps3-S190A mutants. (B) Localization of wild-type Mps3-GFP (PRY64), Mps3-S189A-GFP (KSY407/409) Mps3-S190A-GFP (KSY220/221) and proteins in a cell at different time points in meiosis. (C) Kinetics of Mps3 distribution. Based on Mps3-GFP morphology, cells with Mps3-GFP were classified into four classes and quantified: 2–5 foci (green), more than five foci/patches (orange), and coverage on NE (red). See Figure 1B for quantification. (D) Percentage of cells with different classes of Mps3-GFP were quantified at 5 h in different conditions (triplicates, Error bars show standard deviation; s.d.); single Mps3 focus (blue), 2–5 foci (green), more than five foci/patches (orange), and coverage of the Mps3 signal on NE (red). (E) Tracking of Mps3-GFP in wild type (left), mps3-S189A (middle) and mps3-S190A (right). (F) Velocity of Mps3-GFP foci or patches were quantified in different mps3 mutants. Methods are shown in Figure 1H. More than 20 cells were analyzed for the quantification. Red lines show mean with s.d. p-Values were calculated using Man-Whitney’s U-test. (G) The maximum sectional area of each nucleus was measured using the Velocity program. Each area of the 96 nuclei is ranked in the figure.
-
Figure 6—source data 1
Source data for Figure 6.
- https://cdn.elifesciences.org/articles/63119/elife-63119-fig6-data1-v2.xlsx
Figure 7 with 4 supplements
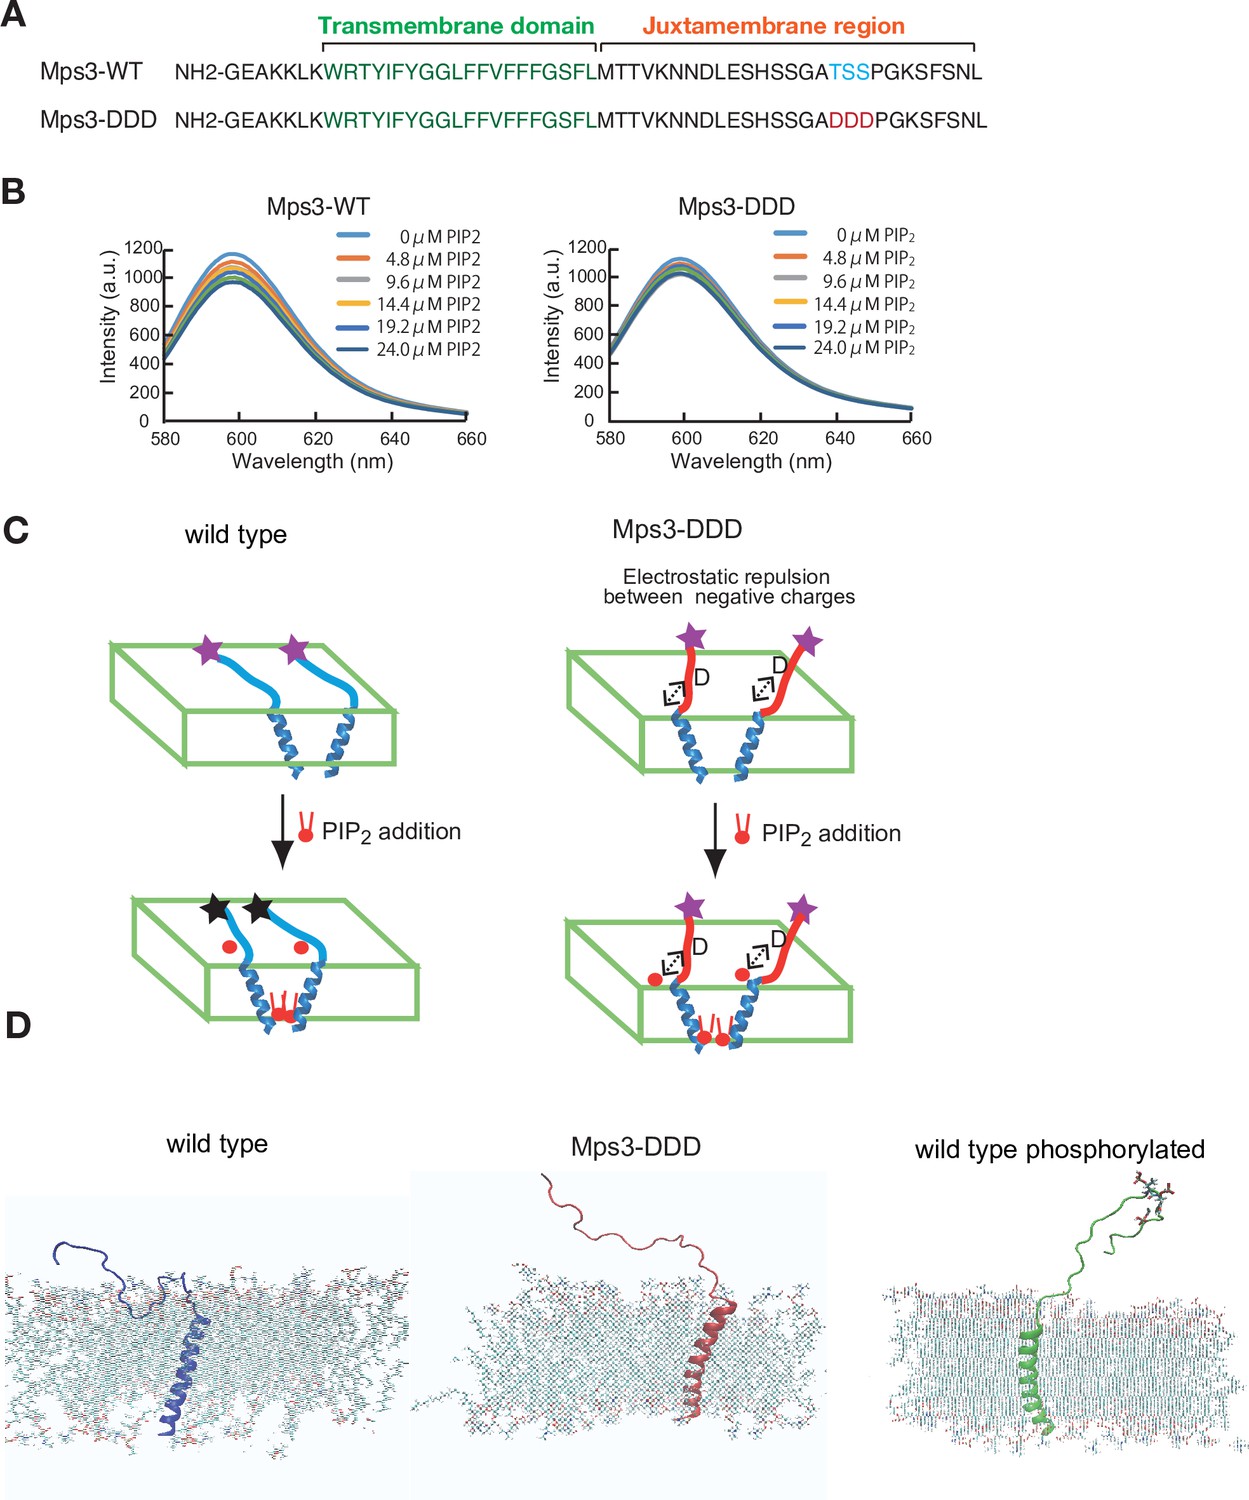
Biophysical analysis of JM region of Mps3.
(A) Amino acid sequences of Mps3 peptides used. Amino acid sequence in transmembrane region is shown in green. Phosphorylated residues TSS and its derivative DDD are shown in blue and red, respectively. (B) Fluorescence spectra from a synthetic liposome containing Alexa568-labelled Mps3-WT (left) peptide and Mps3-DDD peptide (right) were measured in the presence of various concentrations of PIP2. The graphs are a representative of three independent time course. (C) Schematic illustration of the binding of Mps3-WT peptide (left) and Mps3-DDD peptide (right) to lipid bilayer with PIP2 (red). DDD residues may induce electric repulsion between the peptide and the membrane. Transmembrane region of the Mps3 peptide is shown by blue a-helix. Peptides with WT JM region and with DDD substitution are shown blue and red lines, respectively. Purple and black stars show normal and quenched fluorophores, respectively. (D) Snapshots from all-atom MD simulation trajectories for Mps3-WT peptide (left), Mps3-DDD peptide (center) and Mps3-WT peptide with phosphorylation at TSS sequence (right). See Figure 7—videos 1–3.
Figure 7—figure supplement 1
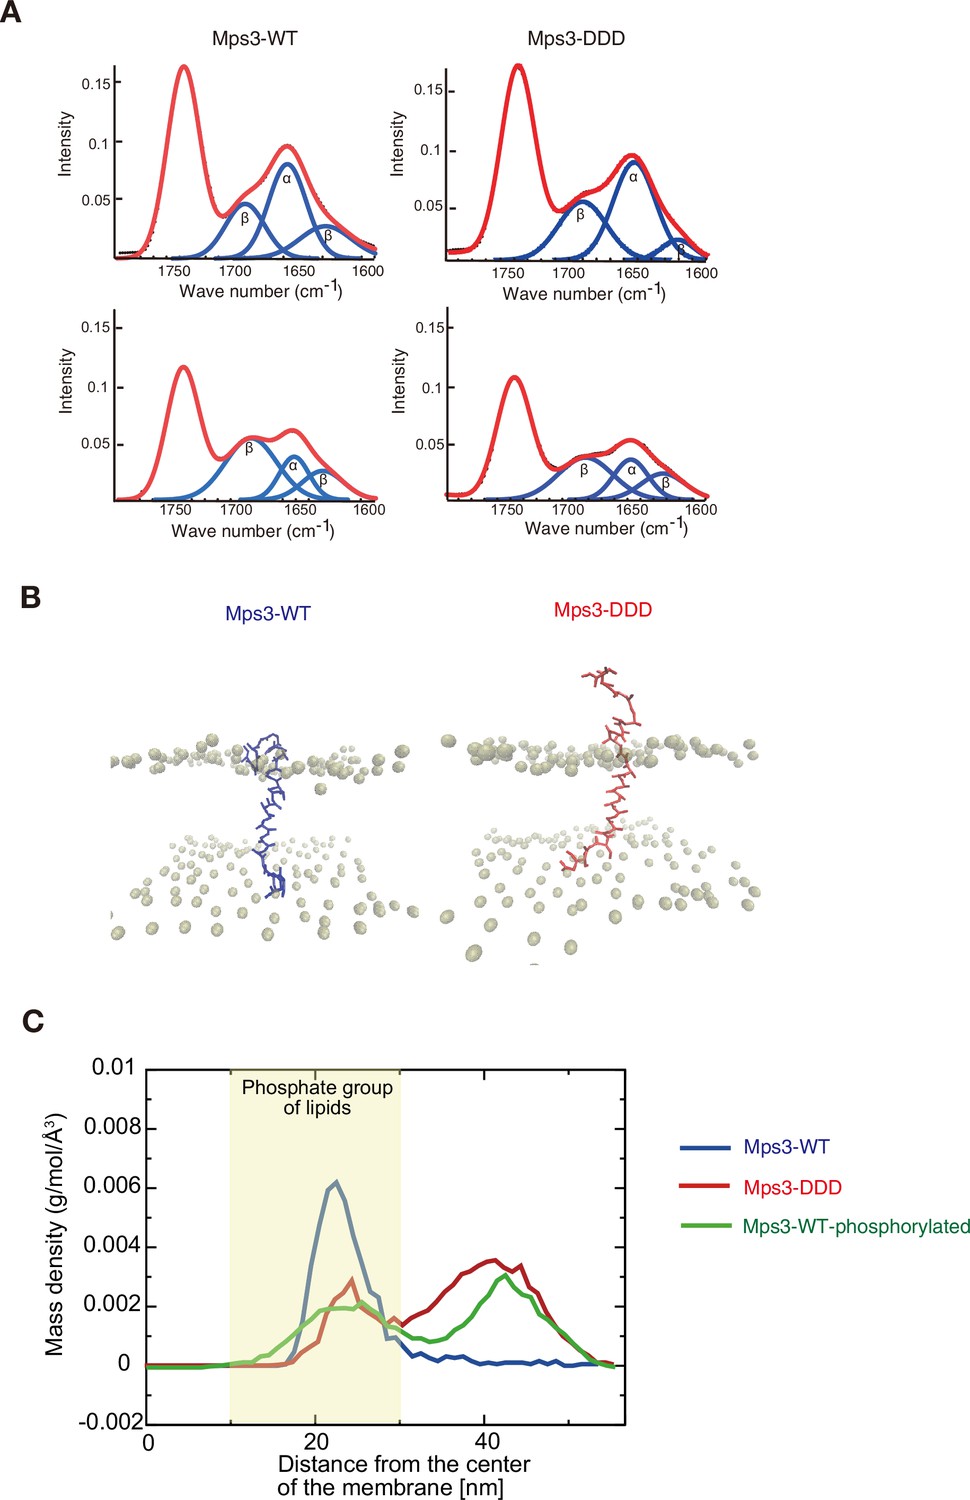
Structure and dynamics of JM region of Mps3.
(A) Polarized attenuated total reflection FT-IR spectra are shown. Spectra (red) a synthetic liposome containing Mps3-WT (left) peptide and Mps3-DDD peptide (right) were obtained with light polarized parallel (top) or perpendicular (bottom). Deconvoluted spectra into α-helix and β-sheet are shown in blue. (B) Snapshots from coarse-grained MD simulation trajectories for Mps3-WT peptide (left), Mps3-DDD peptide (right). (C) Mass density profiles relative to the center of the lipid bilayer for residues, T188, S189 and S190 on Mps3-WT peptide (blue), Mps3-DDD peptide (red) and Mps3-WT peptide with phosphorylation (green). Density profile for phosphate groups on lipids are colored with yellow.
Figure 7—video 1
MD simulation of wild-type Mps3 peptide.
Figure 7—video 2
MD simulation of wild-type Mps3-DDD peptide.
Figure 7—video 3
MD simulation of wild-type Mps3-phosphorylated peptide.
Figure 8
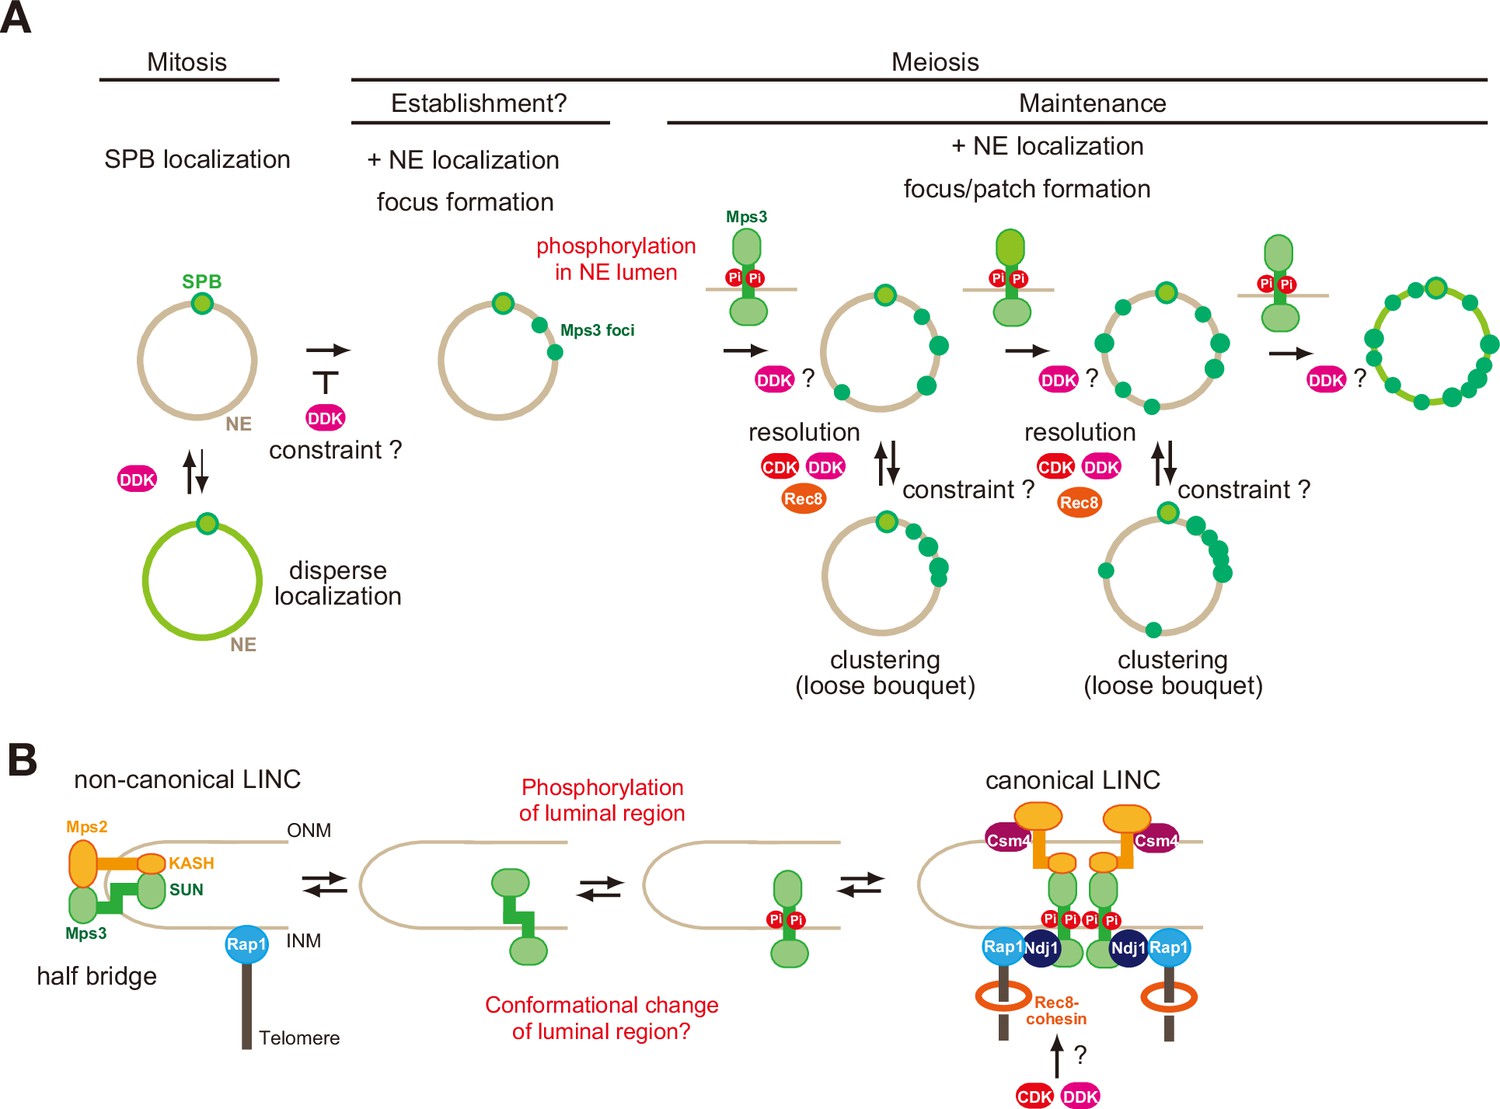
A model of regulation of Mps3 on NE during meiosis.
(A) Multiple phosphorylation regulates Mps3 localisation and motion in NE during meiosis. In mitotic cells, Mps3 (green) is mainly located in the SPB. In some strain, disperse weak Mps3 signal is detected on NE, which might be regulated by DDK. Upon entry into meiosis, Mps3 forms a few foci on NE in early prophase I, and phosphorylation of the luminal region of Mps3 and, probably DDK, promotes localisation of more Mps3 proteins as focus/patch on NE. Mps3 foci/patches transiently form a cluster of some Mps3 foci by an unknown mechanism, and CDK and DDK and Rec8-cohesin promote dissociation of Mps3 and Rap1(telomere) clusters. It is likely that positive feedback on Mps3 phosphorylation would increase the localisation of Mps3 on NEs, which results in full NE coverage of Mps3. (B) A hypothetical model of the formation of Mps3-containing LINC complex. During mitosis, Mps3 forms a non-canonical LINC complex with cis-membrane interactions with Mps2 as a component of the half-bridge and SPIN (left). Upon induction of meiosis, unknown factors promote the formation of Mps3 foci on NE. Then, the JM region of Mps3 is subject to non-canonical phosphorylation, which might in turn weaken the binding of JM to INM, probably by electric repulsion between the JM regions with negative charges and acid lipids. This process promotes the formation of the canonical LINC complex with the trans-membrane configuration, in which the Mps3 SUN domain binds to the KASH domain of Mps2 and Csm4. Csm4 may promote structural changes in the luminal region of Mps2. The N-terminal region of Mps3, which is located in the nucleoplasm, binds to a telomere-binding protein, Ndj1. During middle and late prophase I, Mps3 forms a large protein ensemble on the NE, which is seen as a patch.
Tables
Key resources table
| Reagent type (species) or resource | Designation | Source or reference | Identifiers | Additional information |
|---|---|---|---|---|
| Strain, strain background (Saccharomyces cerevisiae) | SK1 | PMC246633 | ||
| Antibody | Anti-HA(mouse monoclonal) | Babco | 16B12 | WB (1/1000) |
| Antibody | Anti-Flag (M2)(mouse monoclonal) | Sigma | M2 | WB (1/1000), IF (1/2000) |
| Antibody | Anti-tubulin(rat monoclonal) | Bio-Rad/Serotec, Ltd | MCA77G | WB (1/1000), IF (1/2000) |
| Antibody | Anti-Zip1(rabbit polyclonal) | PMID:18297071 | IF (1/200) | |
| Antibody | Anti-Csm4(rabbit polyclonal) | PMC2533704 | WB (1/1000) | |
| Antibody | Anti-Mer2(S30P)(rabbit polyclonal) | PMC2216698 | WB (1/1000) | |
| Antibody | Anti-Mps3(S189P, S190P)(rabbit polyclonal) | This study | WB (1/500) | |
| Chemical compound, drug | 1NM-PP1 | Cayman Chemical | Cat #: 13,330CAS-221244-14-0 | |
| Chemical compound, drug | PP1 | Sigma | Cat #:0040CAS-172889-26-8 | |
| Chemical compound, drug | Latrunculin B | Calbiochem | Cat-428020 | |
| Software, algorithm | Imaris | Oxford Instruments | Tracking/speed measurement |
Additional files
-
Transparent reporting form
- https://cdn.elifesciences.org/articles/63119/elife-63119-transrepform1-v2.docx
-
Supplementary file 1
Strain list.
- https://cdn.elifesciences.org/articles/63119/elife-63119-supp1-v2.docx
Download links
A two-part list of links to download the article, or parts of the article, in various formats.
Downloads (link to download the article as PDF)
Open citations (links to open the citations from this article in various online reference manager services)
Cite this article (links to download the citations from this article in formats compatible with various reference manager tools)
Phosphorylation of luminal region of the SUN-domain protein Mps3 promotes nuclear envelope localization during meiosis
eLife 10:e63119.
https://doi.org/10.7554/eLife.63119


