Transsynaptic mapping of Drosophila mushroom body output neurons
- Department of Neuroscience, Brown University, United States
- Department of Psychology, Bryant University, United States
- Center for Health and Behavioral Sciences, Bryant University, United States
- Laboratory of Neurophysiology and Behavior, The Rockefeller University, United States
- Janelia Research Campus, Howard Hughes Medical Institute, United States
Figures
Figure 1 with 23 supplements
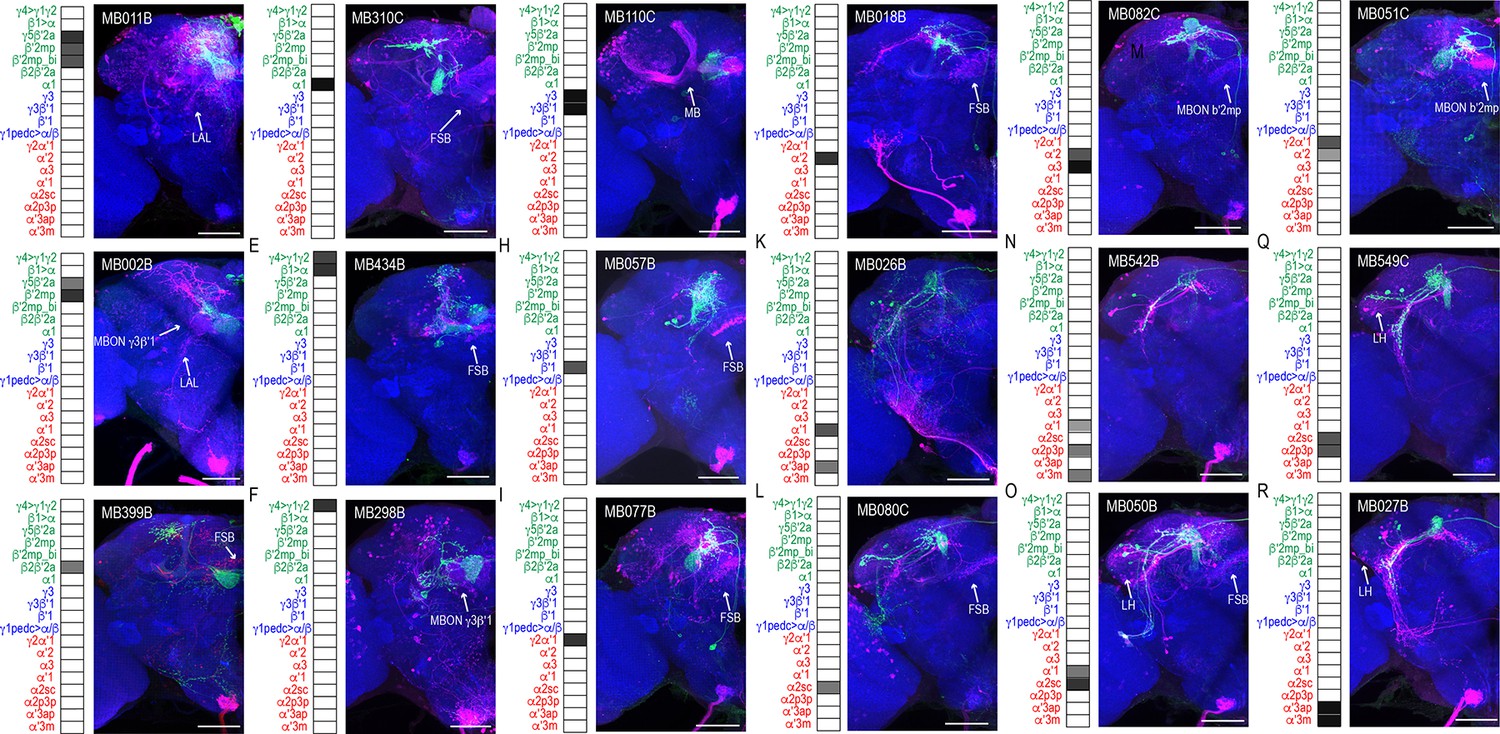
MBONs have divergent connections across the brain.
Exemplar max-stacks of glutamatergic MBONs (A) MB011B, (B) MB002B, (C) MB399B, (D) MB310C, (E) MB434B, (F) MB298B, GABAergic MBONs (G) MB110C and (H) MB057B, and cholinergic MBONs (I) MB077B, (J) MB018B, (K) MB026B, (L) MB080C, (M) MB082C, (N) MB542B, (O) MB050B, (P) MB051C, (Q) MB549C and (R) MB027B, trans-Tango identified postsynaptic connections. For max-stacks: green, presynaptic MBONs, magenta, postsynaptic trans-Tango signal, blue, brp-SNAP neuropil. A map of the MBONs that are included in the expression pattern in each driver line accompanies each exemplar with the relative expression pattern (grayscale, 1–5) accordingly to FlyLight (https://splitgal4.janelia.org/cgi-bin/splitgal4.cgi). MBON maps are organized by neurotransmitter type: green=glutamatergic, blue=GABAergic, red=cholinergic. Scale bar = 50 μm.
Figure 1—figure supplement 1
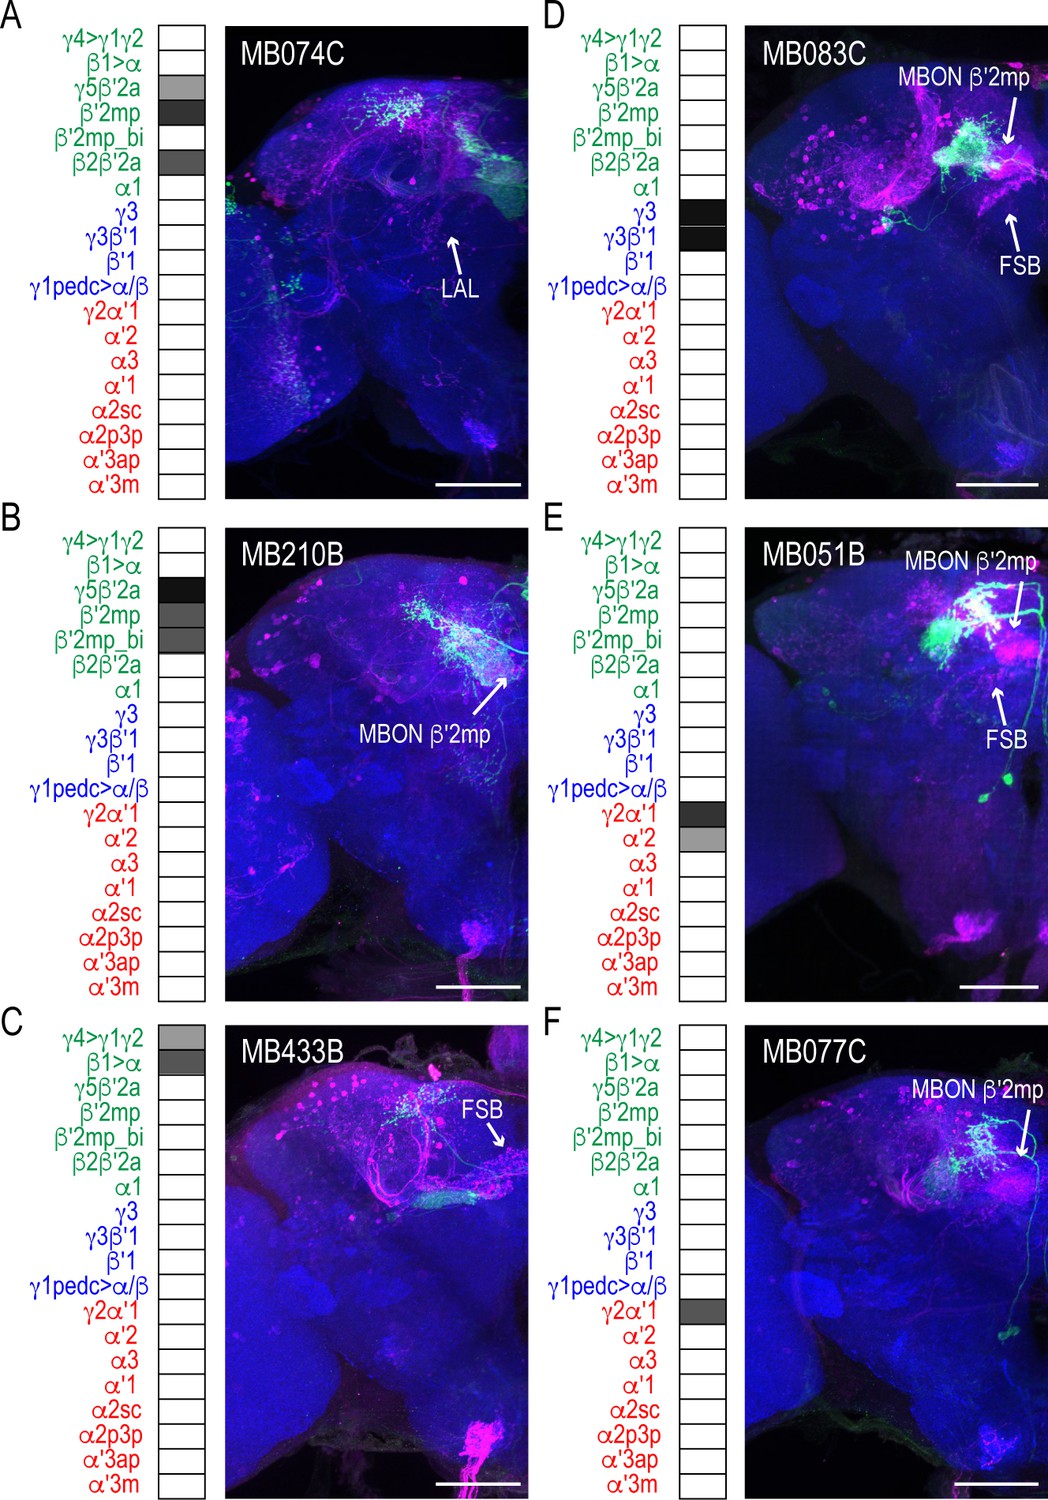
MBON driver lines that have similar expression patterns also have similar postsynaptic connections across the brain.
Exemplar max-stacks of glutamatergic MBONs (A) MB074C, (B) MB210B, (C) MB433B, (D) GABAergic MBONs MB083C, and cholinergic MBONs (E) MB051B and (F) MB077C, trans-Tango identified postsynaptic connections. For max-stacks: green, presynaptic MBONs, magenta, postsynaptic trans-Tango signal, blue, brp-SNAP neuropil. A map of the MBONs that are included in the expression pattern in each driver line accompanies each exemplar with the relative expression pattern (grayscale, 1–5) accordingly to FlyLight (https://splitgal4.janelia.org/cgi-bin/splitgal4.cgi). MBON maps are organized by neurotransmitter type: green=glutamatergic, blue=GABAergic, red=cholinergic. Scale bar = 50 μm.
Figure 1—figure supplement 2
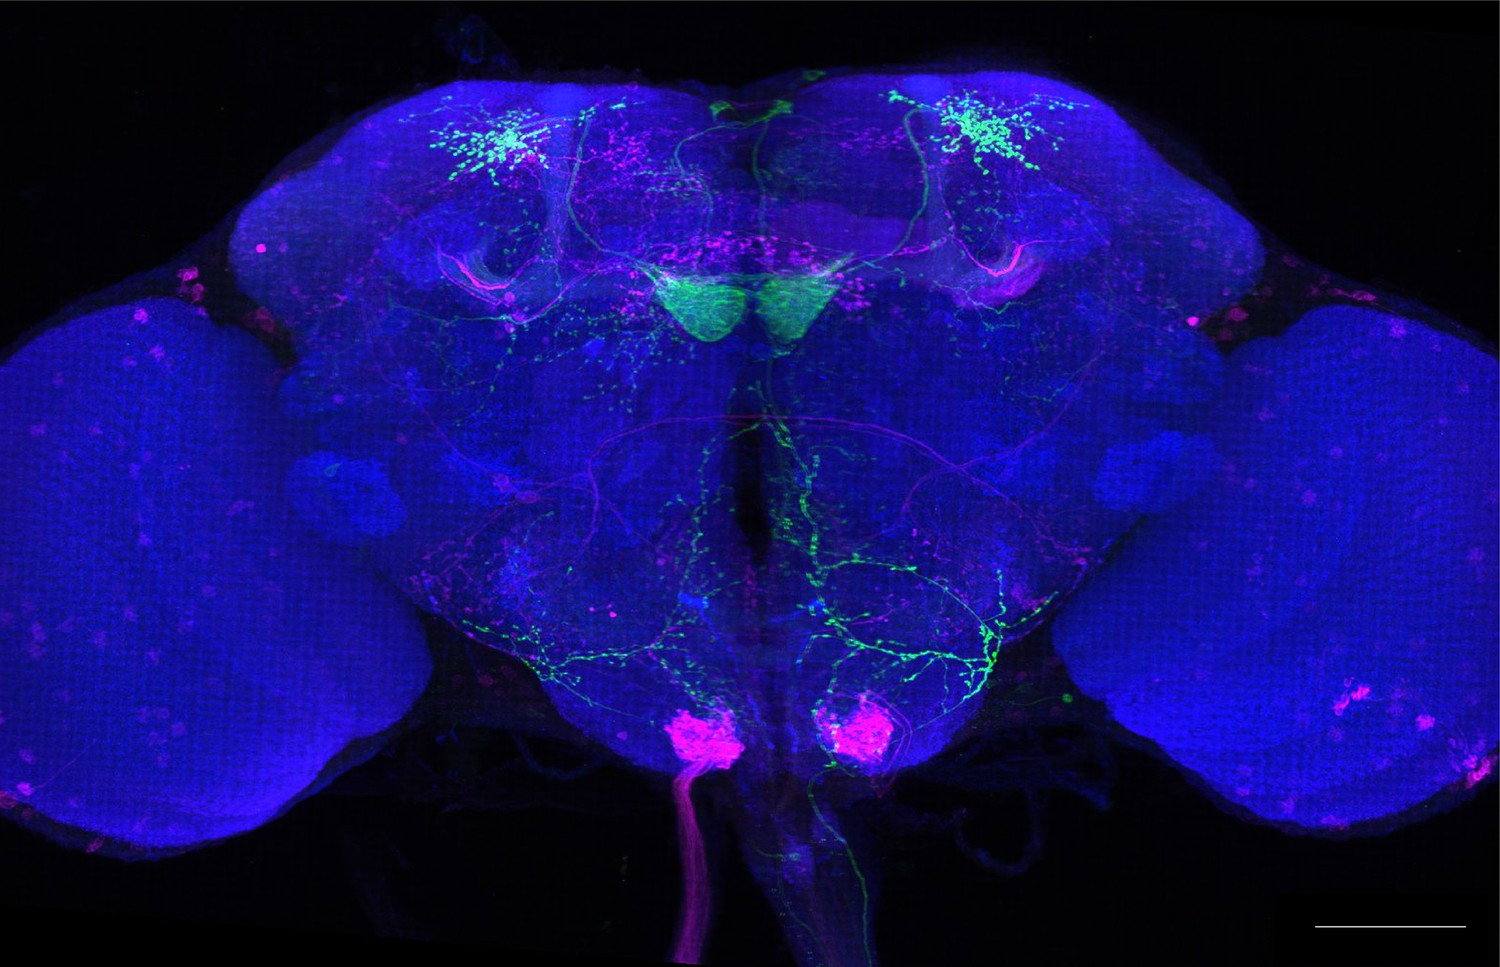
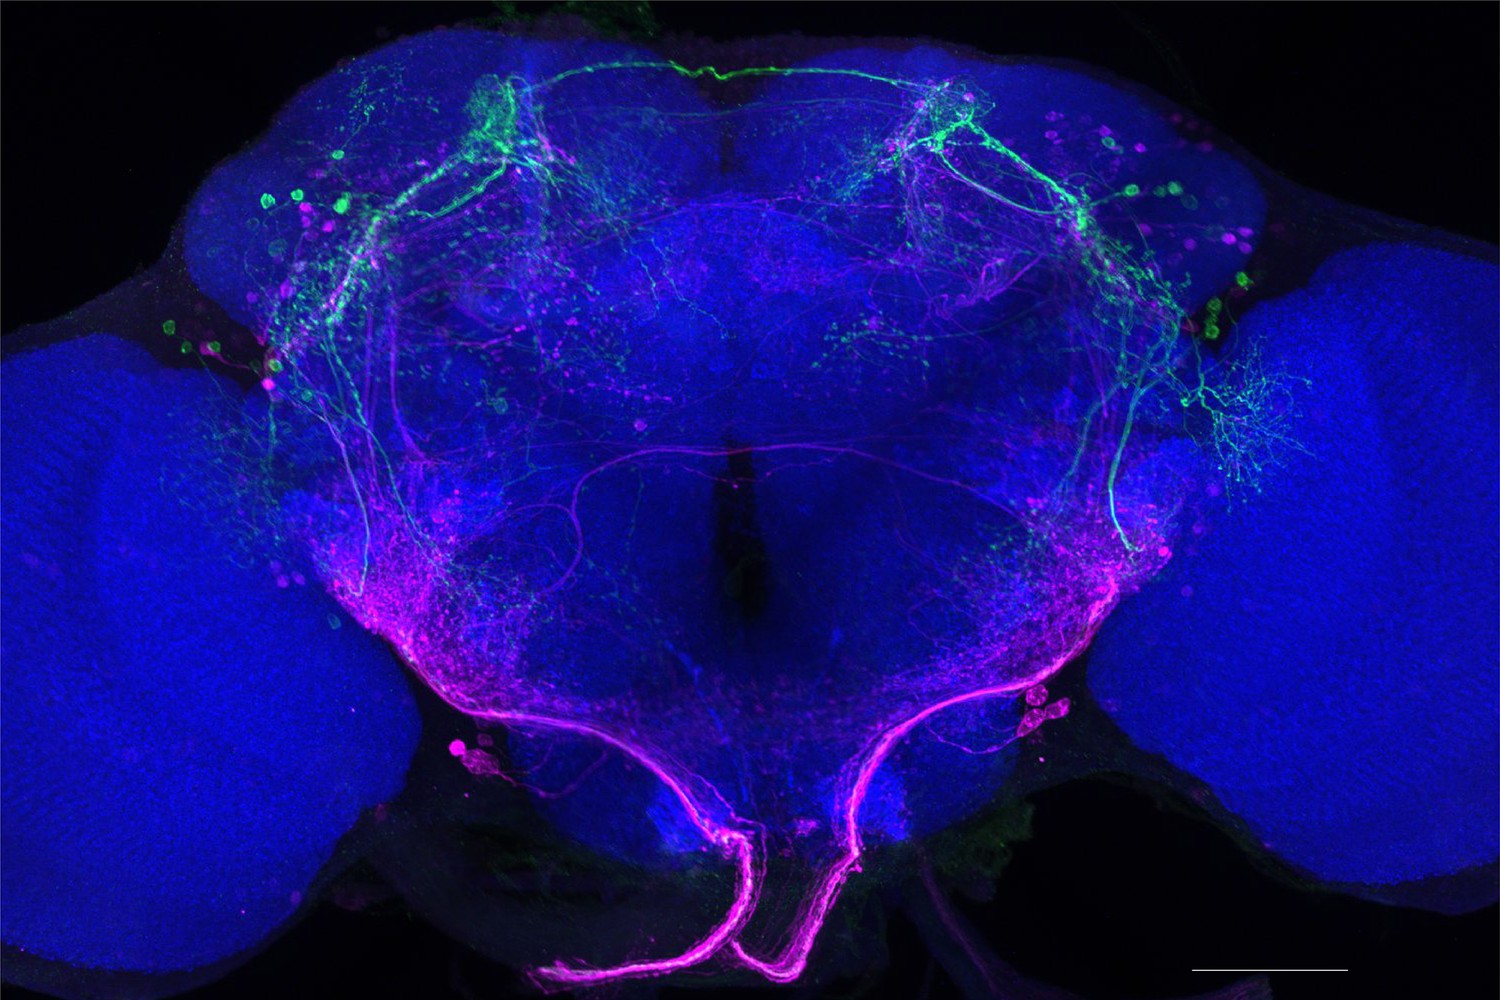
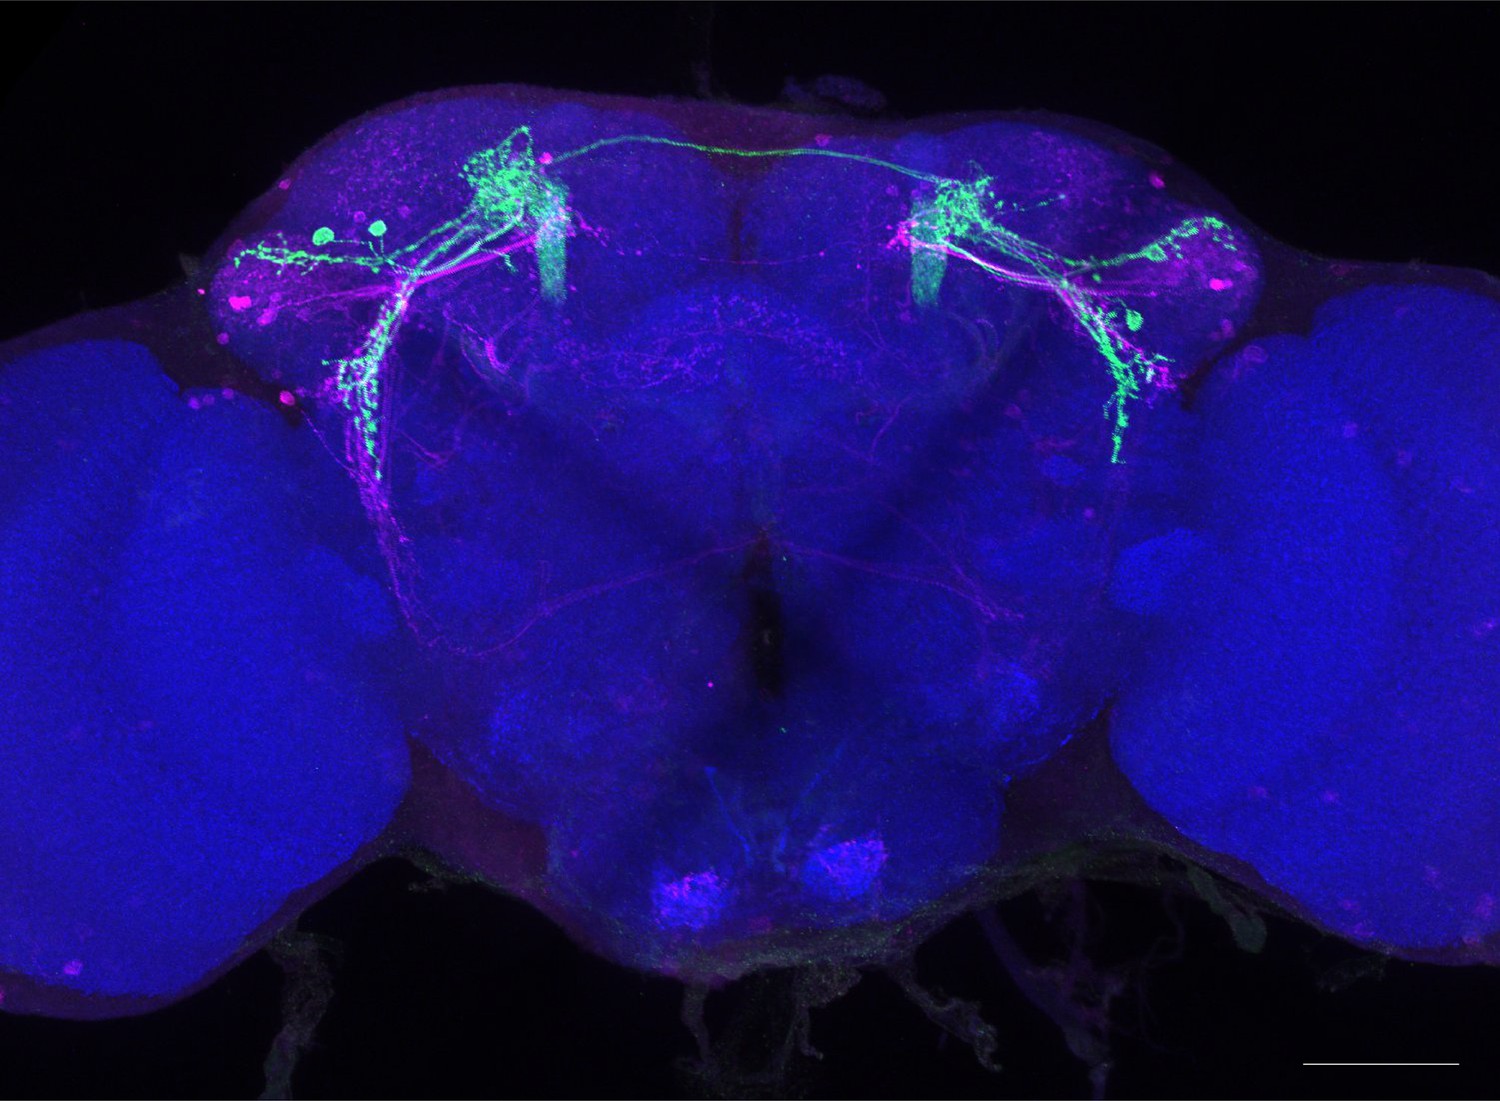
Full-size exemplar max-stack of MB011B.
Green, presynaptic MBONs, magenta, postsynaptic trans-Tango signal, blue, brp-SNAP neuropil. Scale bar = 50 μm.
Figure 1—figure supplement 3
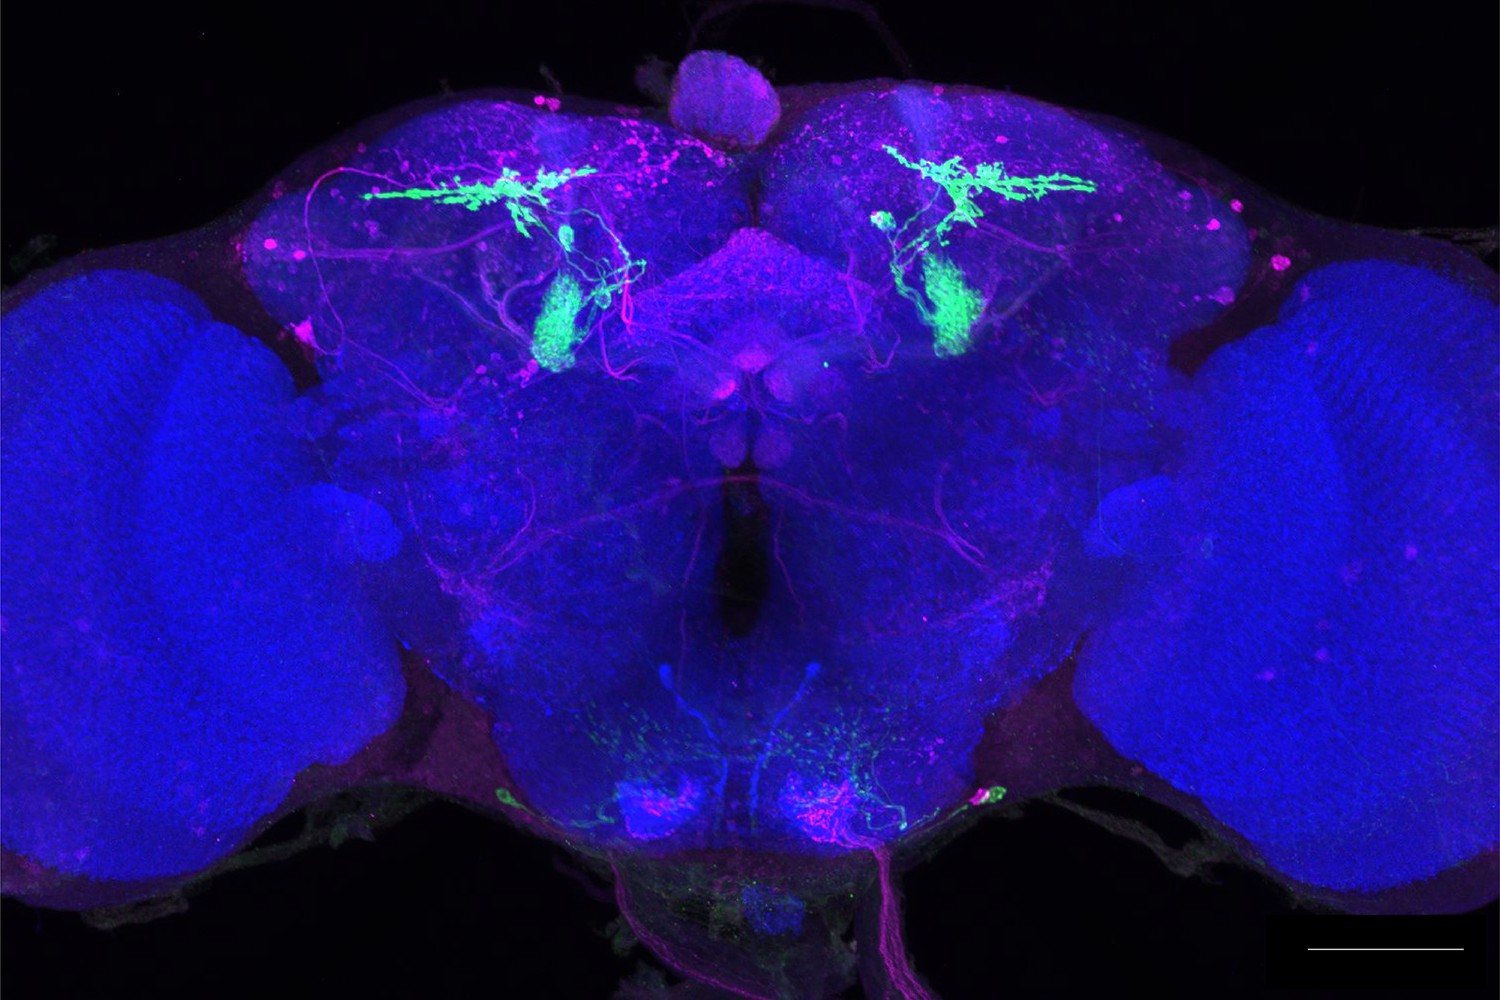
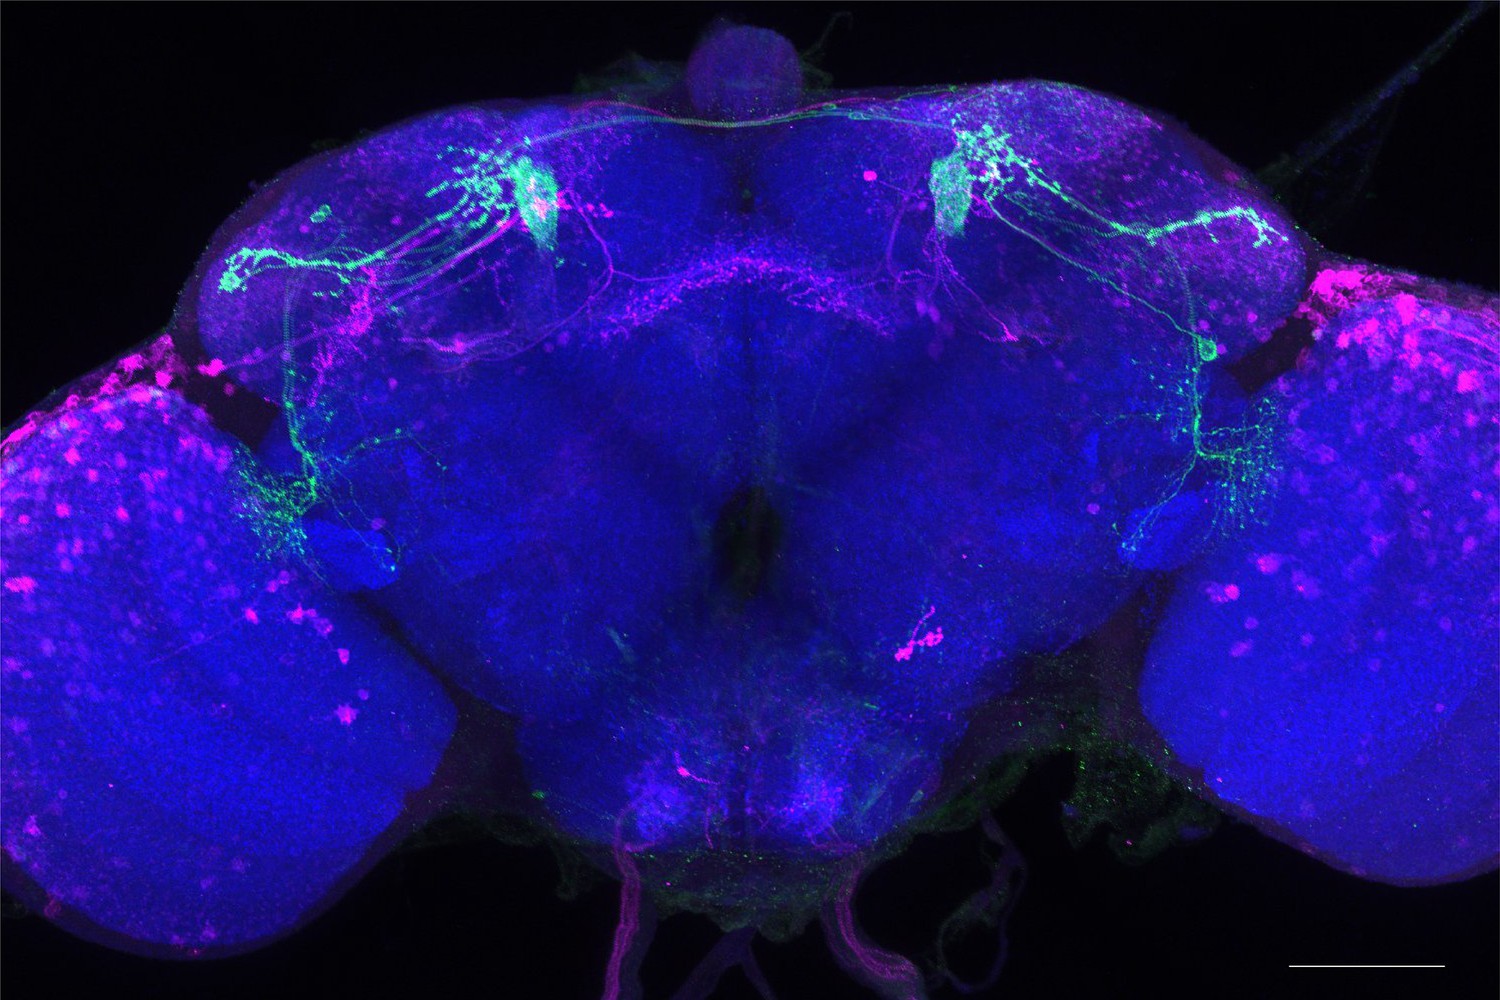
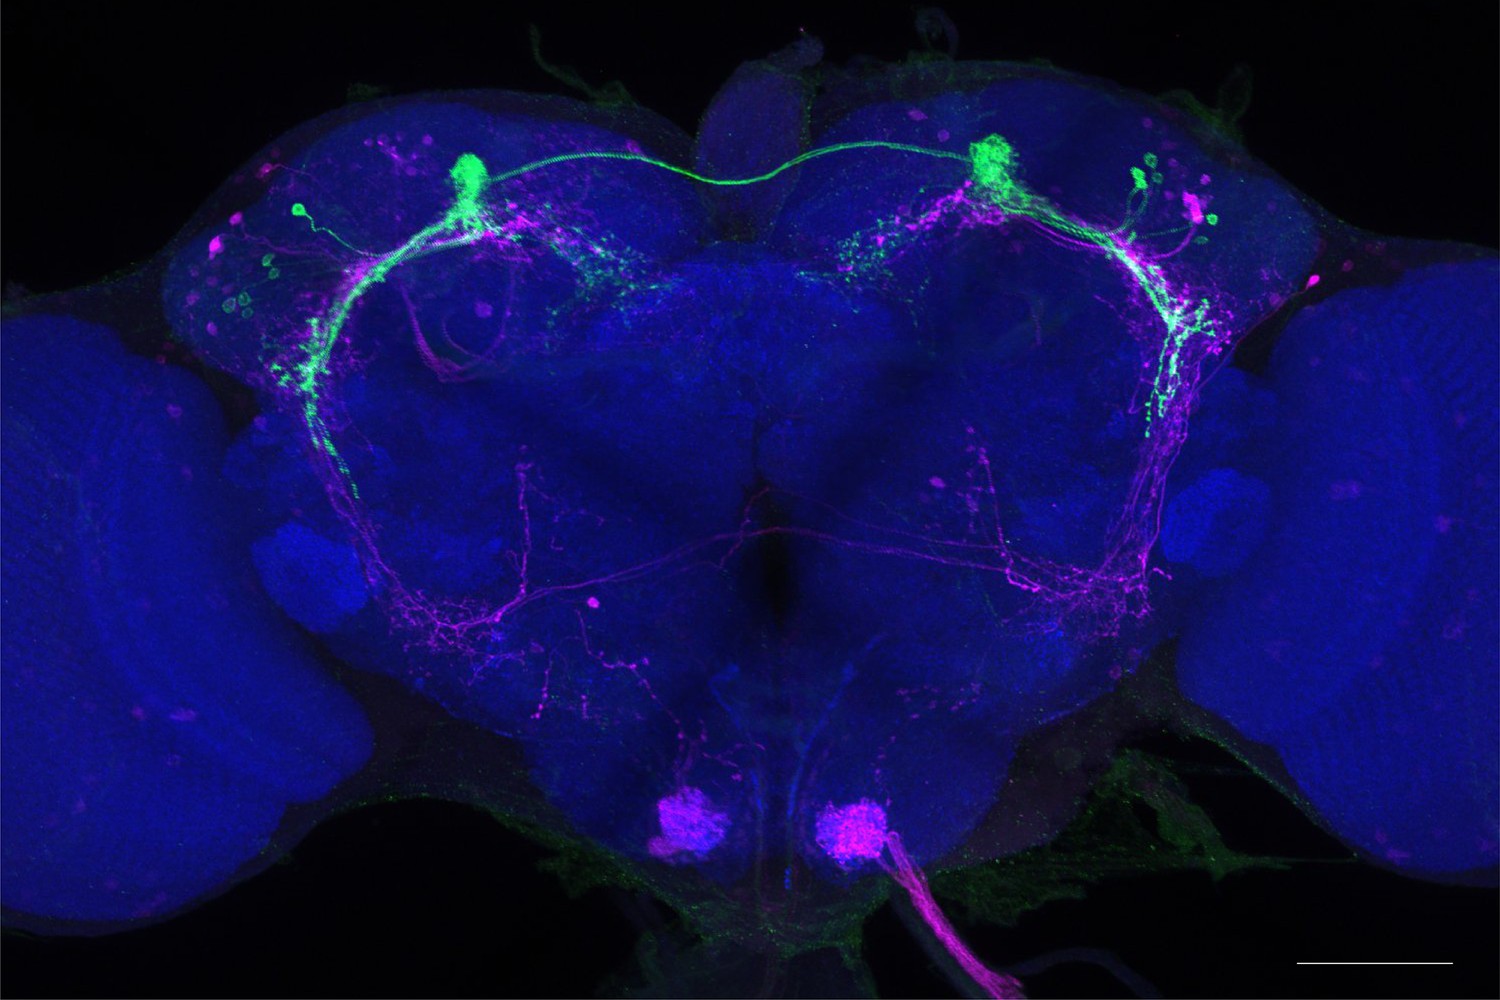
Full-size exemplar max-stack of MB002B.
Green, presynaptic MBONs, magenta, postsynaptic trans-Tango signal, blue, brp-SNAP neuropil. Scale bar = 50 μm.
Figure 1—figure supplement 4
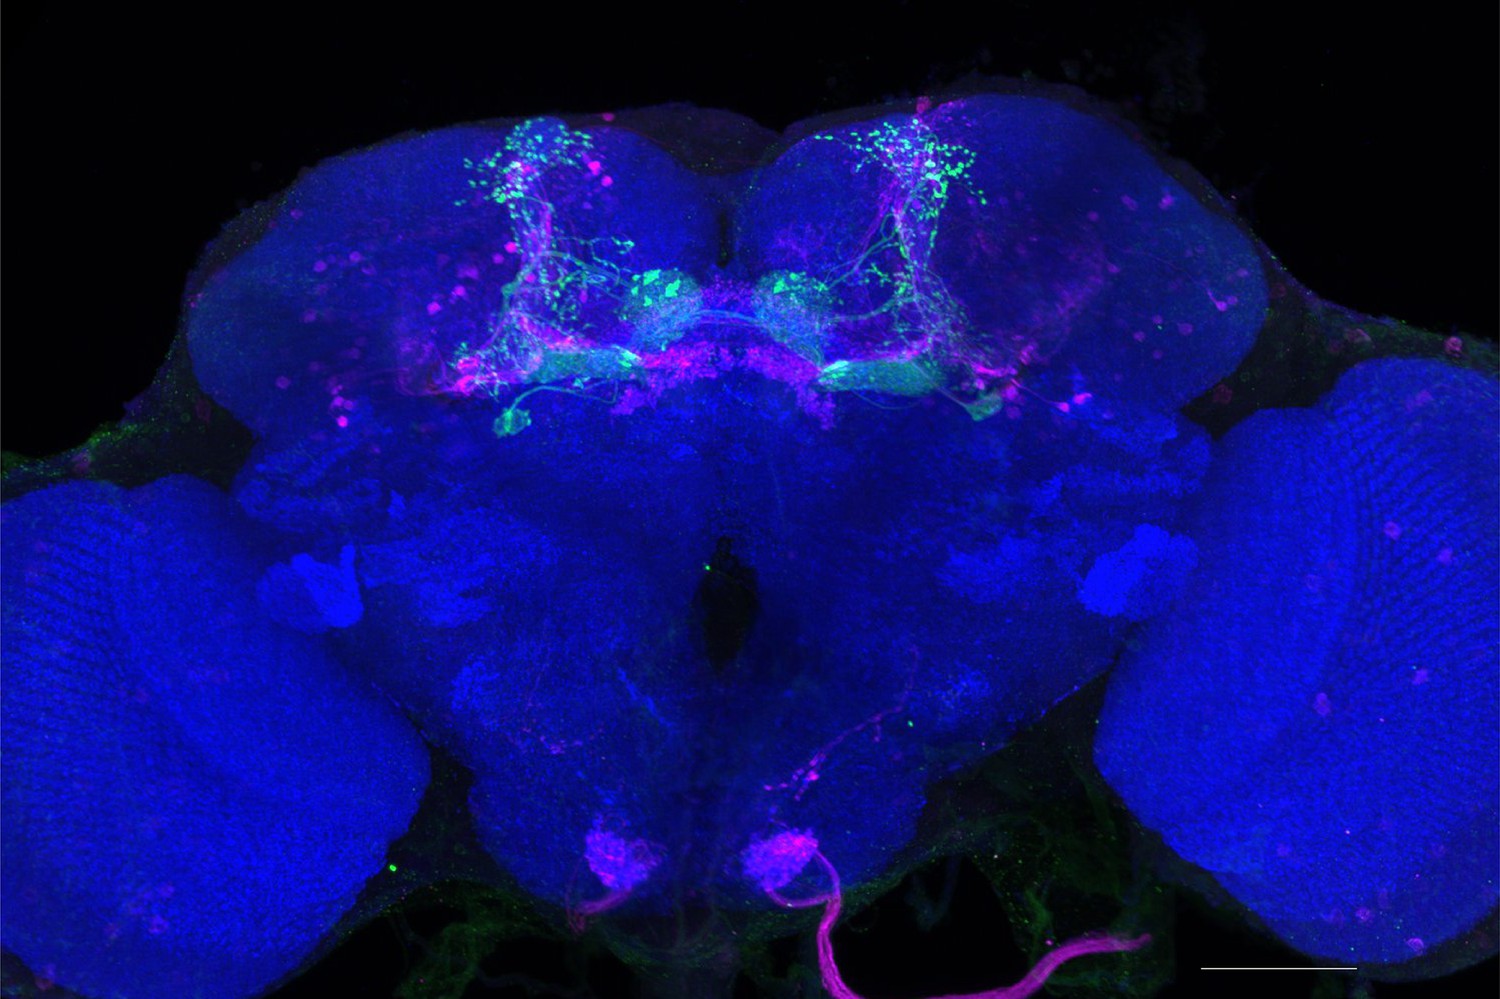
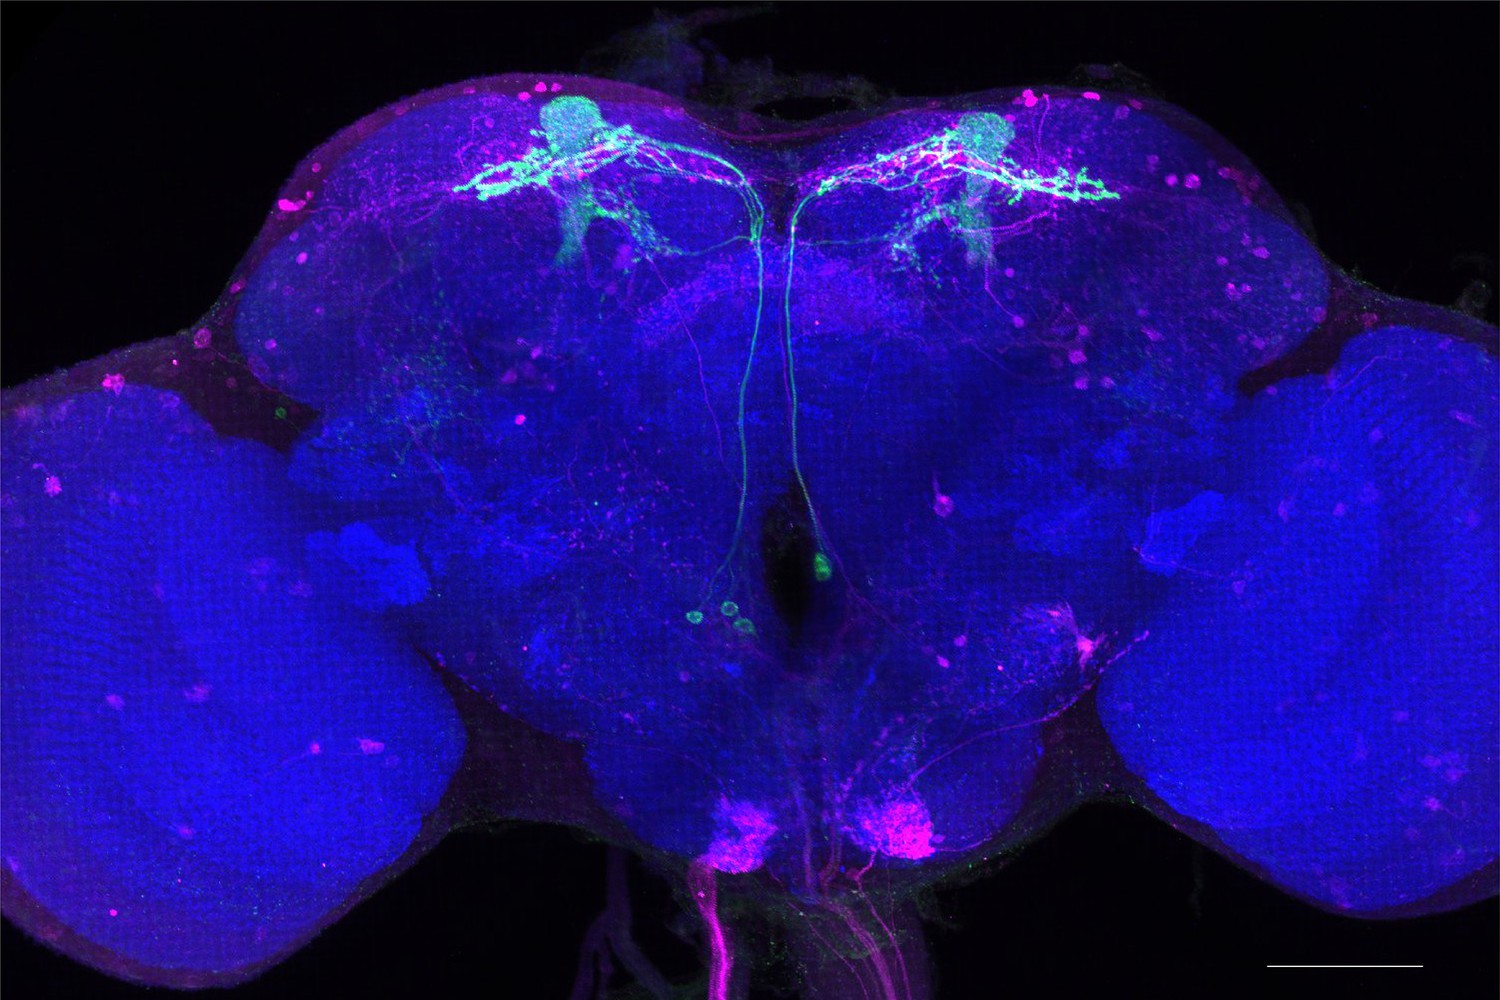
Full-size exemplar max-stack of MB399B.
Green, presynaptic MBONs, magenta, postsynaptic trans-Tango signal, blue, brp-SNAP neuropil. Scale bar = 50 μm.
Figure 1—figure supplement 5
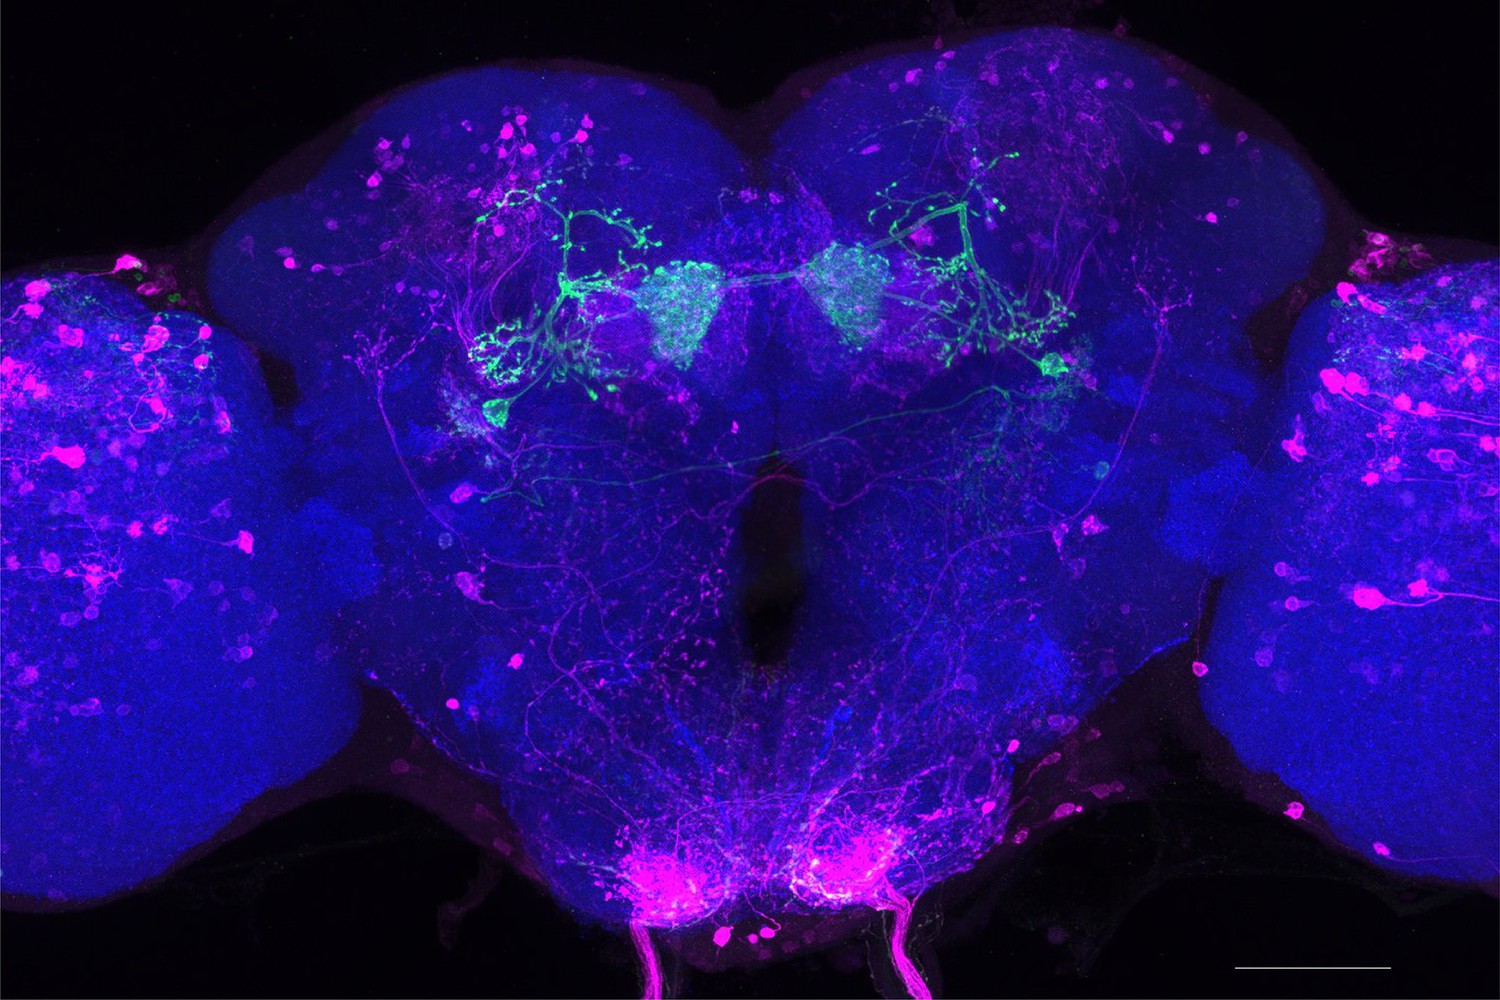
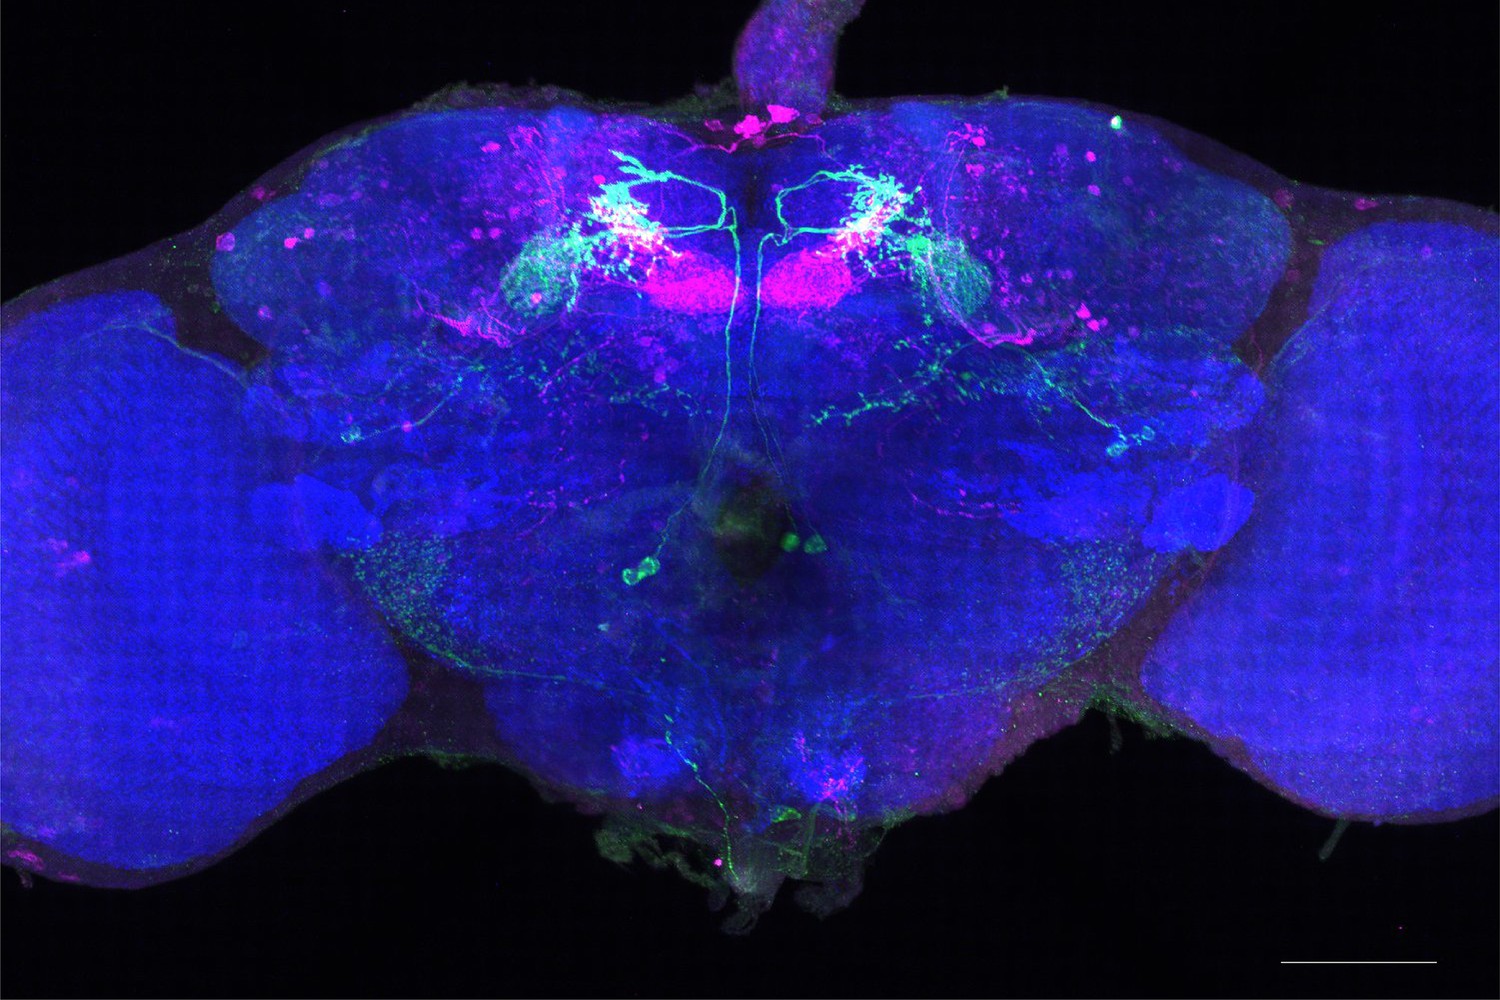
Full-size exemplar max-stack of MB310C.
Green, presynaptic MBONs, magenta, postsynaptic trans-Tango signal, blue, brp-SNAP neuropil. Scale bar = 50 μm.
Figure 1—figure supplement 6
Full-size exemplar max-stack of MB434B.
Green, presynaptic MBONs, magenta, postsynaptic trans-Tango signal, blue, brp-SNAP neuropil. Scale bar = 50 μm.
Figure 1—figure supplement 7
Full-size exemplar max-stack of MB298B.
Green, presynaptic MBONs, magenta, postsynaptic trans-Tango signal, blue, brp-SNAP neuropil. Scale bar = 50 μm.
Figure 1—figure supplement 8
Full-size exemplar max-stack of MB110C.
Green, presynaptic MBONs, magenta, postsynaptic trans-Tango signal, blue, brp-SNAP neuropil. Scale bar = 50 μm.
Figure 1—figure supplement 9
Full-size exemplar max-stack of MB057B.
Green, presynaptic MBONs, magenta, postsynaptic trans-Tango signal, blue, brp-SNAP neuropil. Scale bar = 50 μm.
Figure 1—figure supplement 10
Full-size exemplar max-stack of MB077B.
Green, presynaptic MBONs, magenta, postsynaptic trans-Tango signal, blue, brp-SNAP neuropil. Scale bar = 50 μm.
Figure 1—figure supplement 11
Full-size exemplar max-stack of MB018B.
Green, presynaptic MBONs, magenta, postsynaptic trans-Tango signal, blue, brp-SNAP neuropil. Scale bar = 50 μm.
Figure 1—figure supplement 12
Full-size exemplar max-stack of MB026B.
Green, presynaptic MBONs, magenta, postsynaptic trans-Tango signal, blue, brp-SNAP neuropil. Scale bar = 50 μm.
Figure 1—figure supplement 13
Full-size exemplar max-stack of MB080C.
Green, presynaptic MBONs, magenta, postsynaptic trans-Tango signal, blue, brp-SNAP neuropil. Scale bar = 50 μm.
Figure 1—figure supplement 14
Full-size exemplar max-stack of MB082C.
Green, presynaptic MBONs, magenta, postsynaptic trans-Tango signal, blue, brp-SNAP neuropil. Scale bar = 50 μm.
Figure 1—figure supplement 15
Full-size exemplar max-stack of MB051C.
Green, presynaptic MBONs, magenta, postsynaptic trans-Tango signal, blue, brp-SNAP neuropil. Scale bar = 50 μm.
Figure 1—figure supplement 16
Full-size exemplar max-stack of MB549C.
Green, presynaptic MBONs, magenta, postsynaptic trans-Tango signal, blue, brp-SNAP neuropil. Scale bar = 50 μm.
Figure 1—figure supplement 17
Full-size exemplar max-stack of MB027B.
Green, presynaptic MBONs, magenta, postsynaptic trans-Tango signal, blue, brp-SNAP neuropil. Scale bar = 50 μm.
Figure 1—figure supplement 18
Full-size exemplar max-stack of MB074C.
Green, presynaptic MBONs, magenta, postsynaptic trans-Tango signal, blue, brp-SNAP neuropil. Scale bar = 50 μm.
Figure 1—figure supplement 19
Full-size exemplar max-stack of MB210B.
Green, presynaptic MBONs, magenta, postsynaptic trans-Tango signal, blue, brp-SNAP neuropil. Scale bar = 50 μm.
Figure 1—figure supplement 20
Full-size exemplar max-stack of MB433B.
Green, presynaptic MBONs, magenta, postsynaptic trans-Tango signal, blue, brp-SNAP neuropil. Scale bar = 50 μm.
Figure 1—figure supplement 21
Full-size exemplar max-stack of MB083C.
Green, presynaptic MBONs, magenta, postsynaptic trans-Tango signal, blue, brp-SNAP neuropil. Scale bar = 50 μm.
Figure 1—figure supplement 22
Full-size exemplar max-stack of MB051B.
Green, presynaptic MBONs, magenta, postsynaptic trans-Tango signal, blue, brp-SNAP neuropil. Scale bar = 50 μm.
Figure 1—figure supplement 23
Full-size exemplar max-stack of MB077B.
Green, presynaptic MBONs, magenta, postsynaptic trans-Tango signal, blue, brp-SNAP neuropil. Scale bar = 50 μm.
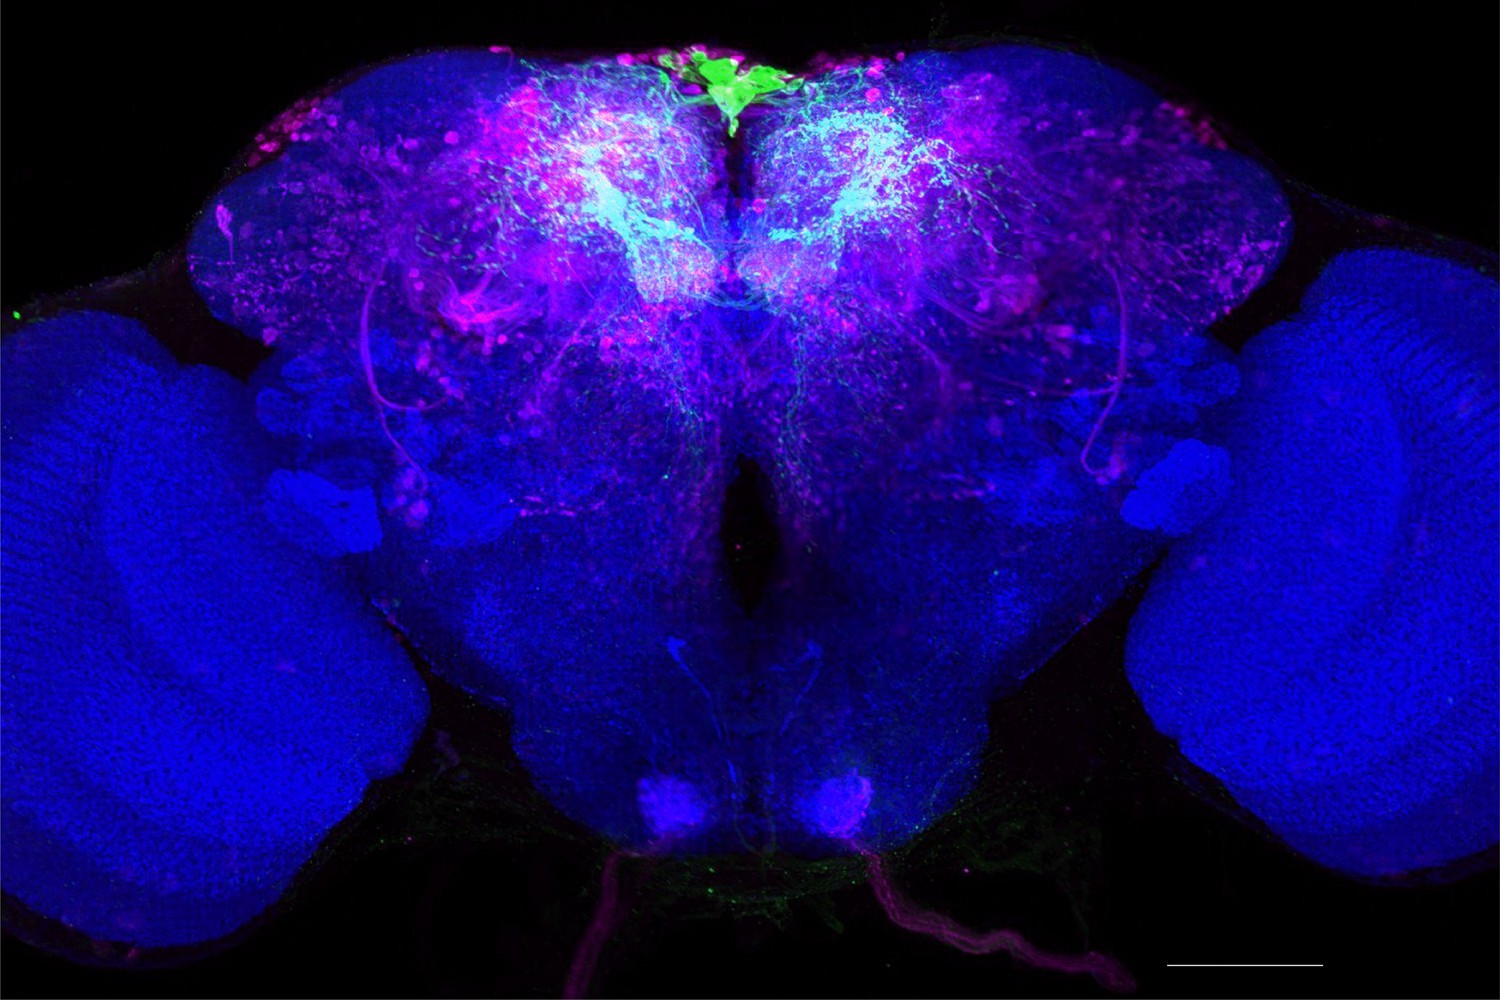
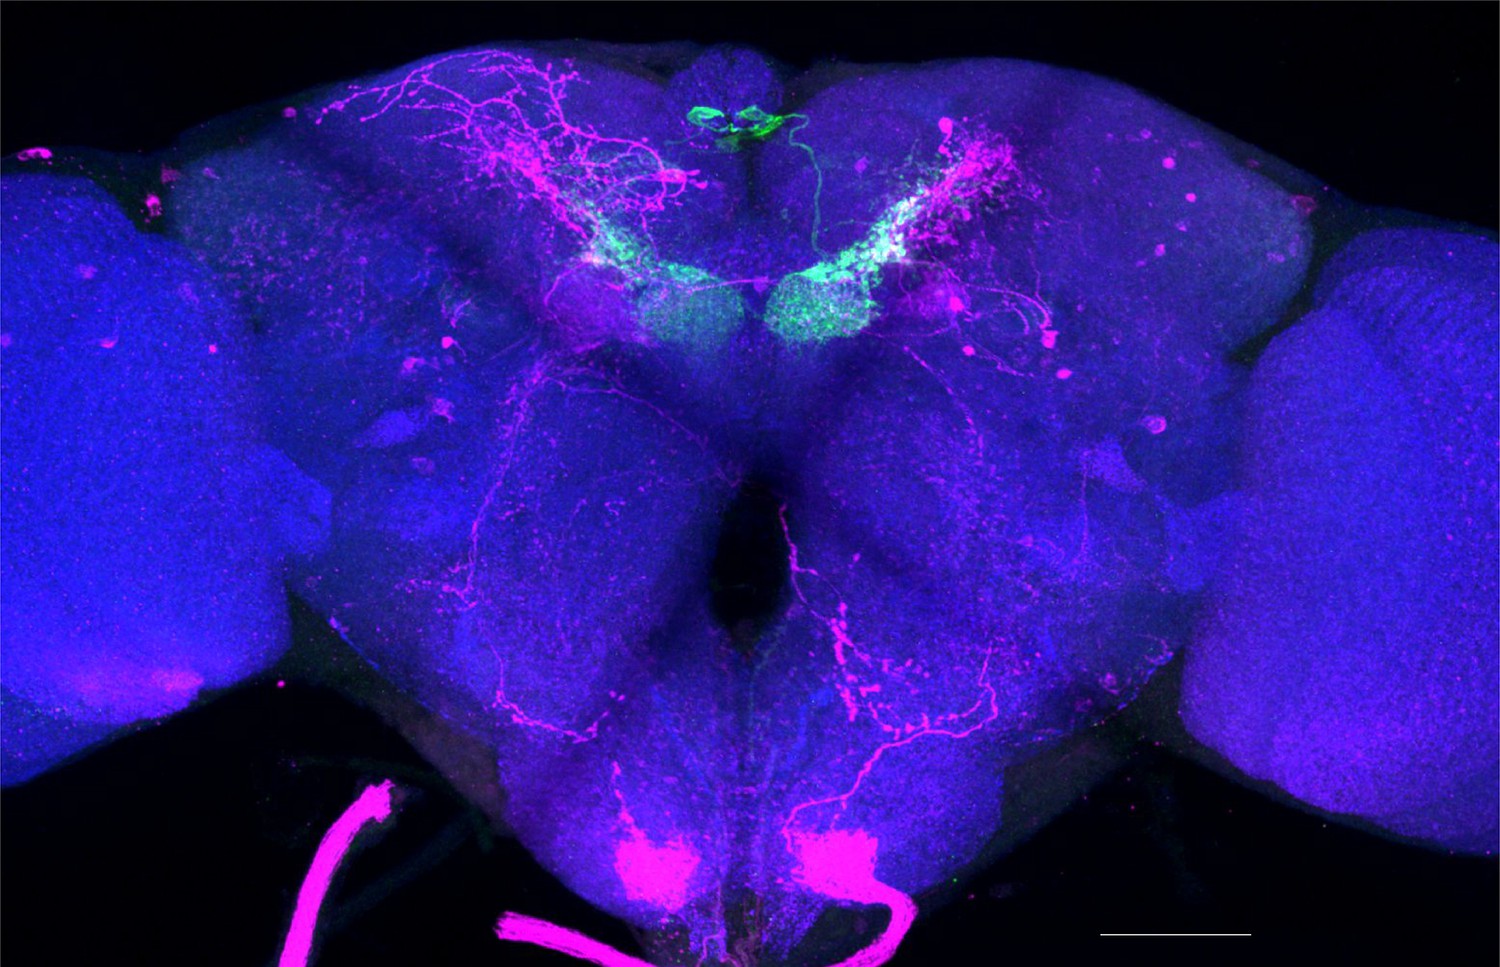
Figure 2 with 1 supplement
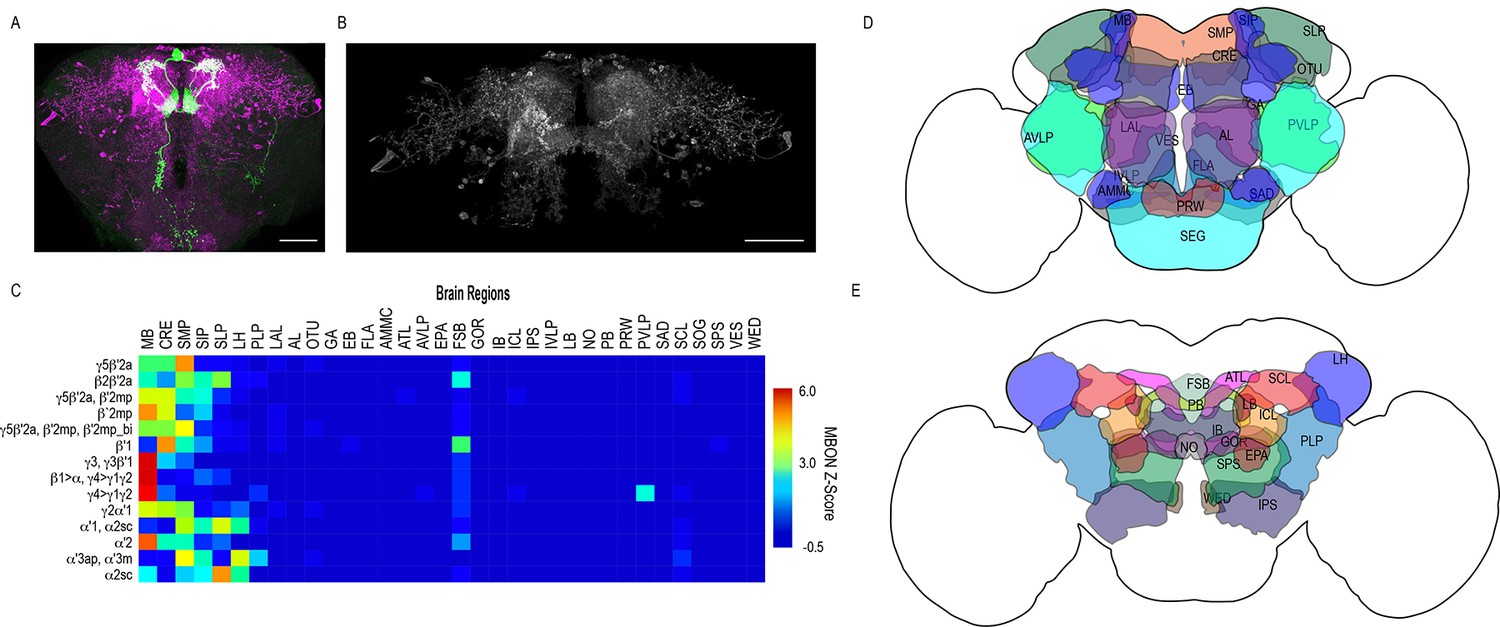
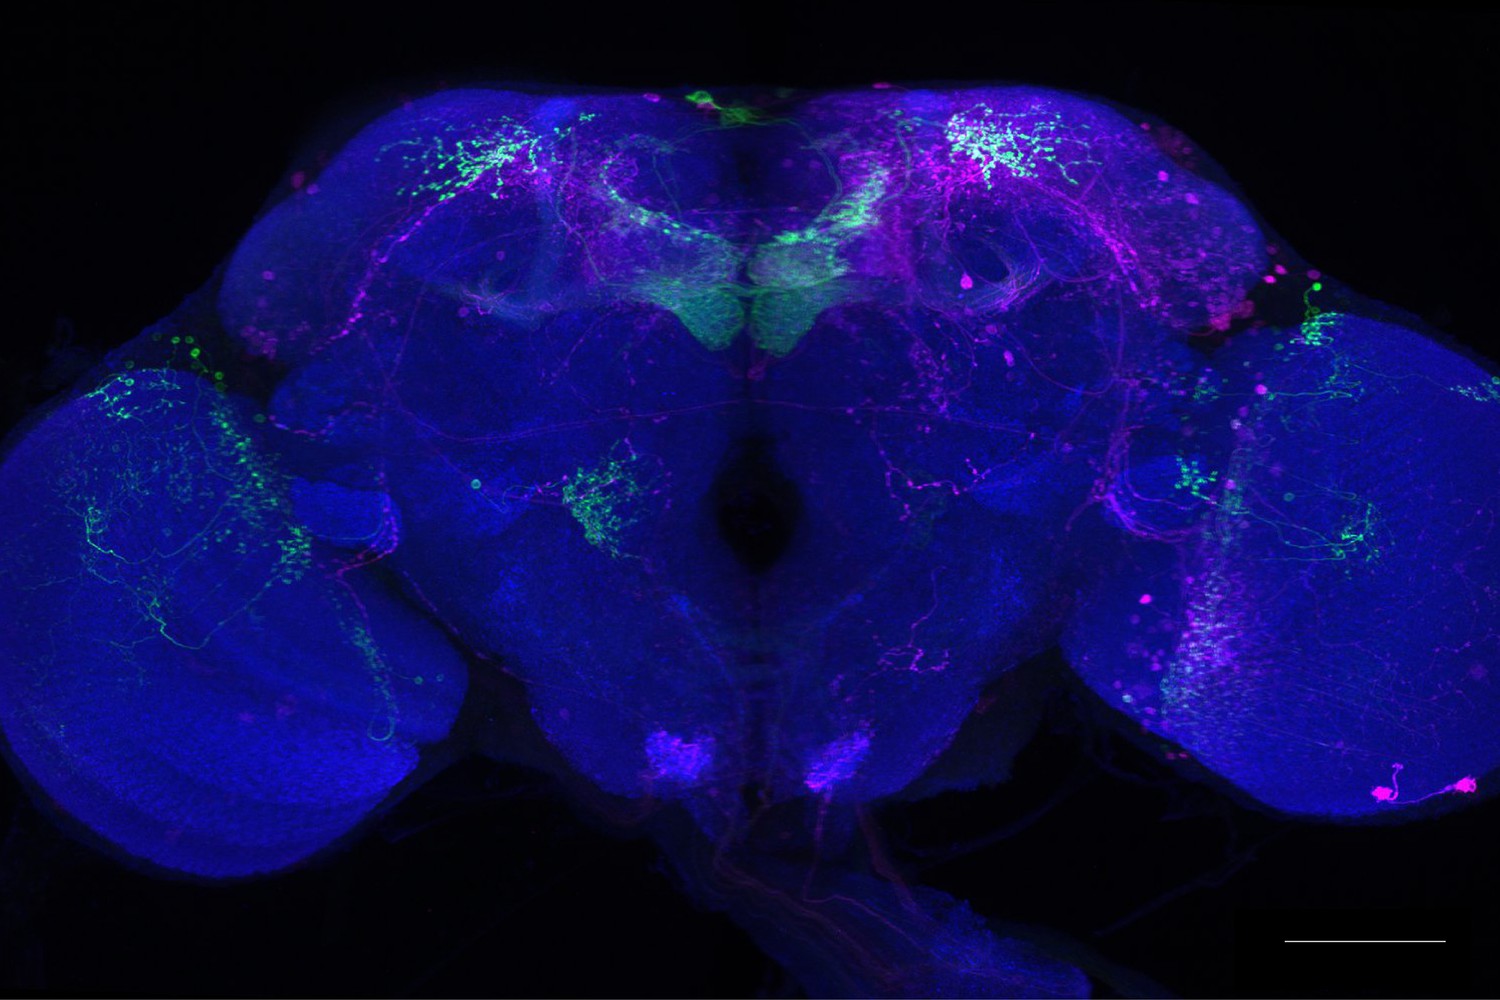
Whole brain distribution of MBON postsynaptic connections overlap.
(A) Example of presynaptic MBON γ5β′2a (SS01308) and postsynaptic trans-Tango signal in a registered brain. For max-stacks: green, presynaptic MBONs, magenta, postsynaptic trans-Tango signal. (B) Example of segmented trans-tango signals that was continuous to MBON γ5β′2a terminals. For max-stack: gray, postsynaptic trans-Tango signal. (C) Heatmap displaying the overlap in segmented MBON postsynaptic signal by brain region. Postsynaptic signal for each MBON was normalized within each brain to capture respective expression levels. SS01308 was used to target MBON γ5β′2a, MB399B was used to target MBON β2β′2a, MB002B was used to target MBONs γ5β′2a, β′2mp, SS01143 was used to target MBON β′2mp, MB011B was used to target MBONs γ5β′2a, β′2mp, β′2mp_bi, MB057B was used to target MBON β′1, and MB110C was used to target MBONs γ3, γ3β′1. MB433B was used to target MBONs β1>α, γ4>γ1γ2, MB298B was used to target MBON γ4>γ1γ2, MB077C was used to target MBON γ2α′1 and MB50B was used to target MBONs α′1, α2sc. MB018B was used to target MBON α′2, MB027B was used to target MBON α′3ap, α′3 m, and SS01194 was used to target MBON α2sc. For raw postsynaptic signal see Figure 2—figure supplement 1. (D) Schematic of fly brain highlighting the most anterior brain regions included in mask analysis starting at AL and ending with SLP. (E) Schematic of fly brain highlighting the most posterior brain regions included in mask analysis starting at NO and ending with PB. AL: antennal lobe, AMMC: antennal mechanosensory and motor center, ATL: antler, AVLP: anterior ventrolateral protocerebrum, CRE: crepine, EB: ellipsoid body, EPA: epaulette, FSB: fan-shaped body, FLA: flange, GA: shoulder of lateral accessory lobe, GOR: gorget of ventral complex, IB: interior bridge, ICL: inferior clamp, IPS: inferior posterior slope, IVLP: inferior ventrolateral protocerebrum, LAL: lateral accessory lobe, LB: bulb of lateral complex, LH: lateral horn, MB: mushroom body, NO: noduli, OTU: optic tubercle, PB: protocerebral bridge, PLP: posterior lateral protocerebrum, PRW: prow, PVLP: posterior ventrolateral protocerebrum, SAD: saddle, SCL: superior clamp, SEG: subesophageal ganglion, SIP: superior intermediate protocerebrum, SLP: superior lateral protocerebrum, SMP: superior medial protocerebrum, SPS: superior posterior plate, VES: vest of ventral complex, WED: wedge. Scale bar = 50 μm.
Figure 2—figure supplement 1
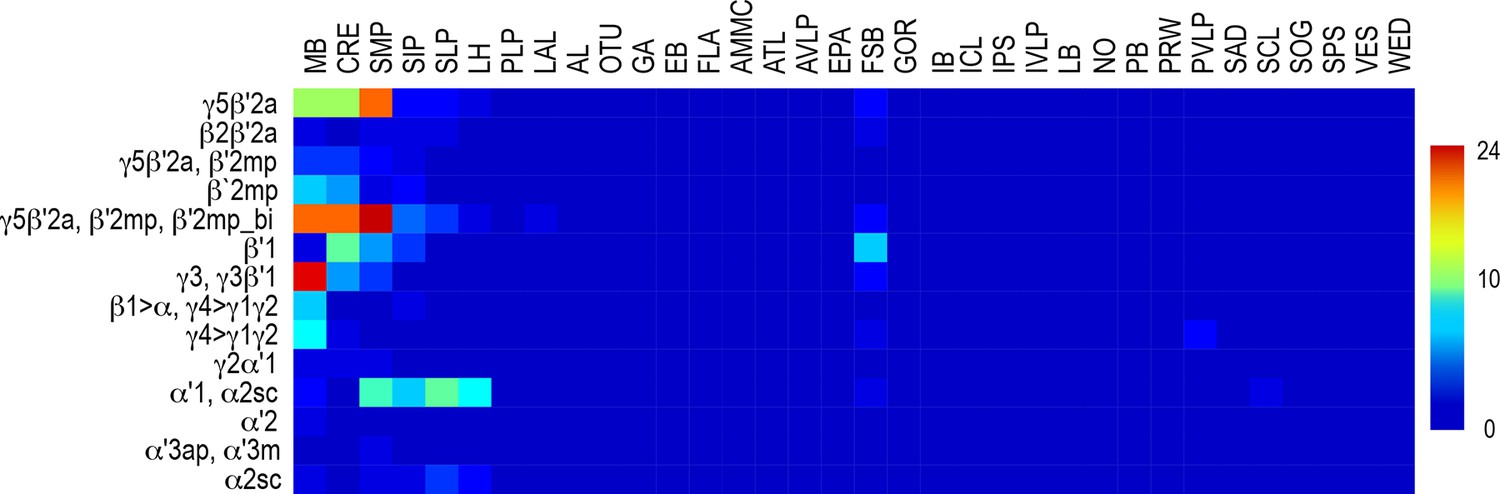
Whole brain distribution of MBON postsynaptic connections.
Heatmap displaying the unscaled overlap in signal of segmented MBON postsynaptic signal by brain region.
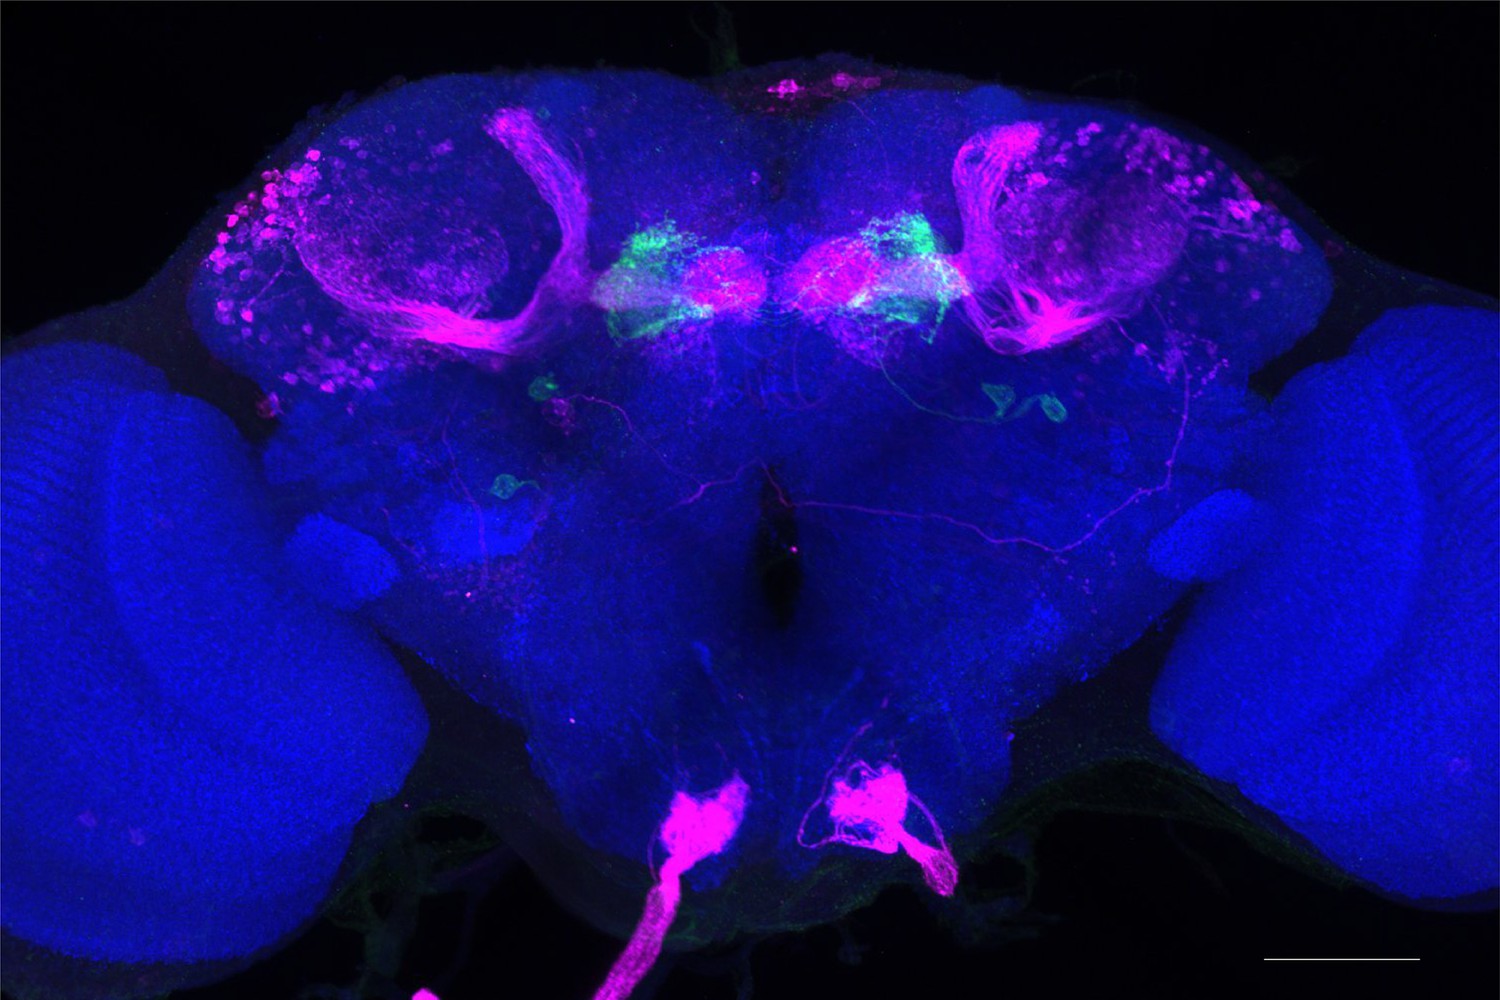
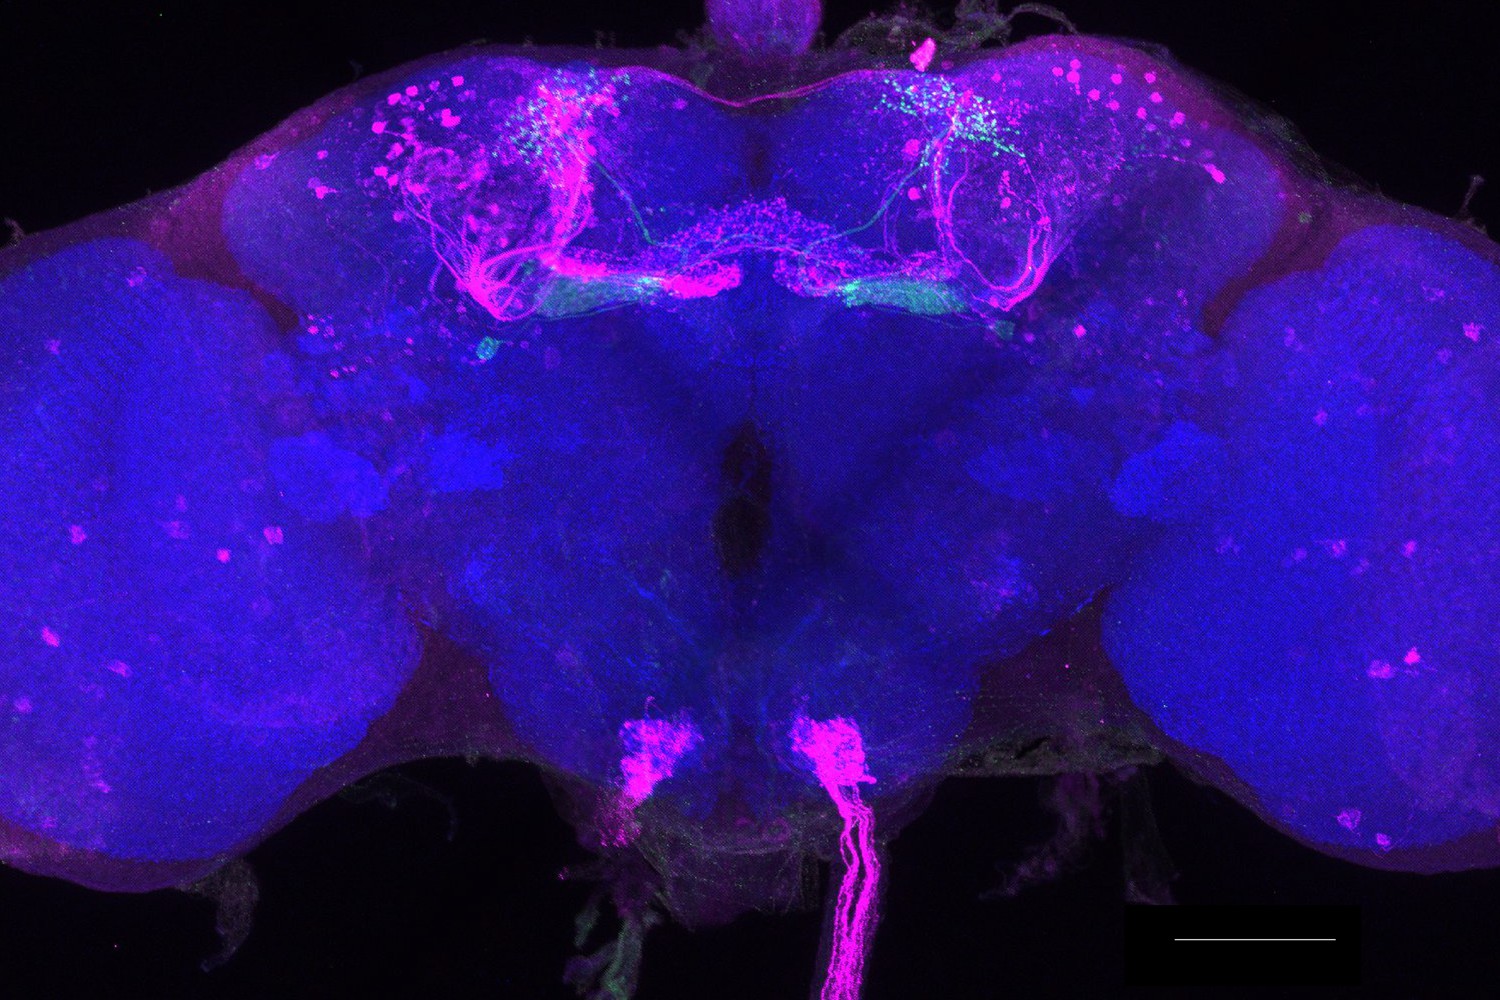
Figure 3 with 2 supplements
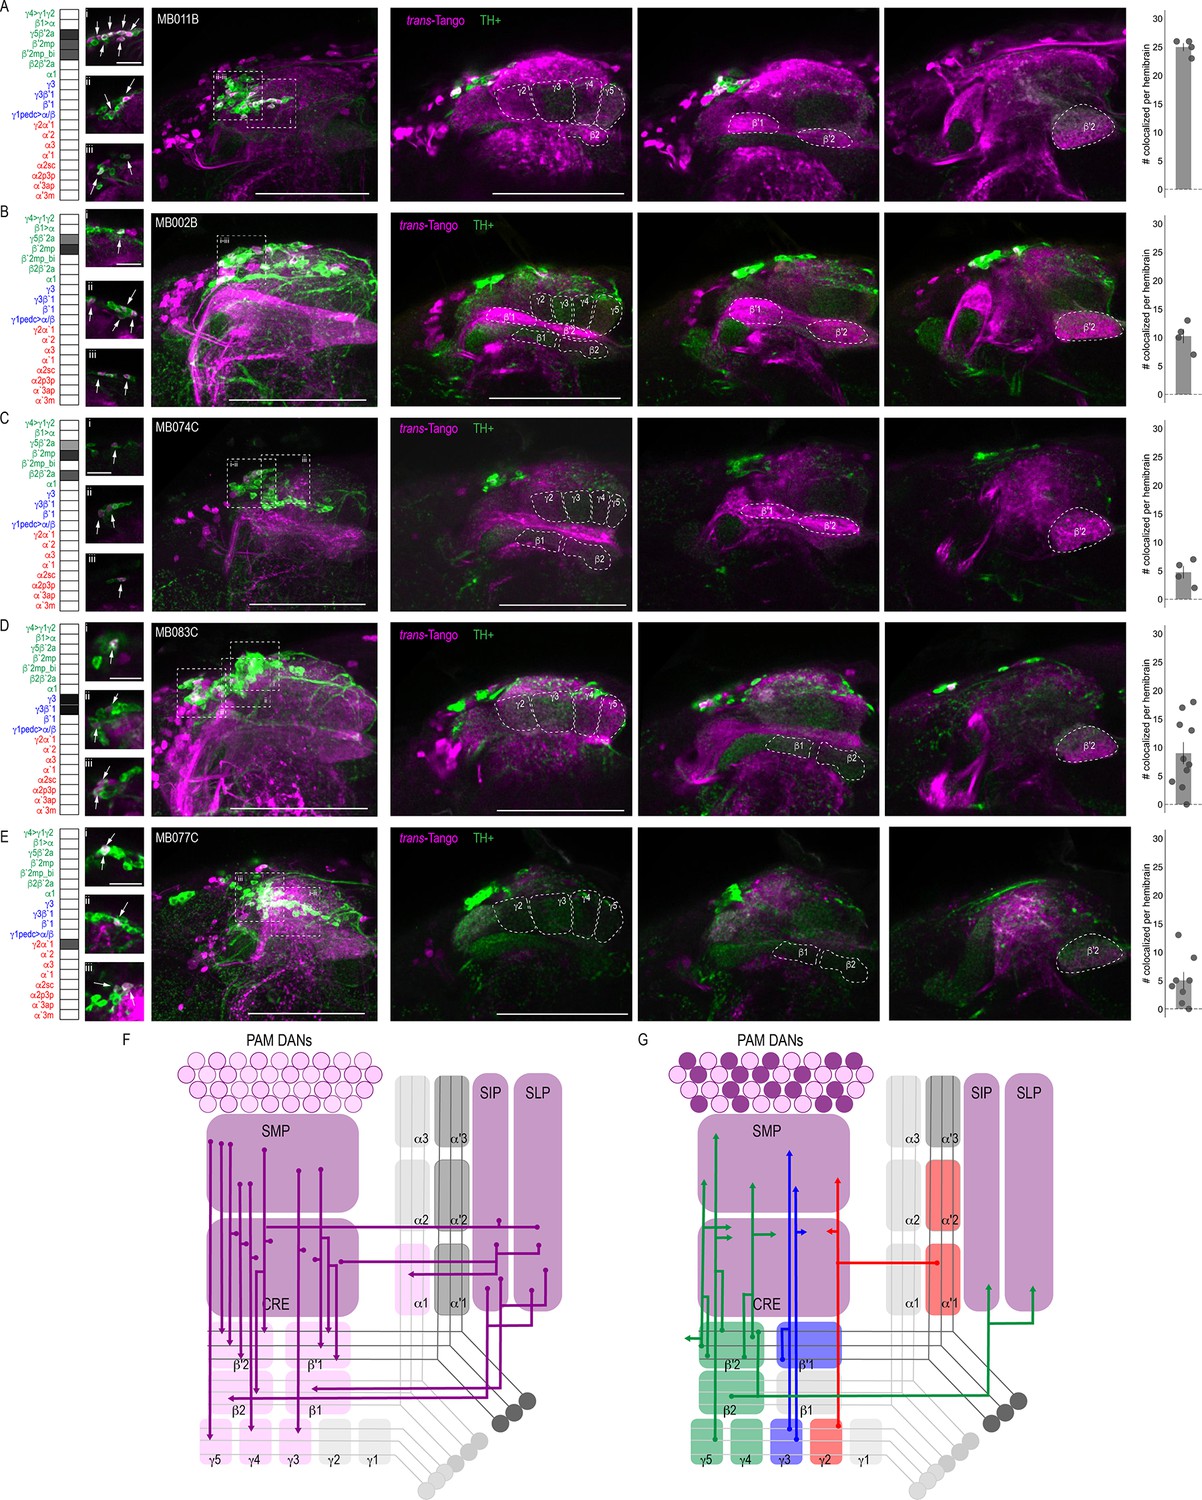
DANs postsynaptic to MBONs.
Exemplar max-stacks of MBON lines in which TH+ cells overlapped with postsynaptic signal of glutamatergic (A) MBON γ5β′2a, β′2mp, β′2mp_bilateral (MB011B), (B) MBON γ5β′2a, β′2mp (MB002B), (C) MBON γ5β′2a, β′2mp, β2β′2a (MB074C), (D) GABAergic MBONs γ3, γ3β′1 (MB083C) and (E) cholinergic MBONs γ2α′1 (MB077C). Overlapping TH+ and trans-Tango cell bodies are highlighted in insets, scale bar = 10 μm. Max stacks of MB are included (Column I), scale bar = 50 μm. Column II-IV depict single optical planes from anterior to posterior outlining MB compartments. Bar graphs indicate the average number of co-localized cells per hemibrain (mean +/- standard error). Green, TH-positive cells; magenta, postsynaptic trans-Tango signal. MBON maps are organized by neurotransmitter type: green=glutamatergic, blue=GABAergic, red=cholinergic. (F) Schematic depicting the MB innervation by PAM DANs. PAM DANs extend dendrites to SMP, CRE, SIP, and SLP. (G) Schematic depicting the MBONs that synapse on TH+ cells.
Figure 3—figure supplement 1
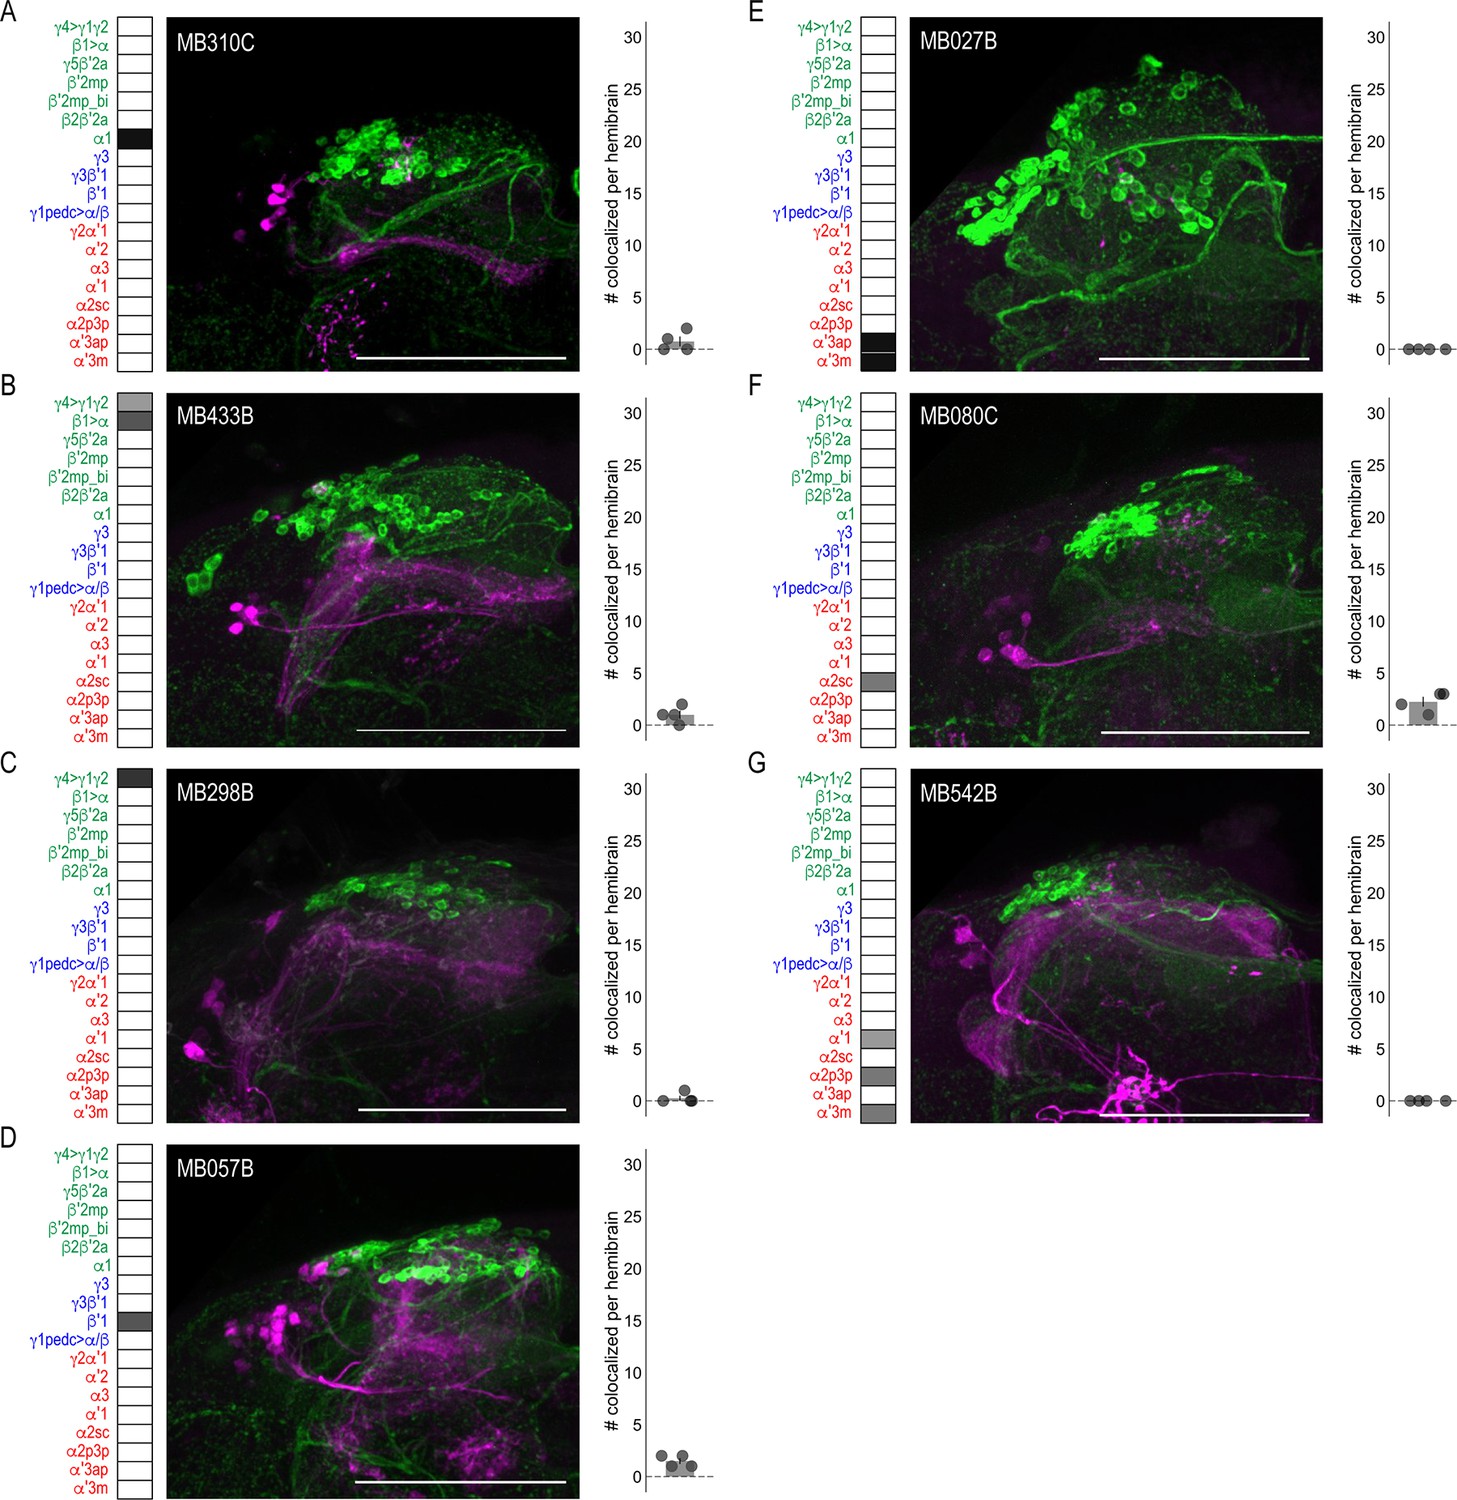
DANs postsynaptic to MBONs.
Exemplar max-stacks of MBON lines in which TH+ cells were not overlapping or had few overlapping cells with postsynaptic signal of glutamatergic (A) MBON α1 (MB310C), (B) MBON γ4>γ1 γ2, β1>α (MB433B), (C) MBON γ4>γ1 γ2 (MB298B), (D) GABAergic MBON β′1 (MB057B), (E) cholinergic MBON α′3 (MB027B), (F) MBON α2sc (MB080C), and (G) MBONs α′1, α2p3p, α′3m (MB542B). Max stacks of MB are included, scale bar = 50 μm. Bar graphs indicate the average number of co-localized cells per hemibrain (mean ± standard error). Green, TH-positive cells; magenta, postsynaptic trans-Tango signal. MBON maps are organized by neurotransmitter type: green=glutamatergic, blue=GABAergic, red=cholinergic.
Figure 3—figure supplement 2

Total PAM TH+ cells counted.
Bar graphs indicate the average number of PAM TH+ cells counted per hemibrain (mean ± standard error).
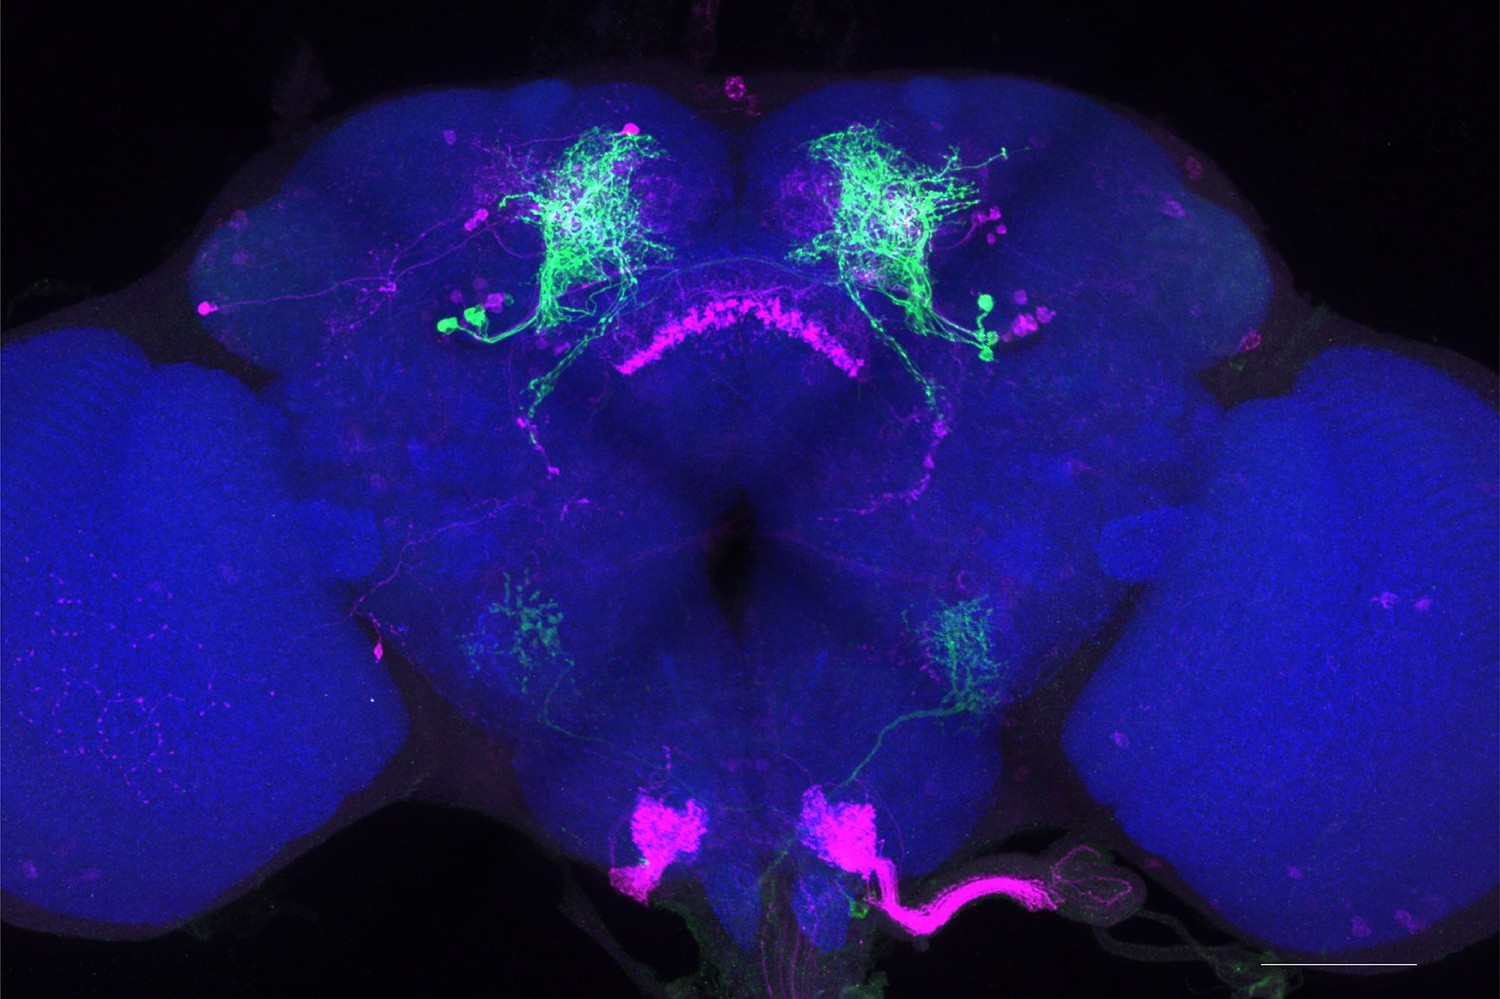
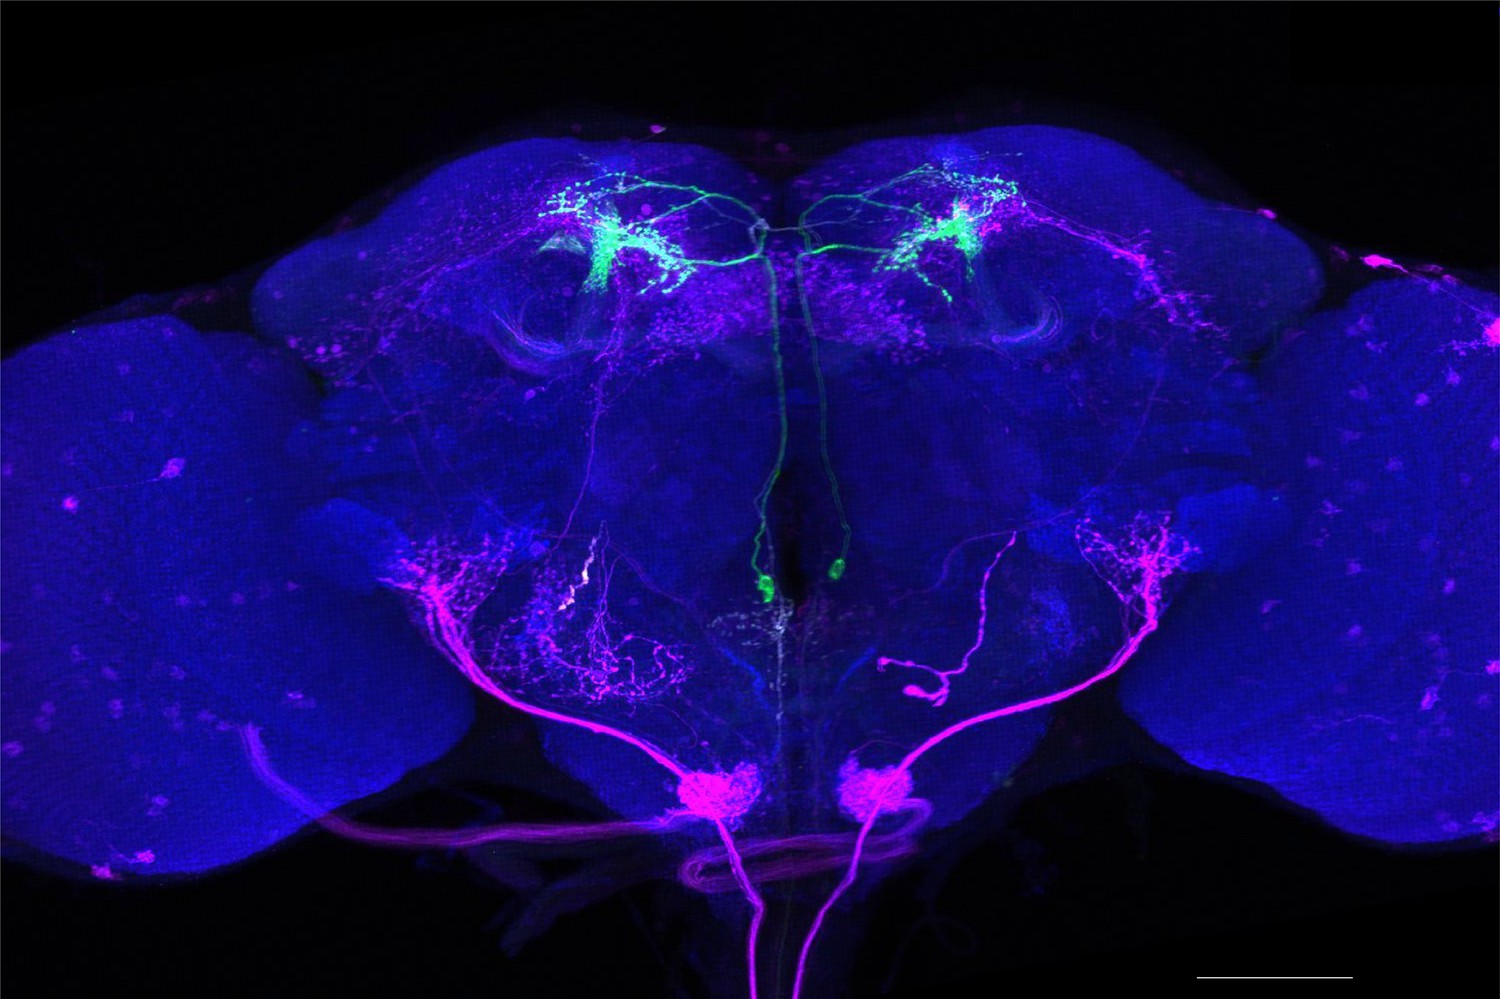
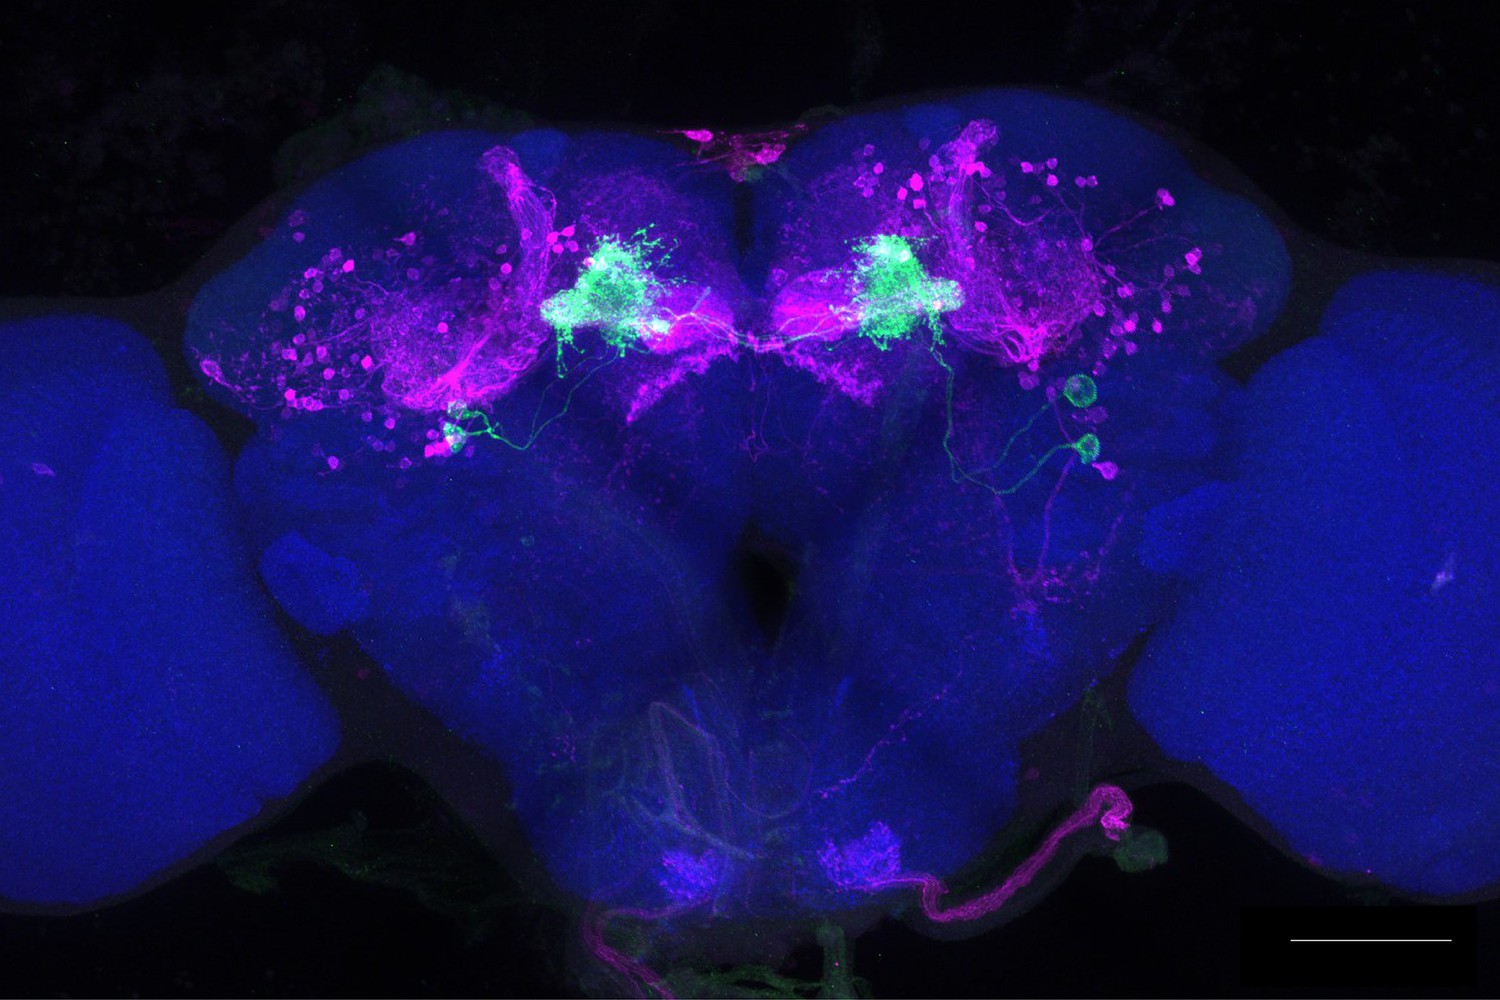
Figure 4 with 1 supplement
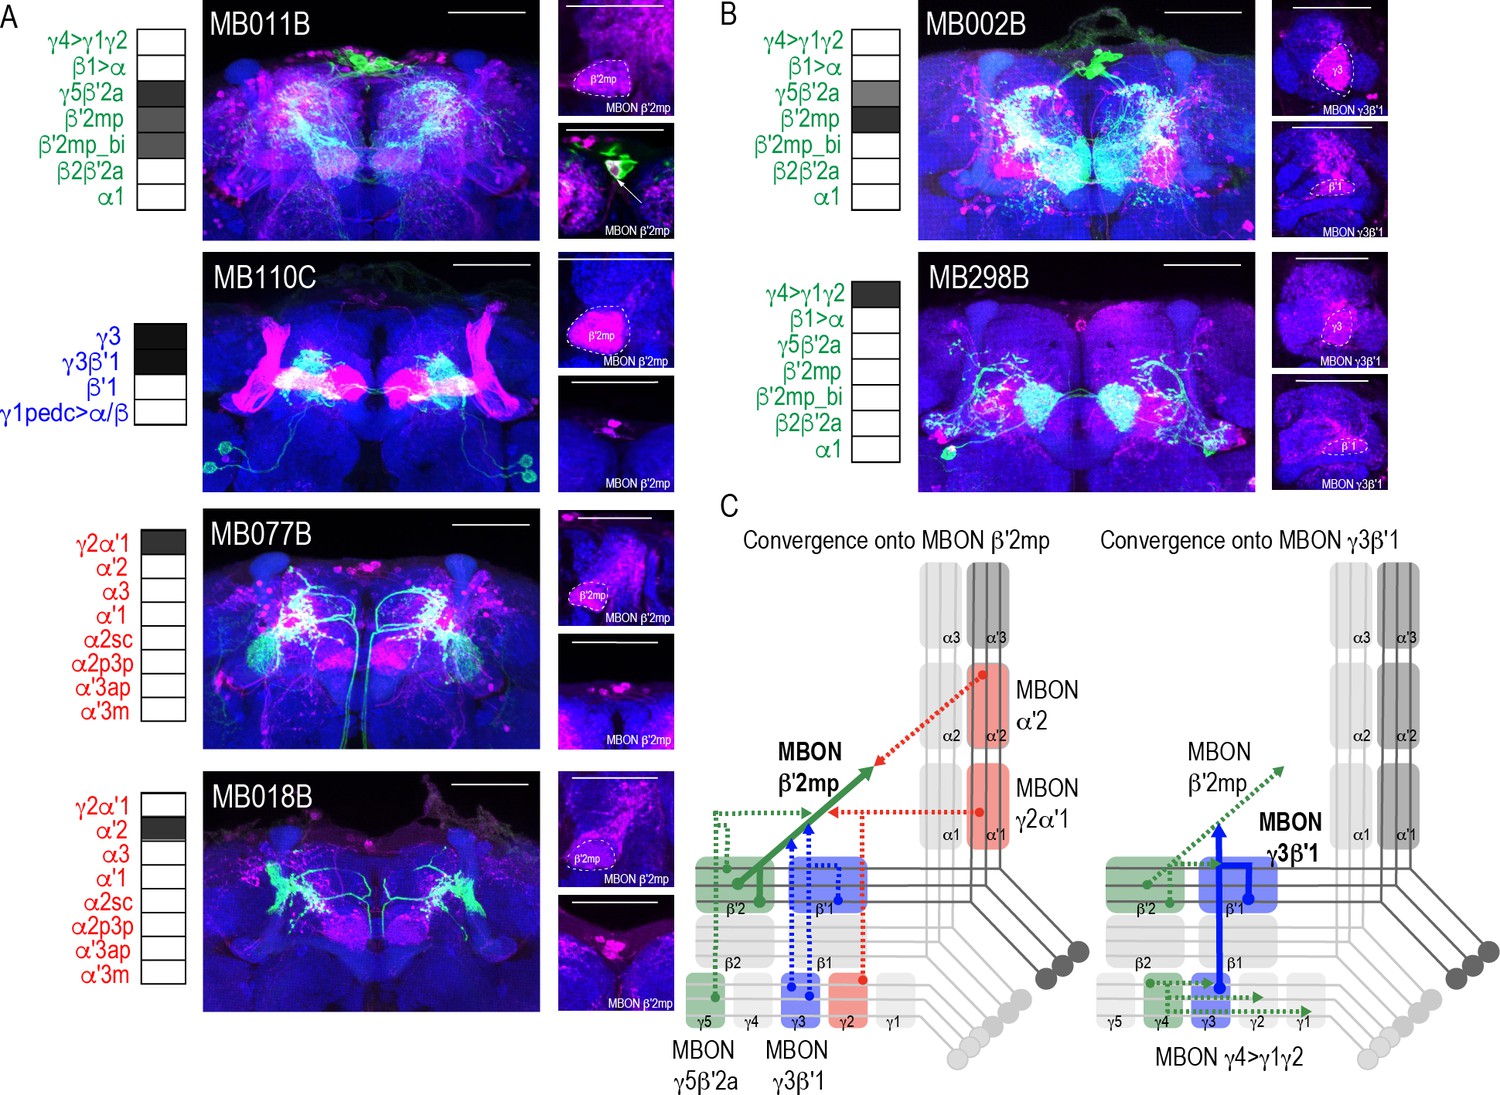
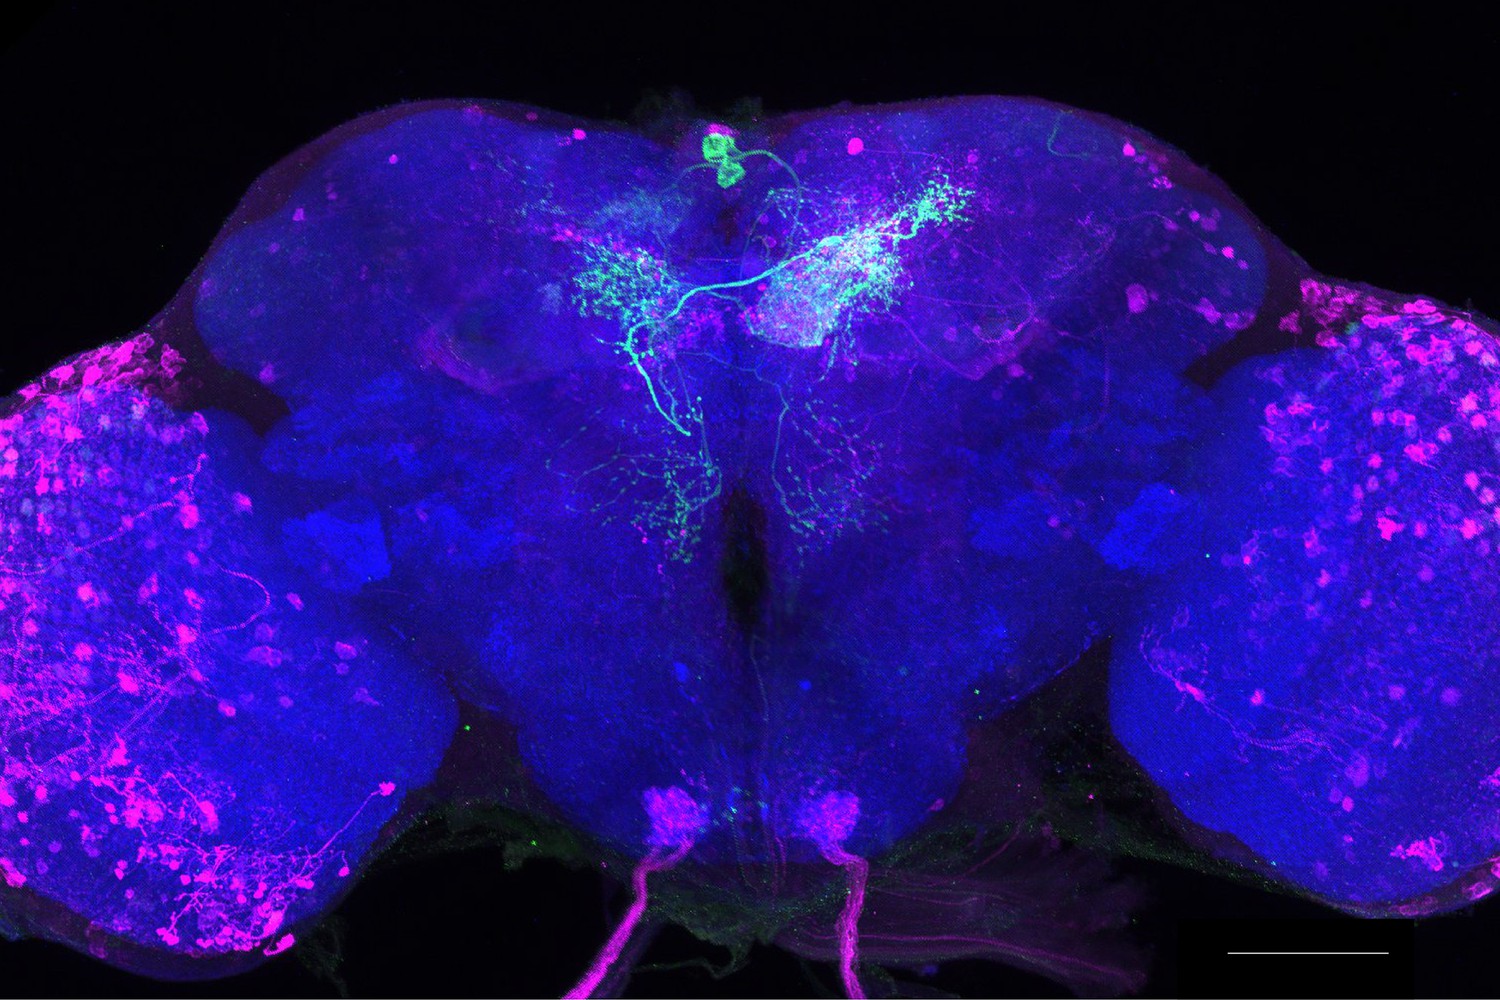
Subsets of MBONs converge on other MBONs.
(A) MBON β′2mp receives convergent input from glutamatergic MBON γ5β′2a (MB011B), GABAergic MBONs γ3, γ3β′1 (MB110C) and cholinergic MBON γ2α′1 (MB077B) and MBON α′2 (MB018B). (B) MBON γ3β′1 receives convergent input from glutamatergic MBON β′2mp (MB002B) and MBON γ4>γ1γ2 (MB298B). β′2mp, γ3 and β′1 are outlined in representative stacks. (C) Schematics summarizing identified convergent MBONs (β′2mp and γ3β′1) and their respective convergent input. Solid lines represent the convergent MBON and dotted lines represent convergent input. For max-stacks: green, presynaptic MBONs, magenta, postsynaptic trans-Tango signal, blue, brp-SNAP neuropil, scale bar=50 μm.
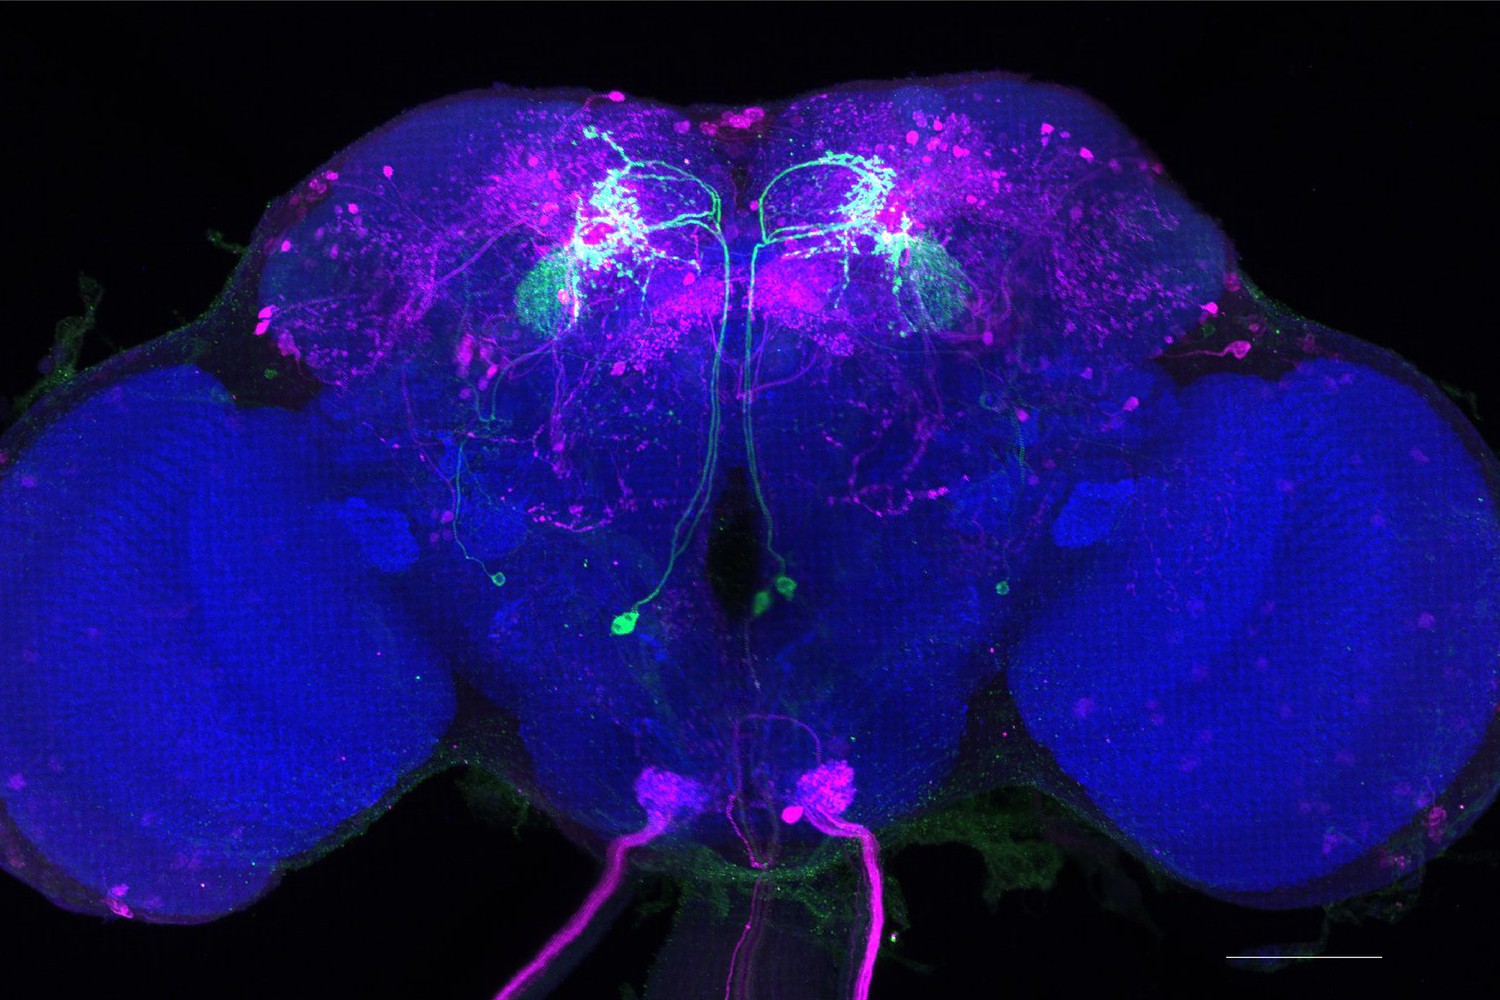
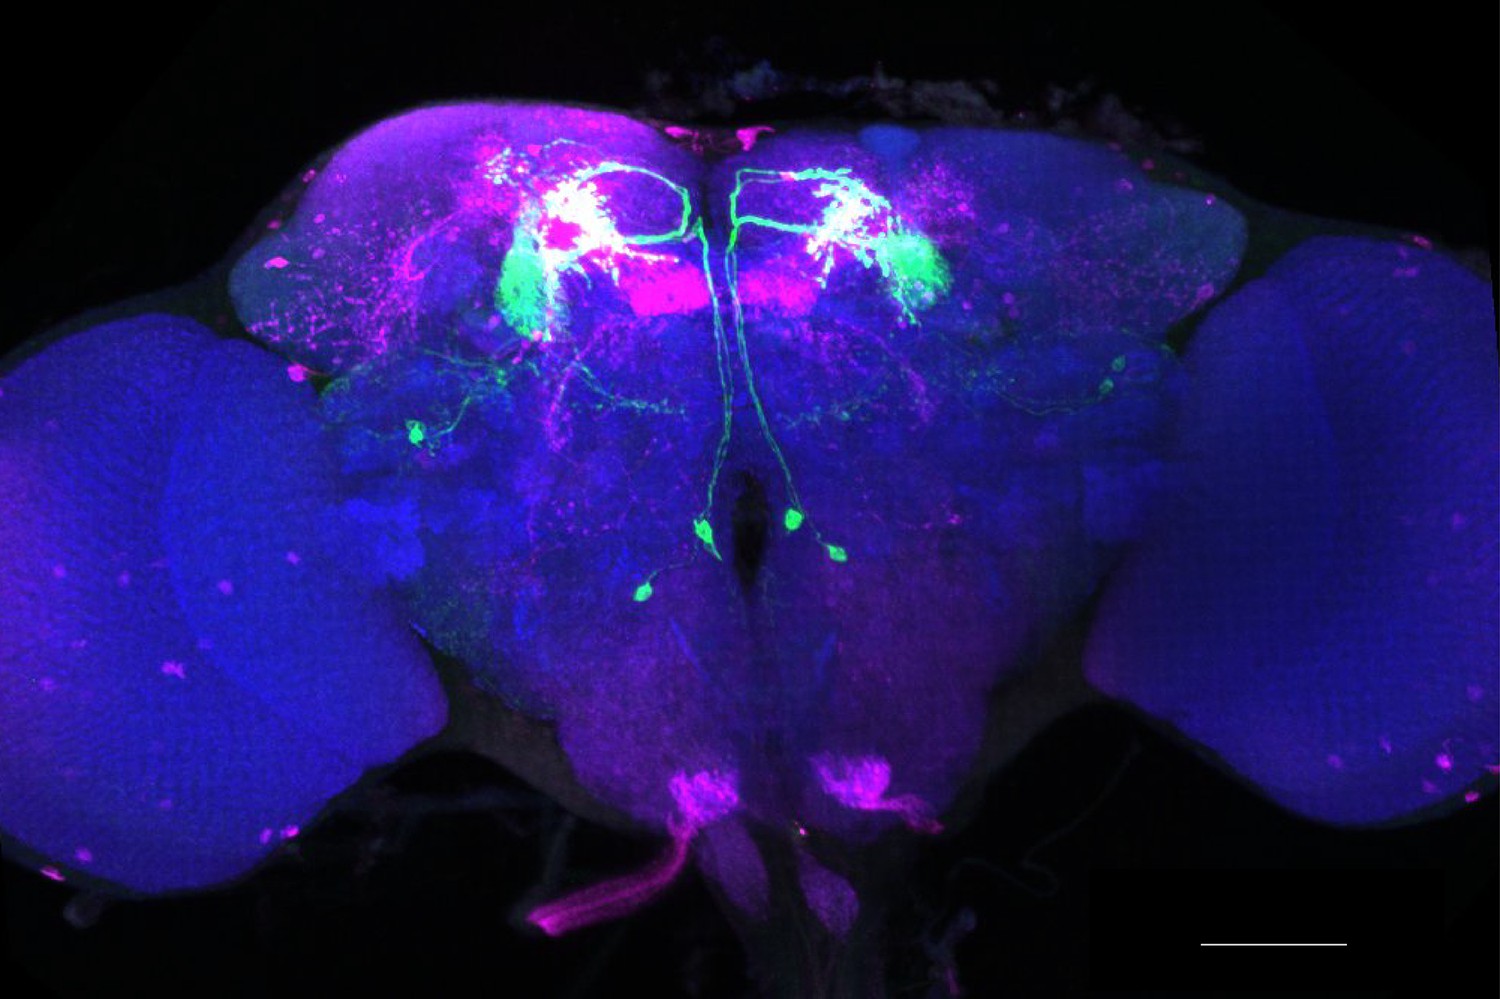
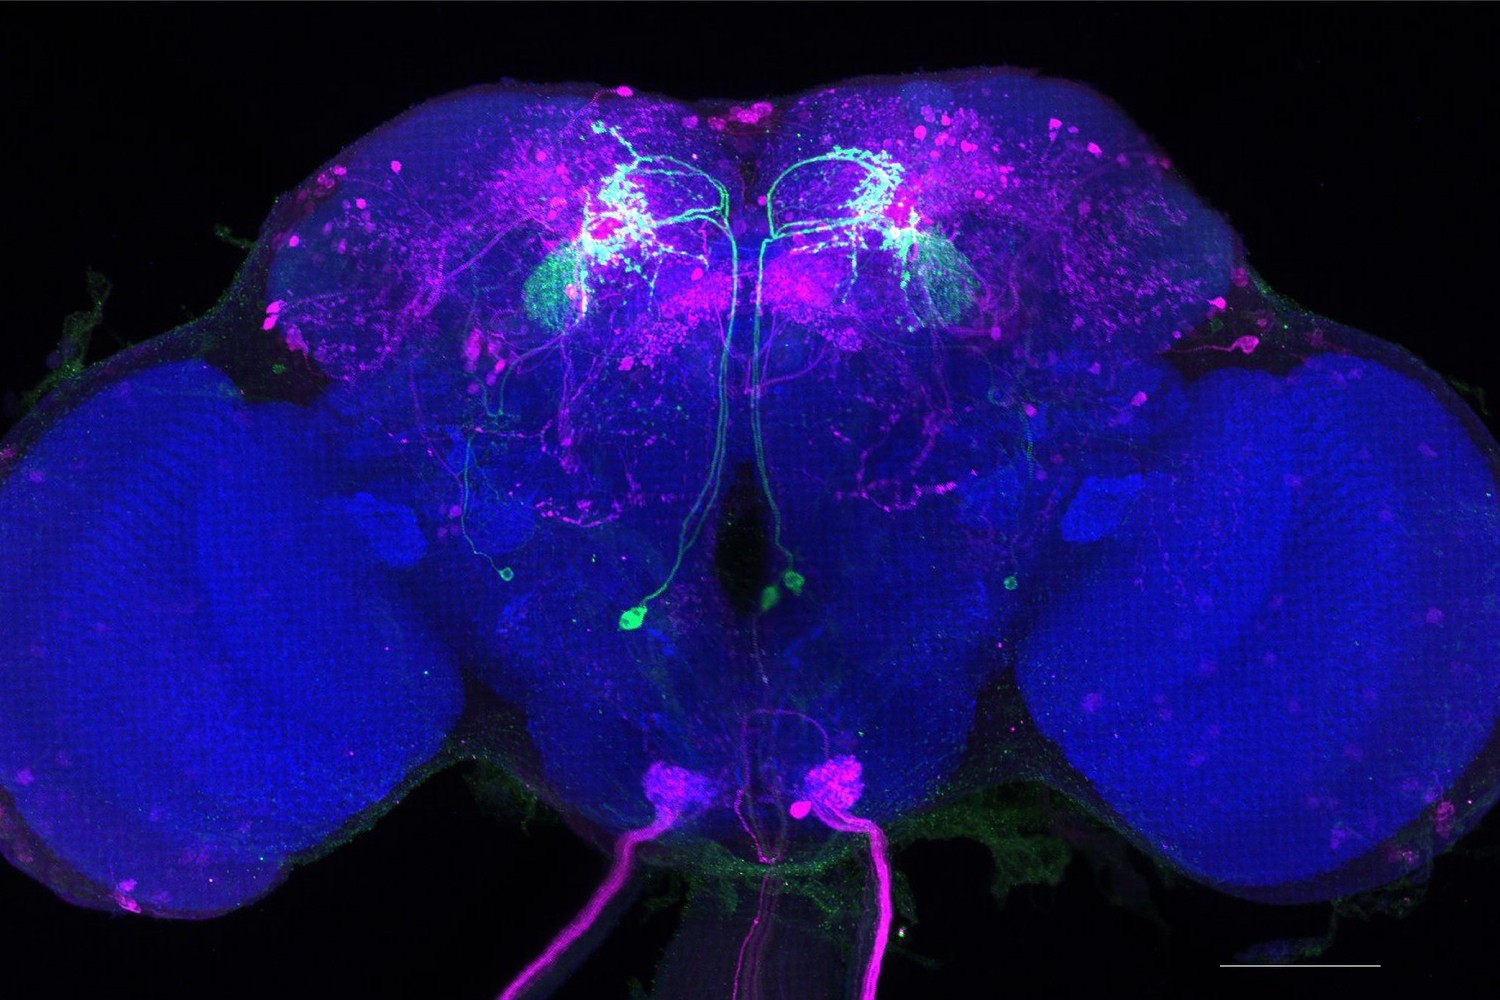
Figure 4—figure supplement 1
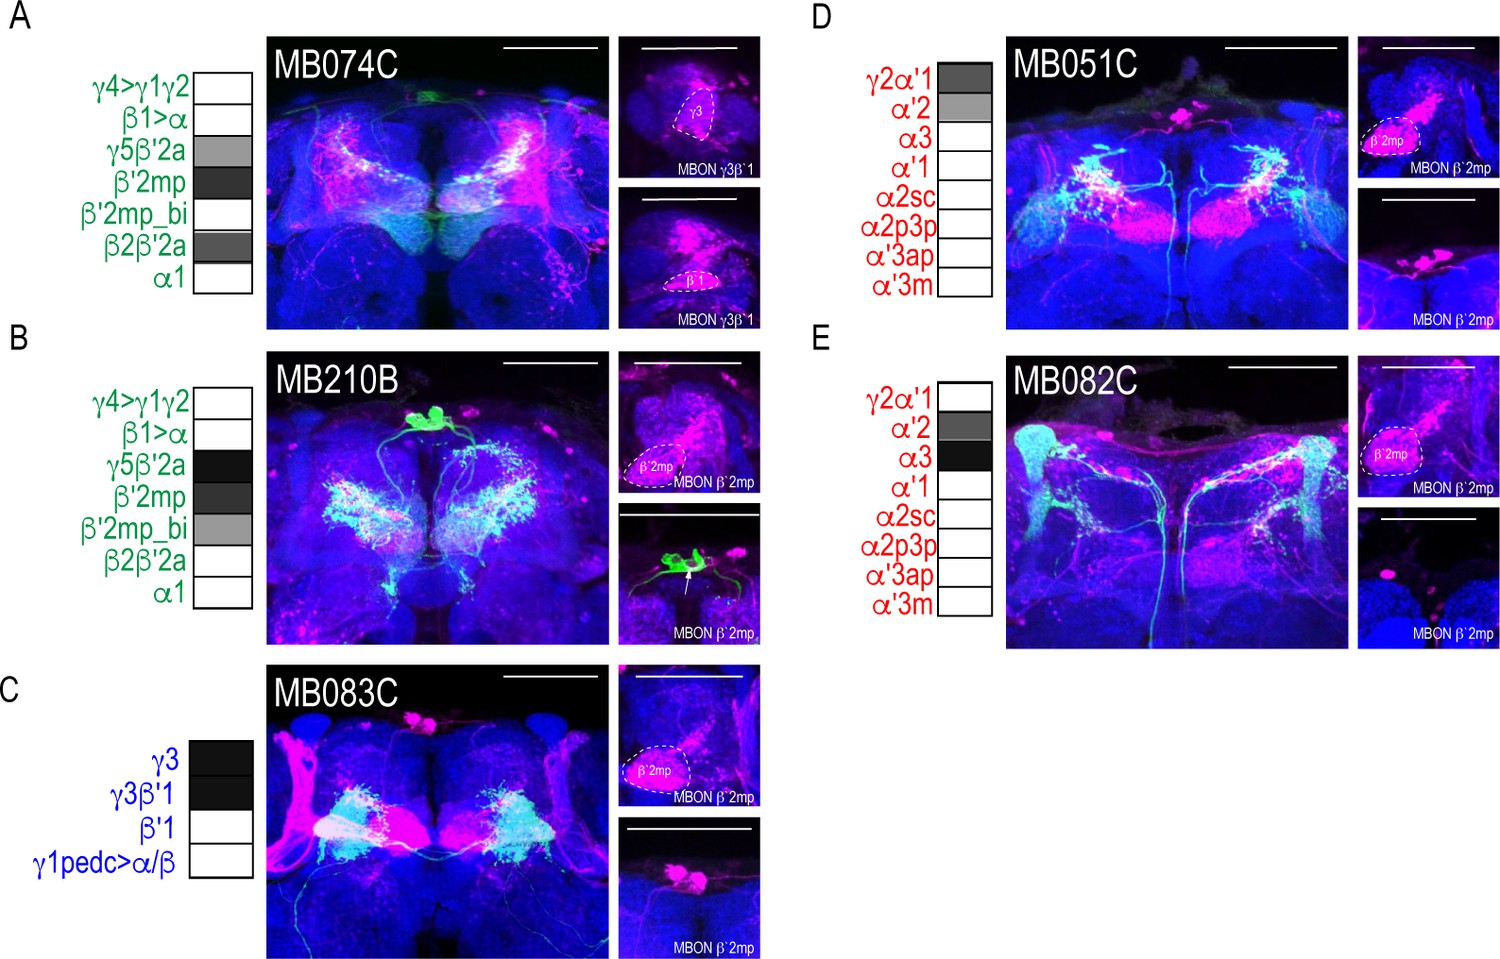
Patterns of MBON convergence is consistent across MBON driver lines that have similar MBON expression.
MBON γ3β′1 receives input from (A) glutamatergic MBON β′2mp (MB074C). MBON β′2mp receives convergent input from (B) glutamatergic MBON γ5β′2a (MB210B), (C) GABAergic MBONs γ3, γ3β′1 (MB083C) and (D) cholinergic MBON γ2α′1 (MB051C) and (E) MBON α′2 (MB082C). For max-stacks: green, presynaptic MBONs, magenta, postsynaptic trans-Tango signal, blue, brp-SNAP neuropil, scale bar=50 μm.
Figure 5 with 2 supplements
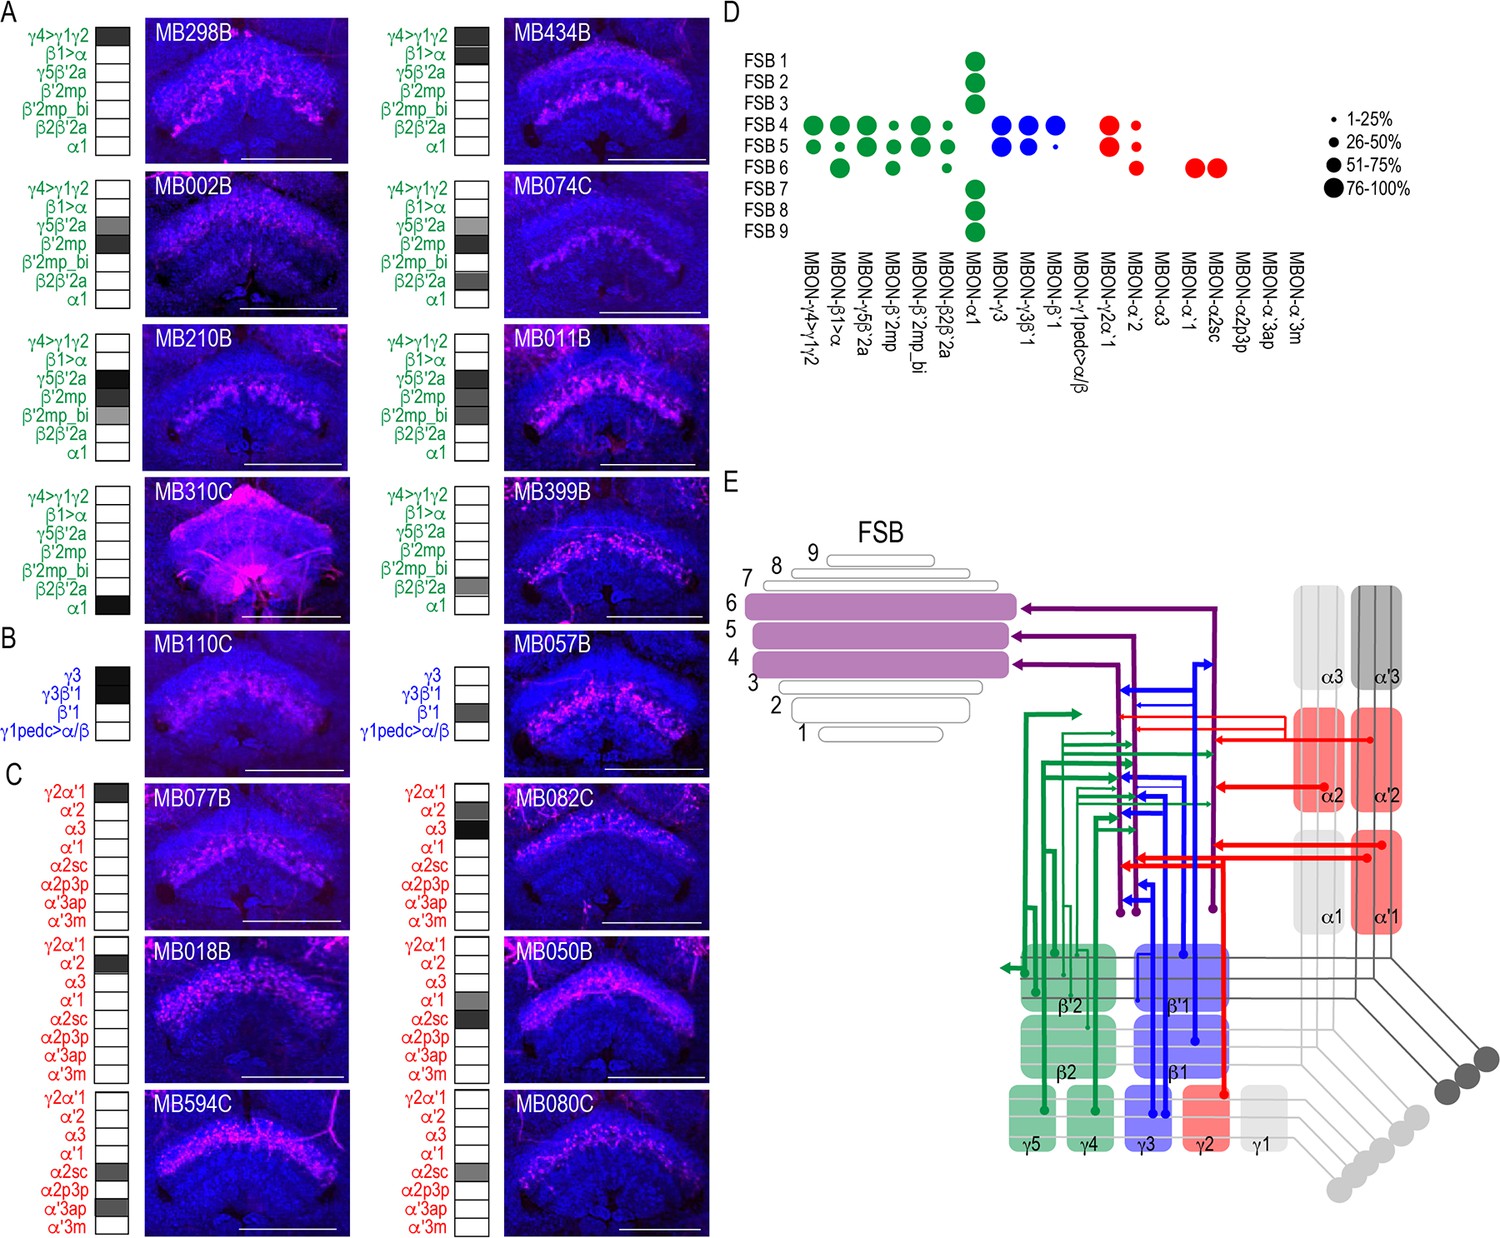
MBONs converge on different layers of the FSB.
Exemplar max-stacks of glutamatergic (A), GABAergic (B), and cholinergic (C) MBONs whose postsynaptic neurons innervate the FSB. Max-stacks are approximately 50 μm thick. Slices were selected based on the relative position of the FSB. For FSB stacks: magenta, postsynaptic trans-Tango signal, blue, brp-SNAP neuropil. Map of MBONs accompany each exemplar with the relative expression pattern (grayscale, 1–5) accordingly to FlyLight. For each map, green=glutamatergic, blue=GABAergic, red=cholinergic. Scale bar = 50 μm. (D) Map summarizing the percentage of trans-Tango-positive signal in each FSB layer across brains for each MBON. (E) Schematic depicting MBONs that converge onto different layers of the FSB. MB compartments are colorized based on the neurotransmitter expressed by the MBON that innervates it. Lines thickness corresponds to the percentage of trans-Tango-positive signal in each FSB layer across brains for each MBON.
Figure 5—figure supplement 1

MBON α1 postsynaptic signal innervating FSB in females.
Exemplar max-stacks of glutamatergic MBON α1 whose postsynaptic neurons innervate the FSB from two female flies highlighting the broad FSB innervation pattern of postsynaptic signa. Max-stacks are approximately 50 μm thick. Magenta, postsynaptic trans-Tango signal; blue, neuropil. Scale bar = 50 μm.
Figure 5—figure supplement 2
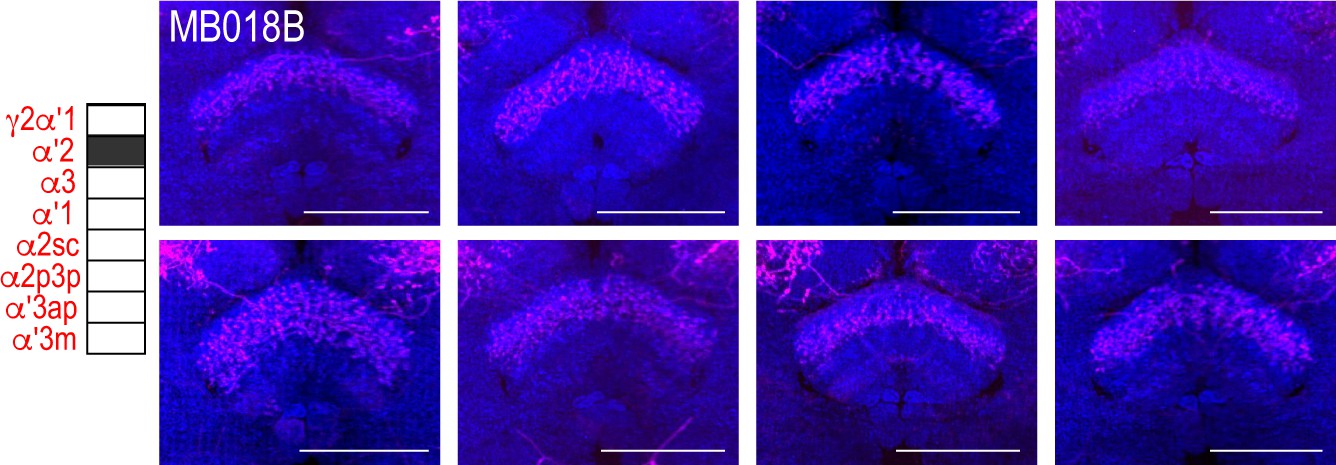
Variability in FSB postsynaptic signal.
Exemplar max-stacks of cholinergic MBON α`2 whose postsynaptic neurons innervate the FSB highlighting the variability that existed in FSB innervation across eight different brains. Max-stacks are approximately 50 μm thick. Magenta, postsynaptic trans-Tango signal; blue, neuropil. Scale bar = 50 μm.
Figure 6
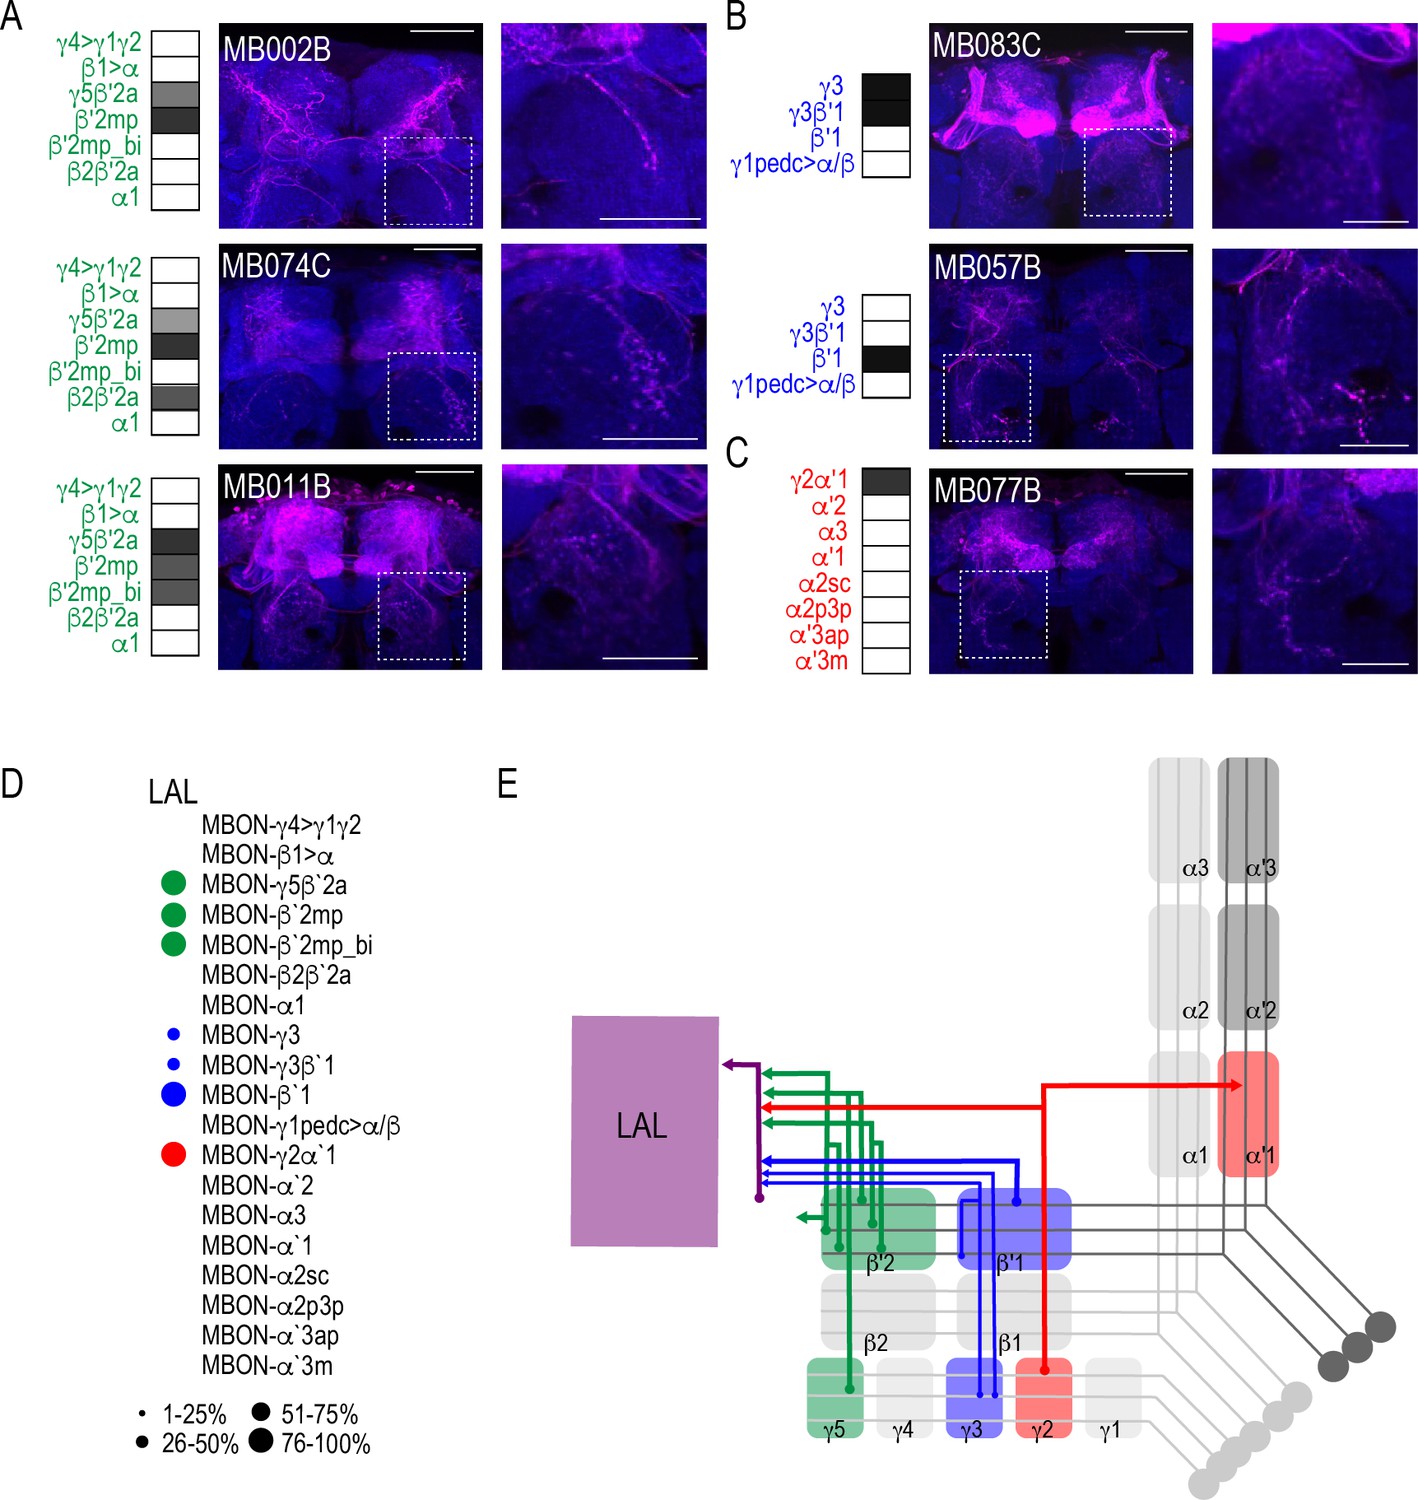
MBONs converge onto LAL neurons.
Exemplar max-stacks of glutamatergic (A), GABAergic (B), and cholinergic (C) MBONs innervating the LAL. Max-stacks are approximately 50 μm thick. Slices were selected based on the relative position of the LAL. Magenta, postsynaptic trans-Tango signal, blue, brp-SNAP neuropil. Map of MBONs accompany each exemplar with the relative expression pattern (grayscale, 1–5) accordingly to FlyLight. For each map green=glutamatergic, blue=GABAergic, red=cholinergic. Scale bar = 50 μm. Scale bar for insets = 10 μm (D) Map summarizing the percentage of trans-Tango-positive signal in LAL across brains for each MBON. (E) Schematic depicting MBONs that converge onto neurons innervating the LAL. MB compartments are colorized based on the neurotransmitter expressed by the MBON that innervates it. Lines thickness corresponds to the percentage of trans-Tango-positive signal in LAL across brains for each MBON.
Figure 7 with 3 supplements
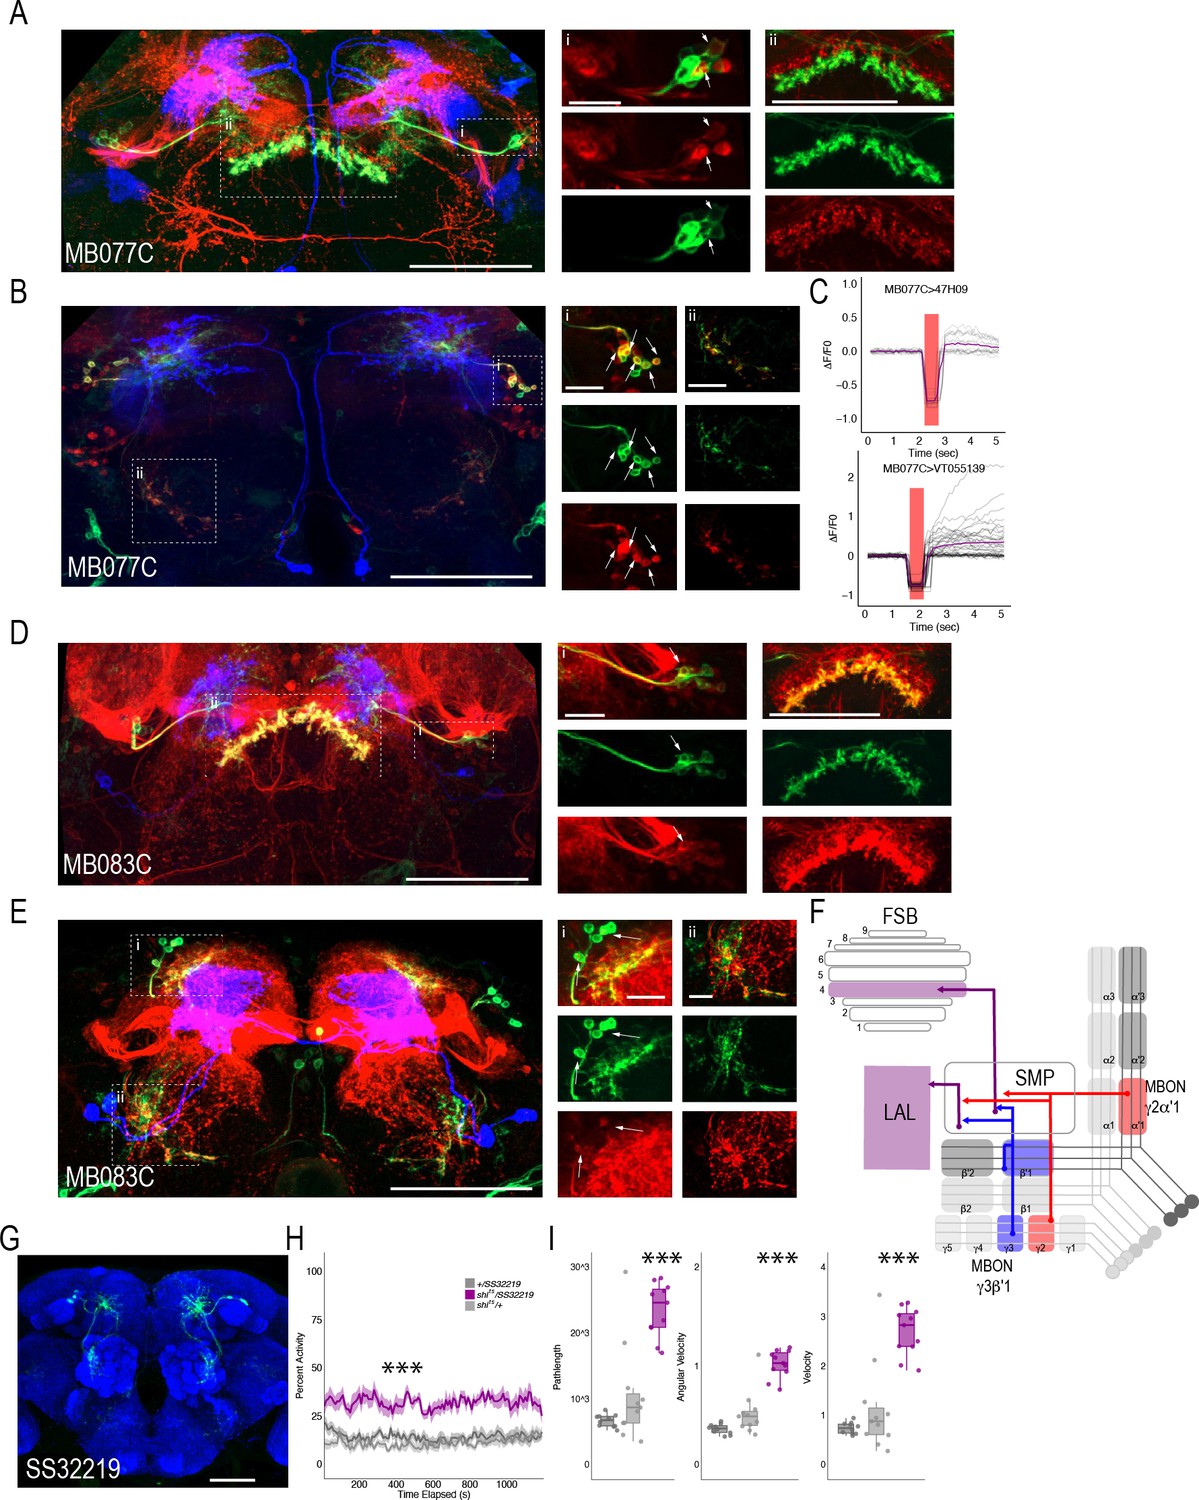
MBONs γ3β′1 and γ2α′1 converge onto the same subset of LAL and FSB neurons.
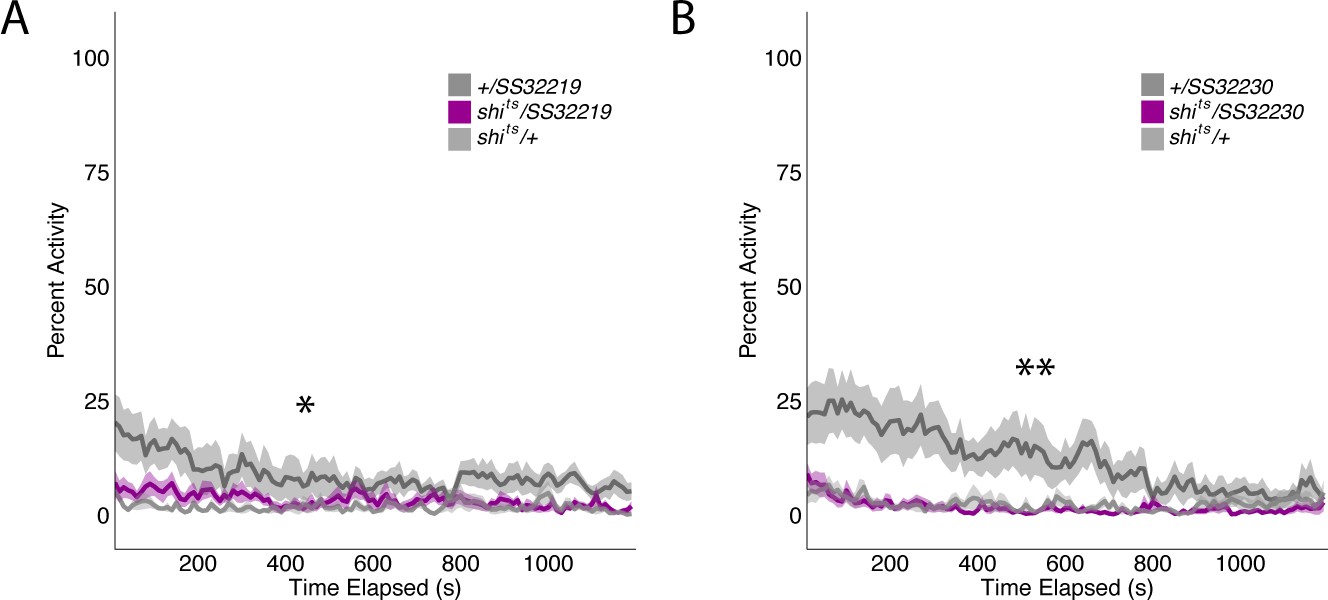
Exemplar max-stacks of cholinergic MBON γ2α′1 (MB077C) postsynaptic connections and identified overlap with respective (A) FSB (47H09) and (B) LAL (VT015539). (C) Confirmation of functional connection with optogenetic activation of MB077C and calcium imaging of FSB neurons in SMP and FSB (47H09), and calcium imaging of LAL neurons in SMP (VT015539). The red bar indicates when the LED was on and the shutter was closed to protect the PMTs during LED stimulation. Exemplar max-stacks of GABAergic MBON γ3β′1 (MB083C) postsynaptic connections and identified overlap with respective (D) FSB (47H09) and (E) LAL (VT015539). Max-stacks are approximately 50 μm thick. Slices were selected based on the relative position of the LAL and FSB. In A, B, D and E, red, postsynaptic trans-Tango signal; blue, CD2 marker of split-GAL4 line; green, LexA FSB or LAL. Scale bar = 50 μm. (F) Schematic highlighting convergence of MBONs γ3β′1 and γ2α′1 onto the same genetically identified subsets of LAL and FSB neurons. (G) Max-stack of SS32219; green, GFP expression; blue, neuropil. Scale bar = 50 μm. (H) shibirets (shits) inactivation of LAL using split-GAL4 SS32219 resulted in significant increases in group activity (F(2,21)=39.28 p<0.0001). Group activity counts were binned over 10 s periods, averaged across biological replicates of 10 flies each (n = 8) and plotted against time. Lines depict mean +/- standard error. (I) One video was selected at random of each genotype and processed using FlyTracker to calculate the average pathlength (F(2,29)=33.39, p<0.0001), angular velocity (F(2,29)=51.87, p<0.0001) and velocity (F(2,29)=30.97, p<0.0001) of individual flies. Box plots with overlaid raw data were generated using RStudio. Each dot is a single fly. One-way ANOVA with Tukey Posthoc was used to compare mean and variance. ***p<0.0001.
Figure 7—figure supplement 1
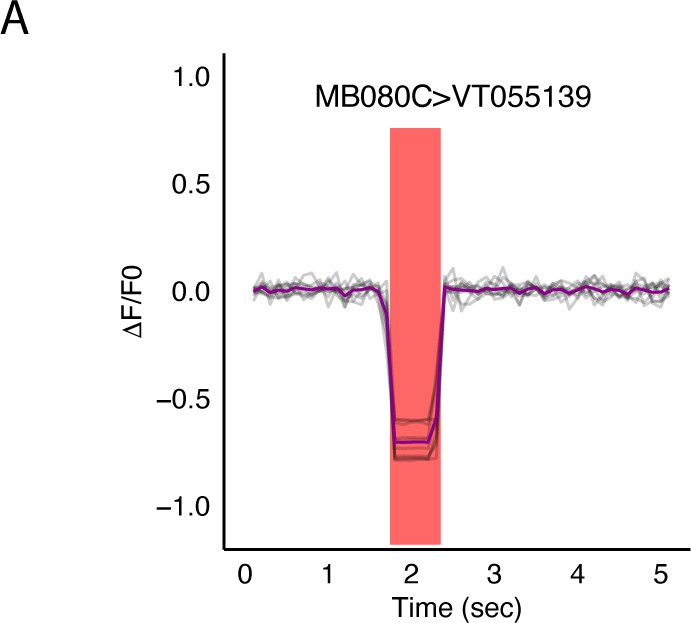
Optogenetic activation of MBON α2sc (MB080C) does not result in changes in signal recorded from of LAL neurons in SMP (VT015539).
Figure 7—figure supplement 2
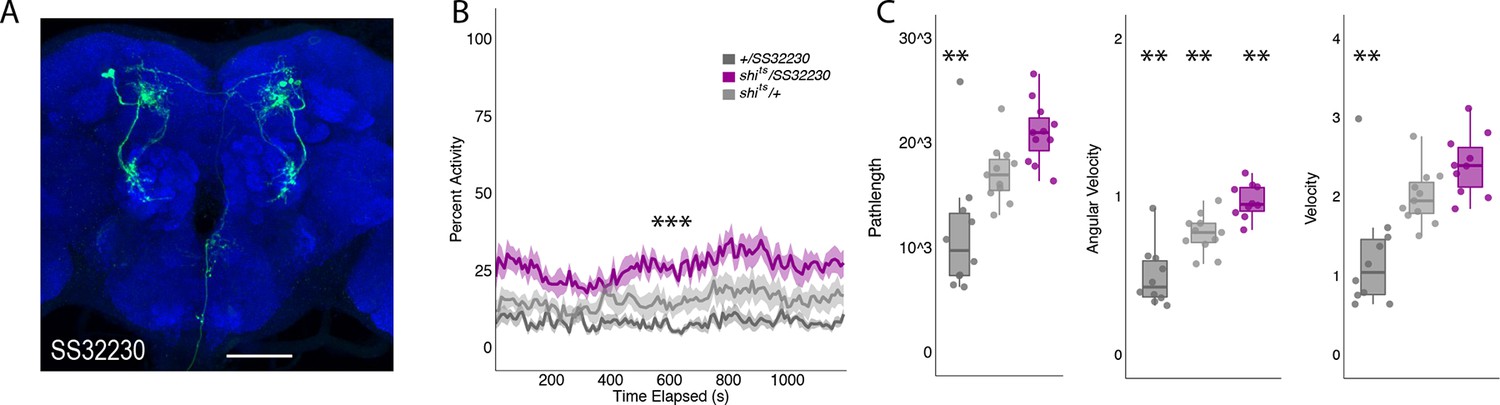
Inactivation of LAL using split-GAL4 SS32230 results in significant increases in group activity.
(A) Max-stack of SS32230; green, GFP expression; blue, neuropil. Scale bar = 50 μm. (B) shits inactivation of LAL using split-GAL4 SS32230 resulted in significant increases in group activity (F(2,21)=13.94 p<0.0001). Group activity counts were binned over 10s periods, averaged across biological replicates of 10 flies each (n = 8) and plotted against time. Lines depict mean ± standard error. (C) One video was selected at random of each genotype and processed using FlyTracker to calculate the average pathlength (F(2,28)=14.76, p<0.0001), angular velocity (F(2,28)=28.16, p<0.0001), and velocity (F(2,28)=13.96, p<0.0001) of individual flies. Box plots with overlaid raw data were generated using RStudio. Each dot is a single fly. One-way ANOVA with Tukey Posthoc was used to compare mean and variance. ***p<0.0001, **p<0.001.
Figure 7—figure supplement 3
Group activity of split-GAL4 SS32219 and SS32230 at permission temperatures.
Group activity of experimental groups were not significantly different from both genetic control groups. (A) Average group activity was significantly different at permissive temperatures for split-GAL4 line SS32219 (F(2,21)=4.617, p=0.02) although Tukey Post-hoc analysis revealed that shits/SS32219 was not significantly different from either genetic control (SS32219/+ vs shits/SS32219, p=0.08, shits/+ vs shits/SS32219, p=0.82). Instead, shits/+ was significantly different from SS32219/+ (p=0.02). (B) Average group activity was significantly different at permissive temperatures for split-GAL4 line SS32230 (F(2,21)=6.195, p=0.0078) although Tukey Post-hoc analysis revealed that shits/SS32230 was not significantly different from both genetic controls (SS32230/+ vs shits/ SS32230, p=0.97, shits/+ vs shits/ SS32230, p=0.013). Instead, SS32230/+ was significantly different from both shits/ SS32230 (p=0.013) and shits/+ (p=0.02).
Figure 8
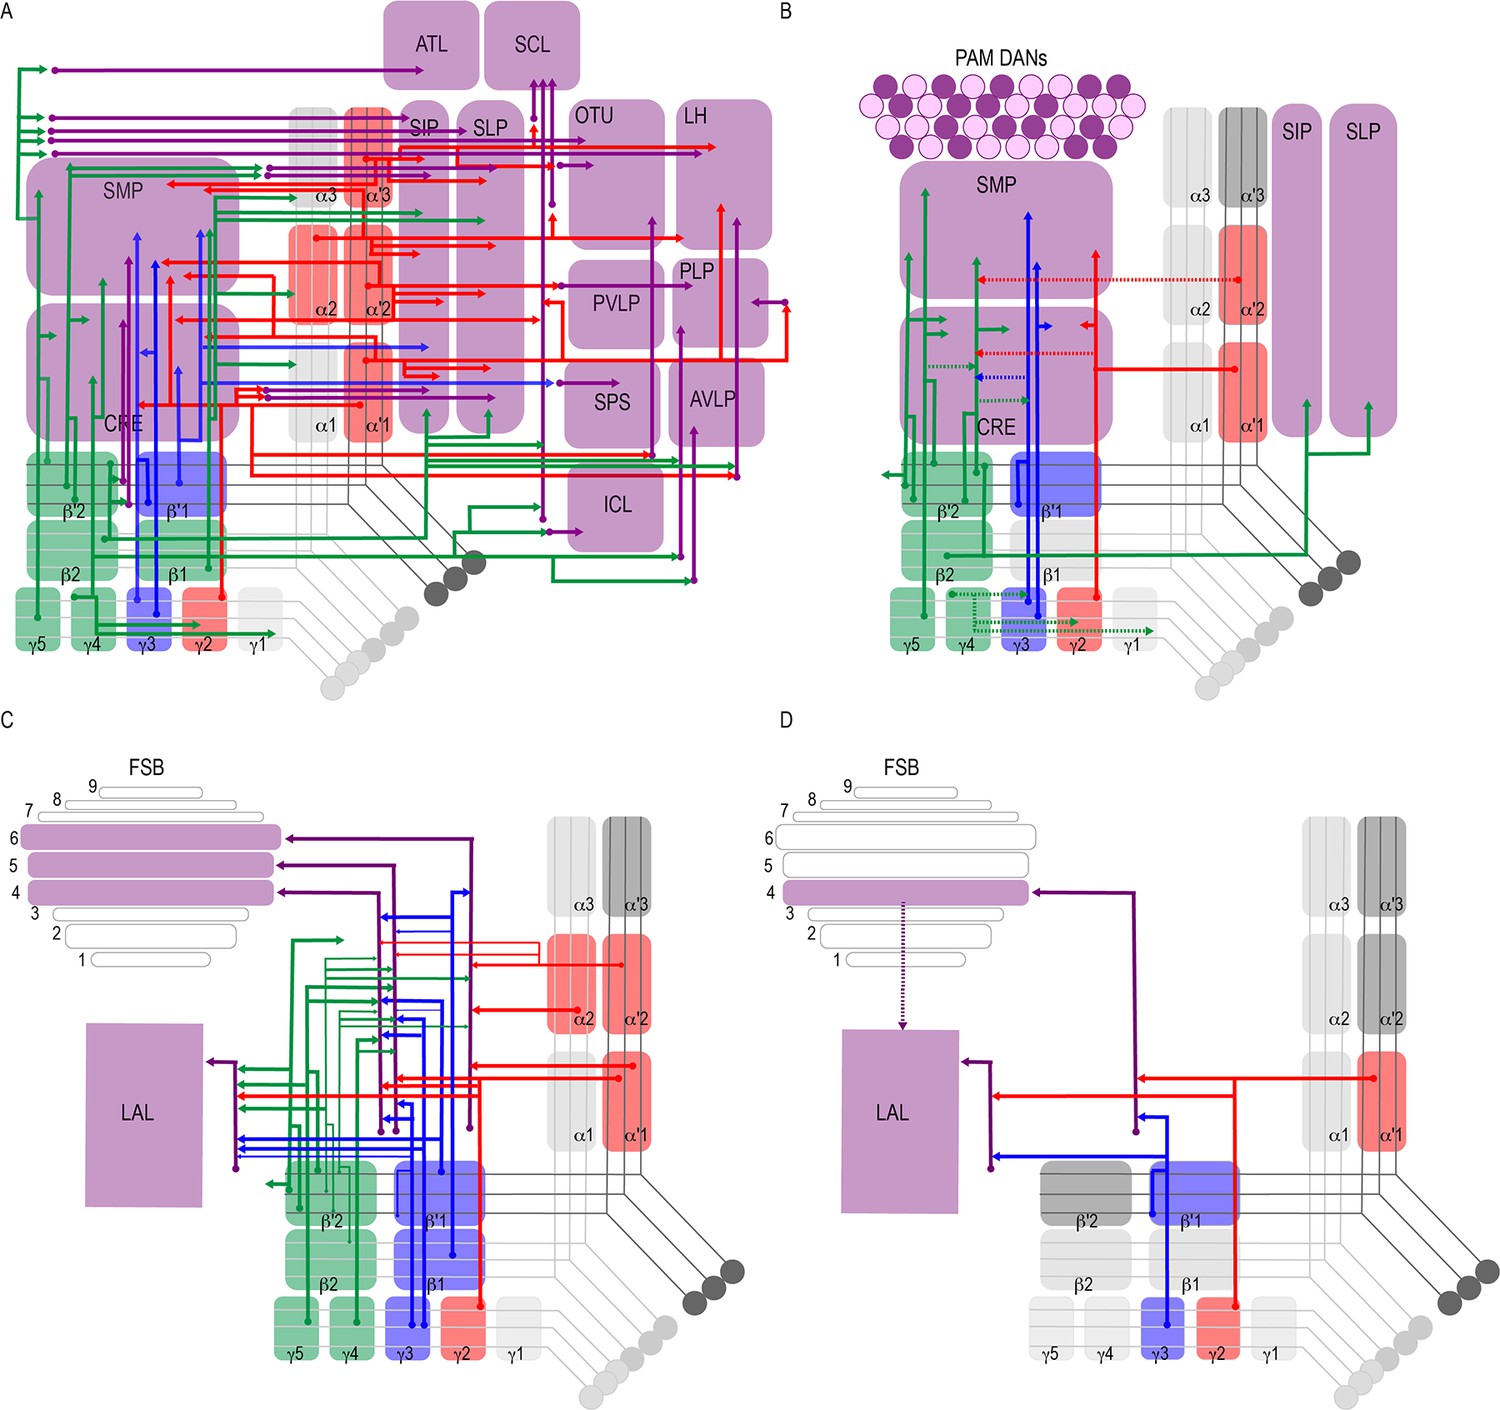
Summary schematics highlighting postsynaptic connections of MBON innervating (A) innervating the protocerebrum (B) PAM DANs (solid lines) and MBONs (dotted lines).
(C) FSB and LAL. Lines thickness corresponds to the percentage of trans-Tango-positive signal in FSB and LAL across brains for each MBON. (D) Schematic highlighting convergence of MBONs γ3β′1 and γ2α′1 onto the same genetically identified subsets of LAL and FSB neurons (solid lines). Dotted lines depict the established connections between the FSB and LAL (Wolff and Strausfeld, 2015b).
Tables
Key resources table
| Reagent type (species) or resource | Designation | Source or reference | Identifiers | Additional information |
|---|---|---|---|---|
| Genetic reagent (D. melanogaster) | y[1]w[*] | Pfeiffer et al., 2008 | ||
| Genetic reagent (D. melanogaster) | UAS-shibirets1 | Pfeiffer et al., 2012 | FLYB: FBst0066600; RRID:BDSC_66600 | |
| Genetic reagent (D. melanogaster) | LexAop-GCaMP6s, UAS-Chrimson | Allan Wong (Janelia Research Campus) | N/A | 13xLexAop2-Syn21-opGCaMP6s in su(Hw)attP8, 10xUAS-Syn21-Chrimson88-tdTomato-3.1 in attP18 |
| Genetic reagent (D. melanogaster) | trans-Tango | Talay et al., 2017 | FLYB: FBst0077124; RRID:BDSC_ 77124 | trans-Tango in attP40 |
| Genetic reagent (D. melanogaster) | UAS-myrGFP, QUAS-mtdTomato | Talay et al., 2017 | FLYB: FBst0077479; RRID:BDSC_77479 | 10xUAS-myrGFP, 5xQUAS-mtdTomato(3xHA) in su(Hw)attP8 |
| Genetic reagent (D. melanogaster) | UAS-CD2, QUAS-mtdTomato | This study | N/A | 10xUAS-CD2, 5xQUAS-mtdTomato(3xHA) in su(Hw)attP8 |
| Genetic reagent (D. melanogaster) | brp-SNAP | Kohl et al., 2014 | FLYB: FBst0058397; RRID:BDSC_ 58397 | brp[SNAPf-tag]/Cyo |
| Genetic reagent (D. melanogaster) | LexAop-GFP | Pfeiffer et al., 2010 | FLYB: FBst0032203; RRID:BDSC_32203 | 13XLexAop2-mCD8::GFP in attP2 |
| Genetic reagent (D. melanogaster) | MB002B-split-GAL4 | Aso et al., 2014a | FlyLight Robot ID: 2135053 RRID:BDSC_68305 | MBON β′2mp (4), γ5β′2a (2) |
| Genetic reagent (D. melanogaster) | MB011B-split-GAL4 | Aso et al., 2014a | FlyLight Robot ID: 2135062 RRID:BDSC_68294 | MBON γ5β′2a (4), β′2mp (3), β′2mp_bilateral (3) |
| Genetic reagent (D. melanogaster) | MB018B-split-GAL4 | Aso et al., 2014a | FlyLight Robot ID: 2135069 RRID:BDSC_68296 | MBON α′2 (4) |
| Genetic reagent (D. melanogaster) | MB026B-split-GAL4 | Aso et al., 2014a | FlyLight Robot ID: 2135077 RRID:BDSC_68300 | MBON α′1 (3), α′3ap (2) |
| Genetic reagent (D. melanogaster) | MB027B-split-GAL4 | Aso et al., 2014a | FlyLight Robot ID: 2135078 RRID:BDSC_68301 | MBON α′3ap (5), α′3 m (5) |
| Genetic reagent (D. melanogaster) | MB050B-split-GAL4 | Aso et al., 2014a | FlyLight Robot ID: 2135100 RRID:BDSC_68365 | MBON α′1 (2), α2sc (4) |
| Genetic reagent (D. melanogaster) | MB051B-split-GAL4 | Aso et al., 2014a | FlyLight Robot ID: 2135101 RRID:BDSC_68275 | MBON α′2 (1), γ2α′1 (4) |
| Genetic reagent (D. melanogaster) | MB051C-split-GAL4 | Aso et al., 2014a | FlyLight Robot ID: 2135136 RRID:BDSC_68249 | MBON α′2 (1), γ2α′1 (3) |
| Genetic reagent (D. melanogaster) | MB057B-split-GAL4 | Aso et al., 2014a | FlyLight Robot ID: 2135106 RRID:BDSC_68277 | MBON β′1 (3) |
| Genetic reagent (D. melanogaster) | MB074C-split-GAL4 | Aso et al., 2014a | FlyLight Robot ID: 2135122 RRID:BDSC_68282 | MBON β′2mp (4), β2β′2a (3), γ5β′2a (1) |
| Genetic reagent (D. melanogaster) | MB077B- split-GAL4 | Aso et al., 2014a | RRID:BDSC_68283 | MBON γ2α′1 (4) |
| Genetic reagent (D. melanogaster) | MB077C- split-GAL4 | Aso et al., 2014a | FlyLight Robot ID: 2135125 RRID:BDSC_68284 | MBON γ2α′1 (3) |
| Genetic reagent (D. melanogaster) | MB080C- split-GAL4 | Aso et al., 2014a | FlyLight Robot ID: 2135128 RRID:BDSC_68285 | MBON α2sc (2) |
| Genetic reagent (D. melanogaster) | MB082C- split-GAL4 | Aso et al., 2014a | FlyLight Robot ID: 2135130 RRID:BDSC_68286 | MBON α′2 (3), α3 (5) |
| Genetic reagent (D. melanogaster) | MB083C- split-GAL4 | Aso et al., 2014a | FlyLight Robot ID: 2135131 RRID:BDSC_68287 | MBON γ3 (5), γ3β′1 (5) |
| Genetic reagent (D. melanogaster) | MB093C- split-GAL4 | Aso et al., 2014a | FlyLight Robot ID: 2135141 RRID:BDSC_68289 | MBON α′2 (4) |
| Genetic reagent (D. melanogaster) | MB110C-split-GAL4 | Aso et al., 2014a | FlyLight Robot ID: 2135158 RRID:BDSC_68262 | MBON γ3 (5), γ3β′1 (5) |
| Genetic reagent (D. melanogaster) | MB210B-split-GAL4 | Aso et al., 2014a | FlyLight Robot ID: 2135258 RRID:BDSC_68272 | MBON γ5β′2a (1), β′2mp (4), β2β′2a (3) |
| Genetic reagent (D. melanogaster) | MB298B-split-GAL4 | Aso et al., 2014a | FlyLight Robot ID: 2135346 RRID:BDSC_68309 | MBON γ4>γ1γ2 (4) |
| Genetic reagent (D. melanogaster) | MB310C-split-GAL4 | Aso et al., 2014a | FlyLight Robot ID: 2135358 RRID:BDSC_68313 | MBON α1 (5) |
| Genetic reagent (D. melanogaster) | MB399B-split-GAL4 | Aso et al., 2014a | FlyLight Robot ID: 2501738 RRID:BDSC_68369 | MBON β2β′2a (2) |
| Genetic reagent (D. melanogaster) | MB433B-split-GAL4 | Aso et al., 2014a | FlyLight Robot ID: 2501774 RRID:BDSC_68324 | MBON β1>α (3), γ4>γ1γ2 (4) |
| Genetic reagent (D. melanogaster) | MB434B-split-GAL4 | Aso et al., 2014a | FlyLight Robot ID: 2501775 RRID:BDSC_68325 | MBON β1>α (4), γ4>γ1γ2 (4) |
| Genetic reagent (D. melanogaster) | MB542B-split-GAL4 | Aso et al., 2014a | FlyLight Robot ID: 2501887 RRID:BDSC_68372 | MBON α′1 (1), α′3 m (2), α2p3p (2) |
| Genetic reagent (D. melanogaster) | GMR47H09-LexA | Pfeiffer et al., 2013 | FLY: FBtp0088666 RRID:BDSC_53482 | |
| Genetic reagent (D. melanogaster) | VT055139-LexA | Tirian and Dickson, 2017 | N/A | |
| Genetic reagent (D. melanogaster) | VT018476-lexA | Bidaye et al., 2014 | N/A | |
| Genetic reagent (D. melanogaster) | SS01308-split GAL4 | Janelia Research Campus | N/A | MBON γ5β′2a |
| Genetic reagent (D. melanogaster) | SS01143-split GAL4 | Janelia Research Campus | N/A | MBON β′2mp |
| Genetic reagent (D. melanogaster) | SS1194-split GAL4 | Janelia Research Campus | N/A | MBON α2sc |
| Genetic reagent (D. melanogaster) | SS32219-split GAL4 | Janelia Research Campus | N/A | Lateral Accessory Lobe |
| Genetic reagent (D. melanogaster) | SS32230-split GAL4 | Janelia Research Campus | N/A | Lateral Accessory Lobe |
| Antibody | α-GFP (Rabbit polyclonal) | Life Tech | Cat #A11122 RRID:AB_221569 | (1:1000) |
| Antibody | α-HA (Rat monoclonal) | Roche | Cat #11867423001 RRID:AB_390918 | (1:100) |
| Antibody | α-GFP (Chicken polyclonal) | Clontech | Cat #ab13970 RRID:AB_300798 | (1:2000) |
| Antibody | α-DS (Rabbit monoclonal) | Clontech | Cat #632496 RRID:AB_10013483 | (1:1000) |
| Antibody | α-CD2 (Mouse monoclonal) | Bio-Rad | Cat #MCA154GA RRID:AB_566608 | (1:100) |
| Antibody | α-TH (Mouse monoclonal) | Immunostar | Cat #22941 RRID:AB_572268 | (1:500) |
| Antibody | Goat α-Mouse AF647 (polyclonal) | Thermo Fisher | Cat #A21235 RRID:AB_2535804 | (1:1000) |
| Antibody | Goat α-Rabbit AF488 (polyclonal) | Life Tech | Cat #A11034 RRID:AB_2576217 | (1:400) |
| Antibody | Goat α-Rat AF568 (polyclonal) | Life Tech | Cat #A11077 RRID:AB_2534121 | (1:400) |
| Antibody | Goat α-Chicken AF488 (polyclonal) | Life Tech | Cat #A11039 RRID:AB_2534096 | (1:400) |
| Antibody | Goat α-Rabbit AF568 (polyclonal) | Life Tech | Cat #A11011 RRID:AB_143157 | (1:400) |
| Software | Adobe Illustrator CC | Adobe | RRID:SCR_014199 | |
| Software | ZEN | Carl Zeiss Microscopy | Version 2.1 (blue edition) RRID:SCR_013672 | |
| Software | Fiji | http://fiji.sc | RRID:SCR_002285 |
Additional files
-
Supplementary file 1
Statistical analysis summary.
- https://cdn.elifesciences.org/articles/63379/elife-63379-supp1-v1.docx
-
Transparent reporting form
- https://cdn.elifesciences.org/articles/63379/elife-63379-transrepform-v1.pdf
Download links
A two-part list of links to download the article, or parts of the article, in various formats.
Downloads (link to download the article as PDF)
Open citations (links to open the citations from this article in various online reference manager services)
Cite this article (links to download the citations from this article in formats compatible with various reference manager tools)
Transsynaptic mapping of Drosophila mushroom body output neurons
eLife 10:e63379.
https://doi.org/10.7554/eLife.63379


