Development of antibody-dependent cell cytotoxicity function in HIV-1 antibodies
- Human Biology Division, Fred Hutchinson Cancer Research Center, United States
- Public Health Sciences Division, Fred Hutchinson Cancer Research Center, United States
- Medical Scientist Training Program, University of Washington School of Medicine, United States
- Molecular and Cellular Biology Graduate Program, University of Washington and Fred Hutchinson Cancer Research Center, United States
- Department of Statistics, University of Washington, United States
- Department of Medicinal Chemistry, University of Washington, United States
- Department of Medicinal Microbiology, University of Nairobi, Kenya
- Coast Provincial General Hospital, Women’s Health Project, Kenya
Figures
Figure 1
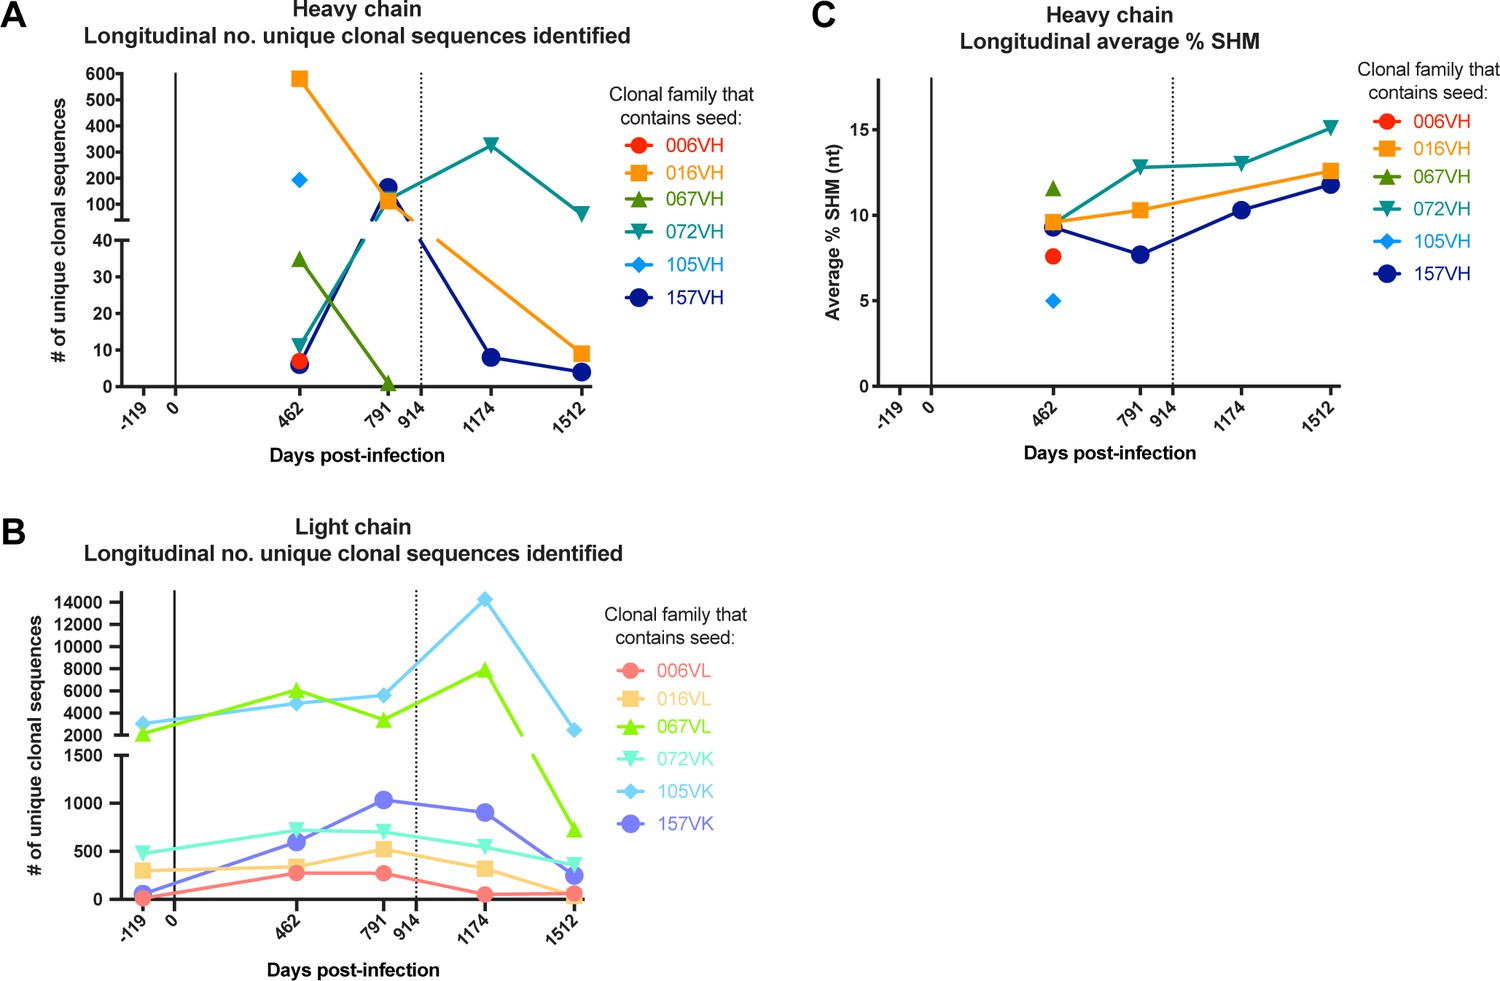
Longitudinal characteristics of heavy and light chain clonal families.
(A, B) Number of clonal heavy (A) and light (B) chain sequences identified per sequenced timepoint per lineage. Caveats relating to light chain clusters are described in Methods. (C) Average variable region mutation for each clonal heavy chain family per timepoint. Dashed line at D914 indicates the timepoint of isolation of mature antibodies (Williams et al., 2015; Williams et al., 2019). SHM: somatic hypermutation.
Figure 2 with 1 supplement
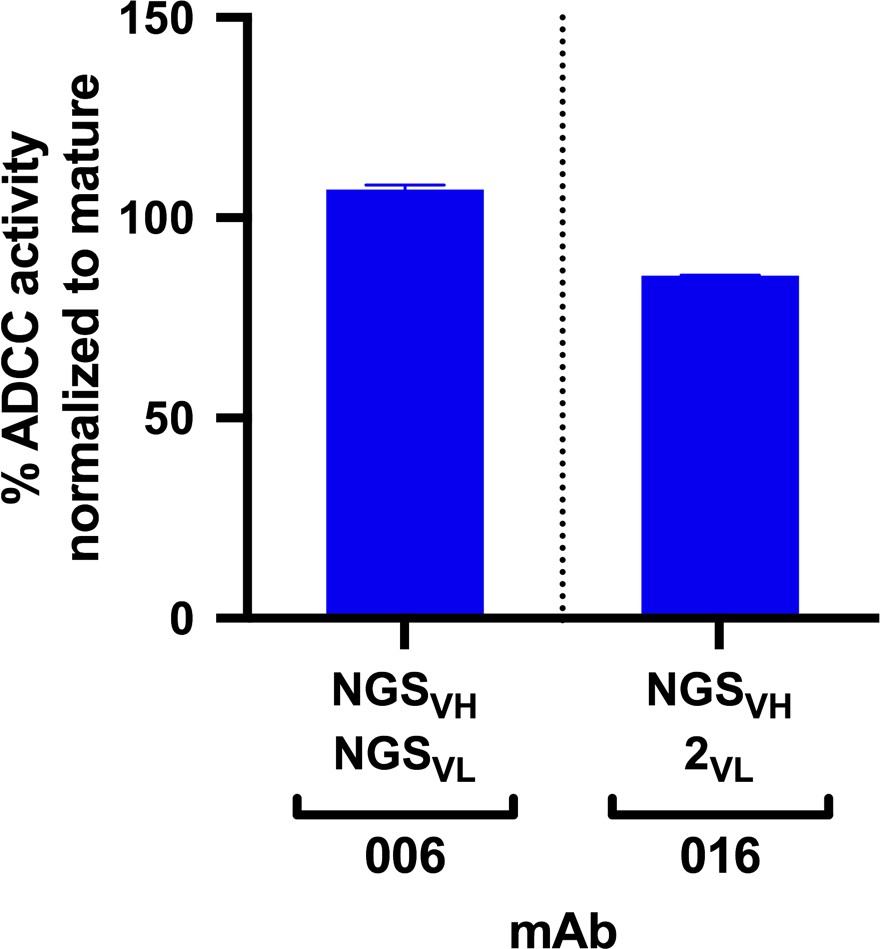
ADCC activity in antibodies made from NGS-sampled sequences.
RFADCC activity of antibodies that use NGS-sampled heavy chains that are most similar in sequence to the mature 006 or 016 antibodies. The 006-NGSVH was paired with an NGS-sampled light chain; the 016-NGSVH was paired with a computationally-inferred mature-like sequence 016-2VL. mAb pairings and their mutations are illustrated in Figure 2—figure supplement 1, with sequences available in Supplementary file 1. Data reflect two independent experiments. Source data is available in Figure 2—source data 1.
-
Figure 2—source data 1
Source data (both replicates) for RFADCC assessment of NGS mAbs, processed as detailed in Materials and methods.
- https://cdn.elifesciences.org/articles/63444/elife-63444-fig2-data1-v2.csv
Figure 2—figure supplement 1
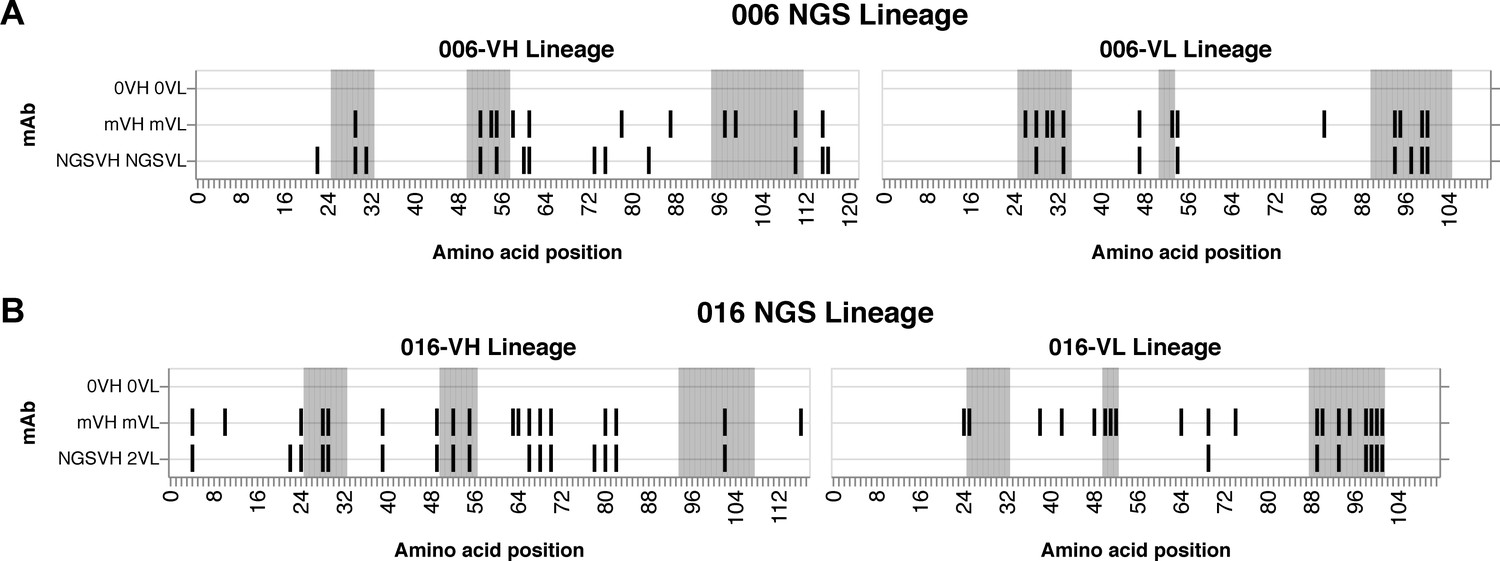
Graphic summaries of antibodies comprised of paired VH and VL NGS-sampled sequences.
Graphic summaries of paired VH and VL antibody sequences for 006 (A) and 016 (B) lineages relative to inferred naive (0) sequences. Shaded regions demarcate CDRs (gray). Vertical black lines indicate variable region amino acid substitutions. m: mature.
Figure 3 with 1 supplement
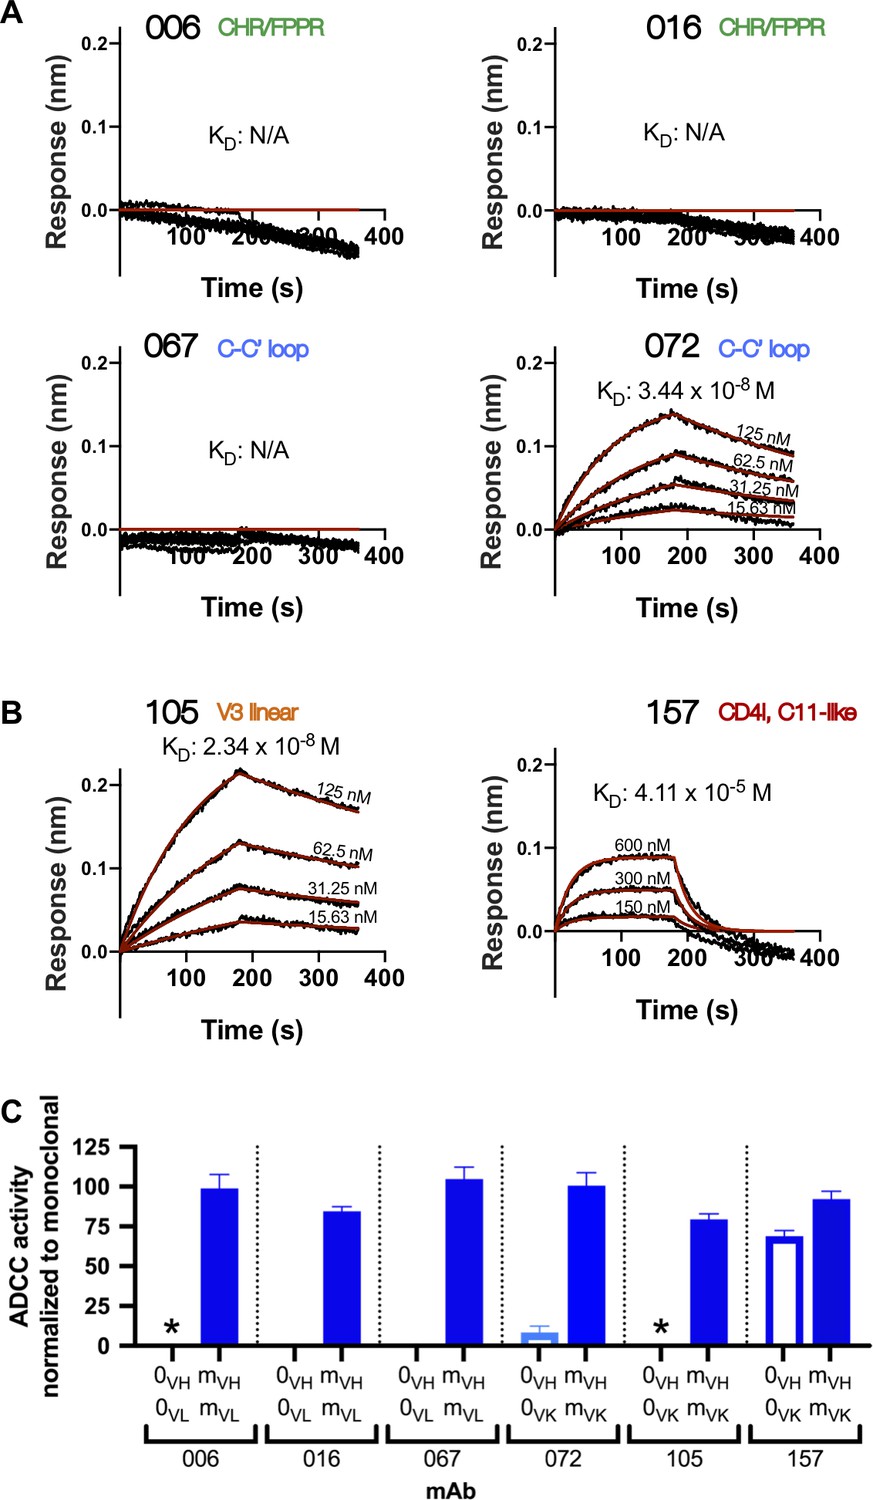
Inferred naïve mAbs from six lineages vary in antigen binding capability and ADCC function.
(A–B) Binding kinetics of the inferred naive antibody (ligand) from each lineage to indicated concentrations of monomeric C.ZA.1197MB gp41 ectodomain (A) or BL035.W6M.C1 gp120 (B) (analyte). Best fitting lines (red) to a 1:1 binding model of ligand:analyte binding are shown. Data are representative of two independent experiments. (C) Positive control-normalized RFADCC activity of inferred naive antibodies compared to their respective mature antibodies. Normalization is described in Methods. Asterisks indicate indeterminate activity, as defined in Methods. Data are represented as mean ± SEM and reflect at least five independent experiments; source data are available in Figure 3—source data 1. 0: naive; m: mature. See Figure 3—figure supplement 1 for functional assessment of alternative naïve mAbs.
-
Figure 3—source data 1
Source data (all replicates) for RFADCC assessment of inferred naive mAbs (Figure 3C), processed as detailed in Materials and methods.
- https://cdn.elifesciences.org/articles/63444/elife-63444-fig3-data1-v2.csv
Figure 3—figure supplement 1
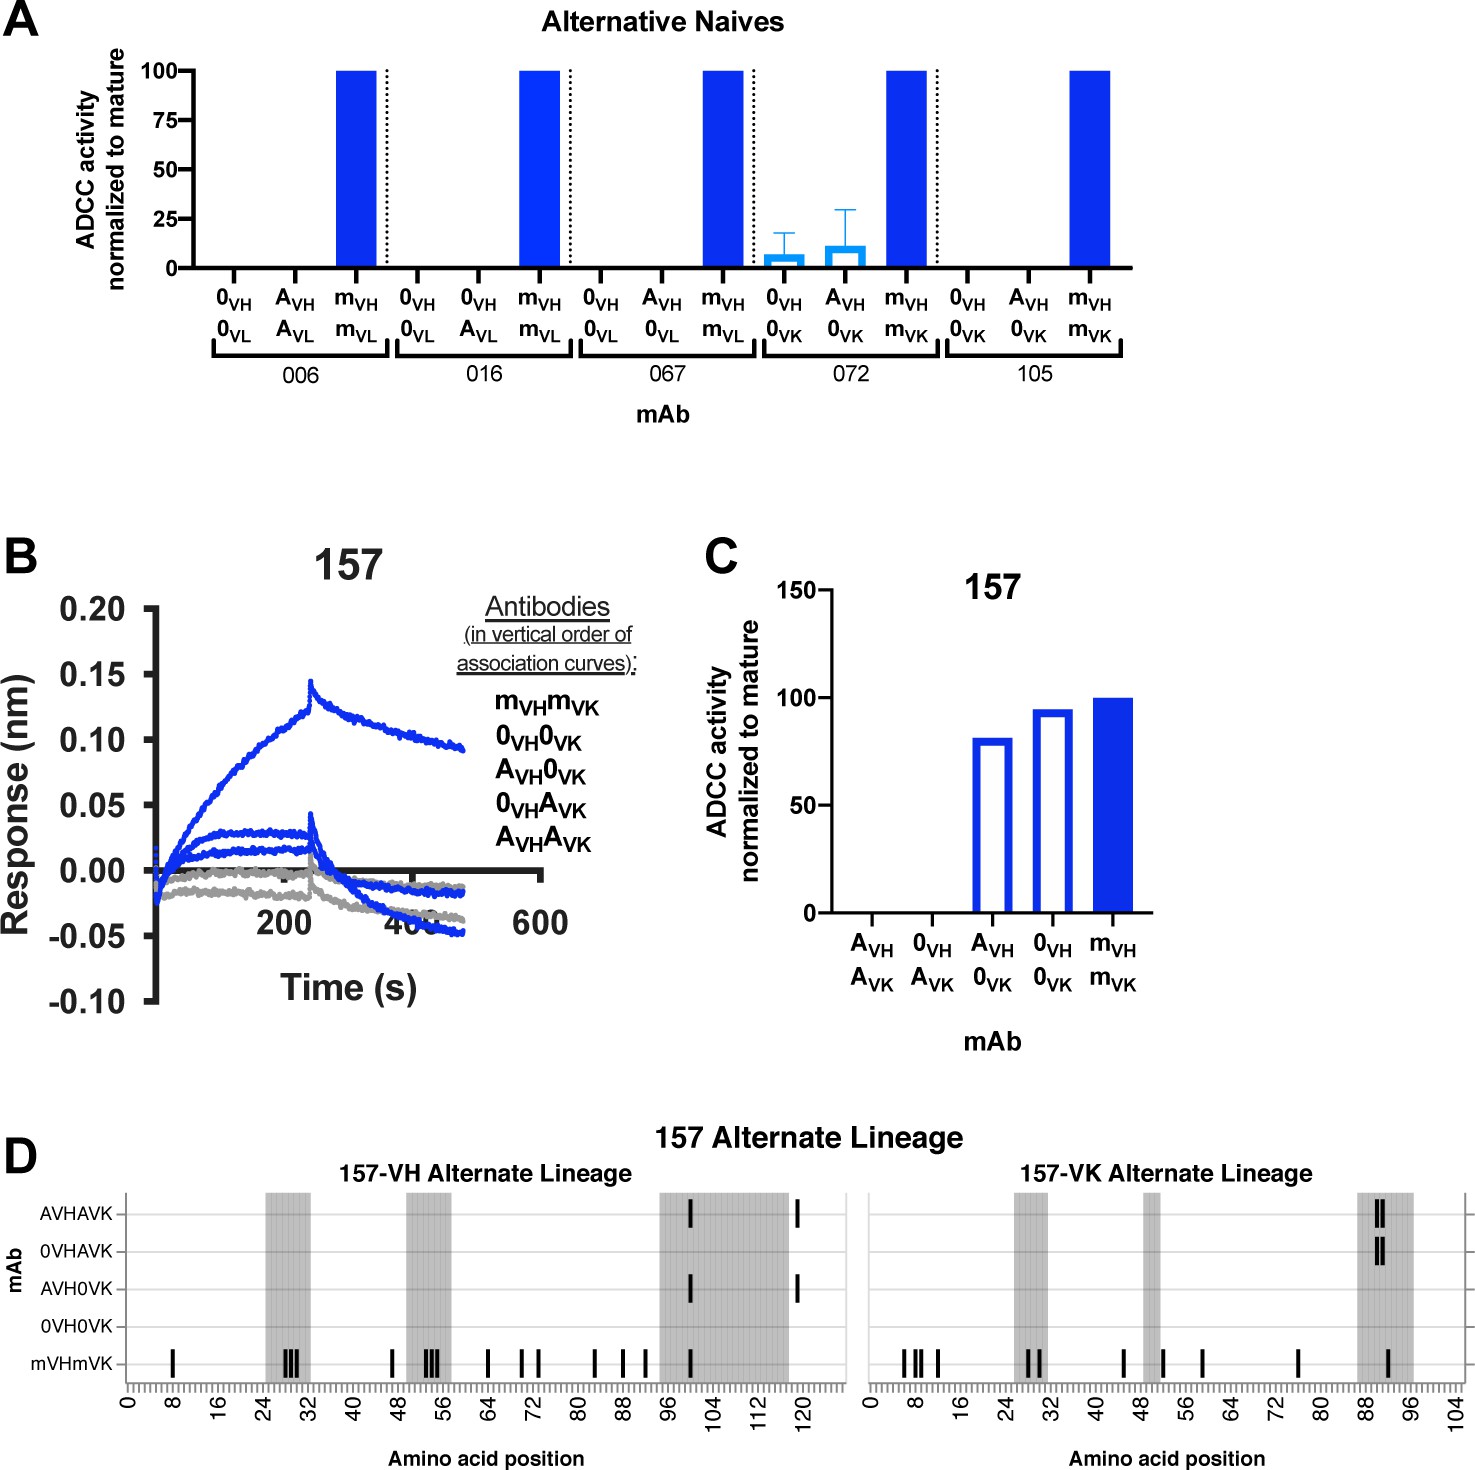
Alternative naive mAb functionality.
(A, C) Functional RFADCC comparisons of each lineage’s ‘original’ (0VH and 0VL) and ‘alternative’ (AVH and AVL) inferred naive antibodies. In cases where the alternative approach did not infer a naive sequence that differed from the original naive sequence identified by partis, alternative chains were paired with original chains, as indicated. For the 157 lineage (C), original and alternative heavy and light chains were also cross-paired. Data are representative of at least two independent experiments. (B) Binding of indicated 157-lineage naive antibodies (ligand) to monomeric BL035 gp120 (analyte, 250 nM), measured by BLI without the ‘double reference’ approach described in Materials and methods. (D) Graphic summary of paired VH and VL antibody sequences relative to inferred naïve 157-0VH0VK. Shaded regions demarcate CDRs (gray). Vertical black lines indicate variable region amino acid substitutions. 0: original naive; A: alternative naive; m: mature.
Figure 4 with 3 supplements

Example of most probable routes of antibody maturation: 105 light chain.
Ancestral sequences (internal nodes within phylogenies) and their relative confidences were summarized for the 105 antibody light (kappa) chain from Bayesian clonal family phylogenies sampled from the associated posterior distribution for the 105-light clonal family of sampled NGS sequences. Results are displayed in this graphic illustrating multiple possible lineages of amino acid transitions and their relative confidences for 105 light chain development. Amino acid substitutions (arrows) connect the inferred naive sequence (white node, top) to the mature sequence (white node, bottom) via reconstructed ancestral intermediate sequences (red-shaded nodes). The red shading of nodes is proportional to the posterior probability that this ancestral sequence was present in the lineage. Low probability nodes were filtered out, resulting in some incomplete pathways within the graphics. For a given node, the blue shadings of multiple arrows arising from that node is proportional to the corresponding transition probability from that node to downstream nodes. Stars denote inferred sequences that were identical in nucleotide (green) or amino acid (yellow) sequence to sampled NGS sequences. ‘MID’ (red) denotes middle intermediate sequence. Labels with cyan highlighting denote sequences that were used in functionality assays (see also Supplementary file 1). See Figure 4—figure supplements 1–3 for probable maturation graphics for all 12 antibody chains of interest.
Figure 4—figure supplement 1

Most probable routes of antibody lineage maturation for lineages 006 and 016.
Ancestral sequences (internal nodes within phylogenies) and their relative confidences were summarized for each antibody chain from Bayesian clonal family phylogenies sampled from associated posterior distributions for each relevant clonal family of sampled NGS sequences. Results are displayed in these graphics illustrating multiple possible lineages of amino acid transitions and their relative confidences for heavy- and light-chain development. Amino acid substitutions (arrows) connect the inferred naive sequence (white node, top) to the mature sequence (white node, bottom) via reconstructed ancestral intermediate sequences (red-shaded nodes). The red shading of nodes is proportional to the posterior probability that this ancestral sequence was present in the lineage. Low-probability nodes were filtered out, resulting in some incomplete pathways within the graphics. For a given node, the blue shadings of multiple arrows arising from that node is proportional to the corresponding transition probability from that node to downstream nodes. Transient mutations are labeled in gray instead of black. Stars denote inferred sequences that were identical in nucleotide (green) or amino acid (yellow) sequence to sampled NGS sequences. ‘MID’ (red) denotes middle intermediate sequence. Labels with cyan highlighting denote sequences that were used in functionality assays (see also Supplementary file 1). For readers’ convenience, we included cyan labels for inferred ‘alternative’ naive sequences if they matched an existing inferred lineage member.
Figure 4—figure supplement 2
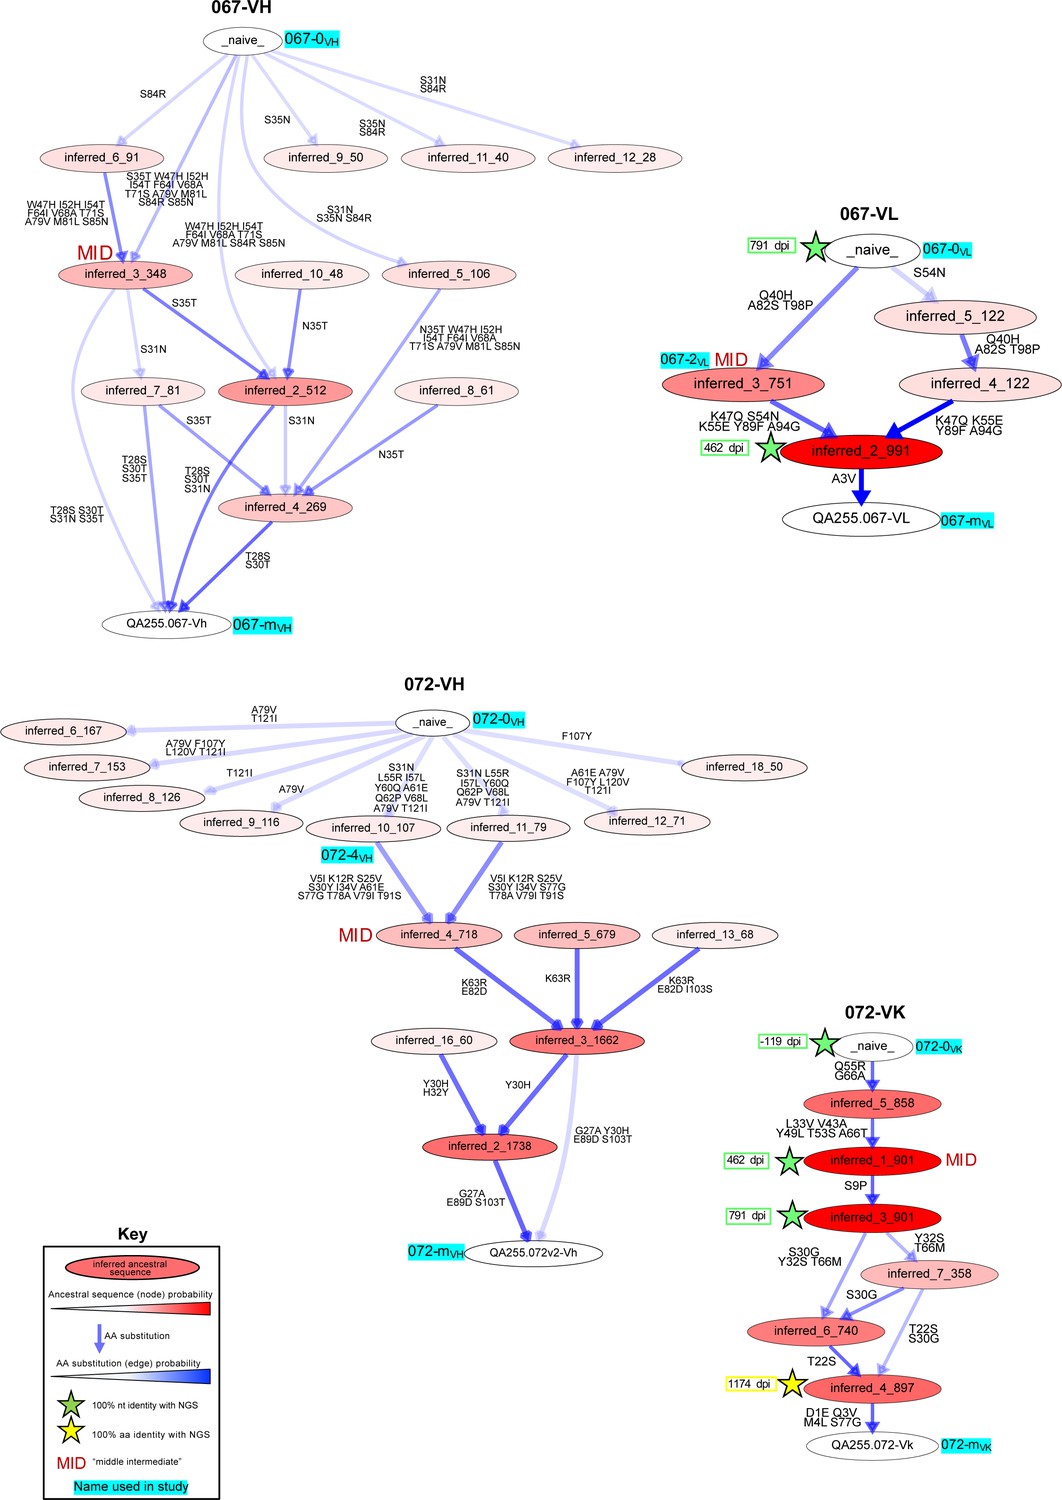
Most probable routes of antibody lineage maturation for lineages 067 and 072.
Ancestral sequences (internal nodes within phylogenies) and their relative confidences were summarized for each antibody chain from Bayesian clonal family phylogenies sampled from associated posterior distributions for each relevant clonal family of sampled NGS sequences. Results are displayed in these graphics illustrating multiple possible lineages of amino acid transitions and their relative confidences for heavy- and light-chain development. Amino acid substitutions (arrows) connect the inferred naive sequence (white node, top) to the mature sequence (white node, bottom) via reconstructed ancestral intermediate sequences (red-shaded nodes). The red shading of nodes is proportional to the posterior probability that this ancestral sequence was present in the lineage. Low-probability nodes were filtered out, resulting in some incomplete pathways within the graphics. For a given node, the blue shadings of multiple arrows arising from that node is proportional to the corresponding transition probability from that node to downstream nodes. Transient mutations are labeled in gray instead of black. Stars denote inferred sequences that were identical in nucleotide (green) or amino acid (yellow) sequence to sampled NGS sequences. ‘MID’ (red) denotes middle intermediate sequence. Labels with cyan highlighting denote sequences that were used in functionality assays (see also Supplementary file 1). For readers’ convenience, we included cyan labels for inferred ‘alternative’ naive sequences if they matched an existing inferred lineage member.
Figure 4—figure supplement 3

Most probable routes of antibody lineage maturation for lineages 105 and 157.
Ancestral sequences (internal nodes within phylogenies) and their relative confidences were summarized for each antibody chain from Bayesian clonal family phylogenies sampled from associated posterior distributions for each relevant clonal family of sampled NGS sequences. Results are displayed in these graphics illustrating multiple possible lineages of amino acid transitions and their relative confidences for heavy- and light-chain development. Amino acid substitutions (arrows) connect the inferred naive sequence (white node, top) to the mature sequence (white node, bottom) via reconstructed ancestral intermediate sequences (red-shaded nodes). The red shading of nodes is proportional to the posterior probability that this ancestral sequence was present in the lineage. Low-probability nodes were filtered out, resulting in some incomplete pathways within the graphics. For a given node, the blue shadings of multiple arrows arising from that node is proportional to the corresponding transition probability from that node to downstream nodes. Transient mutations are labeled in gray instead of black. Stars denote inferred sequences that were identical in nucleotide (green) or amino acid (yellow) sequence to sampled NGS sequences. ‘MID’ (red) denotes middle intermediate sequence. Labels with cyan highlighting denote sequences that were used in functionality assays (see also Supplementary file 1). For readers’ convenience, we included cyan labels for inferred ‘alternative’ naive sequences if they matched an existing inferred lineage member.
Figure 5

HIV specificity and ADCC development in gp41-targeted antibody lineages.
(Left) Mature-normalized RFADCC activity of antibody lineage members for lineages 006 (A), 016 (B), 067 (C), and 072 (D), colored by strength of functionality: no function or indeterminate (gray), low function (<50% of mature activity; light blue), high function (>50% of mature activity; dark blue). Intermediate sequences are numbered consecutively based on their position in the developmental pathway between naïve (0) and mature (m). Asterisks indicate indeterminate activity, as defined in Methods. Data are represented as mean ± SEM and reflect at least four independent experiments, including data presented in Figure 3 for naive and mature Abs to best account for assay variability and to compare intermediates directly to these antibodies. Source data for all replicates are available in Figure 5—source data 1. (Middle) Binding of lineage members (ligand) to monomeric C.ZA.1197MB gp41 ectodomain (analyte, 62.5 nM), measured by BLI. Data are representative of two independent experiments. Data are colored based on each antibody’s RFADCC functionality. (Right) mAb heavy and light chain pairings illustrating variable region amino acid substitutions with respect to the reference sequence at the top of each lineage: black lines indicate amino acid substitutions; gray shaded regions demarcate CDRs.
-
Figure 5—source data 1
Source data (all replicates) for RFADCC assessment of Ab lineages (Figures 5 and 6), processed as detailed in Methods.
Duplicate columns accommodate for instances when two replicates were run on the same day.
- https://cdn.elifesciences.org/articles/63444/elife-63444-fig5-data1-v2.csv
Figure 6 with 1 supplement
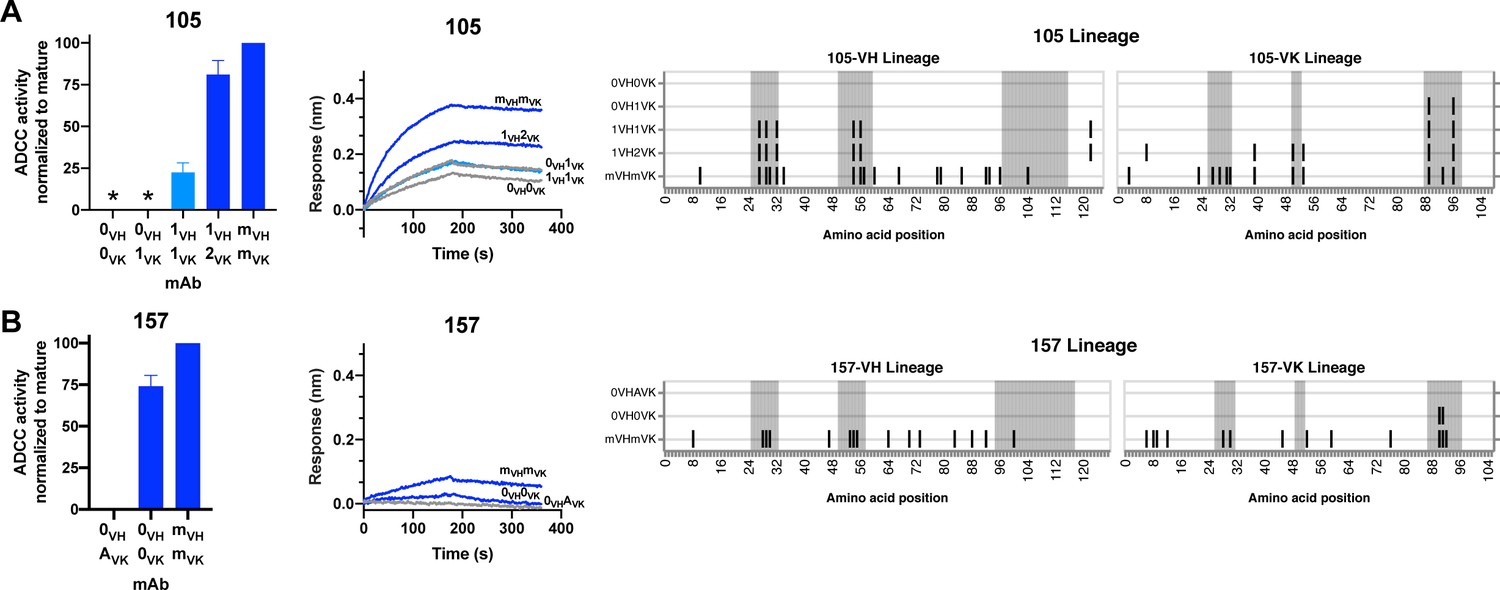
HIV specificity and ADCC development in gp120-targeted antibody lineages.
RFADCC activity (left), antigen binding to monomeric BL035.W6M.C1 (analyte, 62.5 nM) as measured by BLI (middle), and mAb heavy and light chain pairings (right) for the 105 and 157 lineages all displayed as in Figure 5. Asterisks indicate indeterminate activity, as defined in Methods. RFADCC data are represented as mean ± SEM and reflect at least four independent experiments, including data presented in Figure 3 for naïve and mature Abs to best account for assay variability. Source data for all replicates are available in Figure 5—source data 1. See also Figure 6—figure supplement 1 and Figure 6—source data 1 for RFADCC breadth data.
-
Figure 6—source data 1
Source data (all replicates) for RFADCC breadth assessment of Ab lineages 105 and 157.
Unlike the Maerials and methods section details for other RFADCC assays, data here are processed without normalization, just subtraction of background and negative-control signal from each sample’s activity.
- https://cdn.elifesciences.org/articles/63444/elife-63444-fig6-data1-v2.csv
Figure 6—figure supplement 1
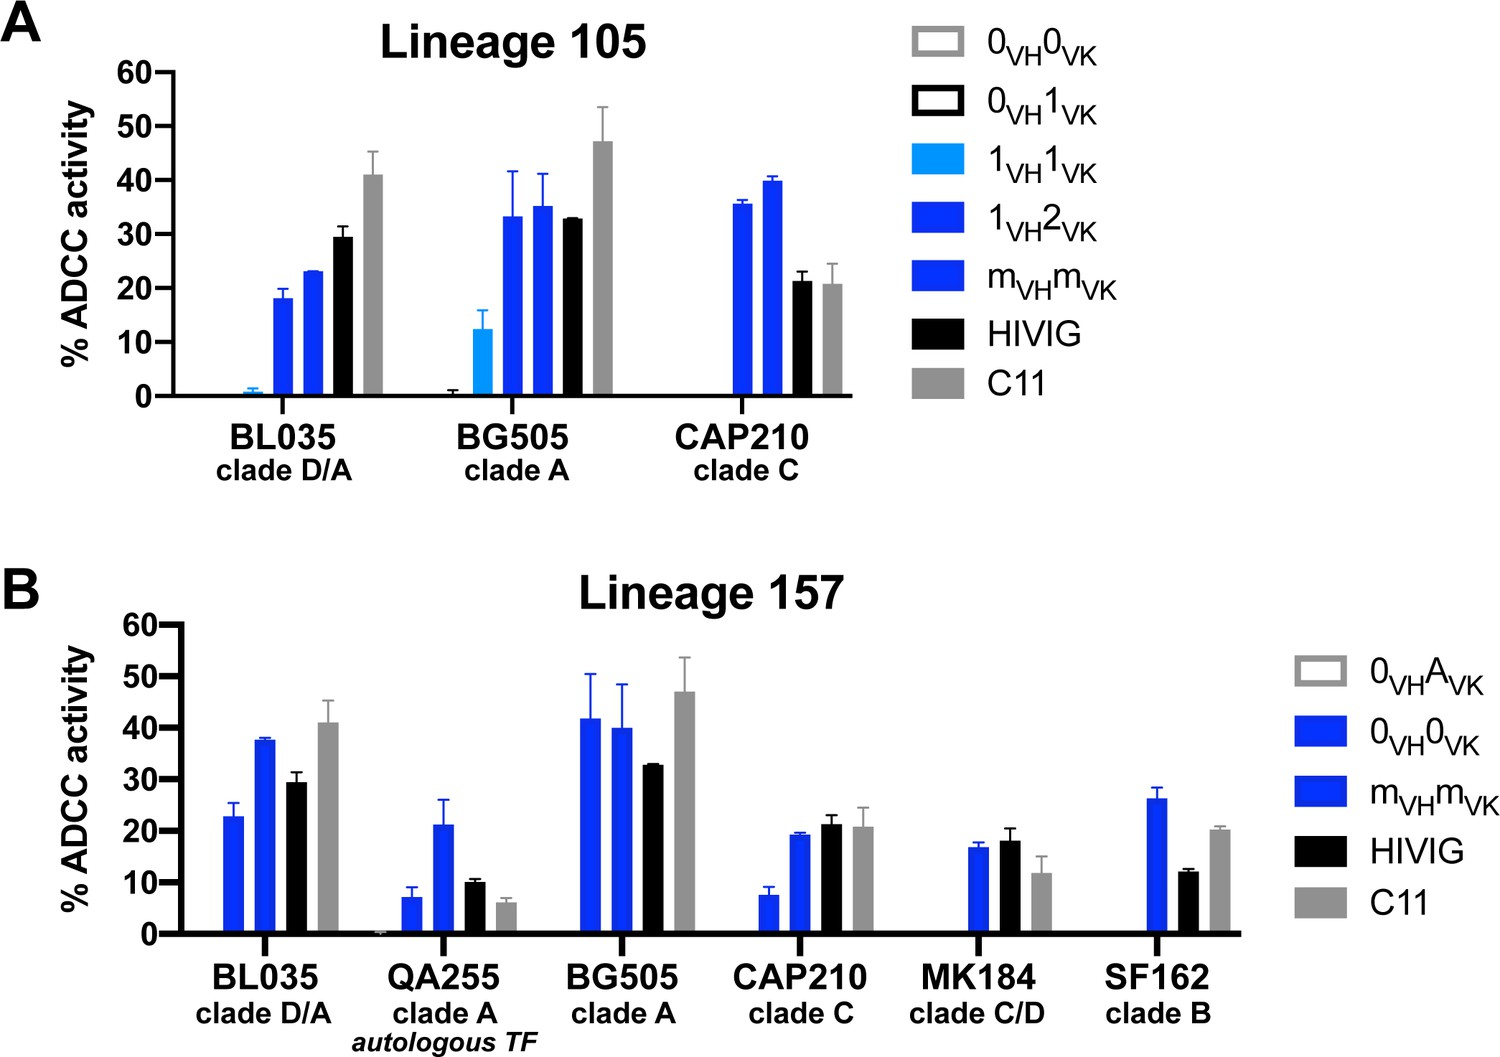
ADDC breadth displayed by 105 and 157 antibody lineages.
RFADCC activity of mAbs within lineages (A) 105 and (B) 157. HIVIG (pooled anti-HIV immunoglobulin) and C11 mAb (CD4i epitope-specific) were included as positive controls. Background and negative control (influenza-specific FI6v3 mAb) activities were subtracted from the data before averaging replicate experiments. For these breadth experiments, replicates were not excluded if FI6v3 signal was >10% of C11, since C11 had weak activity in some gp120 strains. Data are represented as mean ± SEM and reflect at least two independent experiments; source data are available in Figure 6—source data 1. Full names and accession numbers of HIV strains used for gp120 target proteins are listed in Materials and methods and Key Resources table 0: naive; m: mature.
Figure 7 with 1 supplement
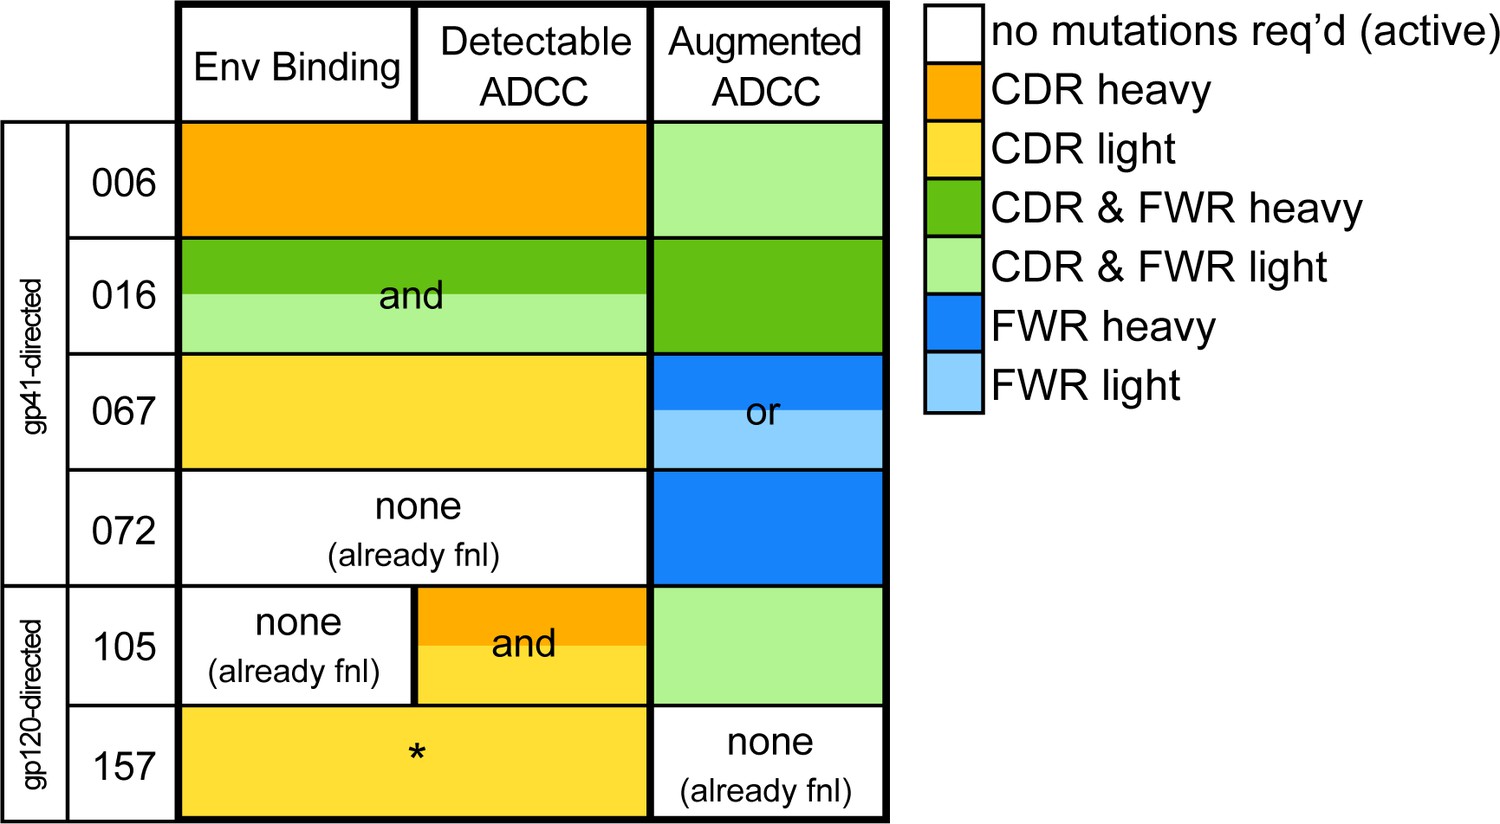
Locality of mutations required for gain of function.
Summary of the location of mutations critical for acquiring binding and activity functions in all five ADCC Ab lineages, respective to the previous step, that is building upon one another to gain functions. Lineages are summarized by row. Detectable ADCC function excludes lineage members with indeterminate ADCC activity, as defined in Materials and methods. Augmented ADCC activity indicates lineage members with activity most comparable to that of their respective mature. *157-0VHAVK required mutations for function while 157-0VH0VK did not; Env binding and detectable ADCC determinants were defined based on this comparison. fnl: functional. See Figure 7—figure supplement 1 for a more detailed summary graphic of key steps to attain function in all six lineages.
Figure 7—figure supplement 1
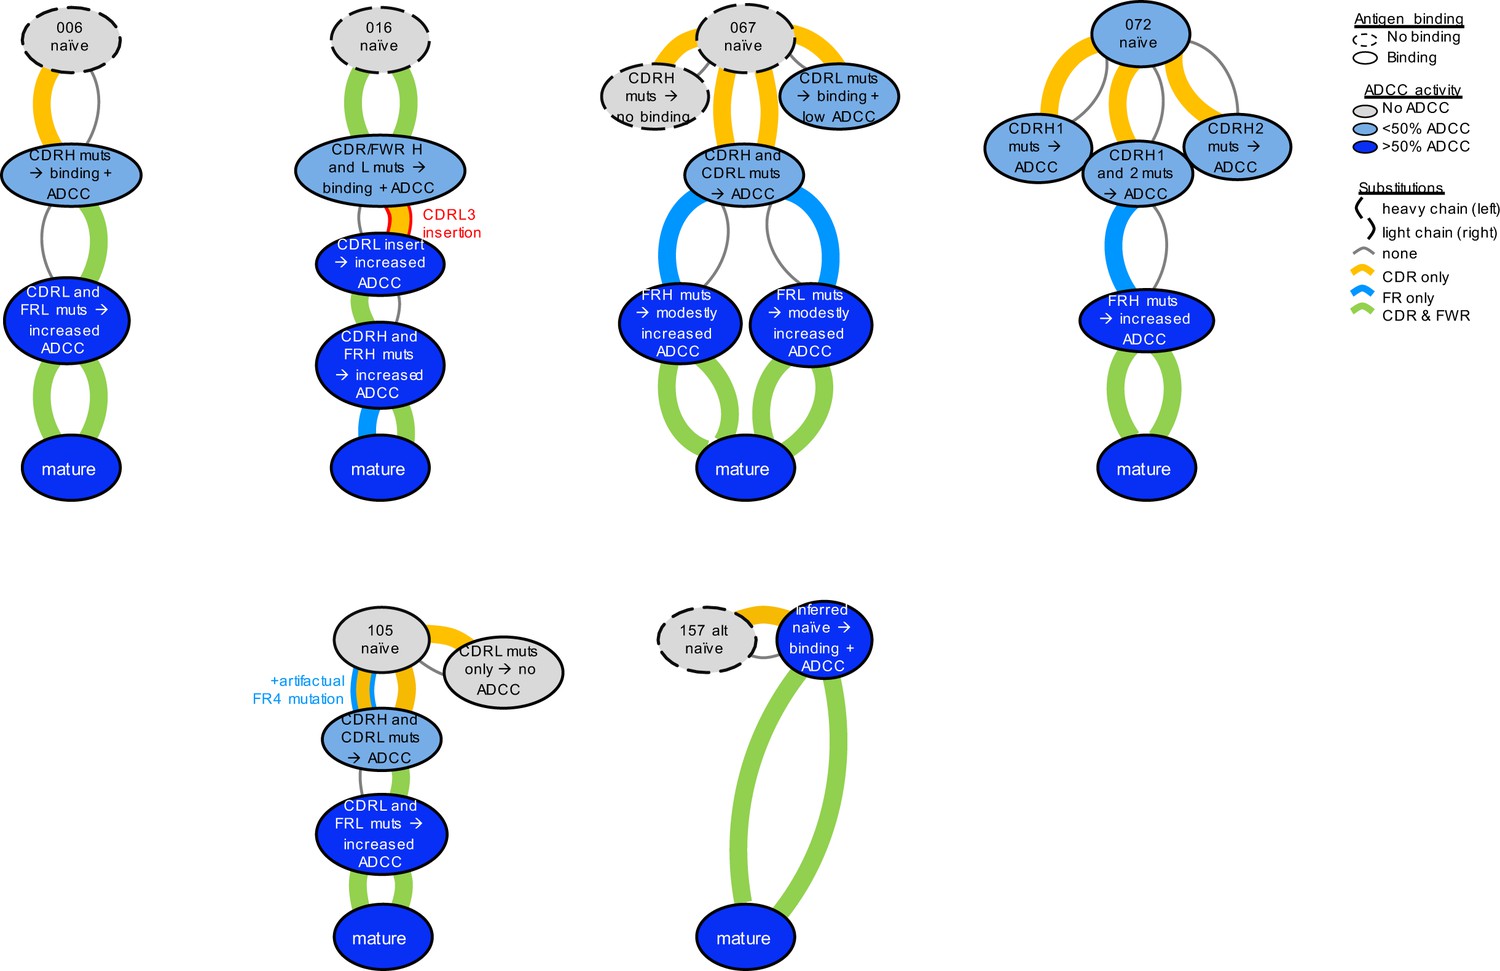
Key steps in ADCC development among six lineages.
Graphic summaries of development for each antibody lineage. Antibodies (ovals) are arranged from naïve (top) to mature (bottom) with inferred intermediates in between, colored by ADCC functionality: no function or indeterminate (gray), low function (<50% of mature activity; light blue), high function (>50% of mature activity; dark blue). Arcs connecting ovals indicate amino acid substitutions in the heavy chain (left) and light chain (right), colored by their locality: CDR (yellow), FWR (blue), both (green), or no change (gray, thin). The red outline within the 016 lineage denotes that the light chain mutation is an insertion, not a substitution. The blue outline within the 105 lineage denotes the presence of a FR4 mutation that was likely a computational artifact, since this position backmutates within the mature antibody.
Figure 8
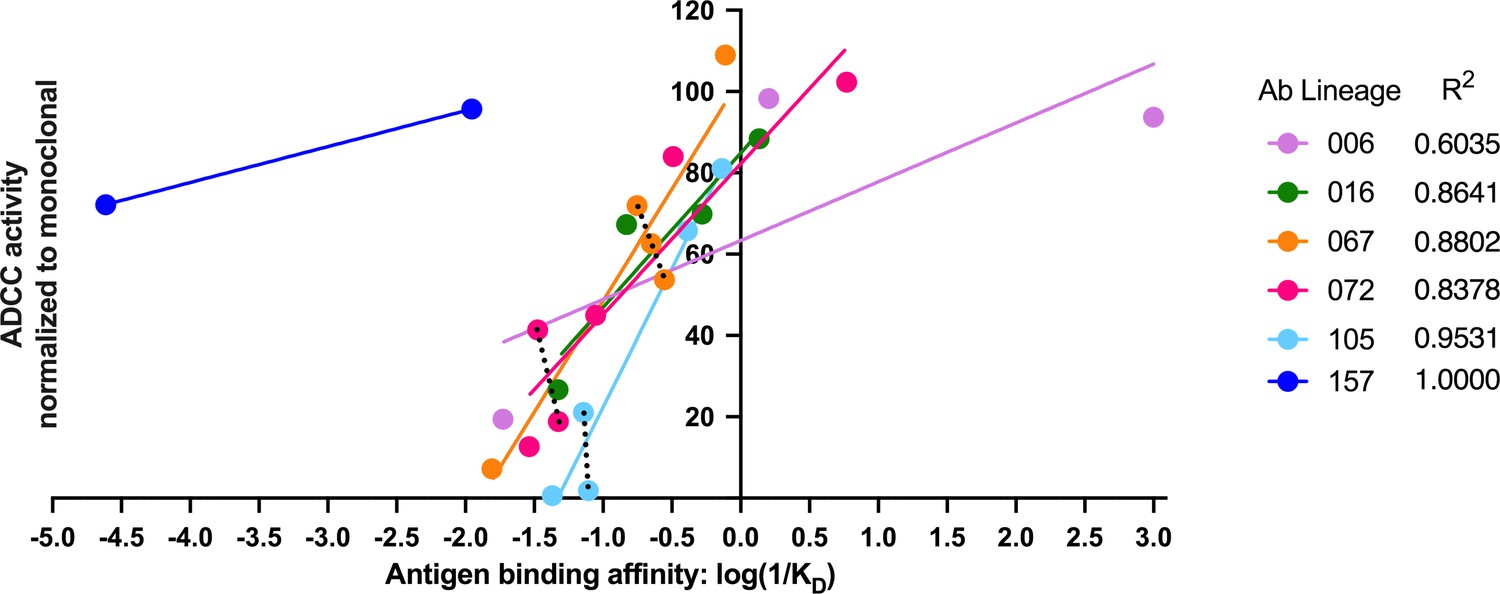
Antigen binding affinity and ADCC function correlate.
For antibodies within lineages 006, 016, 067, 072, and 105 (indicated by different colors), the log of reciprocal binding affinity, as determined by representative BLI data of least two independent experiments, is plotted against positive control-normalized RFADCC activity (the data shown in Figures 5 and 6). Antibodies that did not detectably bind antigen by BLI are excluded as none of these mediated ADCC. Dotted lines highlight comparisons between antibodies within the same lineage that have similar binding affinities, but different RFADCC activities. Source data for each mAb are available in Figure 8—source data 1.
-
Figure 8—source data 1
Source data for correlation of binding affinity (KDs determined by BLI, see Materials and methods) and average RFADCC function (Figures 5 and 6; Figure 5—source data 1) for each mAb.
- https://cdn.elifesciences.org/articles/63444/elife-63444-fig8-data1-v2.csv
Figure 9 with 2 supplements
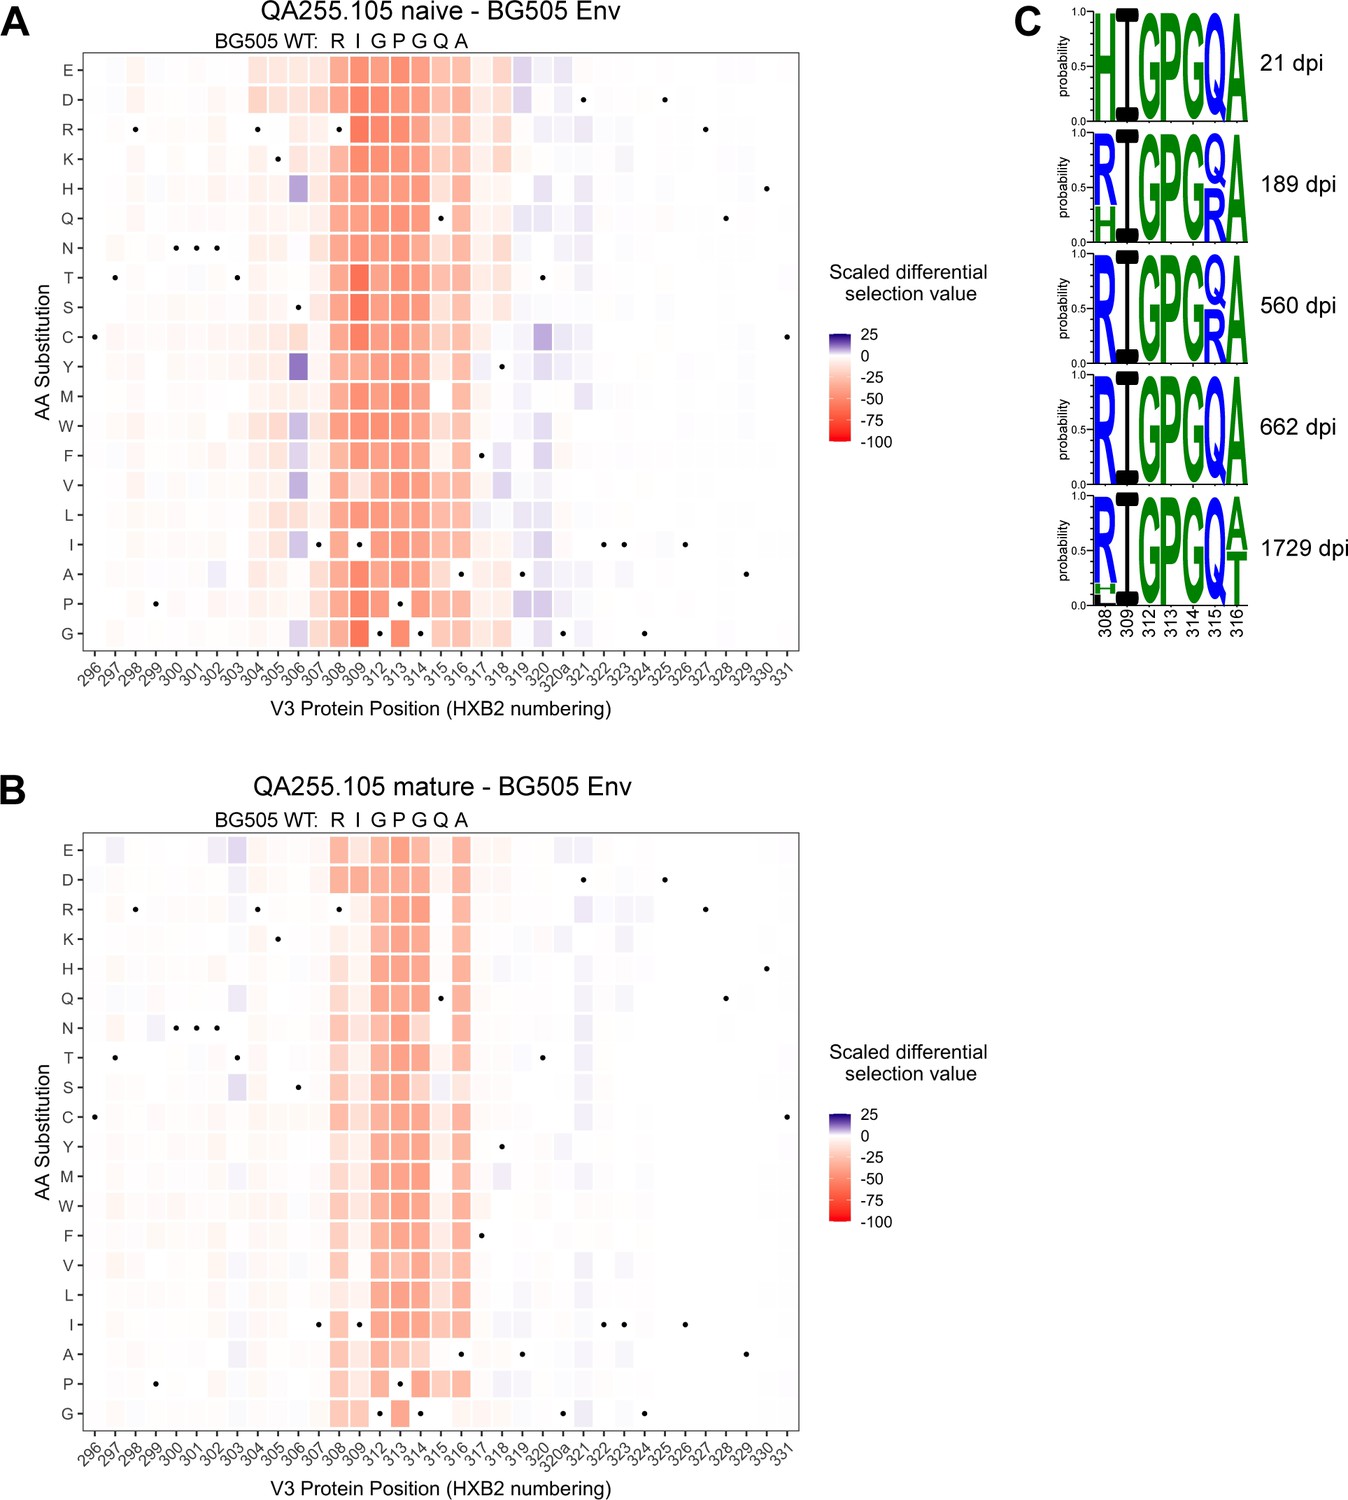
Lineage 105 epitope largely remains stable over time.
(A–B) Heatmaps depict scaled differential selection: the relative effect of each possible substitution within the V3 region of Env (HXB2 numbering), compared to wild type BG505.W6M.C2 Env, on binding by (A) 105 inferred naïve mAb and (B) 105 mature mAb. Wild-type residues are indicated by black dots. Mutations enriched above the wild-type residue are colored blue while those depleted are colored red; color intensity reflects the relative amount of differential selection as indicated by the key. Data are the average of two biological replicates. See also Figure 9—figure supplement 1 for peptide enrichment plots and Figure 9—figure supplement 2 for scaled differential selection in C.ZA.1197MB Env. Figure 9—source code 1 and Figure 9—source datas 1–3 contain fold enrichment and scaled differential selection data and calculations. (C) Logo plots of the residues comprising the 105 lineage epitope amongst 28 total longitudinal QA255 Env sequences (GenBank MW383929-MW383956) using HXB2 numbering.
-
Figure 9—source code 1
R markdown file detailing and performing the analysis of Phage-DMS deep sequencing data in order to map antibody-targeted Env epitopes.
- https://cdn.elifesciences.org/articles/63444/elife-63444-fig9-code1-v2.zip
-
Figure 9—source data 1
CSV file required for R analysis: gp41V3_PhageDMS_library_key.
This file maps the numbering between each Env strain and the HXB2 reference strain.
- https://cdn.elifesciences.org/articles/63444/elife-63444-fig9-data1-v2.csv
-
Figure 9—source data 2
CSV file required for R analysis: Phage-DMS-105epitope-Rep1annotatedCounts.
This file contains raw counts of each sequence for each sample, with annotated information for each sequence and peptide (replicate 1).
- https://cdn.elifesciences.org/articles/63444/elife-63444-fig9-data2-v2.csv
-
Figure 9—source data 3
CSV file required for R analysis: Phage-DMS-105epitope-Rep2annotatedCounts.
This file contains raw counts of each sequence for each sample, with annotated information for each sequence and peptide (replicate 2).
- https://cdn.elifesciences.org/articles/63444/elife-63444-fig9-data3-v2.csv
Figure 9—figure supplement 1
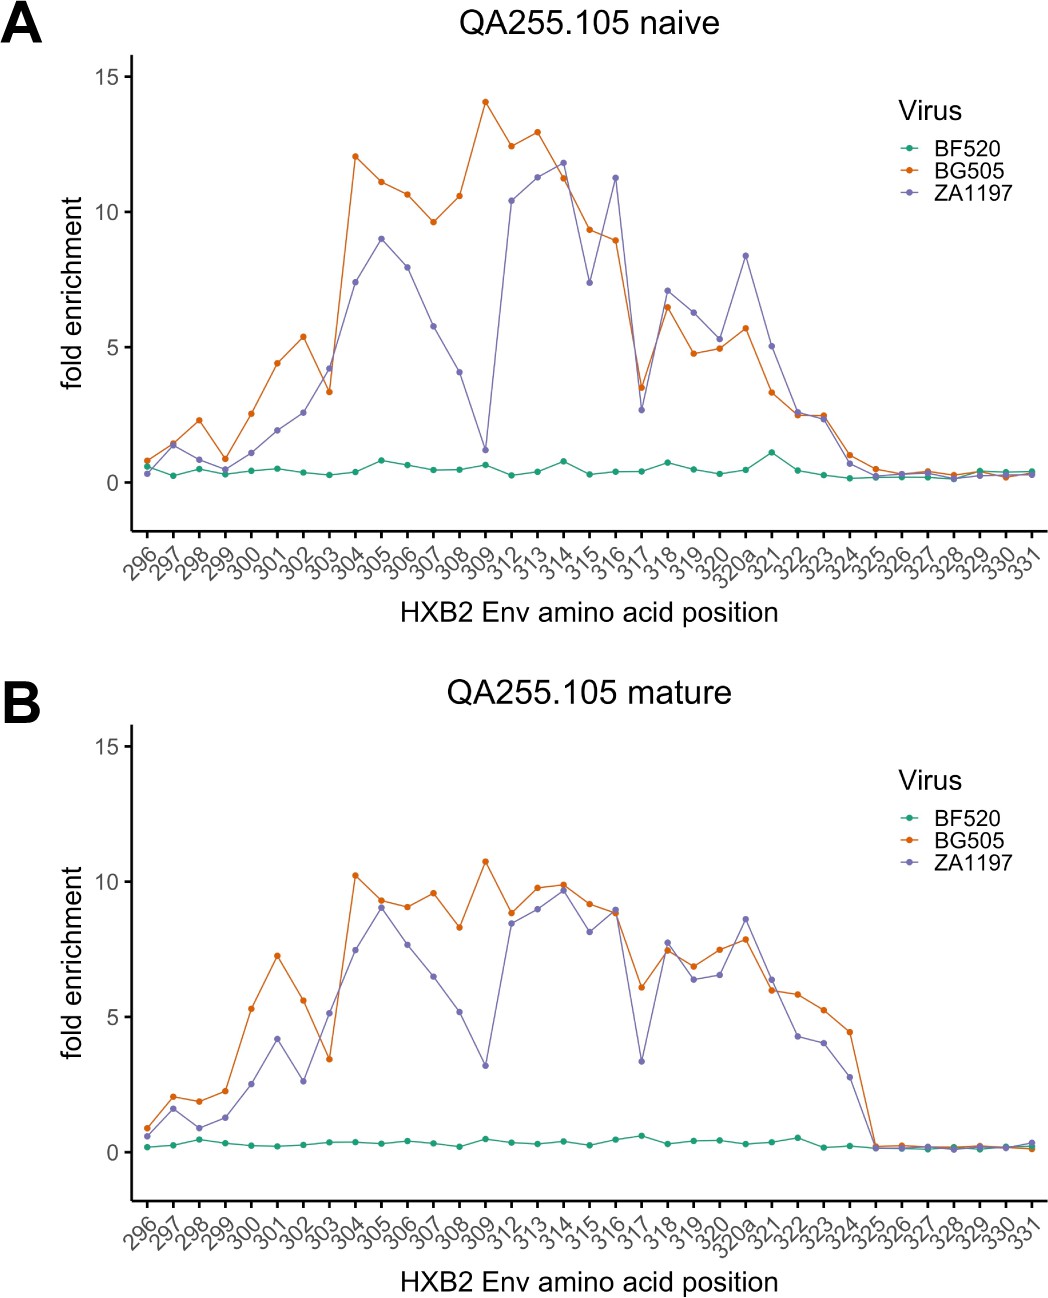
Phage-DMS peptide enrichment for 105 inferred naive and 105 mature mAbs.
(A–B) Line plot showing fold enrichment of wild-type peptides in the background of each indicated HIV Env strain (see key) for (A) 105 inferred naive mAb and (B) 105 mature mAb. Data are the average of two biological replicates. Amino acid positions within HIV Env are numbered based on HXB2 reference sequence. Figure 9—source code 1 and Figure 9—source datas 1–3 contain fold enrichment and scaled differential selection data and calculations.
Figure 9—figure supplement 2
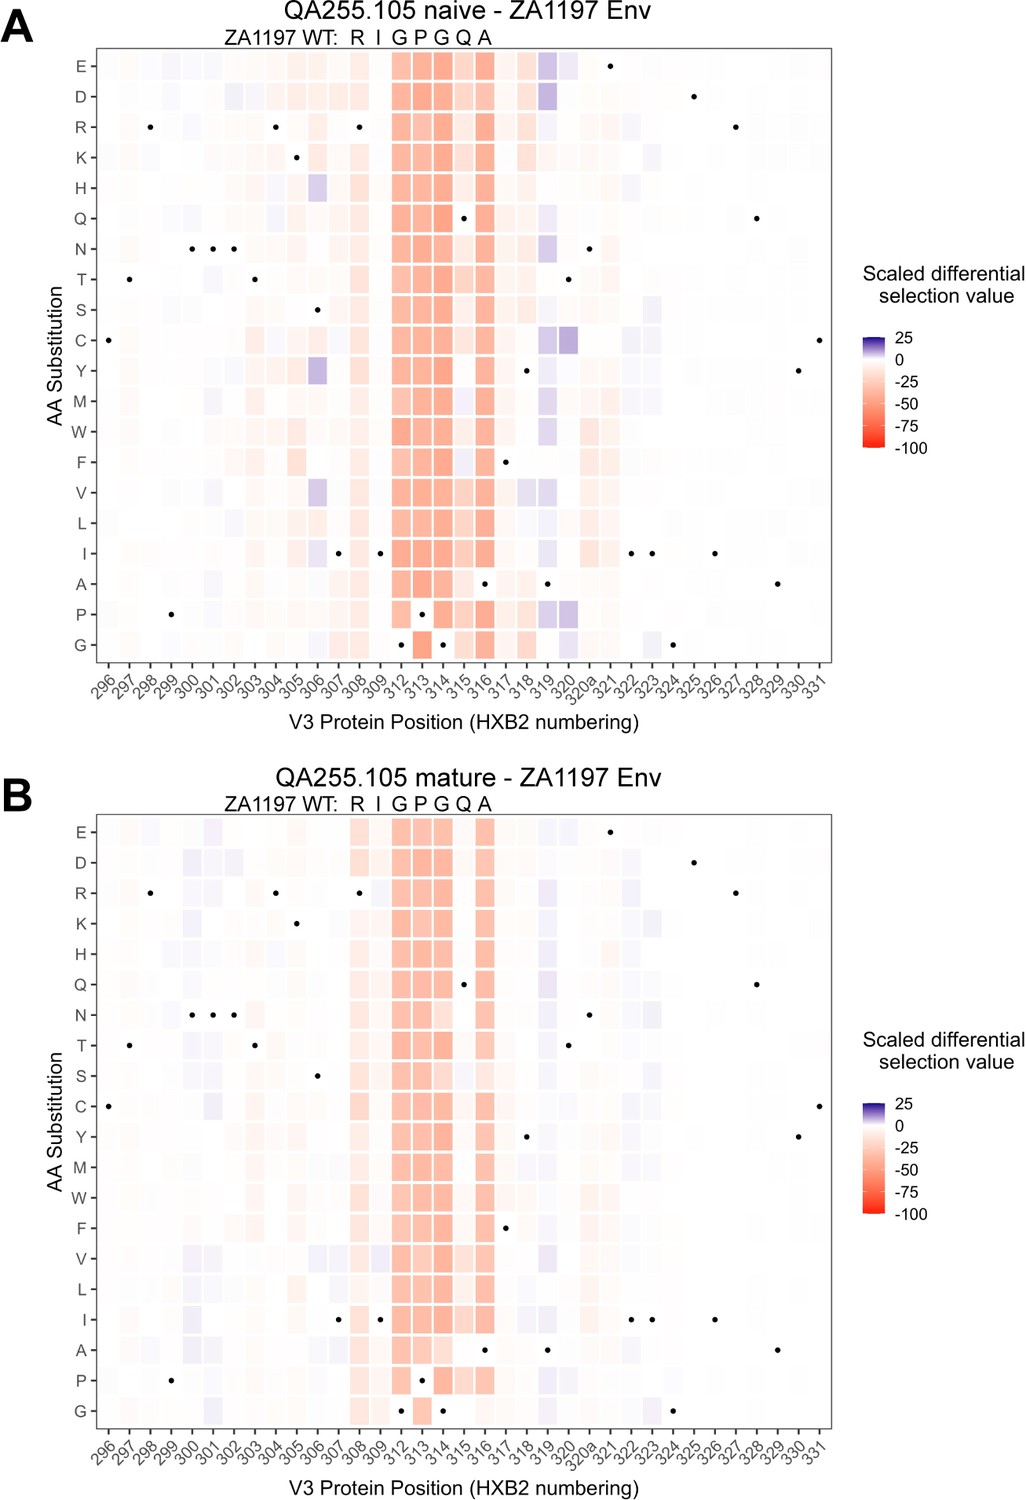
Lineage 105 epitope and predicted escape routes within C.ZA.1197MB Env.
(A–B) Heatmaps depict scaled differential selection: the relative effect of each possible substitution within the V3 region of Env (HXB2 numbering), compared to wild-type C.ZA.1197MB Env, on binding by (A) 105 inferred naive mAb and (B) 105 mature mAb. Wild-type residues are indicated by black dots. Mutations enriched above the wild-type residue are colored blue while those depleted are colored red; color intensity reflects the relative amount of differential selection as indicated by the key. Data are the average of two biological replicates. Figure 9—source code 1 and Figure 9—source datas 1–3 contain fold enrichment and scaled differential selection data and calculations.
Tables
Table 1
Longitudinal QA255 antibody variable region sequencing statistics.
| Time point | Live PBMC count (excluding non-viable) | PBMC viability | Ab chain | Replicate | Raw MiSeq reads | Productive replicate-merged deduplicated sequences | Estimated sequencing coverage within sampled blood PBMCs† | Estimated sequencing coverage within QA255 d914 whole-body blood repertoire‡ |
|---|---|---|---|---|---|---|---|---|
| D-119 | 1.39E+07 | 84.22% | IgM | 1 | 486,458 | 200,254 | 21% | 0.05% |
| IgG | 1 | 604,237 | 199,570 | 48% | 0.11% | |||
| IgK | 1 | 705,163 | 292,543 | 21% | 0.05% | |||
| IgL | 1 | 406,267 | 178,221 | 13% | 0.03% | |||
| D462 | 1.40E+07 | 86.42% | IgG | 1 | 646,809 | 504,029 | 120% | 0.22% |
| 2 | 923,103 | |||||||
| IgK | 1 | 57,096 | 506,989 | 36% | 0.08% | |||
| 2 | 967,693 | |||||||
| IgL | 1 | 201,566 | 402,456 | 29% | 0.06% | |||
| 2 | 586,568 | |||||||
| D791 | 3.90E+06 | 97.50% | IgG | 1 | 126,955 | 263,848 | 226% | 0.22% |
| 2 | 776,578 | |||||||
| 3* | 522,308 | |||||||
| IgK | 1 | 527,031 | 568,736 | 146% | 0.22% | |||
| 2 | 934,780 | |||||||
| 3* | 1,057,984 | |||||||
| IgL | 1 | 47,368 | 212,922 | 55% | 0.12% | |||
| 2 | 387,730 | |||||||
| 3* | 537,611 | |||||||
| D1174 | 1.80E+06 | 100.00% | IgG | 1 | 497,094 | 220,740 | 409% | 0.22% |
| 2 | 665,981 | |||||||
| 3* | 678,973 | |||||||
| IgK | 1 | 254,890 | 415,601 | 231% | 0.22% | |||
| 2 | 797,239 | |||||||
| 3* | 929,145 | |||||||
| IgL | 1 | 228,992 | 307,415 | 171% | 0.22% | |||
| 2 | 453,935 | |||||||
| 3* | 510,711 | |||||||
| D1512 | 1.00E+07 | 79.37% | IgG | 1 | 370,198 | 155,262 | 52% | 0.12% |
| IgK | 1 | 408,498 | 214,651 | 21% | 0.05% | |||
| IgL | 1 | 93,848 | 55,785 | 6% | 0.01% | |||
| averages: | 293,689 | 100% | 0.13% | |||||
-
* Library replicate performed using unique molecular identifiers during cDNA synthesis step.
† Sequencing coverage was calculated for PBMCs using QA255 D914 B cell frequency statistics from the cell sort (Williams et al., 2015).
-
‡ Whole-body sequencing coverage was calculated assuming 10 ml of blood was sampled from a total of 4500 ml adult blood volume.
Table 2
Clonal sequence analyses for ADCC antibody lineages.
(A, B) Characteristics and statistics of heavy (A) and light (B) chain clonal families. Percent SHM was calculated as the mutation frequency at the nucleotide level compared to the predicted naïve allele, as determined by the per subject germline inference for QA255. Statistics calculated for individual timepoints within the context of the full subject repertoire were downsampled to 50–150K sequences for computational manageability. Light chain clonal family size statistics are reported but unreliable due to overclustering caveats that are explained in the Materials and methods. Per-timepoint clonal family statistics were excluded if ≤1 clonal heavy or light chain sequences were identified. #: The VH gene used in 067 and 157 lineages was determined to be an allele not cataloged in IMGT (http://www.imgt.org/): 1–69*11+A147G+C169Tl; the 157 lineage VK gene was also a new allele: 3–11*01+T5A+T9A+T36G+G84A. †: Percent SHM for 016 light chain lineage includes a 3-nt insertion in the CDRL3. SHM: somatic hypermutation; ints: intermediates. Longitudinal values for ‘No. of unique clonal sequences identified’ are plotted for heavy and light chains in Table 2; Figure 2—figure supplements 1, along with longitudinal values for ‘Average %SHM (nt)’ for heavy chains. Graphics displaying the most probable routes of antibody lineage maturation corresponding to the ‘No. of ints resolved in lineage path’ are available in Figure 4 and Figure 4—figure supplements 1–3.
| Heavy chain | Lineage | Mature antibody statistics | Clonal family (all timepoints merged, not downsampled) | Clonal family statistics within repertoire (downsampled analyses) | No. ints resolved in lineage path | ||||||||||||||||||
|---|---|---|---|---|---|---|---|---|---|---|---|---|---|---|---|---|---|---|---|---|---|---|---|
| Gene usage (partis) | %SHM mature Ab | # sampled clonal seqs | Avg clonal family %SHM | No. unique clonal sequences identified | Size: percent of sampled repertoire | Average %SHM (nt) | |||||||||||||||||
| VH | DH | JH | D-119 | D462 | D791 | D1174 | D1512 | D-119 | D462 | D791 | D1174 | D1512 | D-119 | D462 | D791 | D1174 | D1512 | ||||||
| 006 | 3–23*01 | 3–22*01 | 4*02 | 8.7 | 7 | 10.8 | 0 | 7 | 0 | 0 | 0 | 0.002% | 7.6 | 1 | |||||||||
| 016 | 4–34*01 | 6–13*01 | 5*02 | 9.9 | 702 | 9.2 | 0 | 581 | 112 | 0 | 9 | 0.13% | 0.05% | 0.01% | 9.6 | 10.3 | 12.6 | 14 | |||||
| 067 | 1–69*11# | 1–1*01 | 6*03 | 8.1 | 36 | 11.9 | 0 | 35 | 1 | 0 | 0 | 0.01% | 11.6 | 2 | |||||||||
| 072 | 1–69*11 | 4–17*01 | 3*02 | 11.5 | 515 | 12.5 | 0 | 11 | 118 | 325 | 61 | 0.04% | 0.05% | 0.17% | 0.04% | 9.5 | 12.8 | 13.0 | 15.1 | 5 | |||
| 105 | 3–15*01 | 3–22*01 | 6*03 | 9.5 | 193 | 4.9 | 0 | 193 | 0 | 0 | 0 | 0.04% | 5 | 2 | |||||||||
| 157 | 1–69*11# | 1–26*01 | 6*03 | 6.5 | 183 | 7.4 | 0 | 6 | 165 | 8 | 4 | 0.004% | 0.08% | 0.04% | 0.03% | 9.3 | 7.7 | 10.3 | 11.8 | 4 | |||
| Light chain | Lineage | Mature antibody statistics | Clonal family (all timepoints merged, not downsampled) | Clonal family statistics within repertoire (downsampled analyses) | No. ints resolved in lineage path | ||||||||||||||||||
|---|---|---|---|---|---|---|---|---|---|---|---|---|---|---|---|---|---|---|---|---|---|---|---|
| Gene usage (partis) | %SHM mature Ab | # sampled clonal seqs | Avg clonal family %SHM | No. unique clonal sequences identified | Size: percent of repertoire | Average %SHM (nt) | |||||||||||||||||
| VK | VL | JK/L | D-119 | D462 | D791 | D1174 | D1512 | D-119 | D462 | D791 | D1174 | D1512 | D-119 | D462 | D791 | D1174 | D1512 | ||||||
| 006 | 2–11*01 | 2*01 | 6.8 | 673 | 6.1 | 12 | 274 | 273 | 52 | 62 | 0.14% | 7.1 | 7 | ||||||||||
| 016 | 1–51*02 | 2*01 | 9.9† | 1518 | 7.3 | 299 | 339 | 523 | 321 | 36 | 0.03% | 0.02% | 0.11% | 6.6 | 7.1 | 7.7 | 11 | ||||||
| 067 | 2–11*01 | 3*02 | 3.3 | 20,337 | 6.5 | 2149 | 6105 | 3408 | 7946 | 729 | 2.04% | 6.6 | 2 | ||||||||||
| 072 | 1–27*01 | 1*01 | 7.8 | 2796 | 6.2 | 476 | 719 | 702 | 543 | 356 | 0.17% | 0.18% | 0.18% | 0.25% | 6.3 | 6.3 | 6.6 | 7.0 | 5 | ||||
| 105 | 3–20*01 | 2*01 | 7.1 | 30,286 | 8.0 | 3058 | 4884 | 5607 | 14271 | 2466 | 1.17% | 6.3 | 7 | ||||||||||
| 157 | 3–11*01 | 5*01 | 5.0 | 18 | 8.2 | 0 | 12 | 0 | 1 | 5 | 0.24% | 0.07% | 5.9 | 5.3 | 7 | ||||||||
Key resources table
| Reagent type (species) or resource | Designation | Source or reference | Identifiers | Additional information |
|---|---|---|---|---|
| Cell line (human, female) | FreeStyle 293 F cells | Invitrogen | Cat#R790-07; RRID:CVCL_D603 | mAb production |
| Cell line (human, female) | CEM.NKR cells; target cells | NIH AIDS Reagent Program | Cat#458; RRID:CVCL_X622 | RFADCC |
| Biological sample (human, female) | QA255 PBMCs; D-119; D462; D791; D1174; D1512 | PMID:12060878 | Subject ID:QA255 | Prospective cohort of HIV-1 negative high-risk women in Mombasa, Kenya; longitudinal PMBC samples from 119 days pre-infection, 462 days post-infection(dpi), 791 dpi, 1174 dpi, and 1512 dpi |
| Antibody (human, female) | 006-0VH0VL; 006-1VH0VL; 006-1VH1VL; 016-0VH0VL; 016-1VH1VL; 016-1VH2VL; 016-2VH2VL; 067-0VH0VL; 067-1VH0VL; 067-0VH1VL; 067-1VH1VL; 067-2VH1VL; 067-1VH2VL; 072-0VH0VK; 072-1VH0VK; 072-2VH0VK; 072-3VH0VK; 072-4VH0VK; 105-0VH0VK; 105-0VH1VK; 105-1VH1VK; 105-1VH2VK; 157-0VHAVK; 157-0VH0VK (human monoclonal) | This paper | This paper:Supplementary file 1 | Computationally-inferred human (subject QA255) monoclonal antibodies representing naive and intermediate lineage members of six ADCC-capable antibody lineages; RFADCC (1:100-1:500); BLI (8 ug mL-1) |
| Antibody (human, female) | 006-NGSVHNGSVL; 016-NGSVH2VL(human monoclonal) | This paper | This paper:Supplementary file 1; BioProject:PRJNA639297 | NGS-sampled antibody chains paired into monoclonal human (subject QA255) antibodies; 016-2VL light chain was computationally-inferred and not directly NGS-sampled; RFADCC (1:100-1:500) |
| Antibody (human, female) | 006-mVHmVL; 016-mVHmVL; 067-mVHmVL; 072-mVHmVK; 105-mVHmVK; 157-mVHmVK (human monoclonal) | This paper and PMIDs 30779811 and 26629541 | GenBank: MT791224-MT791235 | Functionally-isolated human (subject QA255) antibody chains; ‘mature’ antibodies are capable of ADCC function; some sequences were edited based on consensus NGS data as describe in this paper; RFADCC (1:100-1:500); BLI (8 ug mL-1) |
| Recombinant DNA reagent | 006-0VH; 006-0VL; 006-1VH; 006-1VL; 006-mVH; 006-mVL; 006-NGSVH; 006-NGSVL; 016-0VH; 016-0VL; 016-1VH; 016-1VL; 016-2VL; 016-2VH; 016-mVH; 016-mVL; 016-NGSVH; 067-0VH; 067-0VL; 067-1VH; 067-1VL; 067-2VH; 067-2VL; 067-mVH; 067-mVL; 072-0VH; 072-0VK; 072-1VH; 072-2VH; 072-3VH; 072-4VH; 072-mVH; 072-mVK; 105-0VH; 105-0VK; 105-1VK; 105-1VH; 105-2VK; 105-mVH; 105-mVK; 157-0VH; 157-AVK; 157-0VH; 157-0VK; 157-mVH; 157-mVK | This paper; GeneWiz | This paper:Supplementary file 1 | Computationally-inferred or NGS-sampled human (subject QA255) IgG (VH), IgK (VK), and IgL (VL) antibody variable region sequences representing naïve, intermediate, and mature lineage members of six ADCC-capable antibody lineages |
| Recombinant DNA reagent | Human Igγ1 expression vector | PMID:17996249 | Addgene:80795 | |
| Recombinant DNA reagent | Human Igκ expression vector | PMID:17996249 | Addgene:80796 | |
| Recombinant DNA reagent | Human Igλ expression vector | PMID:17996249 | Addgene:99575 | |
| Sequence-based reagent | NGS; NGS-sampled sequences; libraries; D-119; D462; D791; D1174; D1512 | This paper | BioProject:PRJNA639297 | Longitudinal QA255 full-length antibody variable region IgG, IgM, IgK, and IgL sequences |
| Sequence-based reagent | Primers | PMID:27525066; PMID:31097697 | see PMID:31097697 | Primers for amplification and sequencing of human IgM, IgG, IgK and IgL variable regions |
| Sequence-based reagent | SmartNNNa; template switch adaptor primers | PMID:27490633 | N/A | AAGCAGUGGTAUCAACGCAGAGUNNNNUNNNNUNNNNUCTTrGrGrGrGrG |
| Peptide, recombinant protein | gp120 (HIV strain BL035.W6M.C1 ‘BL035’) | Immune Technology Corp. | Cat#IT-001–115 p; GenBank:DQ208480.1 | BLI analyte (250 nM or 62.5 nM); RFADCC coat (1.5 µg per 10^5 cells) |
| Peptide, recombinant protein | gp120 (HIV strain QA255.22P.A17 ‘QA255’) | Cambridge Biologics | Cat#01-01-1743; GenBank:MW383930 | RFADCC coat (1.5 µg per 10^5 cells) |
| Peptide, recombinant protein | gp120 (HIV strainBG505.W6M.B1 ‘BG505’) | Cambridge Biologics | Cat#01-01-1028; GenBank:ABA61515.1 | RFADCC coat (1.5 µg per 10^5 cells) |
| Peptide, recombinant protein | gp120 (HIV strain CAP210.2.00.E8 ‘CAP210’) | Immune Technology Corp. | Cat#IT-001-RC12p; GenBank:DQ435683.1 | RFADCC coat (1.5 µg per 10^5 cells) |
| Peptide, recombinant protein | gp120 (HIV strain MK184.W0M.G3 ‘MK184’) | Immune Technology Corp. | Cat#IT-001–112 p; GenBank:DQ208487 | RFADCC coat (1.5 µg per 10^5 cells) |
| Peptide, recombinant protein | gp120 (HIV strain SF162) | Cambridge Biologics | Cat#01-01-1063; GenBank:P19550.1 | RFADCC coat (1.5 µg per 10^5 cells) |
| Peptide, recombinant protein | gp41 ectodomain (HIV strain C.ZA.1197MB) | Immune Technology Corp. | Cat#IT-001–0052 p; GenBank:AY463234.1 | BLI analyte (250 nM or 62.5 nM); RFADCC coat (1.5 µg per 10^5 cells) |
| Peptide, recombinant protein | Phage-DMS gp41 and V3 library | PMID:33089110 | N/A | Deep mutational scanning phage display library containing wildtype and mutant peptides that tile across the gp41 and V3 portions of three Envelope strains (BG505.W6M.C2, BF520.W14M.C2, and C.ZA.1197MB). Peptides are 31 amino acids long and contain every possible single amino acid mutation at the central position, with peptides overlapping by 30 amino acids. |
| Chemical compound, drug | Q5 High-Fidelity Master Mix | New England BioLabs | Cat#M0492S | |
| Chemical compound, drug | FreeStyle Max | Thermo Fisher Scientific | Cat#16447500 | |
| Chemical compound, drug | Protein G agarose | Pierce | Cat#20397 | |
| Chemical compound, drug | 293F FreeStyle Expression media | Invitrogen | Cat#12338–026 | |
| Commercial assay or kit | AllPrep DNA/RNA Mini Kit | Qiagen | Cat#80204 | |
| Commercial assay or kit | SMARTer RACE 5'/3' Kit | Takara Bio USA | Cat#634858 | |
| Commercial assay or kit | KAPA library quantification kit | Kapa Biosystems | Cat#KK4824 | |
| Commercial assay or kit | 600-cycle MiSeq Reagent Kit v3 | Illumina | Cat#MS-102–3003 | |
| Commercial assay or kit | Nextera XT 96-well index kit | Illumina | Cat#FC-131–1001 | |
| Commercial assay or kit | Anti-human IgG Fc capture biosensors | Pall ForteBio | Cat#18–5063 | |
| Software, algorithm | FLASH v1.2.11 | PMID:21903629 | http://ccb.jhu.edu/software/FLASH/ | |
| Software, algorithm | Cutadapt 1.14 with Python 2.7.9 | PMID:23671333 | RRID:SCR_011841 | http://cutadapt.readthedocs.io/en/stable/ |
| Software, algorithm | FASTX toolkit 0.0.14 | Hannon Lab, Cold Spring Harbor | RRID:SCR_005534 | http://hannonlab.cshl.edu/fastx_toolkit/ |
| Software, algorithm | Partis | PMID:26751373 | N/A | https://github.com/psathyrella/partis |
| Software, algorithm | Linearham | PMID:32804924 | N/A | https://github.com/matsengrp/linearham |
| Software, algorithm | FastTree 2 | PMID:20224823 | N/A | http://doi.org/10.1371/journal.pone.0009490.g003 |
| Software, algorithm | Prune.py | PMID:31097697 | N/A | https://github.com/matsengrp/cft/blob/master/bin/prune.py |
| Software, algorithm | CFT (Clonal Family Tree) | This paper | N/A | https://github.com/matsengrp/cft/ |
| Software, algorithm | RevBayes | PMID:27235697 | N/A | https://revbayes.github.io/; incorporated in Ecgtheow code |
| Software, algorithm | Ecgtheow | PMID:31097697 | N/A | https://github.com/matsengrp/ecgtheow |
| Software, algorithm | Local BLAST for lineage-like NGS sequences | This paper | N/A | https://git.io/Je7Zp |
| Software, algorithm | FlowJo v10 | TreeStar | RRID:SCR_008520 | |
| Software, algorithm | Excel | Microsoft Office | RRID:SCR_016137 | |
| Software, algorithm | ForteBio’s Octet Software ‘Data Analysis 7.0’ | Pall ForteBio | N/A | |
| Software, algorithm | Prism 8.0 c | GraphPad | RRID:SCR_002798 | |
| Software, algorithm | Rstudio | Rstudio | RRID:SCR_000432 |
Additional files
-
Supplementary file 1
Sequences of six ADCC antibody lineages.
(fasta file) Included are inferred naïve, computationally-inferred lineage intermediate, manually- inferred lineage intermediate, corrected mature, and NGS sequences with high sequence identity to lineage members and/or mature sequences. Sequences are provided as, because computationally inferred sequences cannot be deposited into GenBank.
- https://cdn.elifesciences.org/articles/63444/elife-63444-supp1-v2.txt
-
Supplementary file 2
Select NGS sequences with highest sequence identity to mature D914 mAb sequences.
(fasta file)
- https://cdn.elifesciences.org/articles/63444/elife-63444-supp2-v2.txt
-
Transparent reporting form
- https://cdn.elifesciences.org/articles/63444/elife-63444-transrepform-v2.docx
Download links
A two-part list of links to download the article, or parts of the article, in various formats.
Downloads (link to download the article as PDF)
Open citations (links to open the citations from this article in various online reference manager services)
Cite this article (links to download the citations from this article in formats compatible with various reference manager tools)
Development of antibody-dependent cell cytotoxicity function in HIV-1 antibodies
eLife 10:e63444.
https://doi.org/10.7554/eLife.63444


