Precise base editing for the in vivo study of developmental signaling and human pathologies in zebrafish
- Sorbonne Université, INSERM, CNRS, Institut de la Vision, France
- Institut Curie, PSL Research University, Inserm U934, CNRS UMR3215, France
- Department of Cellular, Computational and Integrative Biology – CIBIO, University of Trento, Italy
- Muséum National d’Histoire Naturelle, INSERM U1154, CNRS UMR 7196, France
Figures
Figure 1 with 1 supplement
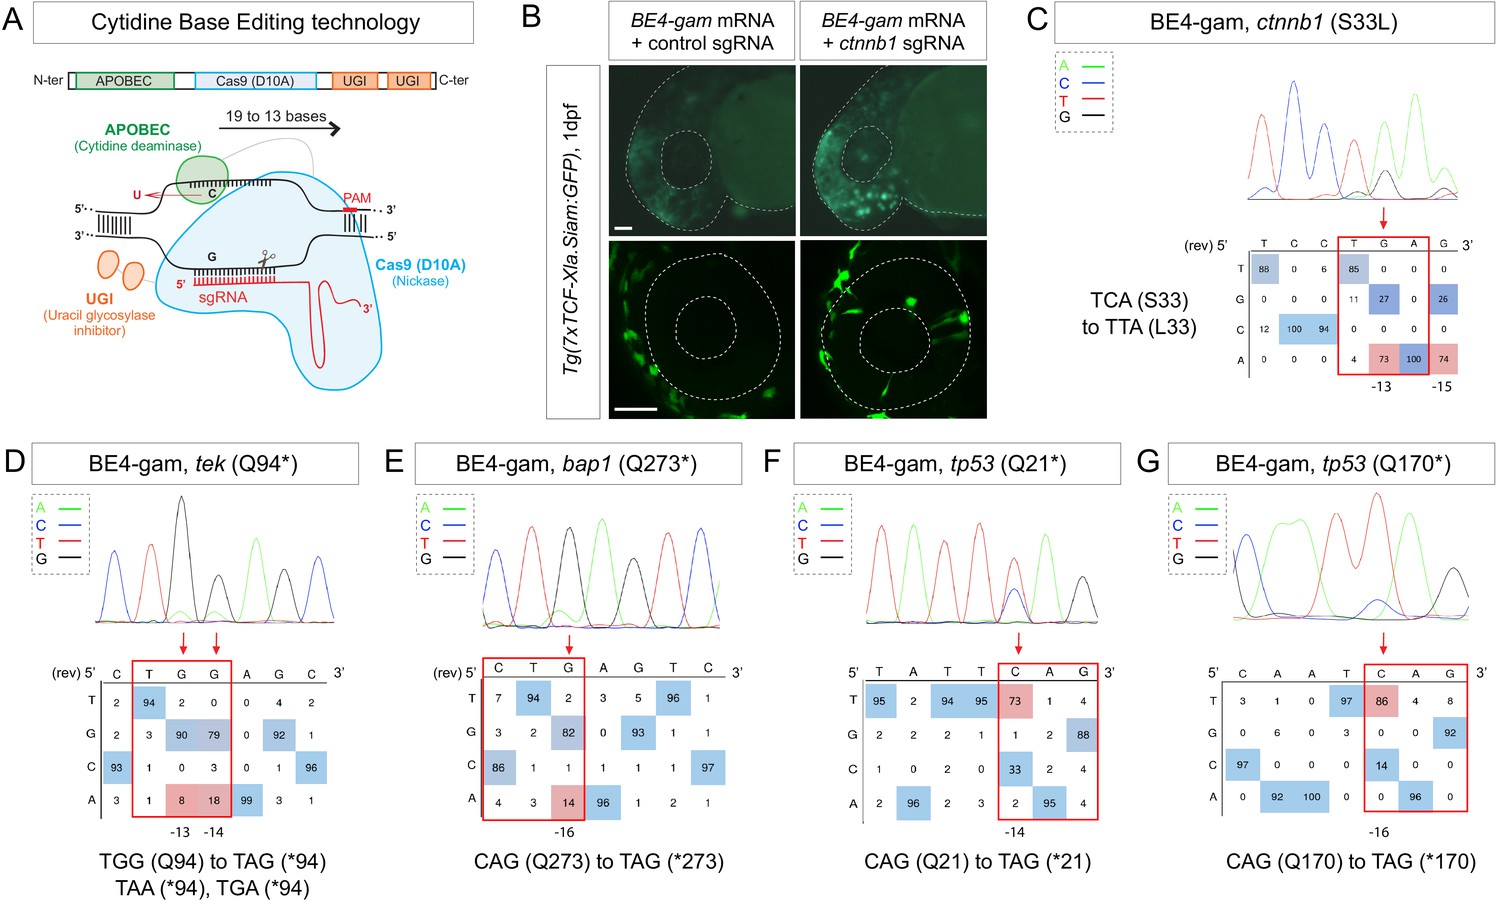
Efficient endogenous activation of Wnt signaling pathway and tumor suppressor genes targeting using BE4-gam in zebrafish.
(A) Schematic representation of the cytidine base editor technology. (B) Activation of Wnt signaling via S33L mutation in β-catenin. 1 dpf Tg(7xTCF-Xla.Siam:GFP) representative embryos injected with BE4-gam mRNA and ctnnb1 (S33L) sgRNA or control scrambled sequence. The upper panel shows an overall increase of GFP-positive cells in the head/anterior region upon the injection of the BE4-gam mRNA and ctnnb1 (S33L) sgRNA compared to the control situation. The lower panel shows maximal z-projection of lateral view of the injected embryos where ectopic GFP signal in retinal progenitor cells (white stars) can be detected, whereas control embryos do not show any fluorescence in the retina at this stage. (C–G) DNA sequencing chromatogram of targeted loci with the BE4-gam and obtained C-to-T conversion efficiencies. The chromatograms correspond to the highest efficiency reported for the single embryos analyzed as detailed in Table 2. (C) S33L mutation in β-catenin upon C-to-T conversion in ctnnb1 reached 73% of gene-editing efficiency. The other edited C led to a silent mutation GAC (D) to GAT (D). (D) Q94* mutation in Tek upon C-to-T conversion in tek reached 18% of gene-editing efficiency. (E) Q273* mutation in Bap1 upon C-to-T conversion in bap1 reached 14% of gene-editing efficiency. (F) Q21* mutation in p53 upon C-to-T conversion in tp53 reached 73% of gene-editing efficiency. (G) Q170* mutation in p53 upon C-to-T conversion in tp53 reached 86% of gene-editing efficiency. For (C) and (E), the reverse complement of the sgRNA sequence is shown. Scale bars: (B) 50 µm. (D–G) Numbers in the boxes represent the percentage of each base at that sequence position. In red are highlighted the base substitutions introduced by base editing, while the original bases are in blue. The color code of the chromatogram is indicated in the upper left corner (Adenine green, Cytosine blue, Thymine red, Guanine black). The distance from the PAM sequence of the targeted C base is indicated below each chromatogram. It is considered that the quantifications under 5% are due to the background signal from Sanger sequencing and are thus non-significant (Kluesner et al., 2018).
Figure 1—figure supplement 1
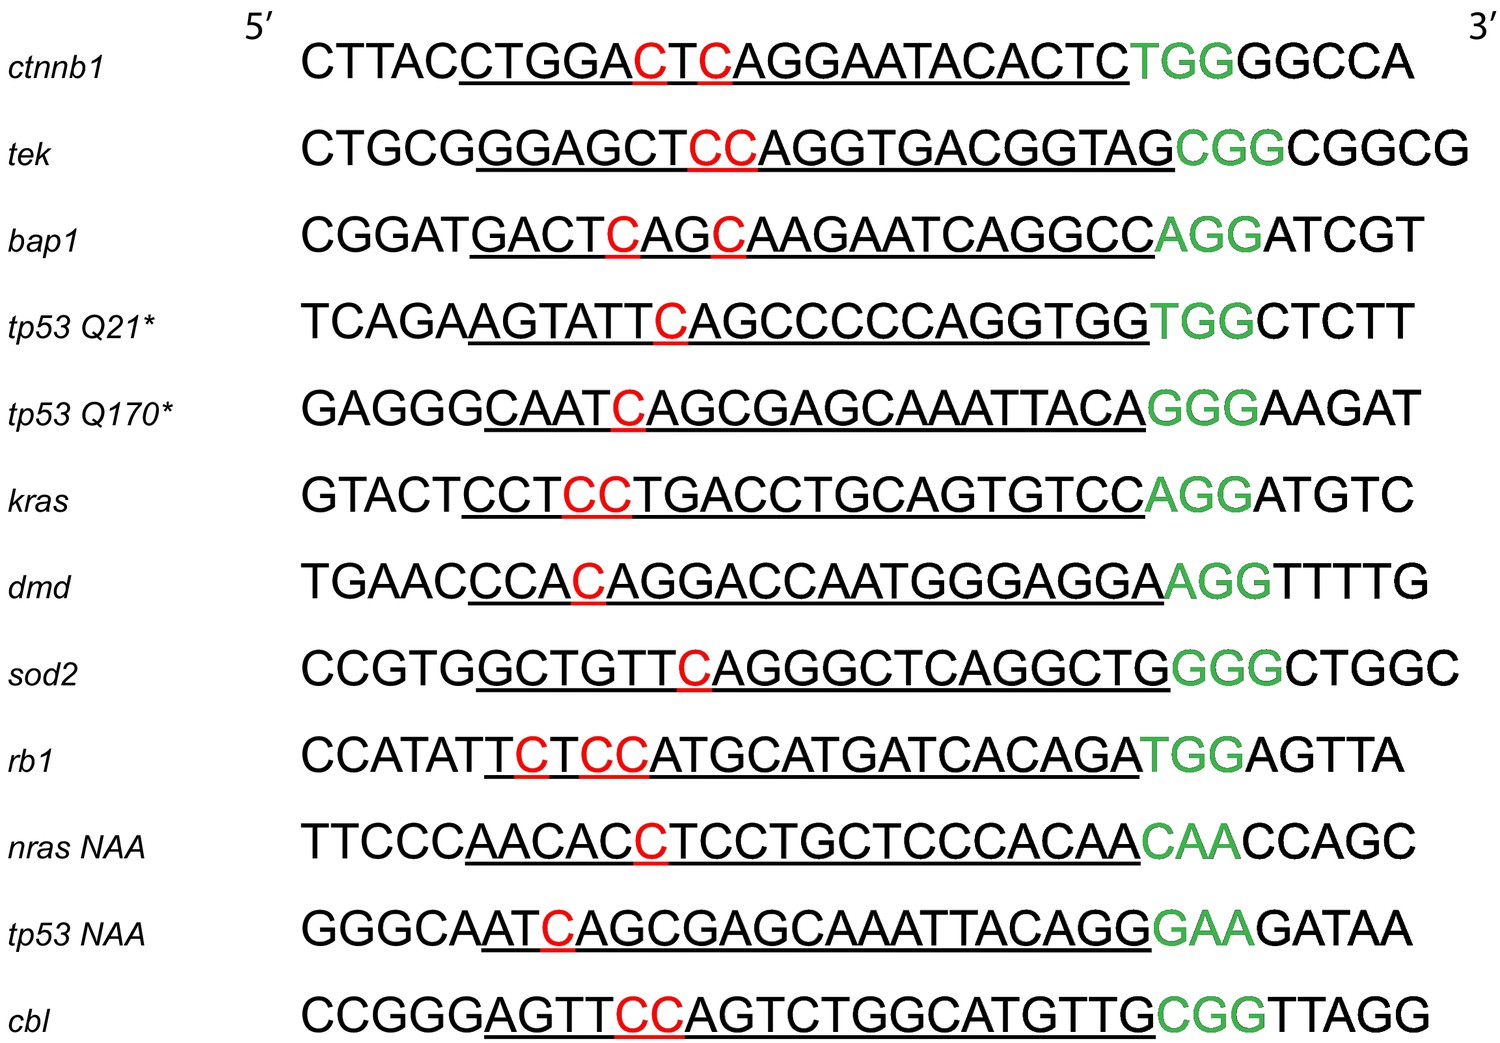
List of targeted loci.
List of all the targeted loci in this study. In red are highlighted the targeted C bases, underlined are the sgRNAs and in green the associated PAM sequences. Sequences are oriented from 5’ to 3’.
Figure 2
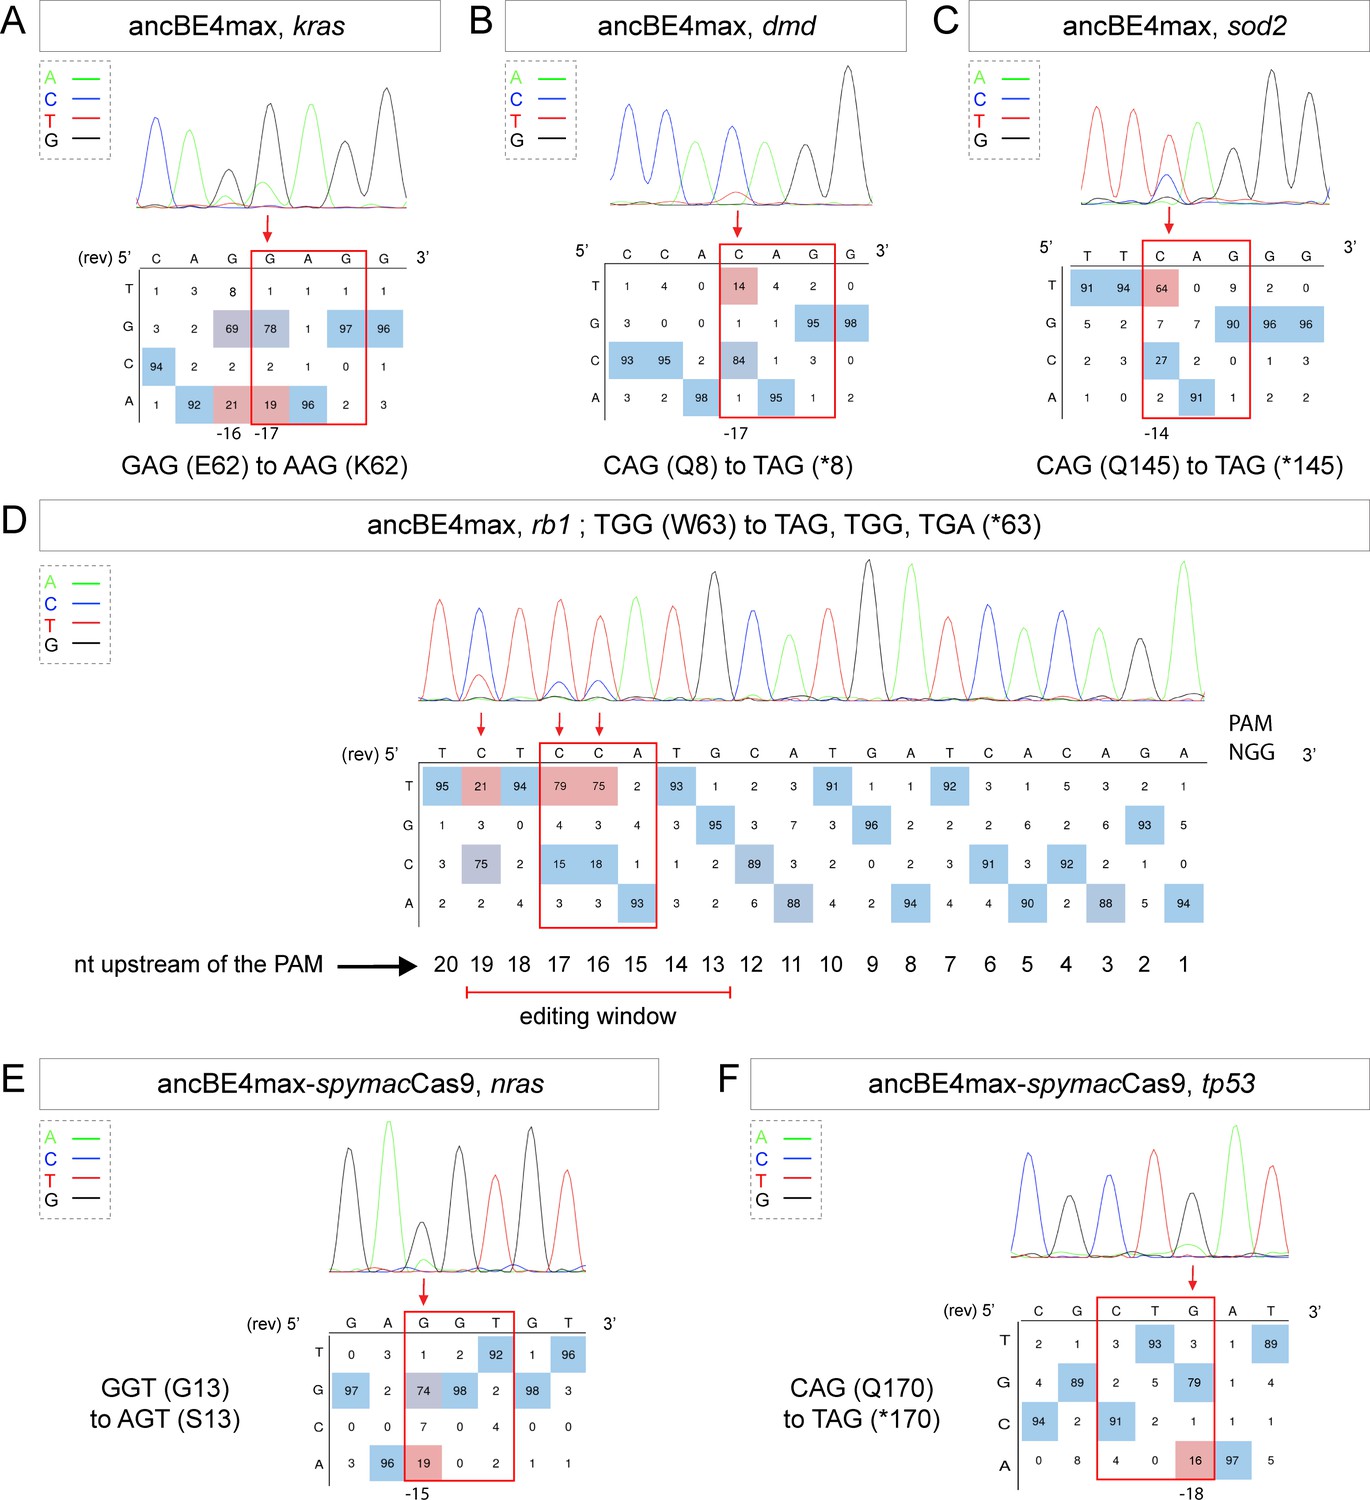
Tumor suppressor genes and oncogenes targeting by the highly efficient ancBE4max and the ancBE4max-SpymacCas9 recognizing NAA PAM.
(A–F) DNA sequencing chromatogram of targeted loci with the ancBE4max (in A–D) or ancBE4max-SpymacCas9 (in E,F) and obtained C-to-T conversion efficiencies. (A) E62K mutation in Kras upon C-to-T conversion in kras reached 19% gene-editing efficiency. The other edited C led to a silent mutation CAG (Q) to CAA (Q). (B) Q8* mutation in Dmd upon C-to-T conversion in dmd reached 14% of gene-editing efficiency. (C) Q145* mutation in Sod2 upon C-to-T conversion in sod2 reached 64% of gene-editing efficiency. (D) W63* mutation in Rb1 upon C-to-T conversion in rb1 reached 21% for the C19 base, 79% for C17, and 75% for the C16 of gene-editing efficiency. (E) G13S mutation in Nras upon C-to-T conversion in nras reached 19% of gene-editing efficiency. (F) Q170* mutation in p53 upon C-to-T conversion in tp53 reached 16% of gene-editing efficiency. For (A, D–F), the reverse complement of the sgRNA sequence is shown. (A–F) The chromatograms correspond to the efficiency reported for the single embryos provided in the first column of Table 2. The numbers in the boxes represent the percentage of each base at that sequence position. In red are highlighted the base substitutions introduced by base editing, while the original sequence is in blue. The color code of the chromatogram is indicated in the upper left corner (Adenine green, Cytosine blue, Thymine red, and Guanine black). The distance from the PAM sequence of the targeted C base is indicated below each chromatogram. It is considered that the quantifications under 5% are due to the background signal from Sanger sequencing and are thus non-significant (Kluesner et al., 2018).
Figure 3
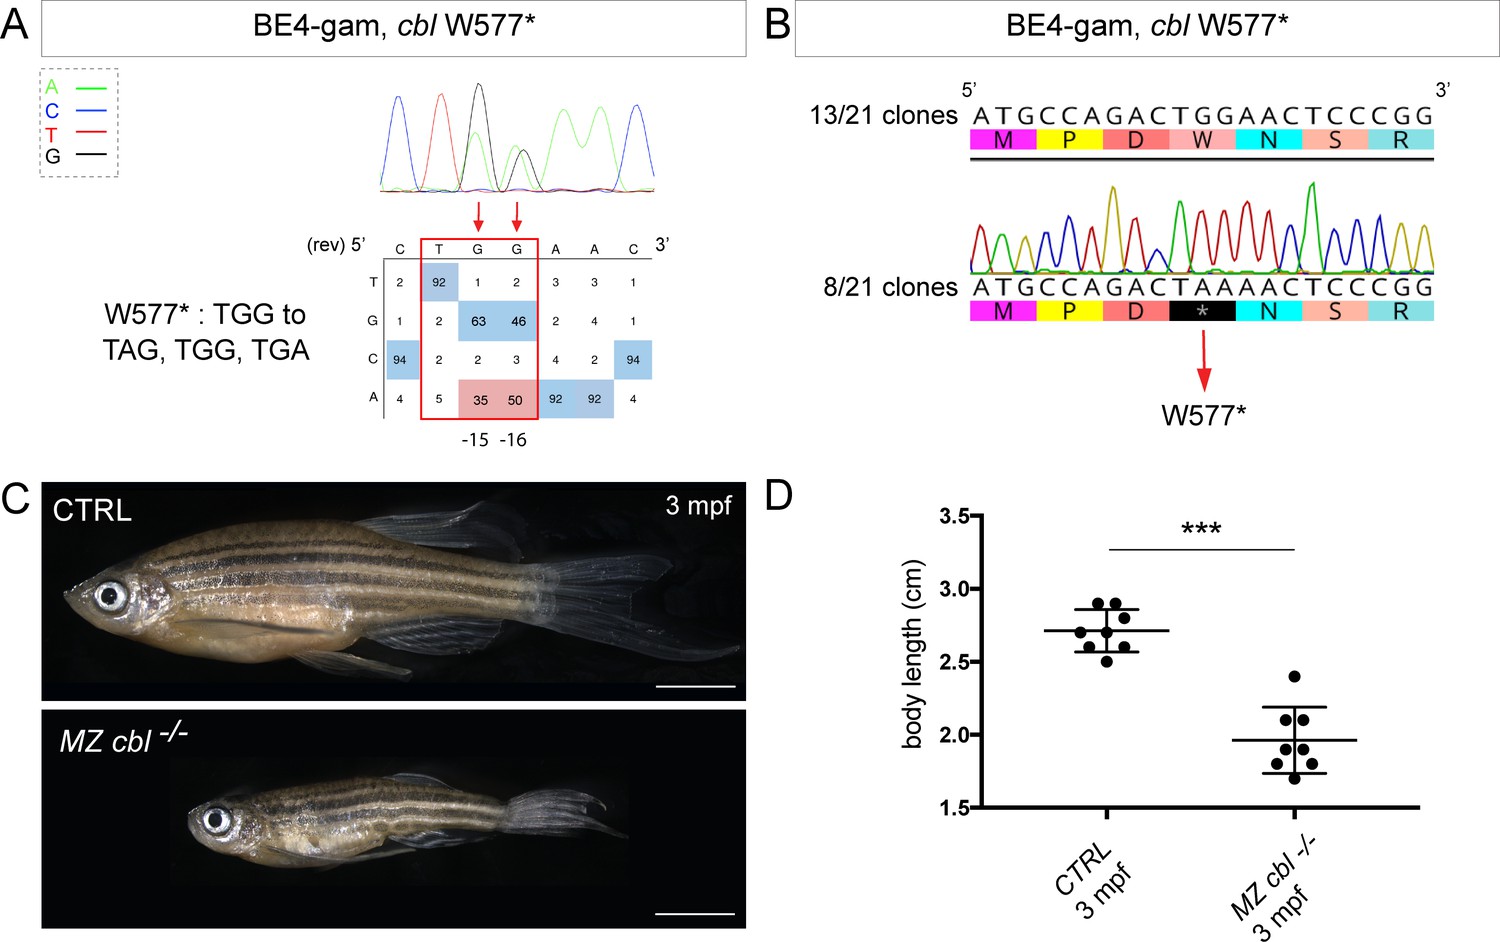
BE4-gam generated cbl maternal zygotic mutant fish show a reduced growth phenotype.
(A) DNA sequencing chromatogram of targeted cbl gene with the BE4-gam. W577* mutation in Cbl upon C-to-T conversion in cbl reached 50% for the C16 base and 35% for the C15 base of gene-editing efficiency. The chromatogram refers to the efficiency reported for the embryo provided in the first column of Table 2. The numbers in the boxes represent the percentage of each base at that sequence position. In red are highlighted the base substitutions introduced by base editing, while the original sequence is in blue. The color code of the chromatogram is indicated in the upper left corner (Adenine green, Cytosine blue, Thymine red, and Guanine black). The distance from the PAM sequence of the targeted C base is indicated below the chromatogram. It is considered that the quantifications under 5% are due to the background signal from Sanger sequencing and are thus non-significant (Kluesner et al., 2018). (B) Sequencing of individual clones of a pool of F1 embryos from a founder carrying the W577* mutation in Cbl. TGG-to-TAA precise mutation was found in 8 of 21 clones. No editing or INDELs were detected in all other clones. (C) Three months post-fertilization (mpf) cbl wild type derived from the incross of wild-type siblings (upper panel) and dwarf maternal zygotic (MZ) mutant fish found in 24% of the progeny (lower panel). (D) Quantification of the body length of the cbl+/+ controls and of the dwarf MZ cbl−/−. The dwarf fish show a significant reduced size at three mpf compared to the wild-type controls. n = 8 for each group. Mann–Whitney test, p=0,0002. Scale bars: (C) 5 mm.
Tables
Table 1
Base-editing efficiency using different CBE variants.
Number of edited embryos randomly chosen after injection of CBE mRNA and sgRNA. The efficiency varies between non-detected (n.d.) and 91% depending on the targeted locus, the sgRNA, and the CBE used. Editing efficiency was quantified by editR analysis (Kluesner et al., 2018), which does not detect editing efficiency below 5%.
| Targeted gene CBE used induced mutation | ctnnb1 (S33L) BE4-gam | tp53 (Q170*) BE4-gam | cbl (W577*) BE4-gam | kras (E62K) BE4-gam | Kras (E62K) ancBE4max | dmd (Q8*) BE4-gam | dmd (Q8*) ancBE4max | rb1 (W63*) ancBE4max | nras (G13S) spymac -ancBE4max | tp53 (Q170*) spymac- ancBE4max | ||
|---|---|---|---|---|---|---|---|---|---|---|---|---|
| Number of edited embryos | 5/8 | 7/8 | 8/10 | 0/8 | 4/7 | 0/8 | 2/4 | 8/8 | 2/4 | 1/4 | ||
| Highest obtained efficiency | 73% | 86% | C16 35% | C15 50% | n.d. | 19% | n.d. | 14% | C17 91% | C16 65% | 19% | 16% |
Table 2
Editing efficiency quantification.
Editing quantification of up to 10 single embryos randomly chosen after injection of indicated CBE mRNA and sgRNA. The efficiency varies between non-detected (n.d.) to 91% in a single embryo depending on the targeted locus, the sgRNA, and the CBE used. Editing efficiency was quantified by editR analysis (Kluesner et al., 2018), which does not detect editing efficiency below 5%.
| Targeted gene CBE used | Number of edited embryos | Emb. 1 | Emb. 2 | Emb. 3 | Emb. 4 | Emb. 5 | Emb. 6 | Emb. 7 | Emb. 8 | Emb. 9 | Emb. 10 | ||||||||||||||||
|---|---|---|---|---|---|---|---|---|---|---|---|---|---|---|---|---|---|---|---|---|---|---|---|---|---|---|---|
| ctnnb1 (S33L) BE4-gam | 5/8 | C15 74% | C13 73% | C15 n.d. | C13 40% | C15 44% | C13 25% | C15 7% | C13 16% | C15 n.d. | C13 11% | n.d. | n.d. | n.d. | – | – | |||||||||||
| tek (Q94*) BE4-gam | 5/8 | C14 18% | C13 8% | C14 10% | C13 n.d. | C14 8% | C13 n.d. | C14 6% | C13 n.d. | C14 8% | C13 9% | n.d. | n.d. | n.d. | – | – | |||||||||||
| Bap1 (Q273*) BE4-gam | 4/8 | 14% | 12% | 9% | 8% | n.d. | n.d. | n.d. | n.d. | – | – | ||||||||||||||||
| tp53 (Q21*) BE4-gam | 6/8 | 63% | 33% | 37% | 58% | 8% | 50% | n.d. | n.d. | – | – | ||||||||||||||||
| tp53 (Q170*) BE4-gam | 7/8 | 86% | 46% | 51% | 62% | 45% | 20% | 33% | n.d. | – | – | ||||||||||||||||
| cbl (W577*) BE4-gam | 8/10 | C16 35% | C15 50% | C16 19% | C15 31% | C16 22% | C15 38% | C16 25% | C15 41% | C16 20% | C15 35% | C16 7% | C15 9% | C16 7% | C15 12% | C16 10% | C15 17% | n.d. | n.d. | ||||||||
| kras (E62K) BE4-gam | 0/8 | n.d. | n.d. | n.d. | n.d. | n.d. | n.d. | n.d. | n.d. | – | – | ||||||||||||||||
| kras (E62K) ancBE4max | 4/7 | C17 19% | C16 21% | C17 8% | C16 11% | C17 6% | C16 8% | C17 9% | C16 10% | n.d. | n.d. | n.d. | – | – | – | ||||||||||||
| dmd (Q8*) BE4-gam | 0/8 | n.d. | n.d. | n.d. | n.d. | n.d. | n.d. | n.d. | n.d. | – | – | ||||||||||||||||
| dmd (Q8*) ancBE4max | 2/4 | 14% | 6% | n.d. | n.d. | – | – | – | – | – | – | ||||||||||||||||
| sod2 (Q145*) ancBE4max | 8/8 | 64% | 45% | 21% | 54% | 52% | 24% | 26% | 33% | – | – | ||||||||||||||||
| rb1 (W63*) ancBE4max | 8/8 | C19 n.d. | C17 91% | C16 65% | C19 21% | C17 79% | C16 75% | C19 n.d. | C17 27% | C16 18% | C19 13% | C17 81% | C16 60% | C19 8% | C17 48% | C16 33% | C19 13% | C17 76% | C16 64% | C19 13% | C17 78% | C16 69% | C19 21% | C17 77% | C16 63% | – | – |
| nras (G13S) spymac-ancBE4max | 2/4 | 19% | 18% | n.d. | n.d. | – | – | – | – | – | – | ||||||||||||||||
| tp53 (Q170*) spymac-ancBE4max | 1/4 | 16% | n.d. | n.d. | n.d. | – | – | – | – | – | – | ||||||||||||||||
Key resources table
| Reagent type (species) or resource | Designation | Source or reference | Identifiers | Additional information |
|---|---|---|---|---|
| Genetic reagent (Danio rerio) | Tg(7xTCF-Xla.Siam:GFP) | ZIRC | ZFIN ID:ZBD-ALT-110113–1 | |
| Recombinant DNA reagent | pCMV_BE4-gam (plasmid) | Addgene | Addgene:#100806 RRID:Addgene_100806 | |
| Recombinant DNA reagent | pCMV_ancBE4max (plasmid) | Addgene | Addgene:#112094 RRID:Addgene_112094 | |
| Recombinant DNA reagent | pCS2+_ancBE4max-SpymacCas9 (plasmid) | This paper | See Materials and methods | |
| Commercial assay or kit | NEBuilder HiFi DNA Assembly Cloning Kit | New England Biolabs | Catalog# E5520S | |
| Commercial assay or kit | mMESSAGE mMACHINE T7 Ultra kit | Ambion | Catalog# AM1345 | |
| Commercial assay or kit | mMESSAGE mMACHINE Sp6 kit | Ambion | Catalog# AM1340 | |
| Commercial assay or kit | PCR clean-up gel extraction kit | Macherey-Nagel | Catalog# 740609.50 | |
| Peptide, recombinant protein | Phusion high-fidelity DNA polymerase | ThermoFisher | Catalog# F-530XL | |
| Software, algorithm | SequenceParser.py | This paper | See Source code 1 |
Additional files
-
Source code 1
SequenceParser.py STOP codon design source code.
This python code highlights in capital the codons that can converted as STOP codon by C-to-T conversion with the chosen PAM sequence at the correct distance (PAM [−19, –13] bp window).
- https://cdn.elifesciences.org/articles/65552/elife-65552-code1-v2.zip
-
Transparent reporting form
- https://cdn.elifesciences.org/articles/65552/elife-65552-transrepform-v2.docx
Download links
A two-part list of links to download the article, or parts of the article, in various formats.
Downloads (link to download the article as PDF)
Open citations (links to open the citations from this article in various online reference manager services)
Cite this article (links to download the citations from this article in formats compatible with various reference manager tools)
Precise base editing for the in vivo study of developmental signaling and human pathologies in zebrafish
eLife 10:e65552.
https://doi.org/10.7554/eLife.65552


