In vivo fluorescence lifetime imaging of macrophage intracellular metabolism during wound responses in zebrafish
- Department of Medical Microbiology and Immunology, University of Wisconsin-Madison, United States
- Morgridge Institute for Research, United States
- Department of Biomedical Engineering, University of Wisconsin-Madison, United States
- Department of Biostatistics & Medical Informatics, University of Wisconsin-Madison, United States
- Department of Nutritional Sciences, University of Wisconsin-Madison, United States
- Department of Molecular Genetics and Microbiology, Duke University School of Medicine, United States
- Department of Pediatrics, University of Wisconsin-Madison, United States
Figures
Figure 1 with 1 supplement
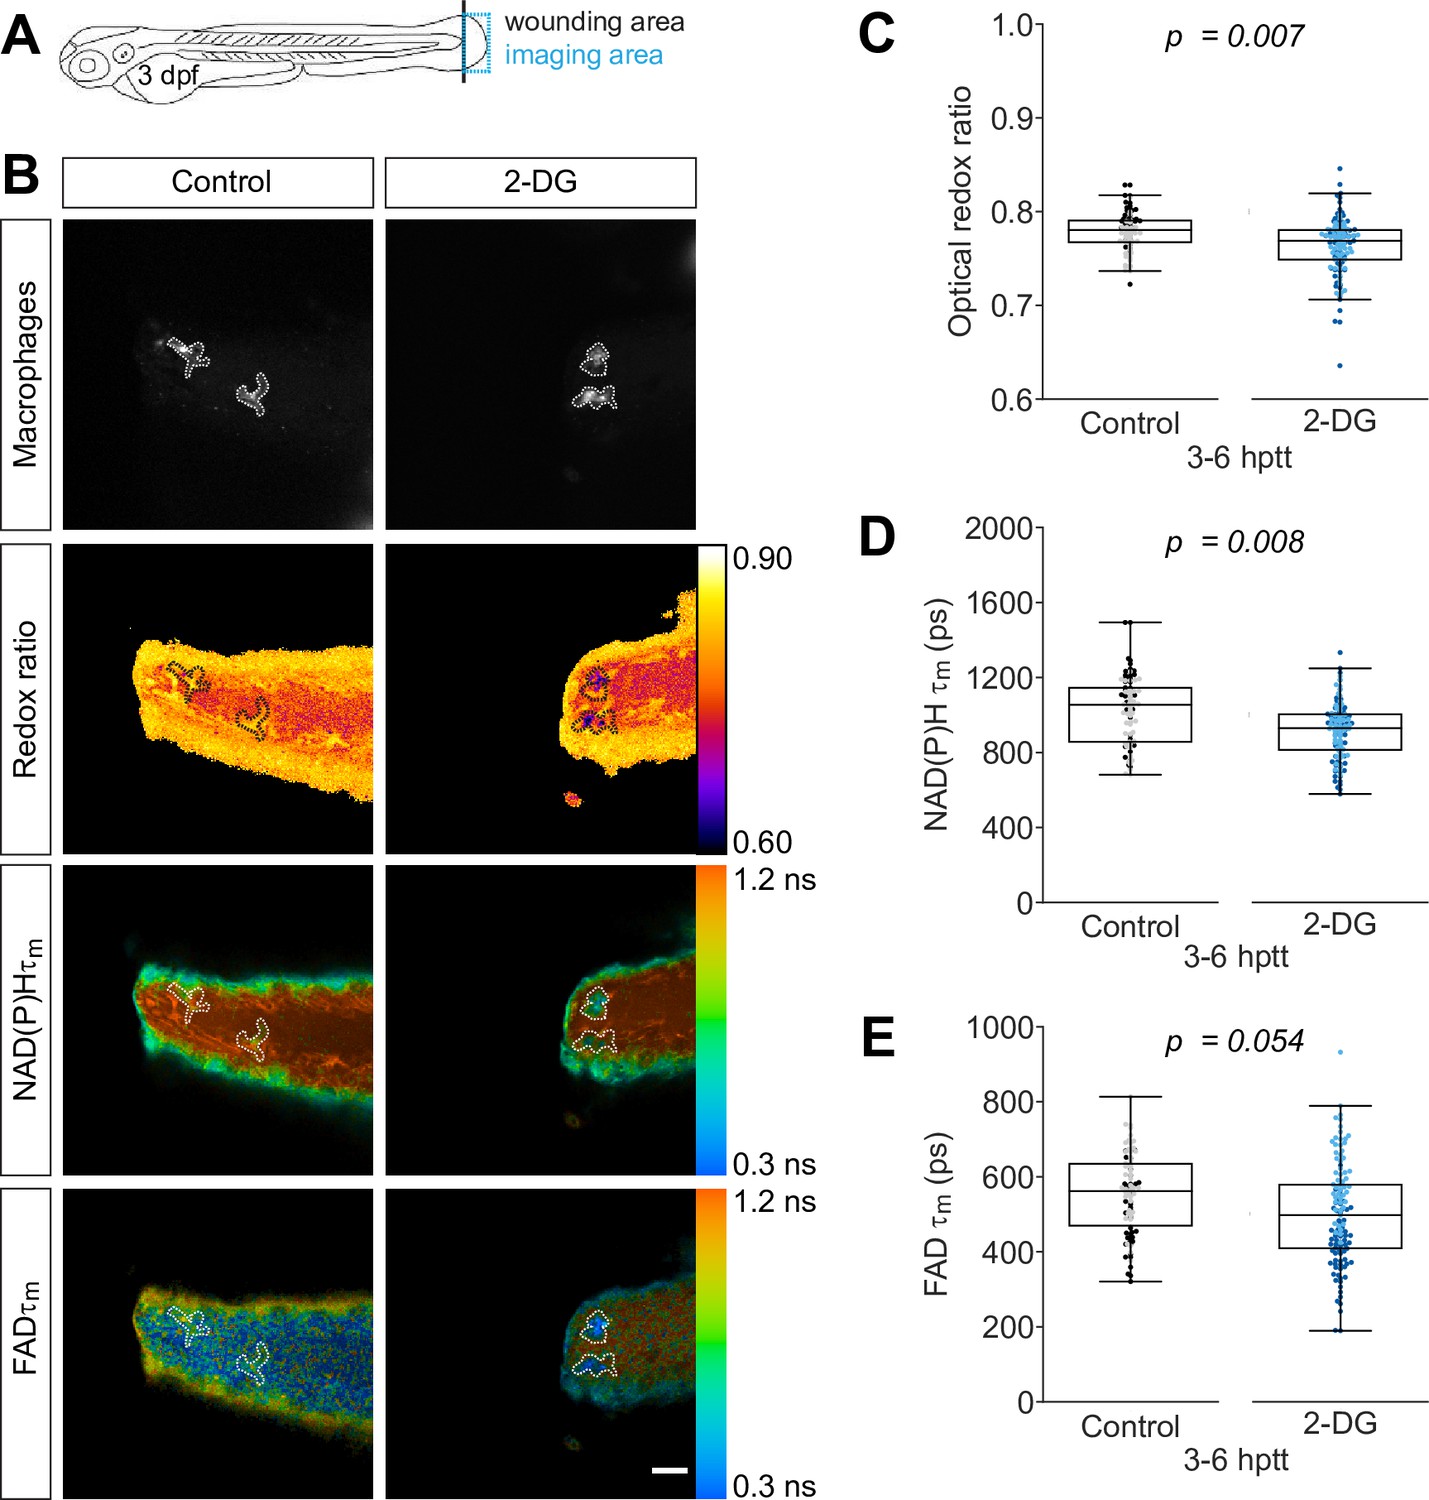
Inhibition of glycolysis reduces the optical redox ratio of macrophages following simple transection.
Tail fin transection distal to the notochord was performed using transgenic zebrafish larvae (Tg(mpeg1:mCherry-CAAX) that labels macrophages in the plasma membrane with mCherry) at 3 days post fertilization, and autofluorescence imaging of nicotinamide adenine dinucleotide (phosphate) (NAD(P)H) and flavin adenine dinucleotide (FAD) was performed on live larvae at 3–6 hr post tail transection (hptt) that were either untreated (control) or treated with 5 mM 2-deoxy-d-glucose (2-DG) (glycolysis inhibitor) for 1 hr prior to imaging. (A) Schematic showing the area where wounding (black line) and imaging (blue box) were performed. (B) Representative images of mCherry (to show macrophages), optical redox ratio, and NAD(P)H and FAD mean lifetimes () are shown; macrophages in mCherry channel were outlined with dashed lines and the area was overlaid in the optical redox ratio and lifetime images to show corresponding location; scale bar = 50 µm. Quantitative analysis of (C) optical redox ratio, (D) NAD(P)H and (E) FAD mean lifetimes () from two biological repeats (control = 90 cells/9 larvae, 2-DG = 123 cells/9 larvae) is shown; quantitative analysis of associated individual lifetime endpoints () and sample size for each repeat are included in Figure 1—figure supplement 1. The optical redox ratio and were log transformed prior to analysis. p values represent statistical analysis of the overall effects. Estimated means with 95% CI and overall effects with p values are included in Figure 1—source data 1.
-
Figure 1—source data 1
Related to Figure 1.
- https://cdn.elifesciences.org/articles/66080/elife-66080-fig1-data1-v1.xlsx
Figure 1—figure supplement 1
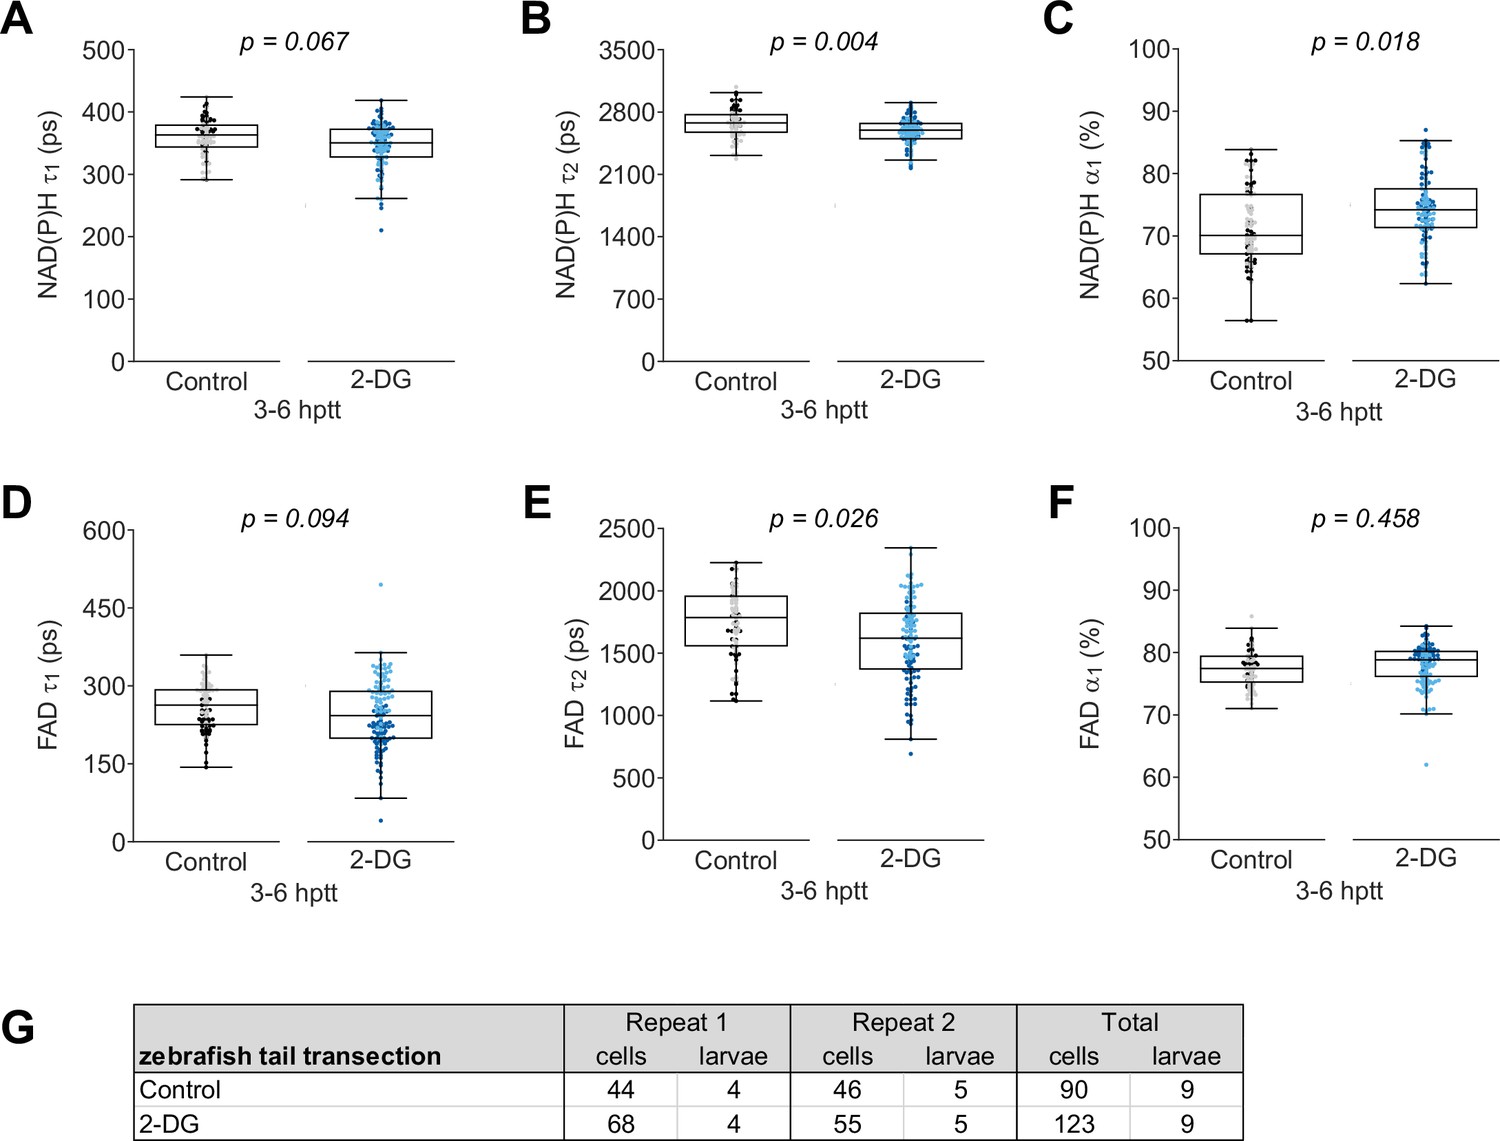
Individual nicotinamide adenine dinucleotide (phosphate) (NAD(P)H) and flavin adenine dinucleotide (FAD) fluorescence lifetime endpoints associated with Figure 1.
Quantitative analysis of (A) tau1 (), free/short lifetime of NAD(P)H, (B) tau2 (), bound/long lifetime of NAD(P)H, (C) alpha1 (), fractional component of free NAD(P)H, (D) tau1 (), bound/short lifetime of FAD, (E) tau2 (), free/long lifetime of FAD, and (F) alpha1 (), fractional component of bound FAD. All lifetime endpoints were log transformed prior to analysis. p values represent statistical analysis of the overall effects. Estimated means with 95% CI and overall effects with p values are included in Figure 1—source data 1. (G) Sample size of data set shown in Figure 1 and this supplement.
Figure 2 with 1 supplement
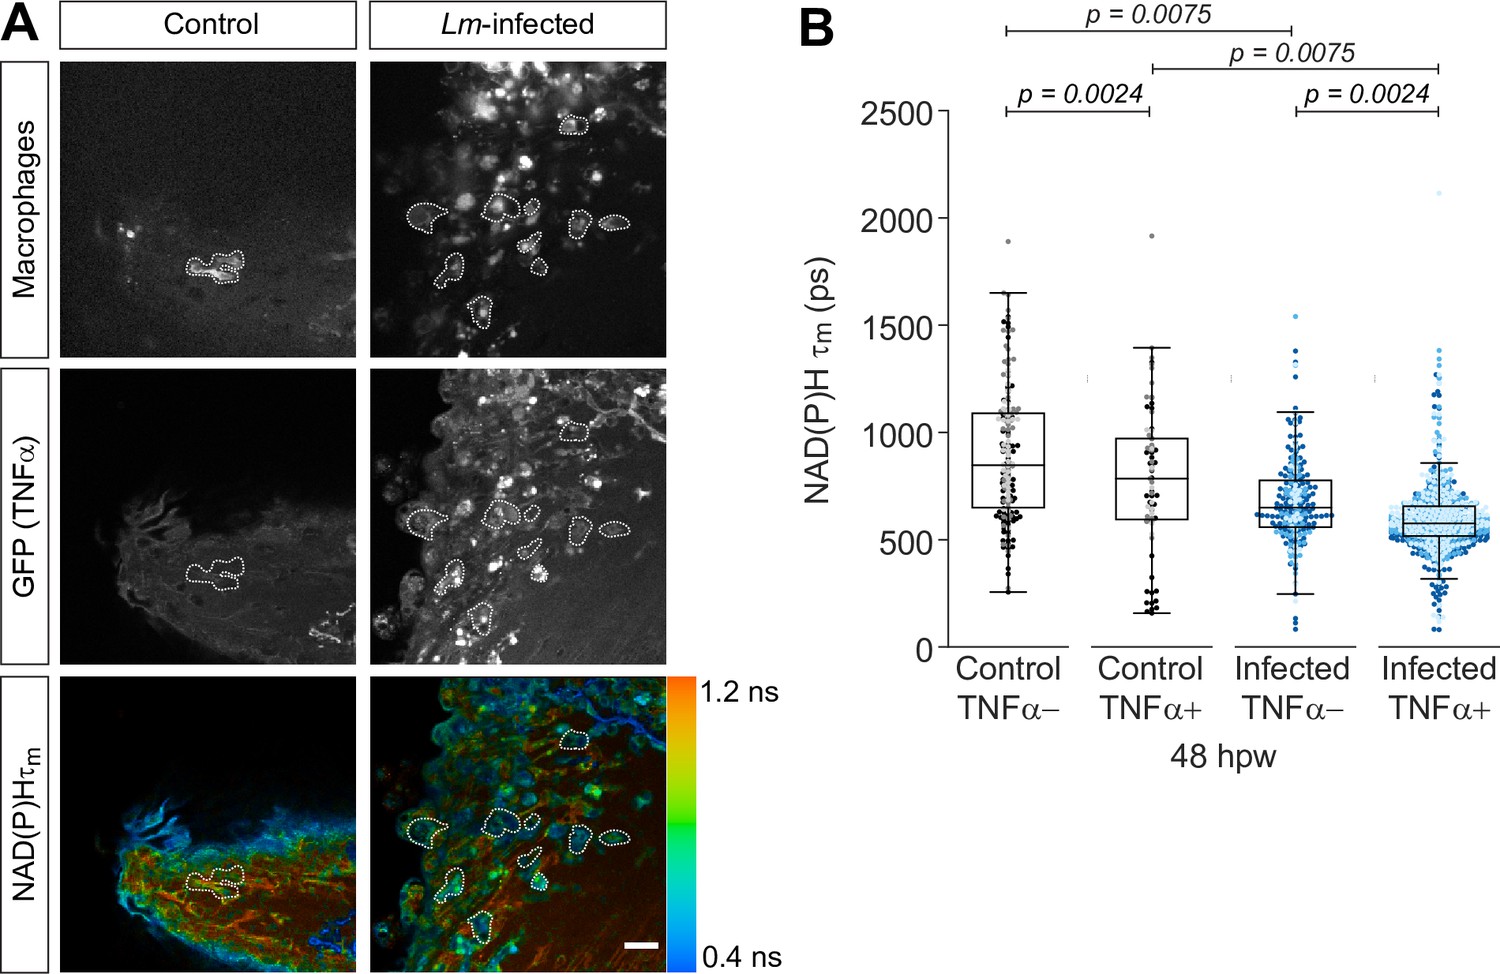
Mean lifetime of nicotinamide adenine dinucleotide (phosphate) (NAD(P)H) is reduced in TNFα+ macrophages at the infected tail wound.
Tail fin transection distal to the notochord was performed using N-phenylthiourea-treated double transgenic zebrafish larvae (Tg(tnf:GFP) x Tg(mpeg1:mCherry-CAAX), a TNFα reporter line in combination with a line that labels macrophages in the plasma membrane with mCherry) at 3 days post fertilization in the absence or presence of Listeria monocytogenes (Lm). Autofluorescence imaging of NAD(P)H was performed on live larvae at 48 hr post wound (Figure 1A). (A) Representative images of mCherry expression to show macrophages, GFP to show TNFα expression, and NAD(P)H mean lifetime () are shown for control or Lm-infected tail wounds. Macrophages in the mCherry channel were outlined with dashed lines and the area was overlaid in GFP and lifetime images to show corresponding location; in the infected condition only a few macrophages are outlined as examples; scale bar = 50 µm. (B) Quantitative analysis of NAD(P)H mean lifetime () from three biological repeats (control TNFα− = 184 cells/16 larvae, control TNFα+ = 75 cells/16 larvae, infected TNFα− = 258 cells/16 larvae, infected TNFα+ = 789 cells/16 larvae) is shown; quantitative analysis of associated individual lifetime endpoints () and sample size for each repeat are included in Figure 2—figure supplement 1. The was log transformed prior to analysis. Interaction between treatment and GFP expression was included to analyze whether either factor modified the effect of the other; no interaction was found. p values represent statistical analysis of the overall effects. Estimated means with 95% CI and overall effects with p values are included in Figure 2—source data 1.
-
Figure 2—source data 1
Related to Figure 2.
- https://cdn.elifesciences.org/articles/66080/elife-66080-fig2-data1-v1.xlsx
Figure 2—figure supplement 1
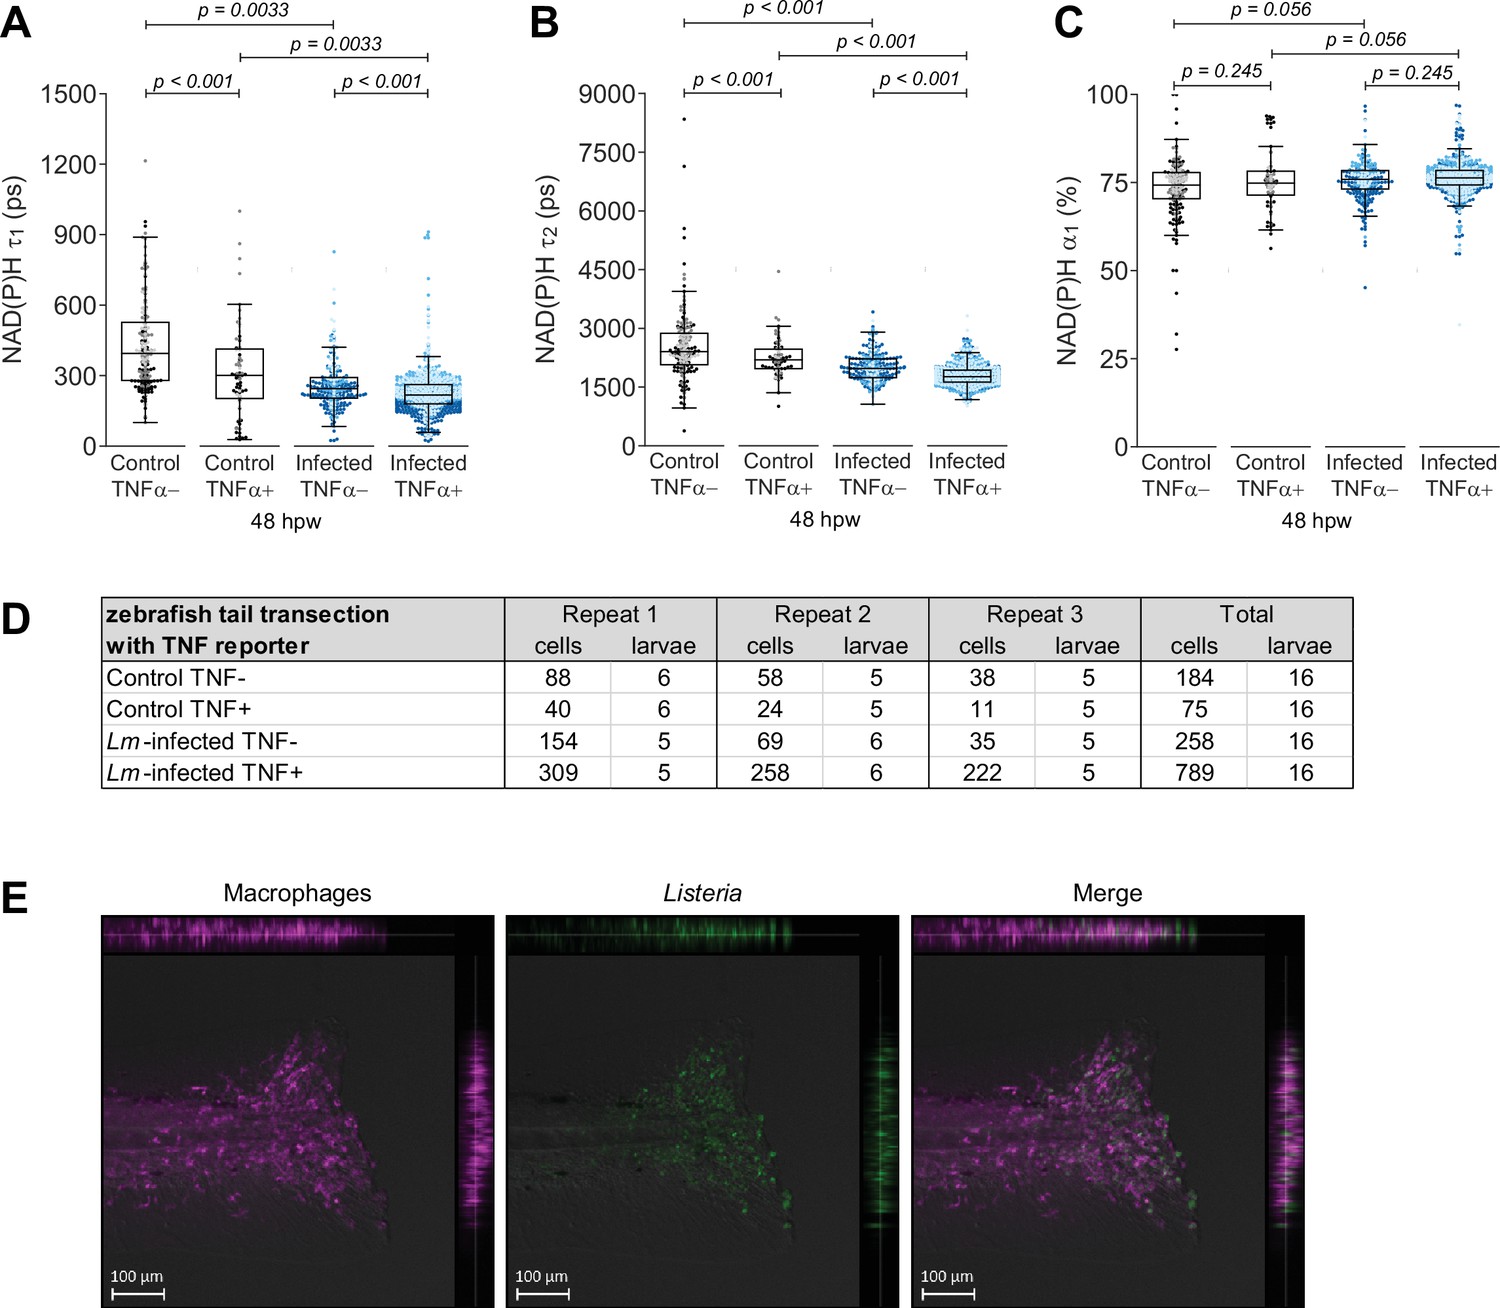
Individual nicotinamide adenine dinucleotide (phosphate) (NAD(P)H) fluorescence lifetime endpoints associated with Figure 2.
Quantitative analysis of (A) tau1 (), free/short lifetime of NAD(P)H, (B) tau2 (), bound/long lifetime of NAD(P)H, and (C) alpha1 (α1), fractional component of free NAD(P)H. The lifetime endpoints were log transformed prior to analysis. Interaction between treatment and GFP expression was included to analyze whether either factor modified the effect of the other; no interaction was found. p values represent statistical analysis of the overall effects. Estimated means with 95% CI and overall effects with p values are included in Figure 2—source data 1. (D) Sample size of data set shown in Figure 2 and this supplement. (E) Sample image set showing localization of Listeria to macrophages at the tail wound. These images were originally collected for a previous study that characterized macrophage inflammation at the infected tail wound model (Miskolci et al., 2019).
Figure 3 with 1 supplement
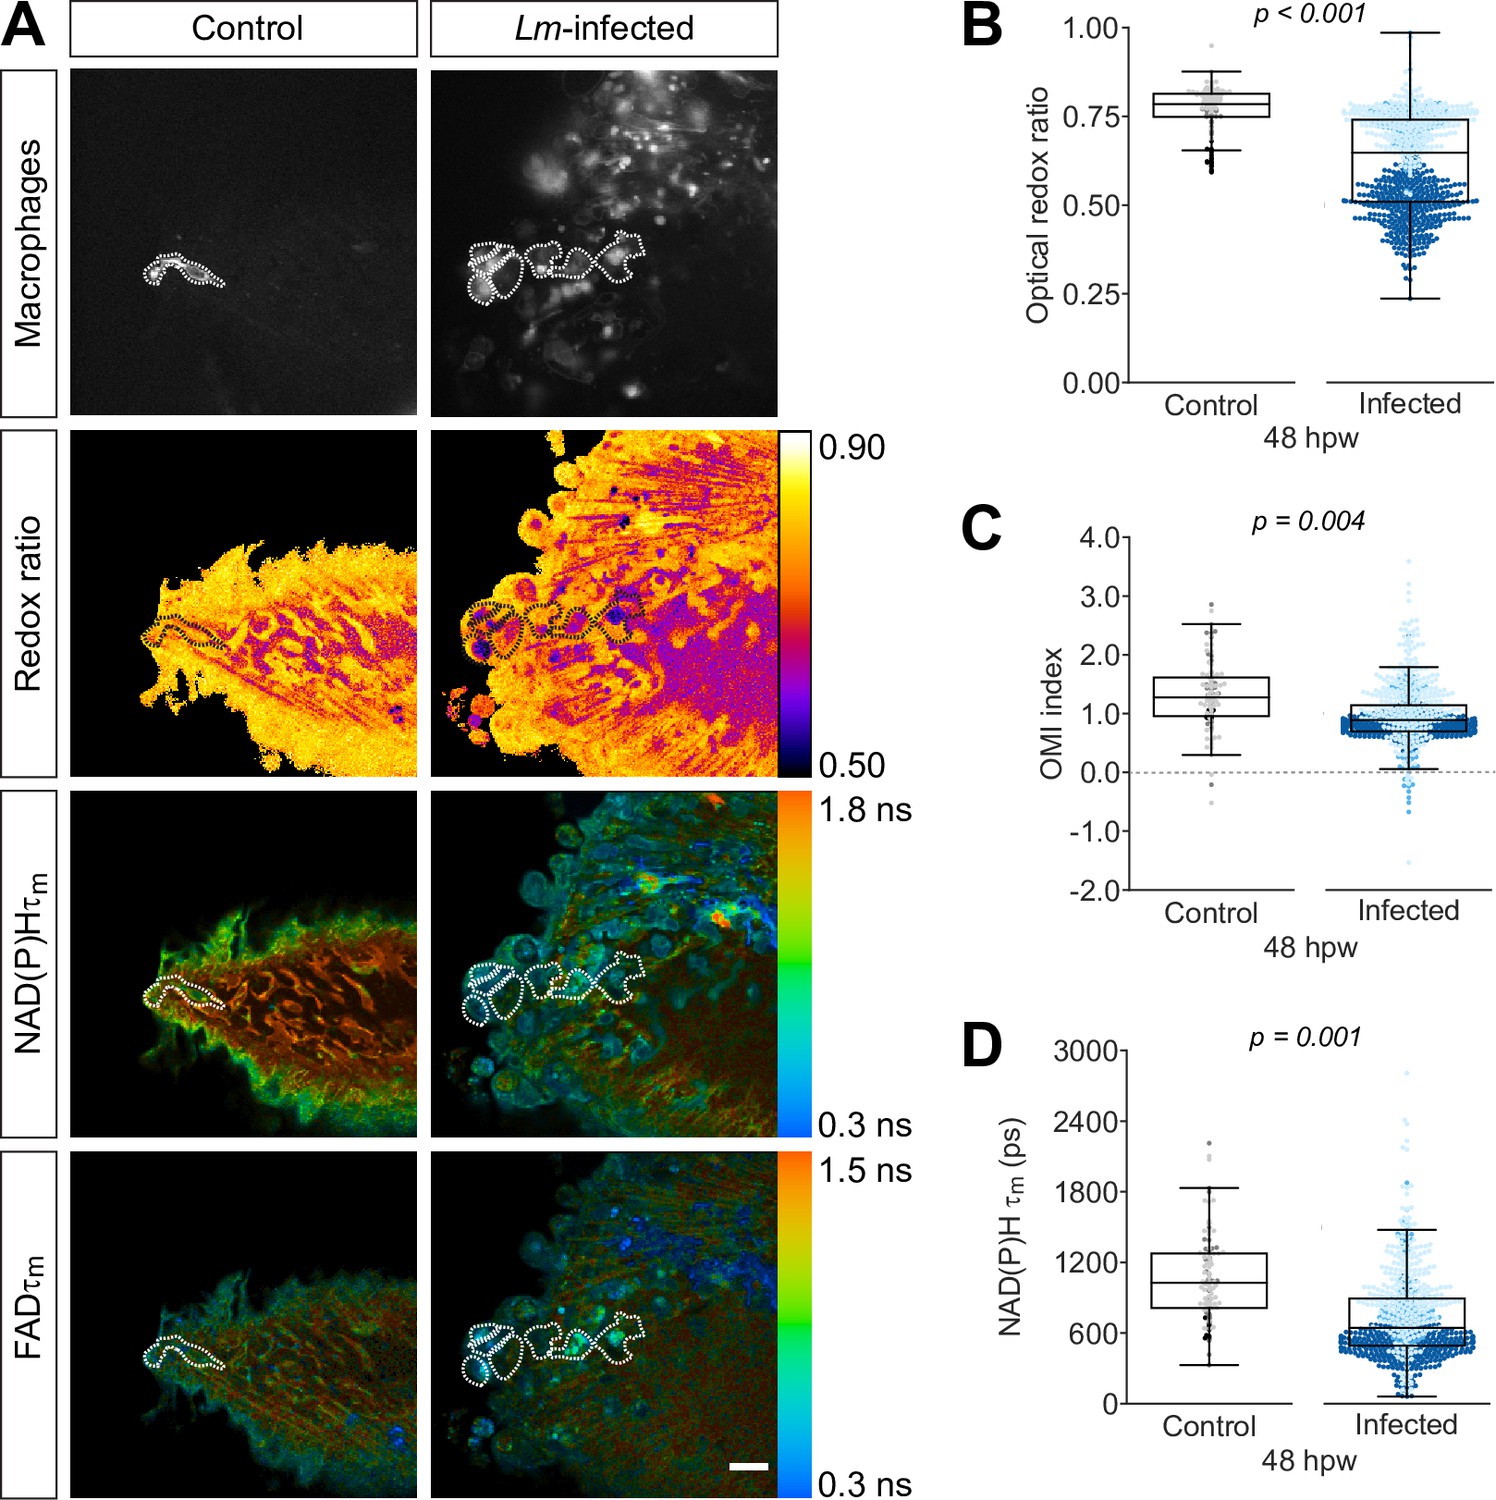
Optical redox ratio and mean lifetime of nicotinamide adenine dinucleotide (phosphate) (NAD(P)H) are reduced in macrophages at the infected tail wound.
Tail fin transection distal to the notochord was performed using transgenic zebrafish larvae (Tg(mpeg1:mCherry-CAAX) that labels macrophages in the plasma membrane with mCherry) at 3 days post fertilization in the absence or presence of Listeria monocytogenes (Lm). Autofluorescence imaging of NAD(P)H and flavin adenine dinucleotide (FAD) was performed on live larvae at 48 hr post wound (Figure 1A). (A) Representative images of mCherry expression to show macrophages, optical redox ratio, and NAD(P)H and FAD mean lifetimes () are shown for control or infected tail wounds; macrophages were outlined with dashed lines and the area was overlaid in the optical redox ratio and lifetime images to show corresponding area; in the infected condition only a few macrophages are outlined as examples; scale bar = 50 µm. Quantitative analysis of (B) optical redox ratio, (C) Optical Metabolic Imaging index, and (D) NAD(P)H mean lifetime () from three biological repeats (control = 105 cells/16 larvae, infected = 761 cells/14 larvae) is shown; quantitative analysis of associated NAD(P)H and FAD mean () and individual lifetime endpoints (), and sample size for each repeat are included in Figure 3—figure supplement 1. p values represent statistical analysis of the overall effects. Estimated means with 95% CI and overall effects with p values are included in Figure 3—source data 1.
-
Figure 3—source data 1
Related to Figure 3.
- https://cdn.elifesciences.org/articles/66080/elife-66080-fig3-data1-v1.xlsx
Figure 3—figure supplement 1
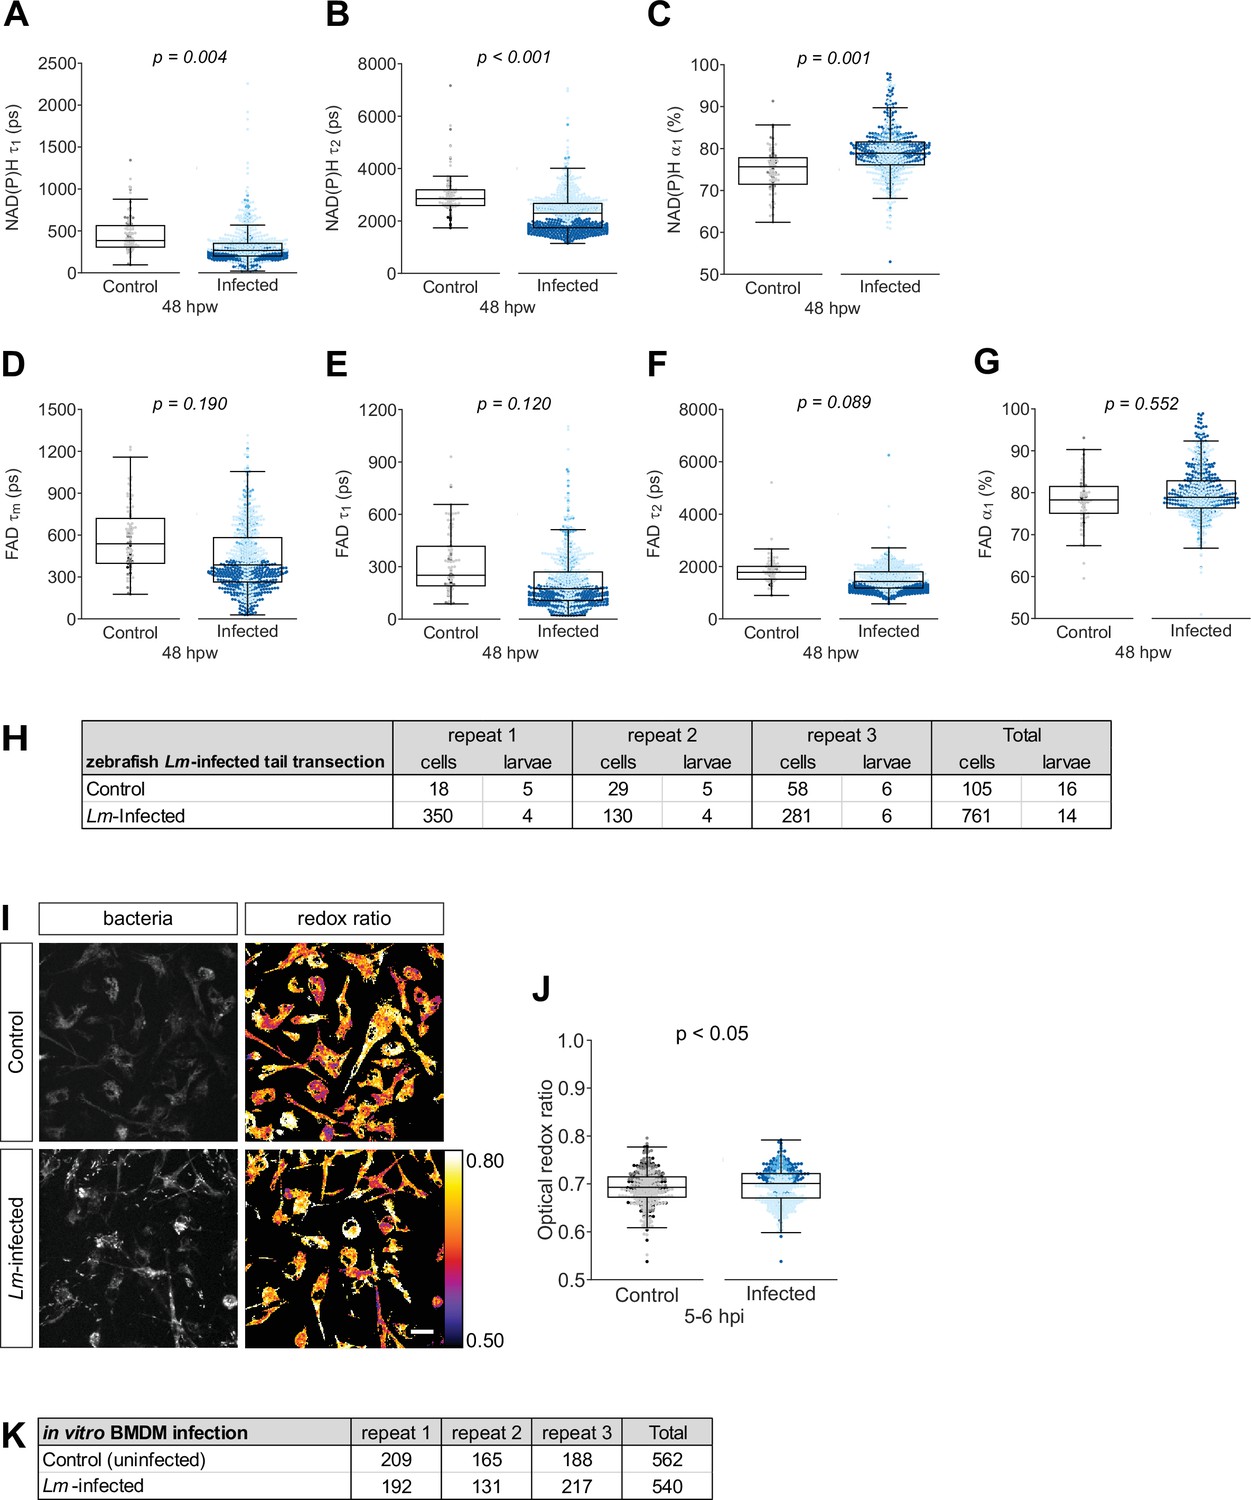
Individual nicotinamide adenine dinucleotide (phosphate) (NAD(P)H) and flavin adenine dinucleotide (FAD) fluorescence lifetime endpoints associated with Figure 3.
Quantitative analysis of (A) tau1 (), free/short lifetime of NAD(P)H, (B) tau2 (), bound/long lifetime of NAD(P)H, (C) alpha1 (α1), fractional component of free NAD(P)H, (D) mean lifetime () of FAD, (E) tau1 (), bound/short lifetime of FAD, (F) tau2 (), free/long lifetime of FAD, and (G) alpha1 (α1), fractional component of bound FAD. Log transformation was applied to and prior to analysis. p values represent statistical analysis of the overall effects. Estimated means with 95% CI and overall effects with p values are included in Figure 3—source data 1. (H) Sample size of data set shown in Figure 3 and this supplement. (I) Mouse bone marrow-derived macrophages (BMDM) were infected with mCherry-labeled Listeria monocytogenes (Lm) at multiplicity of infection (MOI) of 2, and autofluorescence imaging of NAD(P)H and FAD was performed on live cells at 5–6 hr post infection. Representative images of mCherry (to show presence of bacteria) and optical redox ratio are shown for uninfected control or Lm-infected macrophages; scale bar = 50 µm. (J) Quantitative analysis of optical redox ratio. The diffuse cytoplasmic fluorescence in the mCherry images is likely due to FAD autofluorescence (Szulczewski et al., 2016). mCherry expressed by the bacteria was used to create a mask to exclude bacterial lifetime signals from macrophage data. Results from three independent repeats (K) are shown. Statistical comparison was performed by general linear model in R. This experiment was performed as an internal control to test that changes detected by fluorescence lifetime imaging microscopy (FLIM) are consistent with changes detected by a traditional method used to study metabolism, such as mass spec analysis. A previous study used 13C-isotopolog profiling to trace carbon metabolism during infection of primary mouse macrophages with Lm, and found that infection is associated with increased glycolytic activity in the host cells (Gillmaier et al., 2012). We detected a small but significant increase in the optical redox ratio of Lm-infected BMDMs, that is consistent with the findings of Gillmaier et al. The small magnitude in change may be due to several factors: while Gillmaier et al. tested specific pathways, FLIM measures global changes in intracellular metabolism that will reflect changes in multiple pathways and might dilute the overall effect; we used a lower MOI for infection and assayed intracellular metabolism at an earlier timepoint. Nevertheless, our overall conclusions are consistent with the findings of Gillmaier et al.
Figure 4 with 1 supplement
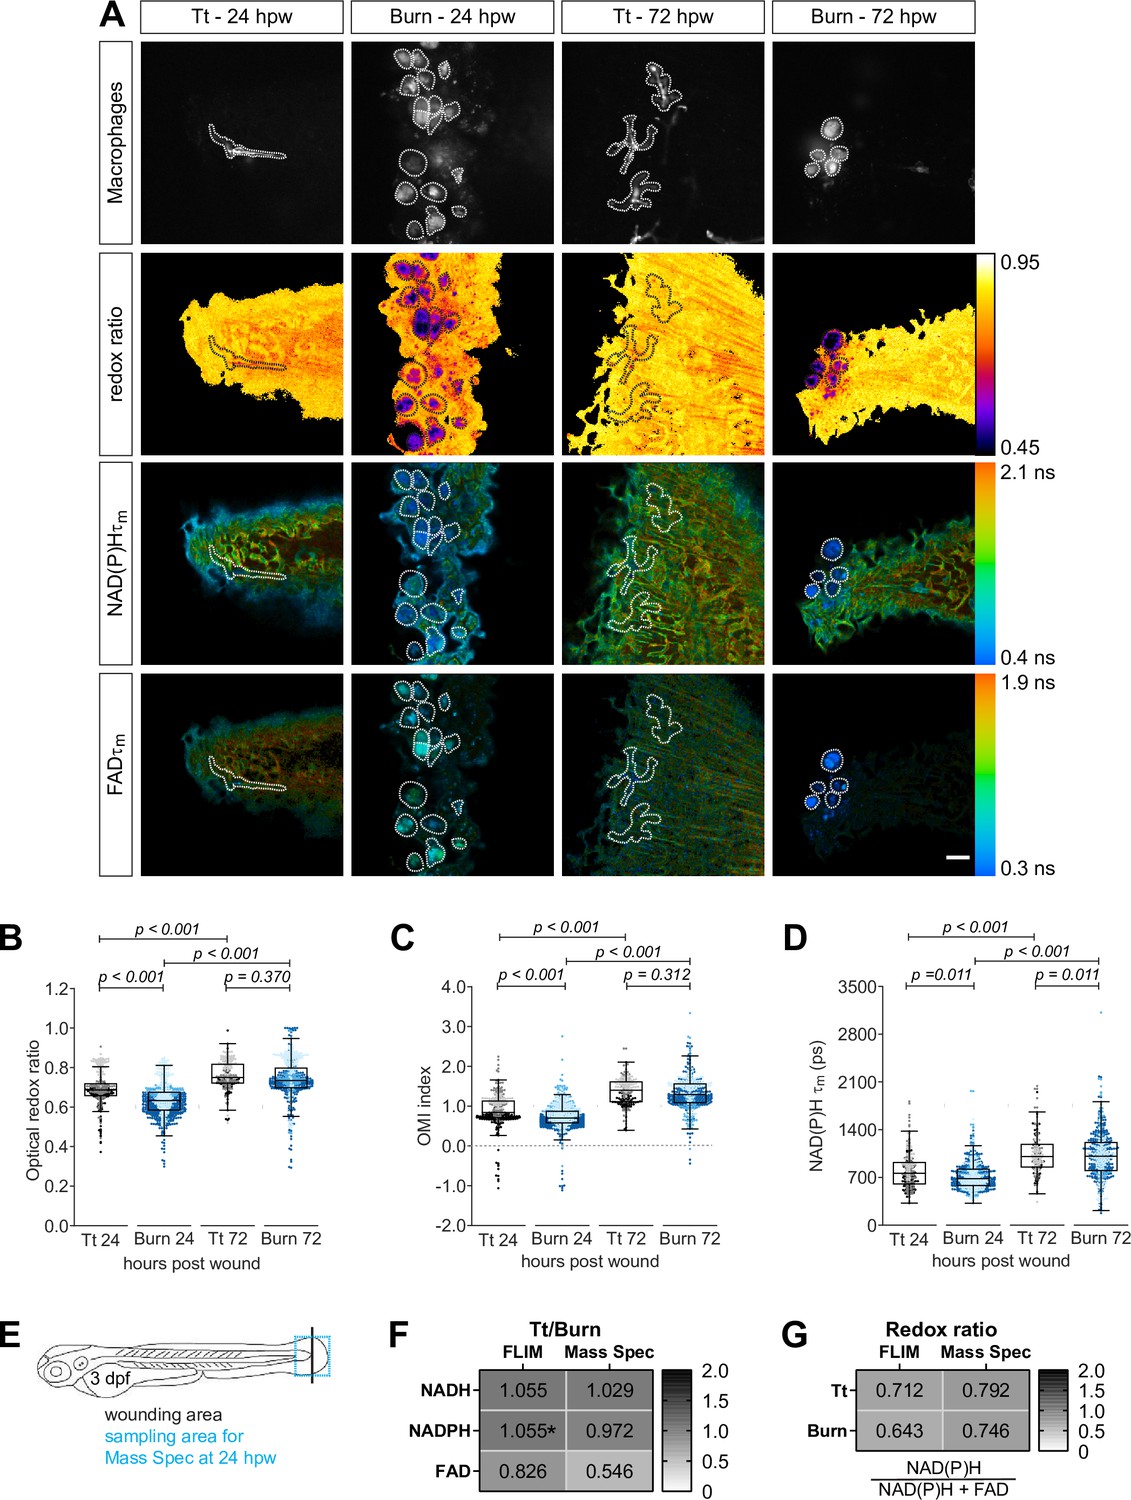
Autofluorescence imaging resolves temporal changes in the metabolic activity of macrophages at sterile tail wounds.
Tail fin transection (Tt) or thermal injury (burn) distal to the notochord was performed using transgenic zebrafish larvae (Tg(mpeg1:mCherry-CAAX) that labels macrophages in the plasma membrane with mCherry) at 3 days post fertilization. Autofluorescence imaging of nicotinamide adenine dinucleotide (phosphate) (NAD(P)H) and flavin adenine dinucleotide (FAD) was performed on live larvae at 24 and 72 hr post wound (Figure 1A). (A) Representative images of mCherry expression to show macrophages, optical redox ratio, and NAD(P)H and FAD mean lifetimes () are shown for Tt or burn wounds; macrophages were outlined with dashed lines and the area was overlaid in the optical redox ratio and lifetime images to show corresponding location of macrophages; scale bar = 50 µm. Quantitative analysis of (B) optical redox ratio, (C) Optical Metabolic Imaging index, and (D) NAD(P)H mean lifetime () from three biological repeats (Tt-24 hr = 322 cells/16 larvae, burn-24 hr = 850 cells/14 larvae, Tt-72 hr = 213 cells/12 larvae, burn-72 hr = 578 cells/11 larvae) is shown; quantitative analysis of associated NAD(P)H and FAD mean () and individual lifetime endpoints (), and sample size for each repeat are included in Figure 4—figure supplement 1. Interaction between treatment and time was included to analyze whether either factor modified the effect of the other; strong interaction was detected for the optical redox ratio. p values represent statistical analysis of the overall effects. Estimated means with 95% CI and overall effects with p values are included in Figure 4—source data 1. (E) Tail fin tissue was collected distal to the caudal vein/artery loop (blue box) 24 hr following either tail transection or thermal injury distal to the notochord (black line) for mass spec analysis of small metabolites to compare the global trend of changes in redox metabolites with that measured by autofluorescence imaging; metabolomics data shown in (E) and (F) are from four biological repeats. (F) Metabolite abundance measured by either autofluorescence imaging or mass spec in transection sample was normalized by that in burn or (G) was used to calculate the redox ratio in transection (Tt) or burn samples. We included NADPH abundance in the redox ratio calculated using mass spec measurements. *NADPH and NADH intensities could not be collected separately by autofluorescence imaging as their fluorescence spectra overlap, thereby were measured collectively.
-
Figure 4—source data 1
Related to Figure 4.
- https://cdn.elifesciences.org/articles/66080/elife-66080-fig4-data1-v1.xlsx
Figure 4—figure supplement 1
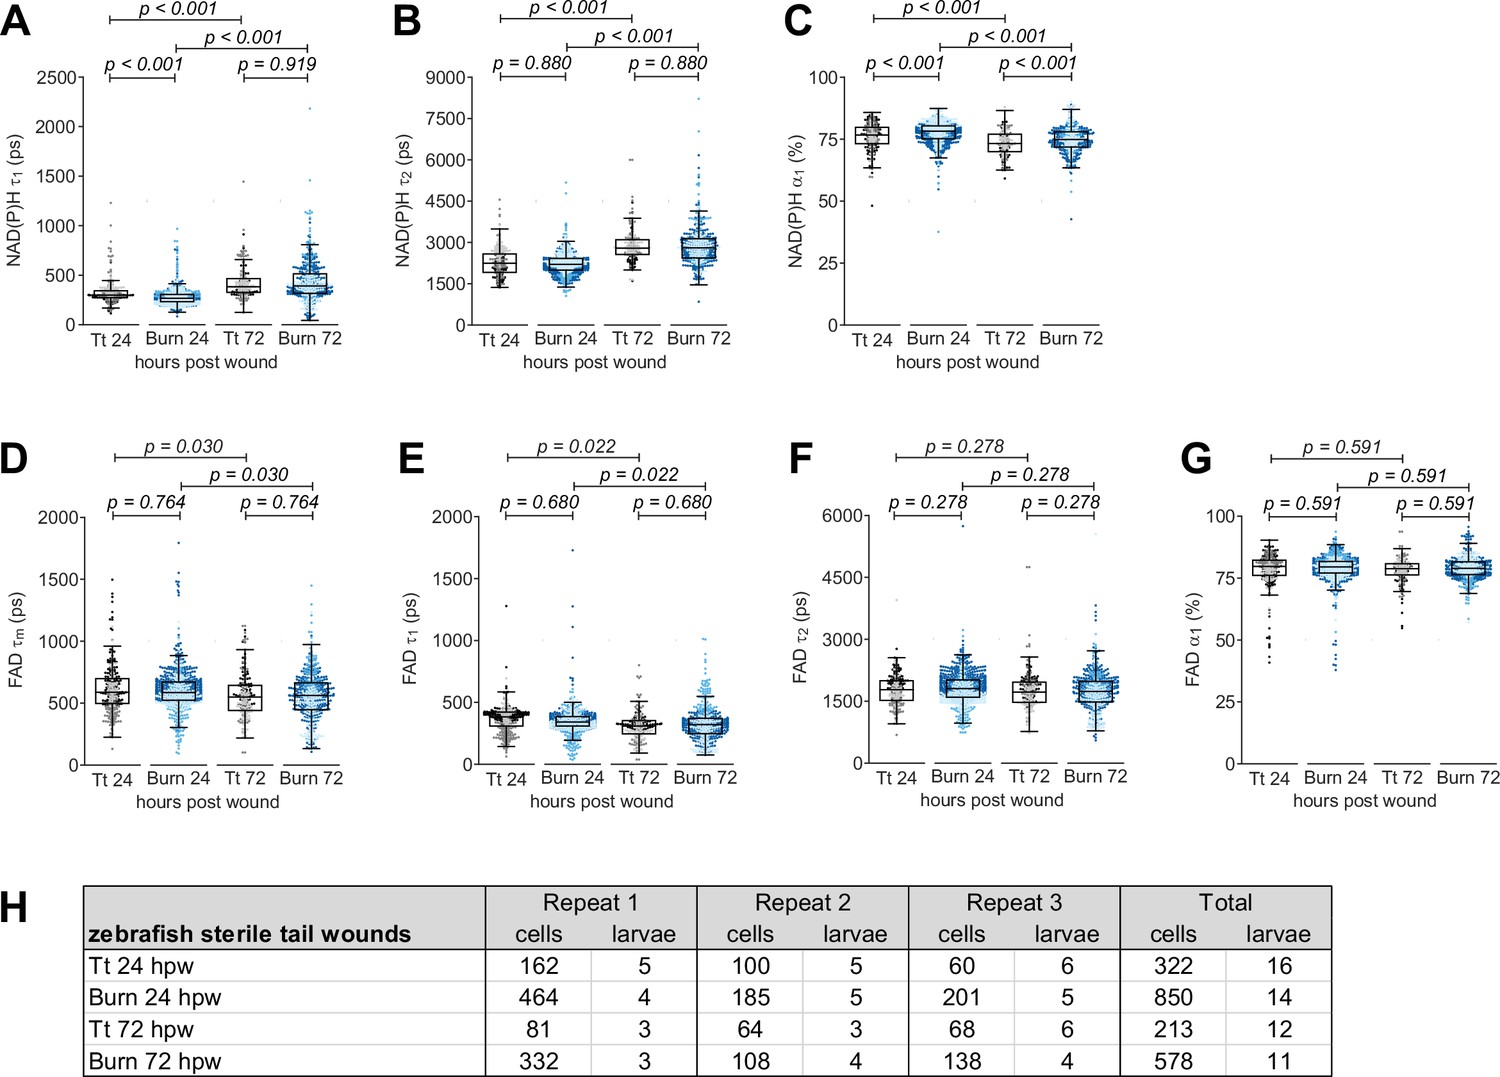
Individual nicotinamide adenine dinucleotide (phosphate) NAD(P)H and flavin adenine dinucleotide (FAD) fluorescence lifetime endpoints associated with Figure 4.
Quantitative analysis of (A) tau1 (), free/short lifetime of NAD(P)H, (B) tau2 (), bound/long lifetime of NAD(P)H, (C) alpha1 (α1), fractional component of free NAD(P)H, (D) mean lifetime () of FAD, (E) tau1 (), bound/short lifetime of FAD, (F) tau2 (), free/long lifetime of FAD, and (G) alpha1 (α1), fractional component of bound FAD. Log transformation was applied to and prior to analysis. Interaction between treatment and time was included to analyze whether either factor modified the effect of the other; weak interaction was detected for NAD(P)H . p values represent statistical analysis of the overall effects. Estimated means with 95% CI and overall effects with p values are included in Figure 4—source data 1. (H) Sample size of data set shown in Figure 4 and this supplement.
Figure 5 with 1 supplement
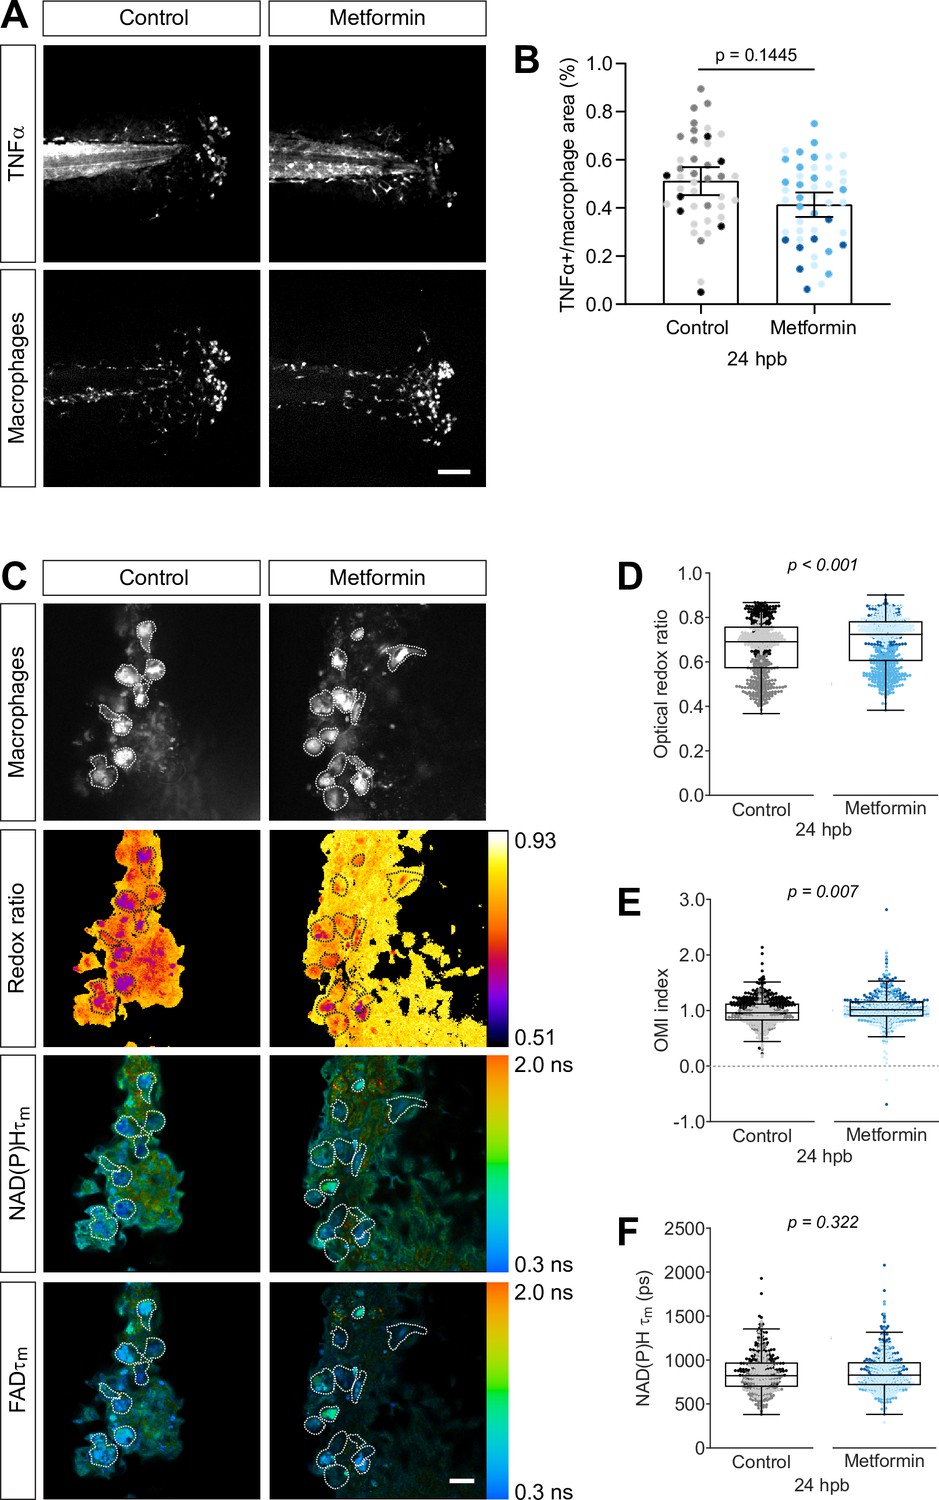
Metformin treatment increases optical redox ratio of macrophages.
(A, B) Thermal injury (burn) distal to the notochord was performed using double transgenic zebrafish larvae (Tg(tnf:GFP x mpeg1:mCherry-CAAX) that labels macrophages in the plasma membrane with mCherry, and monitors TNFα expression using GFP-based TNFα reporter) at 3 days post fertilization (dpf), that were either untreated (control) or treated with 1 mM metformin starting at 1 dpf; larvae were fixed at 24 hr post burn (hpb). (A) Representative images of sum projections of z-stacks acquired by spinning disk confocal microscopy are shown; scale bar = 100 μm. (B) TNFα expression in macrophages were quantified by area thresholding of GFP and mCherry intensities, and is displayed as proportional area per larva with bars showing arithmetic mean and 95% CI; results are from three biological repeats (control = 42, metformin = 46 larvae). (C–F) Thermal injury distal to the notochord was performed using control or metformin-treated transgenic zebrafish larvae (Tg(mpeg1:mCherry-CAAX)) at 3 dpf. Autofluorescence imaging of nicotinamide adenine dinucleotide (phosphate) (NAD(P)H) and flavin adenine dinucleotide (FAD) was performed on live larvae at 24 hpb. (C) Representative images of mCherry expression to show macrophages, optical redox ratio, and NAD(P)H and FAD mean lifetimes () are shown; scale bar = 50 µm. Quantitative analysis of (D) optical redox ratio, (E) Optical Metabolic Imaging index, and (F) NAD(P)H mean lifetime () from three biological repeats (control = 632 cells/13 larvae, metformin = 670 cells/14 larvae) is shown; quantitative analysis of associated NAD(P)H and FAD mean () and individual lifetime endpoints (), and sample size for each repeat are included in Figure 5—figure supplement 1. Log transformation was applied to optical redox ratio prior to analysis. p values represent statistical analysis of the overall effects. Estimated means with 95% CI and overall effects with p values are included in Figure 5—source data 1.
-
Figure 5—source data 1
Related to Figure 5.
- https://cdn.elifesciences.org/articles/66080/elife-66080-fig5-data1-v1.xlsx
Figure 5—figure supplement 1
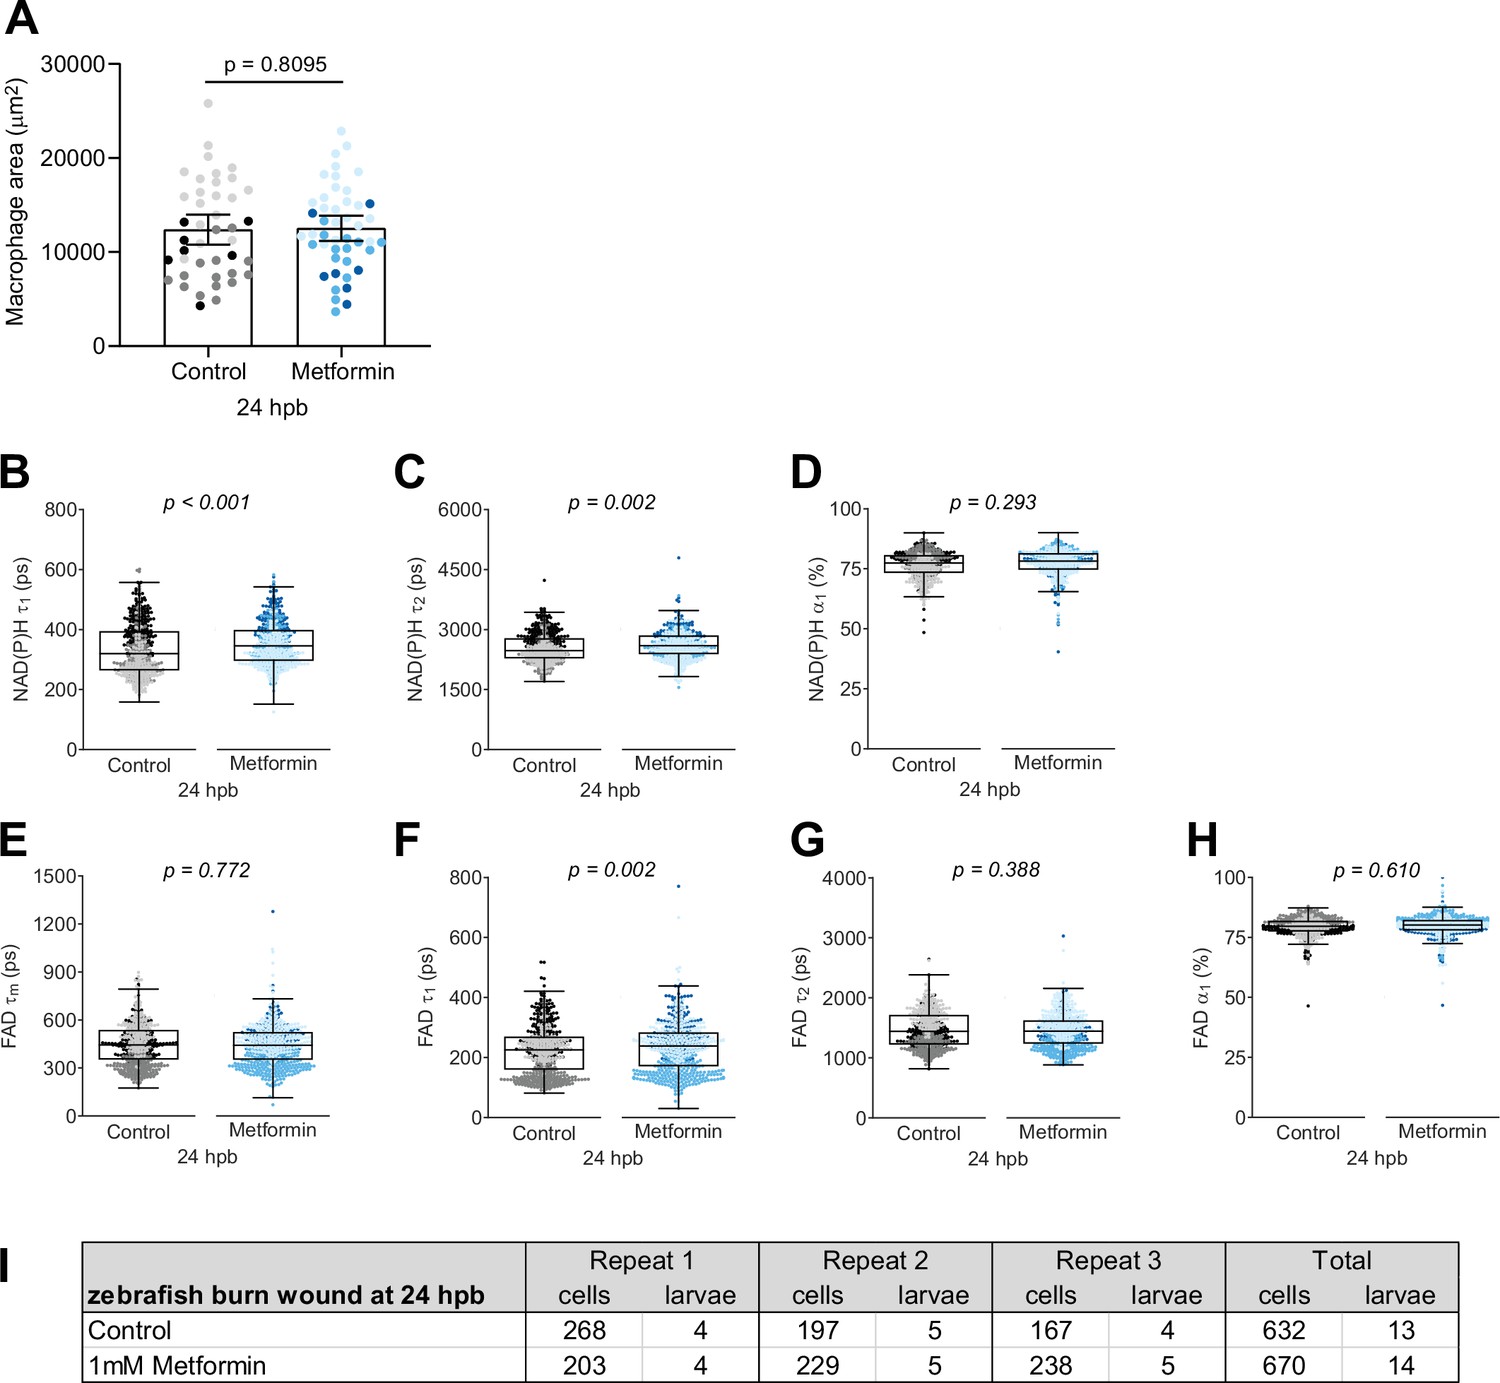
Individual nicotinamide adenine dinucleotide (phosphate) (NAD(P)H) and flavin adenine dinucleotide (FAD) fluorescence lifetime endpoints associated with Figure 5.
(A) Quantitative analysis of total macrophages at the burn wound by area of mCherry intensity, with bars showing arithmetic mean and 95% CI. Quantitative analysis of (B) tau1 (), free/short lifetime of NAD(P)H, (C) tau2 (), bound/long lifetime of NAD(P)H, (D) alpha1 (α1), fractional component of free NAD(P)H, (E) mean lifetime () of FAD, (F) tau1 (), bound/short lifetime of FAD, (G) tau2 (), free/long lifetime of FAD, and (H) alpha1 (α1), fractional component of bound FAD. Log transformation was applied to prior to analysis. p values represent statistical analysis of the overall effects. Estimated means with 95% CI and overall effects with p values are included in Figure 5—source data 1. (I) Sample size of autofluorescence imaging data set shown in Figure 5 and this supplement.
Figure 6 with 1 supplement
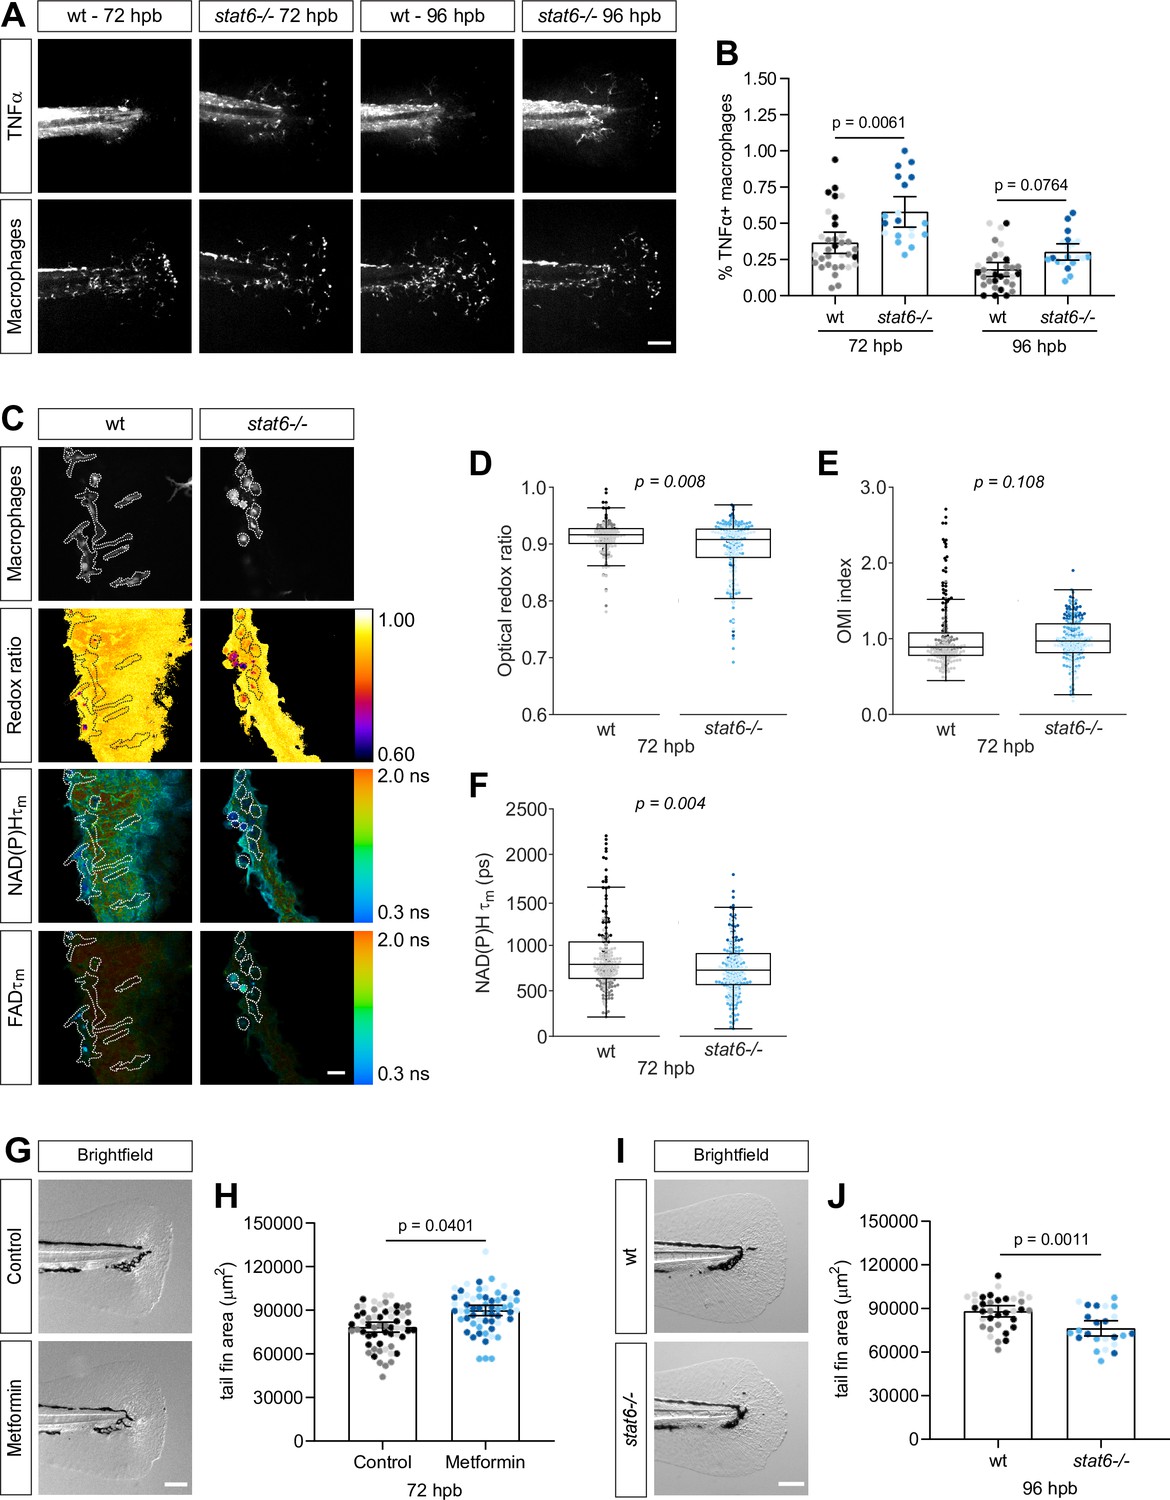
Macrophage metabolic switches are associated with changes in tissue repair.
(A–B) Thermal injury distal to the notochord was performed using N-phenylthiourea-treated double transgenic wild-type (wt) or stat6-deficient zebrafish larvae (Tg(tnf:GFP x mpeg1:mCherry-CAAX)) at 3 days post fertilization (dpf); larvae were fixed at 72 and 96 hr post burn (hpb). (A) Representative images of sum projections of z-stacks acquired by spinning disk confocal microscopy are shown; scale bar = 100 μm. (B) TNFα expression in macrophages was quantified by scoring cells for GFP signal and is displayed as proportion of TNFα+ cells per larva with bars showing arithmetic mean and 95% CI; results are from three biological repeats (wt = 33, stat6−/− = 46 at 72 hpb, wt = 33, stat6−/− = 20 larvae at 96 hpb). Larvae were generated by a het incross and genotyped post imaging; only wt and stat6−/− larvae were analyzed. (C–F) Thermal injury distal to the notochord was performed using transgenic zebrafish larvae (Tg(mpeg1:mCherry-CAAX)) in wt- or stat6-deficient background at 3 dpf. Autofluorescence imaging of nicotinamide adenine dinucleotide (phosphate) (NAD(P)H) and flavin adenine dinucleotide (FAD) was performed on live larvae at 72 hpb. (C) Representative images of mCherry expression to show macrophages, optical redox ratio, and NAD(P)H and FAD mean lifetimes () are shown; macrophages were outlined with dashed lines and the area was overlaid in the optical redox ratio and lifetime images to show corresponding location of macrophages; scale bar = 50 µm. Quantitative analysis of (D) optical redox ratio, (E) Optical Metabolic Imaging index, and (F) NAD(P)H mean lifetime () from three biological repeats (wt = 217 cells/12 larvae, stat6−/− = 272 cells/12 larvae) is shown; quantitative analysis of associated NAD(P)H and FAD mean () and individual lifetime endpoints (), and sample size for each repeat are included in Figure 6—figure supplement 1. p values represent statistical analysis of the overall effects. Estimated means with 95% CI and overall effects with p values are included in Figure 6—source data 1. (G) Control or metformin-treated larvae were fixed at 72 hpb following thermal injury of the tail fin. Representative single-plane brightfield images are shown; scale bar = 100 μm. (H) Quantitative analysis of tail fin tissue regrowth area per larva, displayed with bars showing arithmetic mean and 95% CI. Results are from three biological repeats (control = 59, metformin = 60 larvae). (I) Wt- or stat6-deficient larvae were fixed at 96 hpb following thermal injury of the tail fin. Representative single-plane brightfield images are shown; scale bar = 100 μm. (J) Quantitative analysis of tail fin tissue regrowth area per larva, displayed with bars showing arithmetic mean and 95% CI. Results are from three biological repeats (wt = 36, stat6−/− = 24 larvae). Larvae were generated by a het incross and genotyped post imaging; statistical analysis was performed on wt, stat6± and stat6−/−; only wt and stat6−/− larvae are shown.
-
Figure 6—source data 1
Related to Figure 6.
- https://cdn.elifesciences.org/articles/66080/elife-66080-fig6-data1-v1.xlsx
Figure 6—figure supplement 1
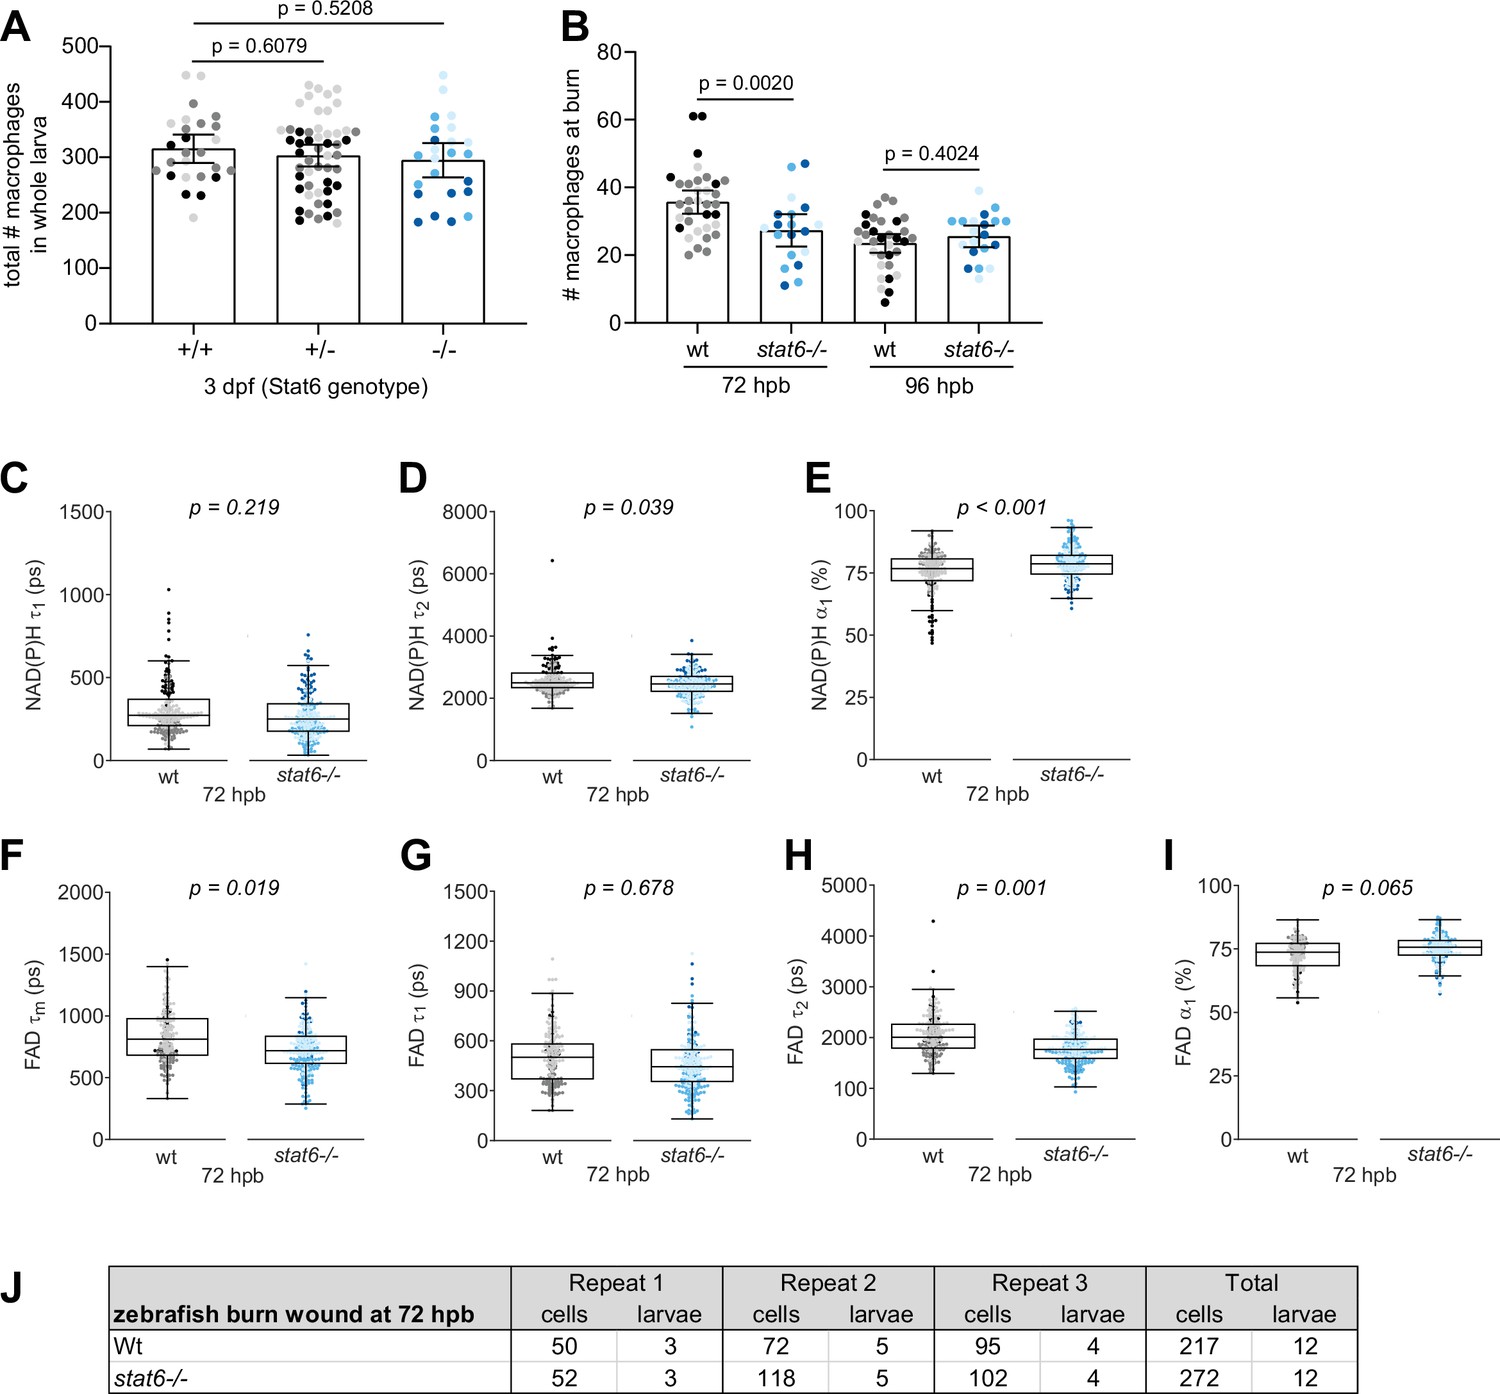
Individual nicotinamide adenine dinucleotide (phosphate) NAD(P)H and flavin adenine dinucleotide (FAD) fluorescence lifetime endpoints associated with Figure 6.
(A) Total number of macrophages in whole larvae displayed with bars showing arithmetic mean and 95% CI; larvae were generated by a het incross and genotyped post imaging; results are from three biological repeats (wild-type (+/+) = 26, stat6+/− = 52, stat6−/− = 24). (B) Number of macrophages at the burn wound with bars showing arithmetic mean and 95% CI. Quantitative analysis of (C) tau1 (), free/short lifetime of NAD(P)H, (D) tau2 (), bound/long lifetime of NAD(P)H, (E) alpha1 (α1), fractional component of free NAD(P)H, (F) mean lifetime () of FAD, (G) tau1 (), bound/short lifetime of FAD, (H) tau2 (), free/long lifetime of FAD and (I) alpha1 (α1), fractional component of bound FAD. p values represent statistical analysis of the overall effects. Estimated means with 95% CI and overall effects with p values are included in Figure 6—source data 1. (J) Sample size of autofluorescence imaging data set shown in Figure 6 and this supplement.
Author response image 1
Author response image 2

Tables
Table 1
Definition of autofluorescence imaging endpoints.
| Endpoints | Definition | Interpretation |
|---|---|---|
| Optical redox ratio Chance et al., 1979 | Increase in optical redox ratio (ORR) = more reduced intracellular environment; likely increase in glycolysis; decrease in ORR = more oxidized intracellular environment; likely decrease in glycolysis. (I, intensity) | |
| Nicotinamide adenine dinucleotide (phosphate) (NAD(P)H) | Short lifetime of NAD(P)H | Free/unbound NAD(P)H |
| NAD(P)H | Long lifetime of NAD(P)H | NAD(P)H bound to a protein |
| NAD(P)H | Fractional component of free NAD(P)H | is fractional component of bound NAD(P)H, ; quantifies the pools of NAD(P)H in free and bound states |
| NAD(P)H mean lifetime () | Weighted average of individual lifetime endpoints (); one can look at changes in individual endpoints to see what drives changes in ; for instance, a decrease in can be due to increase in , decrease in , and/or decrease in | |
| Flavin adenine dinucleotide (FAD) | Short lifetime of FAD | FAD bound to a protein |
| FAD | Long lifetime of FAD | Free/unbound FAD |
| FAD | Fractional component of bound FAD | is fractional component of free FAD, ; quantifies the pools of FAD in free and bound states |
| FAD | Weighted average of individual lifetime endpoints (); one can look at changes in individual endpoints to see what drives changes in ; for instance, a decrease in can be due to increase in , decrease in , and/or decrease in | |
| Optical Metabolic Imaging (OMI) index Walsh and Skala, 2015 | Composite measure of mean-centered optical redox ratio and mean lifetimes of NAD(P)H and FAD; increase in the OMI index corresponds to increased redox ratio, and increased NAD(P)H and FAD protein-binding activities |
Table 2
Summary of changes in optical redox ratio, Optical Metabolic Imaging (OMI) index, and nicotinamide adenine dinucleotide (phosphate) (NAD(P)H) lifetime endpoints.
Changes in treated samples are shown relative to the control. Control, simple tail transection (uninfected); nd, not different.
| Control versus | 2-Deoxy-d-glucose | Lm-infected wound TNFα− | Lm-infected wound TNFα+ | Lm-infected wound | Burn wound24 hr | Burn wound72 hr |
|---|---|---|---|---|---|---|
| Optical redox ratio | ↓ | - | - | ↓ | ↓ | nd |
| OMI index | - | - | - | ↓ | ↓ | nd |
| NAD(P)H | ↓ | ↓ | ↓ | ↓ | ↓ | ↓ |
| NAD(P)H | nd | ↓ | ↓ | ↓ | ↓ | nd |
| NAD(P)H | ↓ | ↓ | ↓ | ↓ | nd | nd |
| NAD(P)H | ↑ | nd | nd | ↑ | ↑ | ↑ |
Key resources table
| Reagent type (species) or resource | Designation | Source or reference | Identifiers | Additional information |
|---|---|---|---|---|
| Strain, strain background (10,403 S) | Listeria monocytogenes (strain 10,403 S) | PMID:26468080 | Was be obtained from JD Sauer Lab, University of Wisconsin - Madison | |
| Strain, strain background (Danio rerio) | WT (AB) | ZIRC | ZL1 | https://zebrafish.org/home/guide.php |
| Strain, strain background (D. rerio) | Tg(tnf:GFP) (AB) | PMID:25730872 | Was obtained from Michel Bagnat Lab, Duke University | |
| Strain, strain background (D. rerio) | Tg(mpeg1:histone2b-GFP) (AB) | PMID:31259685 | Can be obtained from Anna Huttenlocher Lab, University of Wisconsin - Madison | |
| Strain, strain background (D. rerio) | Tg(mpeg1:mCherry-CAAX) (albino) | PMID:26887656 | Was obtained from Leonard Zon Lab, Boston Children’s Hospital, Dana Farber Cancer Institute | |
| Strain, strain background (D. rerio) | stat6 mutant (AB) | PMID:33761328 | Was obtained from David Tobin Lab, Duke University | |
| Chemical compound, drug | Metformin | Enzo Life Sciences, cat no ALX-270–432 G005 | https://www.enzolifesciences.com/ALX-270-432/metformin/ | 1 mM in E3, bathing, start treatment at 1 day post fertilization, refresh daily |
| Chemical compound, drug | 2-Deoxy-d-glucose | Sigma, cat no D8375 | https://www.sigmaaldrich.com/US/en/product/sigma/d8375 | 5 mM in E3, bathing, 1 hr pretreatment right before imaging |
| Software, algorithm | GraphPad Prism | RRID:SCR_002798 | https://www.graphpad.com/scientific-software/prism/ | |
| Software, algorithm | SAS | RRID:SCR_008567 | https://www.sas.com/en_us/home.html | |
| Software, algorithm | Fiji, ImageJ | Schindelin et al., 2012 | RRID:SCR_002285 | https://fiji.sc/ |
| Software, algorithm | Cell profiler | RRID:SCR_007358 | https://cellprofiler.org/ | |
| Software, algorithm | Matplotlib | RRID:SCR_008624 | https://matplotlib.org/ | |
| Software, algorithm | R project for statistical computing | R Core Team, 2019 | RRID:SCR_001905 | https://www.r-project.org/ |
| Software, algorithm | MATLAB R2019b | https://www.mathworks.com/ | ||
| Software, algorithm | SPCImage 7.4 | https://www.becker-hickl.com/products/spcimage/ | ||
| Other | Line-powered thermal cautery instrument | Stoelting | 59,005 | https://stoeltingco.com/Neuroscience/Thermal-Cautery-Instruments~9879 |
| Other | Type E tip for cautery instrument | Stoelting | 59,010 | https://stoeltingco.com/Neuroscience/Thermal-Cautery-Instruments~9879 |
Additional files
Download links
A two-part list of links to download the article, or parts of the article, in various formats.
Downloads (link to download the article as PDF)
Open citations (links to open the citations from this article in various online reference manager services)
Cite this article (links to download the citations from this article in formats compatible with various reference manager tools)
In vivo fluorescence lifetime imaging of macrophage intracellular metabolism during wound responses in zebrafish
eLife 11:e66080.
https://doi.org/10.7554/eLife.66080


