A systematic CRISPR screen reveals an IL-20/IL20RA-mediated immune crosstalk to prevent the ovarian cancer metastasis
- The School of Medicine, Nankai University, China
- Department of Lung Cancer Surgery, Tianjin Medical University General Hospital, China
- Research Institute of Obstetrics and Gynecology, Tianjin Central Hospital of Obstetrics and Gynecology, China
- Department of Gynecological Oncology, Tianjin Central Hospital of Obstetrics and Gynecology, China
Figures
Figure 1 with 1 supplement
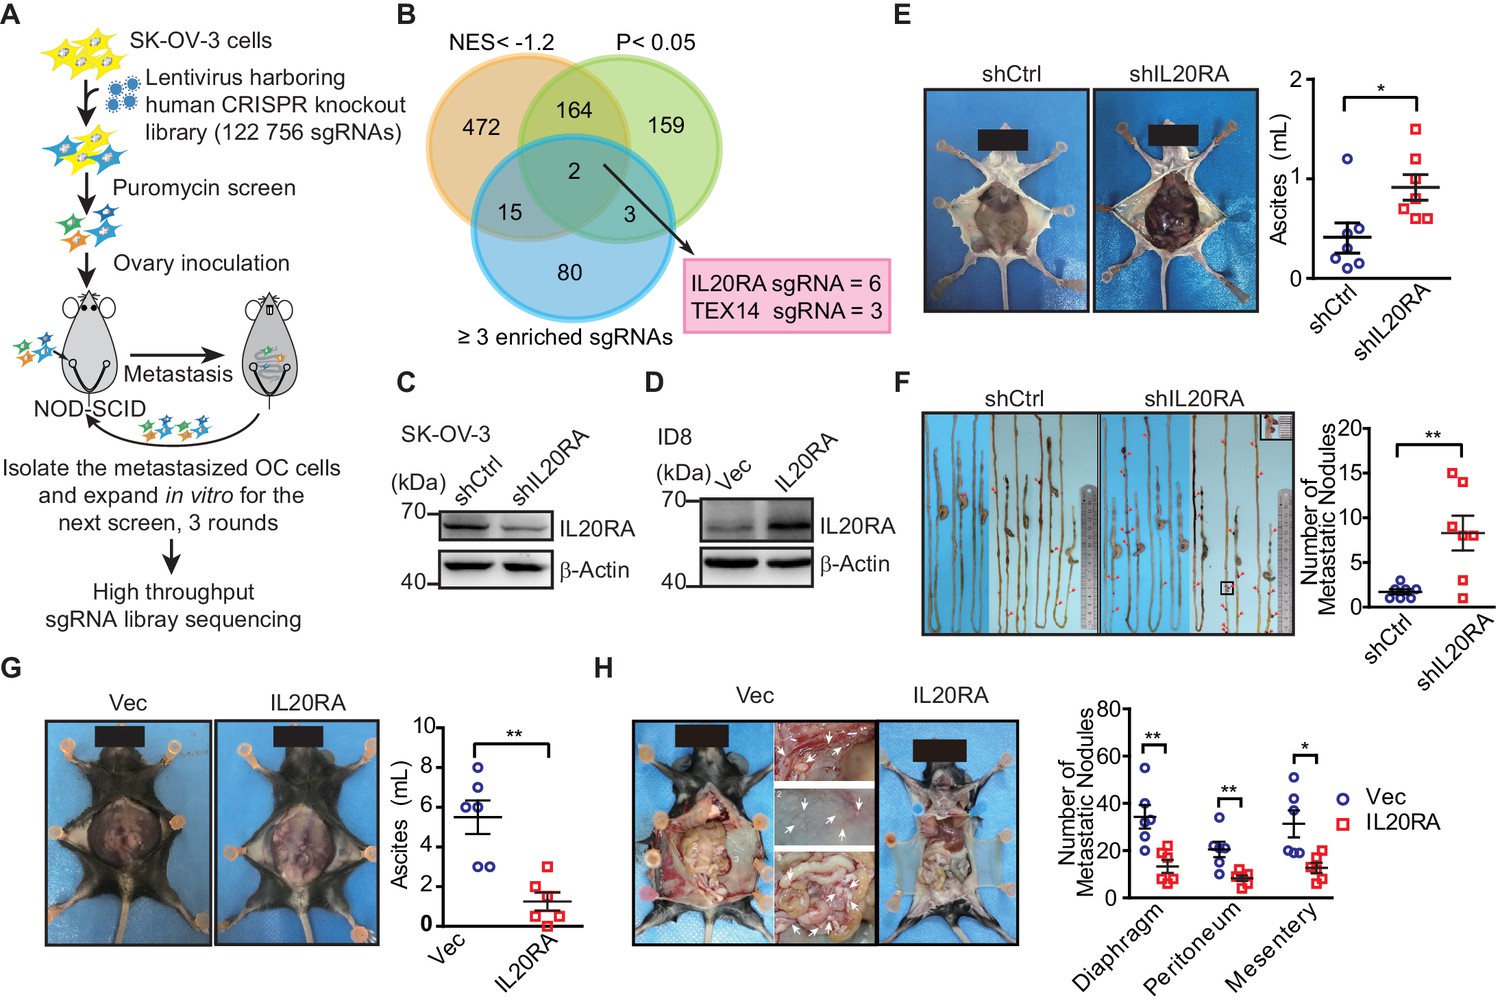
High-throughput CRISPR screen identified IL20RA as a suppressor of the transcoelomic metastasis of ovarian cancer (OC).
(A) Schematics of experiment design to screen metastasis-related genes using CRISPR/Cas9 library in OC orthotopic murine model. (B) Venn diagram comparing the hits met the indicated enrichment criteria. (C, D) Western blot analysis of IL20RA in control shRNA (shCtrl)- or IL20RA shRNA (shIL20RA)-transfected SK-OV-3 cells (C) and in IL20RA- or empty vector-transfected ID8 cells (D). (E, F) Representative images of NOD-SCID mice with shCtrl- or shIL20RA-transfected SK-OV-3 cells orthotopically transplanted in the ovaries at 40 days post-inoculation (E, left panel). The ascites volumes (E, right panel) and the numbers of metastatic nodules on the surfaces of intestines (F) were quantified (n = 7, data are shown as means ± SEM, *p<0.05, **p<0.01, by unpaired two-sided Student’s t-test). (G, H) Representative images of C57BL/6 mice at 60 days after orthotopically inoculated with IL20RA-reconstituted or control ID8 cells in ovaries (G, left panel). The ascites volumes (G, right panel) and the numbers of metastatic nodules on the surfaces lining the peritoneal cavities (H) were quantified (n = 6, data are shown as means ± SEM, *p<0.05, **p<0.01 by unpaired two-sided Student’s t-test).
-
Figure 1—source data 1
An Excel sheet with numerical quantification data.
- https://cdn.elifesciences.org/articles/66222/elife-66222-fig1-data1-v1.xlsx
Figure 1—figure supplement 1
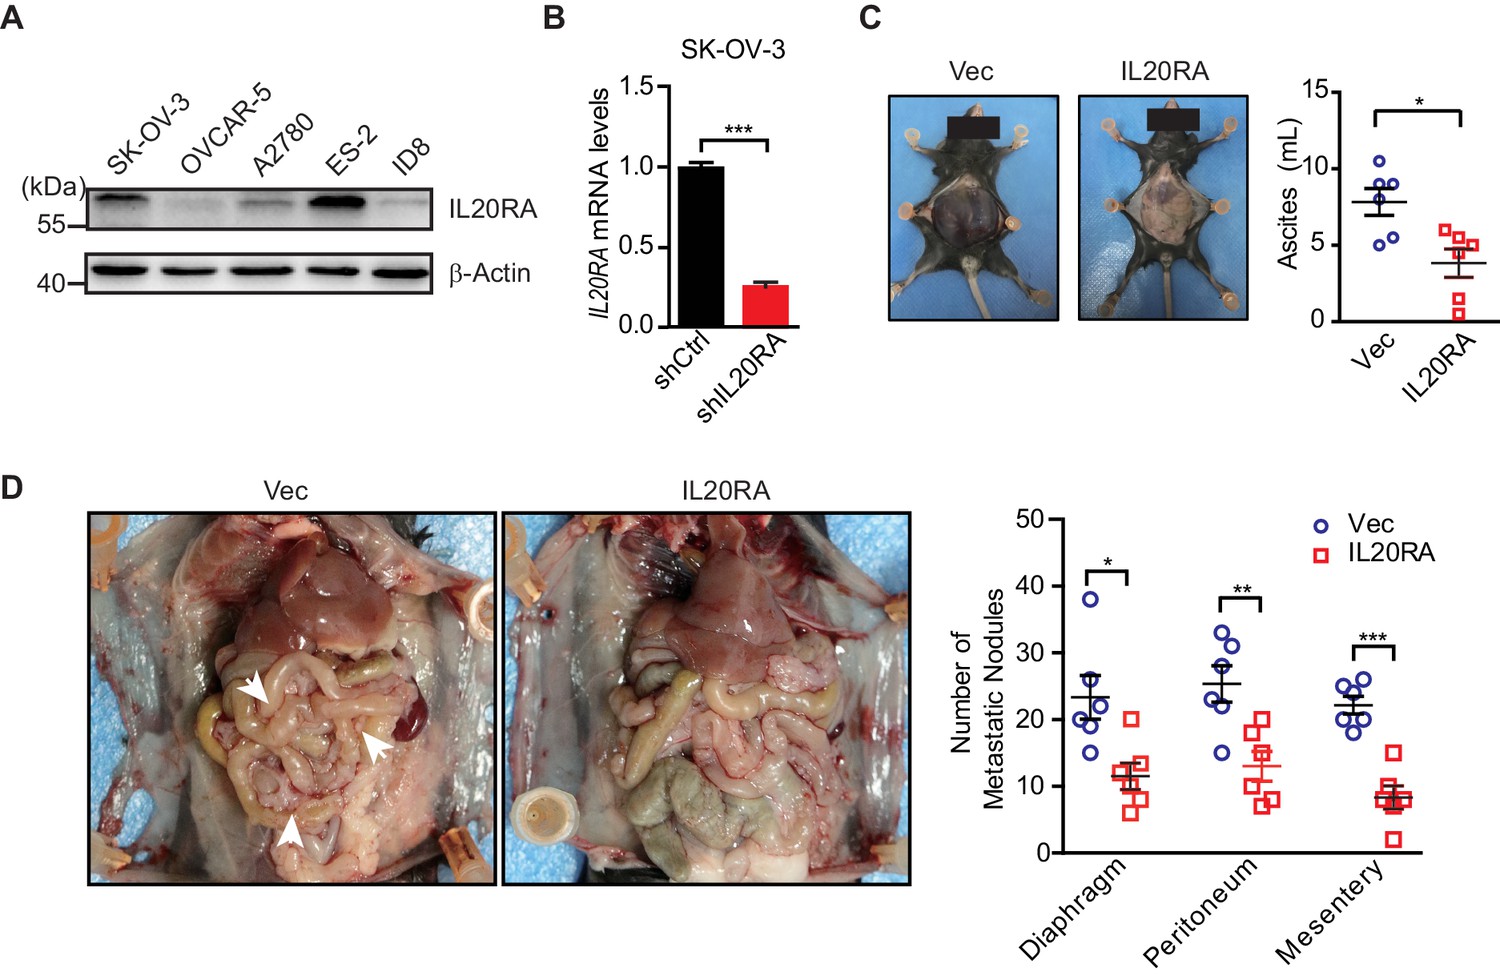
IL20RA suppresses the transcoelomic metastasis of ovarian cancer (OC) in syngeneic intraperitoneal OC mouse model.
(A) Western blot analysis of IL20RA in different OC cells. (B) qRT-PCR analysis of IL20RA in SK-OV-3 cells transfected with shCtrl or shIL20RA (means ± SEM, ***p<0.001, by unpaired two-sided Student’s t-test). (C, D) Representative images of C57BL/6 mice at 45 days after direct intraperitoneal injection of IL20RA-reconstituted or control (Vec) ID8 cells (C, D, left panels). The ascites volumes and numbers of metastatic nodules on the surfaces of diaphragm, peritoneum, and mesentery were quantified (n = 6 mice for each group). Data are shown as means ± SEM, *p<0.05, **p<0.01, ***p<0.001, by unpaired two-sided Student’s t-test.
Figure 2 with 2 supplements
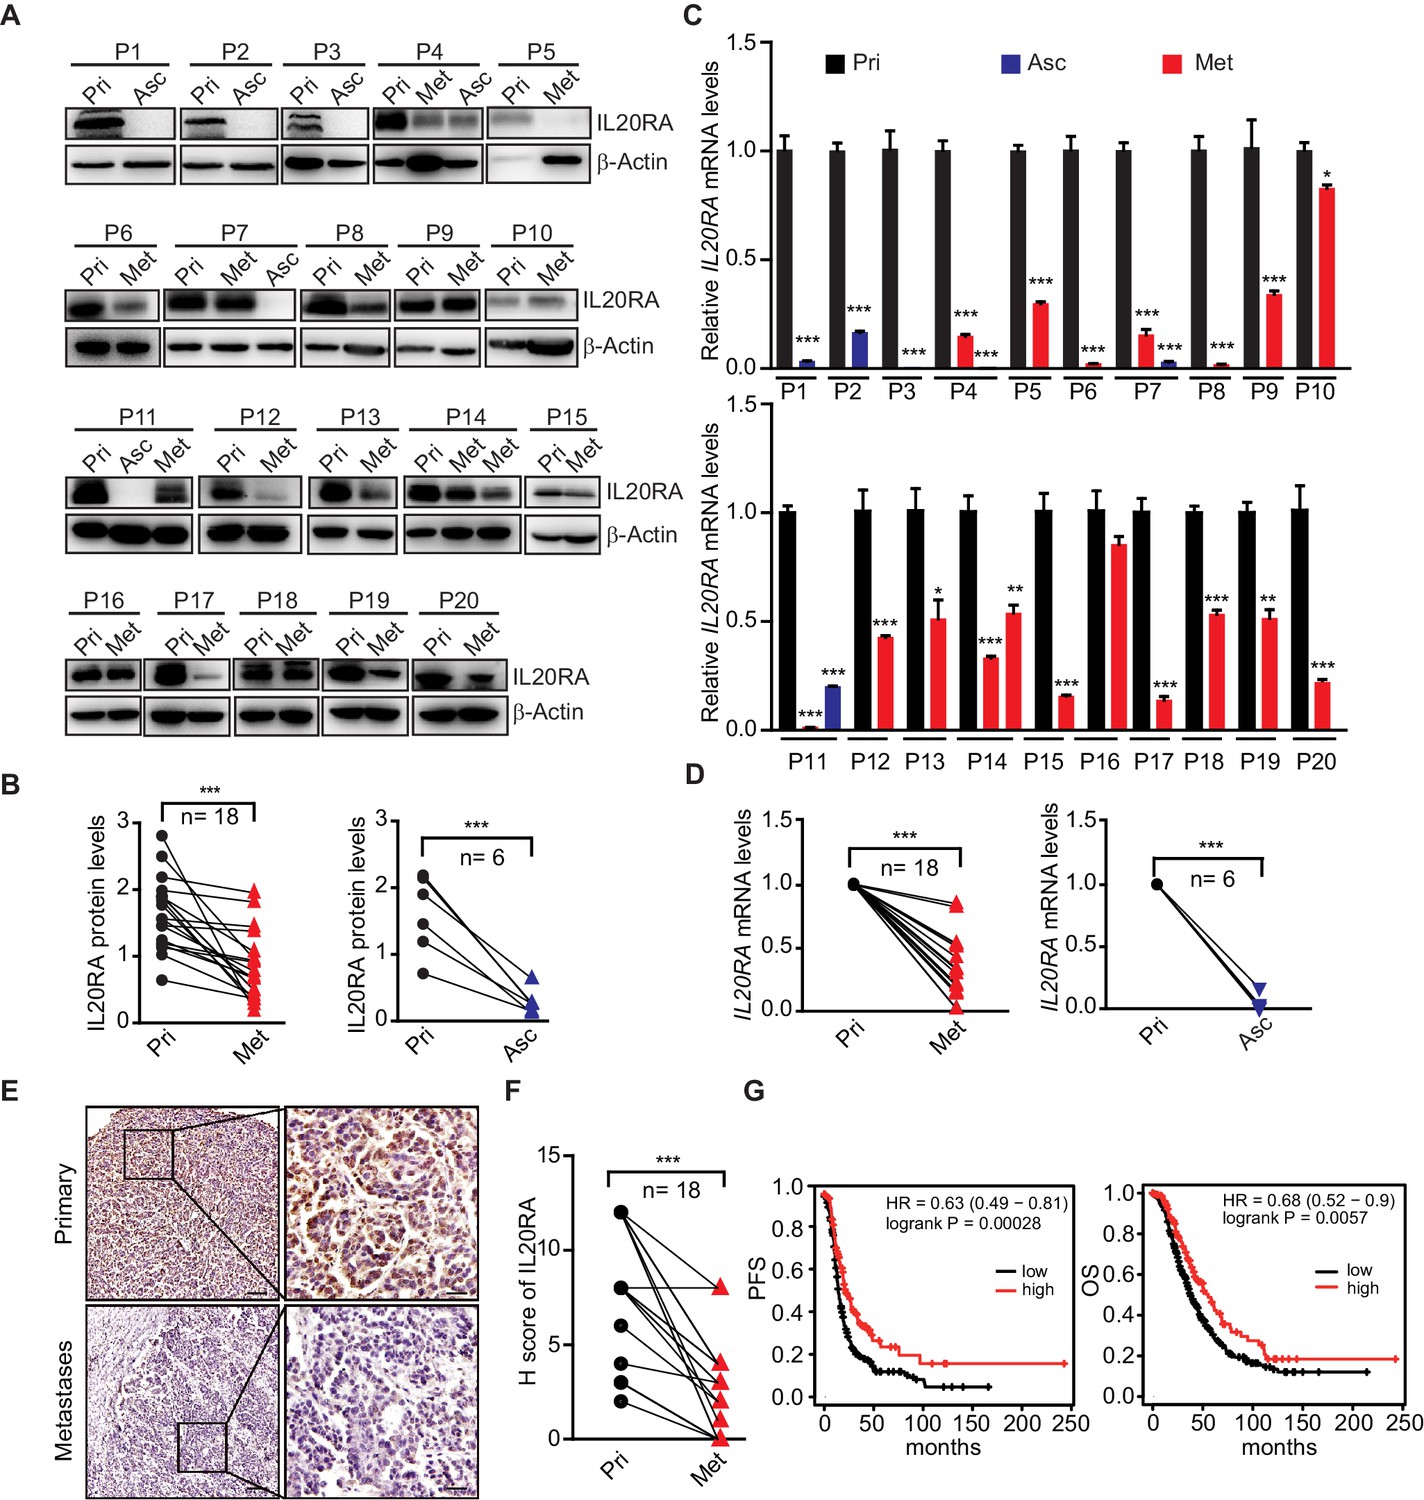
Dramatically decreased IL20RA in human ovarian cancer (OC) peritoneal metastases and its correlation with the clinical outcome.
(A, B) Western blot analysis of IL20RA in primary OC tissues (Pri) and paired metastatic cancer cells in ascites (Asc) and metastatic nodules on the surfaces of the abdominal organs (Met) (A). Quantification results are plotted in (B) (n = 20, ***p<0.001, by unpaired two-sided Student’s t-test). (C, D) qRT-PCR analysis of IL20RA in human primary OC tissue (Pri) and paired peritoneal metastases (Asc and Met) (C, data are plotted as means ± SEM from three independent measurements, *p<0.05, **p<0.01, ***p<0.001, by unpaired two-sided Student’s t-test). The comparison of the IL20RA levels in these two groups is analyzed in (D) (**p<0.01, ***p<0.001, by unpaired two-sided Student’s t-test). (E, F) Representative images of immunohistochemical analysis of IL20RA in in human primary OC tissue and paired peritoneal metastases (E) and quantification by H-score (F, n = 18, ***p<0.001, by paired two-sided Student’s t-test). Scale bar: 100 μm (left panel in E); 20 μm (right panel in E). (G) Kaplan–Meier survival plot to show the progression-free survival and overall survival of serous OC patients with different IL20RA expression.
-
Figure 2—source data 1
An Excel sheet with numerical quantification data.
- https://cdn.elifesciences.org/articles/66222/elife-66222-fig2-data1-v1.xlsx
Figure 2—figure supplement 1
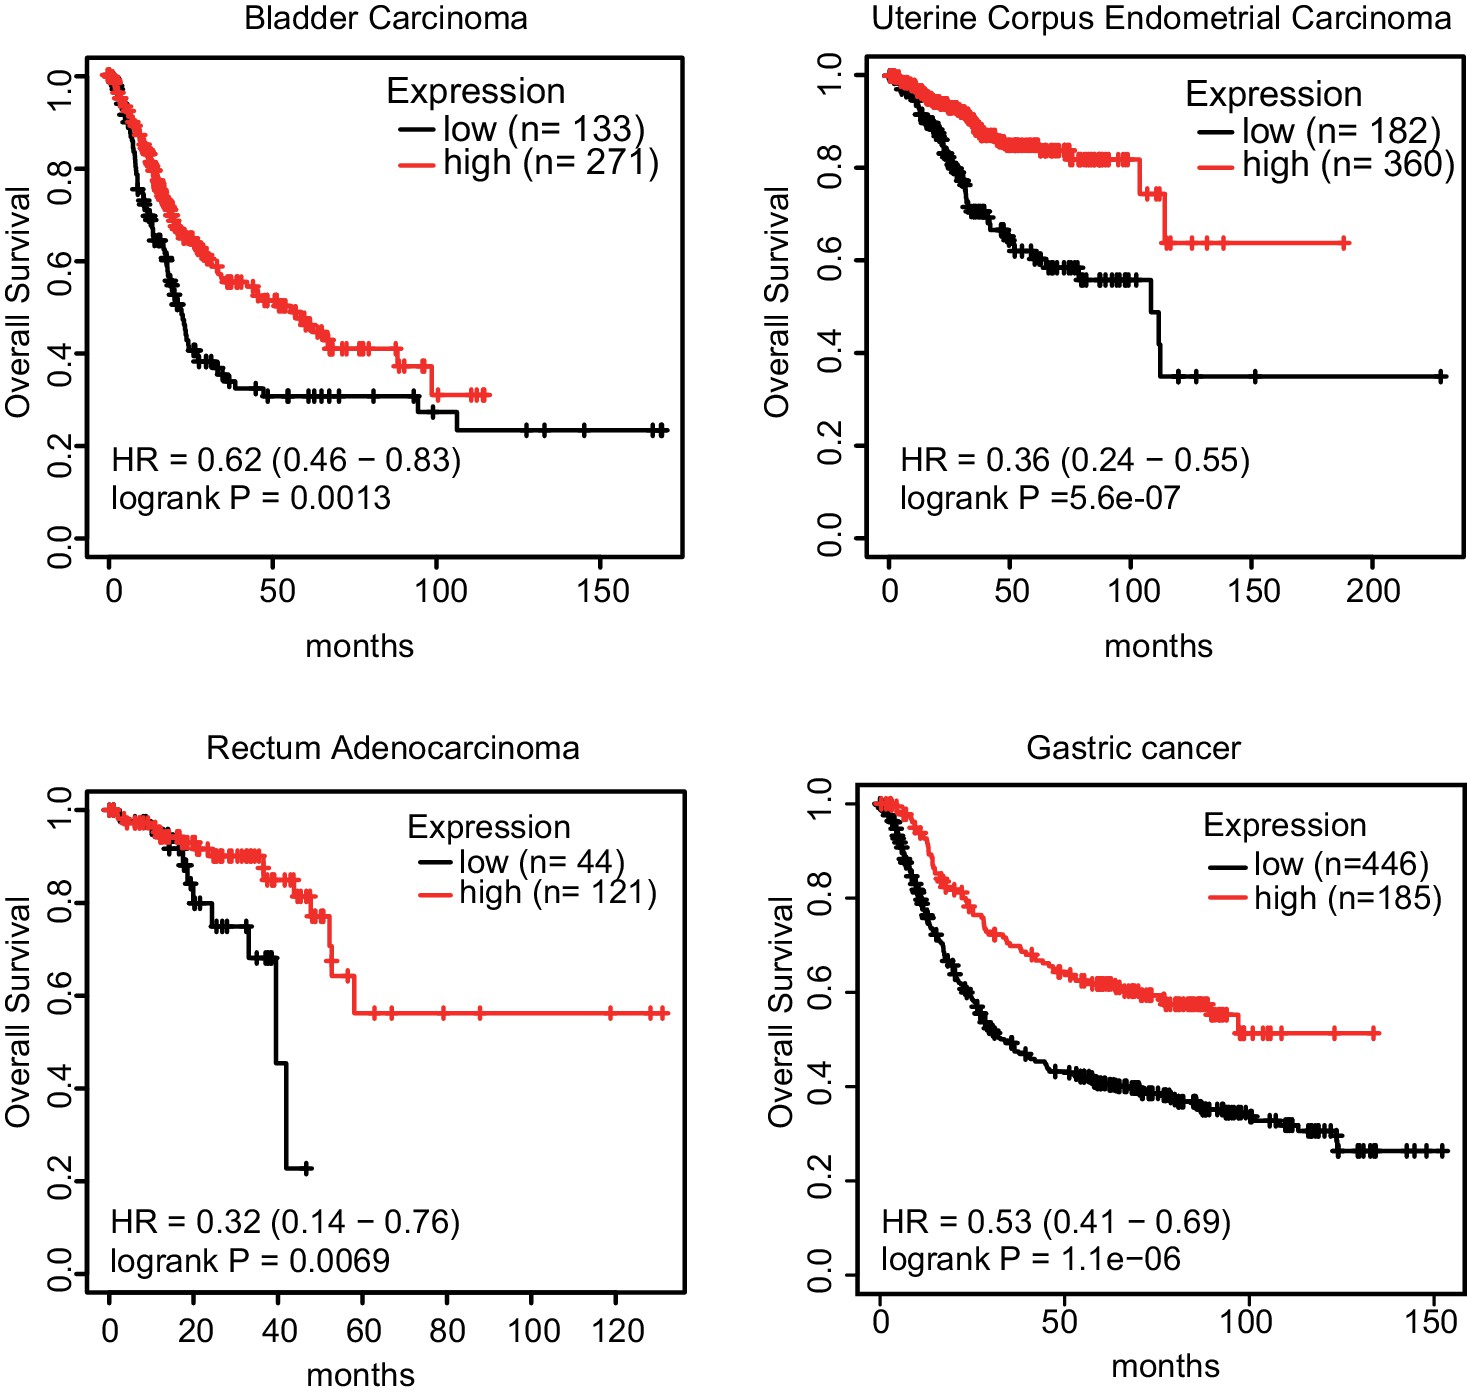
IL20RA expression is positively correlated with the clinical outcome of patients in many types of cancers.
Kaplan–Meier survival plots to show the correlations of different IL20RA expression with the overall survival in patients of bladder carcinoma, uterine corpus endometrial carcinoma, rectum adenocarcinoma, and gastric cancer.
Figure 2—figure supplement 2
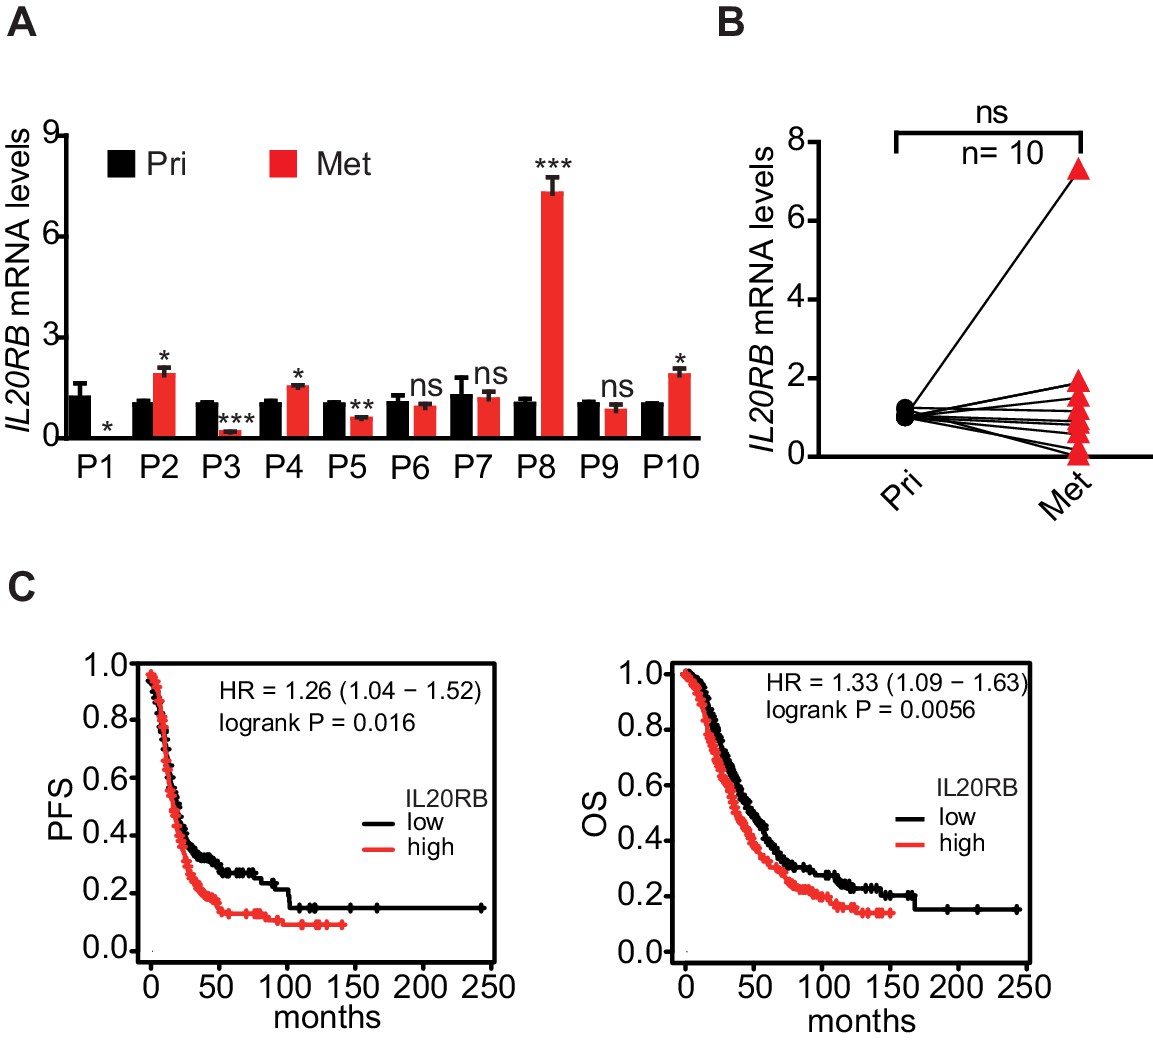
IL20RB expression in human ovarian cancer (OC) tissues and its correlation with clinical outcome of OC patients.
(A, B) qRT-PCR analysis of IL20RB in human primary OC tissue and paired peritoneal metastases (A, data are plotted as means ± SEM from three independent measurements, *p<0.05, **p<0.01, ***p<0.001, ns, not significant, by unpaired two-sided Student’s t-test). The comparison of the IL20RB levels in these two groups is statistically analyzed in (B) (ns, not significant, by unpaired two-sided Student’s t-test). (C) Kaplan–Meier survival plot to show the progression-free survival and overall survival of OC patients with different IL20RB expression.
Figure 3 with 1 supplement

Characterization of IL20RA-mediated modulation on the peritoneal immune microenvironment during the transcoelomic metastasis of ovarian cancer (OC).
(A, B) Flow cytometry analysis of macrophages (CD45+ CD11b+ F4/80+) and M1-like (MHC II+ CD206-) and M2-like (MHC II- CD206+) subpopulations in ascites formed in C57BL/6 mice at 60 days after orthotopically inoculated with IL20RA-reconsitituted or control (Vec) ID8 cells (A). The quantification is shown in (B) as means ± SEM (n = 5), *p<0.05, ns, not significant, by unpaired two-sided Student’s t-test. (C) qRT-PCR analysis of key marker genes in peritoneal macrophages (CD11b+ F4/80+) isolated in (A) (shown as means ± SEM, *p<0.05, **p<0.01, ***p<0.001, by unpaired two-sided Student’s t-test). (D, E) Flow cytometry analysis of peritoneal T lymphocytes (D) and B lymphocytes (E) from syngeneic OC mouse model (same mice as described in A), ns, not significant, by unpaired two-sided Student’s t-test. (F) Flow cytometry analysis of macrophages in ascites formed in NOD-SCID mice at 40 days after orthotopically inoculated with indicated SK-OV-3 cells. Data are shown as means ± SEM, n = 3, *p<0.05, **p<0.01, ***p<0.001, by unpaired two-sided Student’s t-test.
-
Figure 3—source data 1
An Excel sheet with numerical quantification data.
- https://cdn.elifesciences.org/articles/66222/elife-66222-fig3-data1-v1.xlsx
Figure 3—figure supplement 1
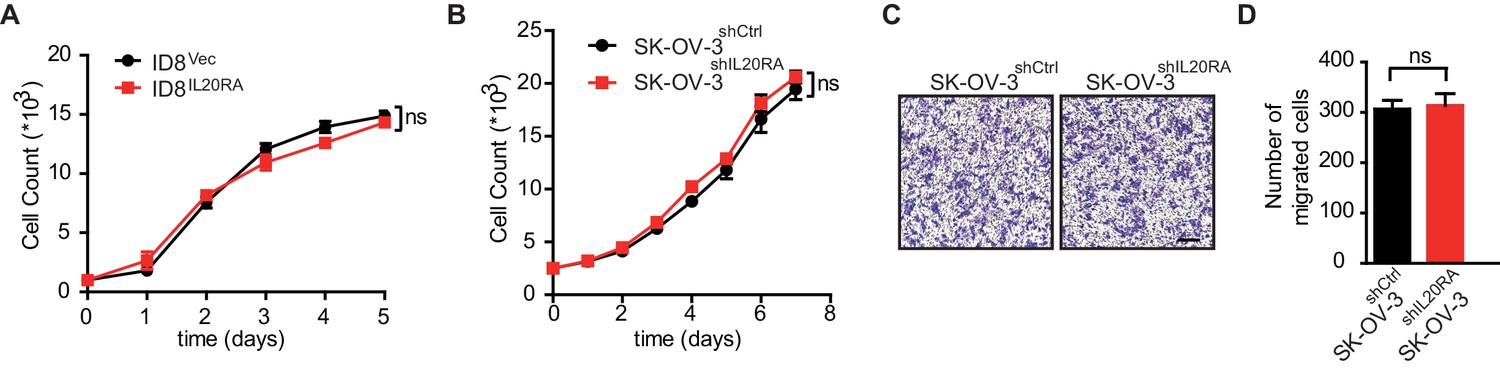
IL20RA has no effect on the proliferation and migration abilities of ovarian cancer (OC) cells.
(A) Growth curves of IL20RA-reconstituted or control (Vec) ID8 cells under the stimulation of IL-20. (B) Growth curves of shIL20RA- or shCtrl-transfected SK-OV-3 cells under the stimulation of IL-20. (C, D) Transwell cell migration assay of shIL20RA- or shCtrl-transfected SK-OV-3 cells in the presence of IL-20, which were quantified in (D) (shown as means ± SEM from three independent experiments, ns, not significant, by unpaired two-sided Student’s t-test). Scale bar: 50 μm.
Figure 4 with 1 supplement
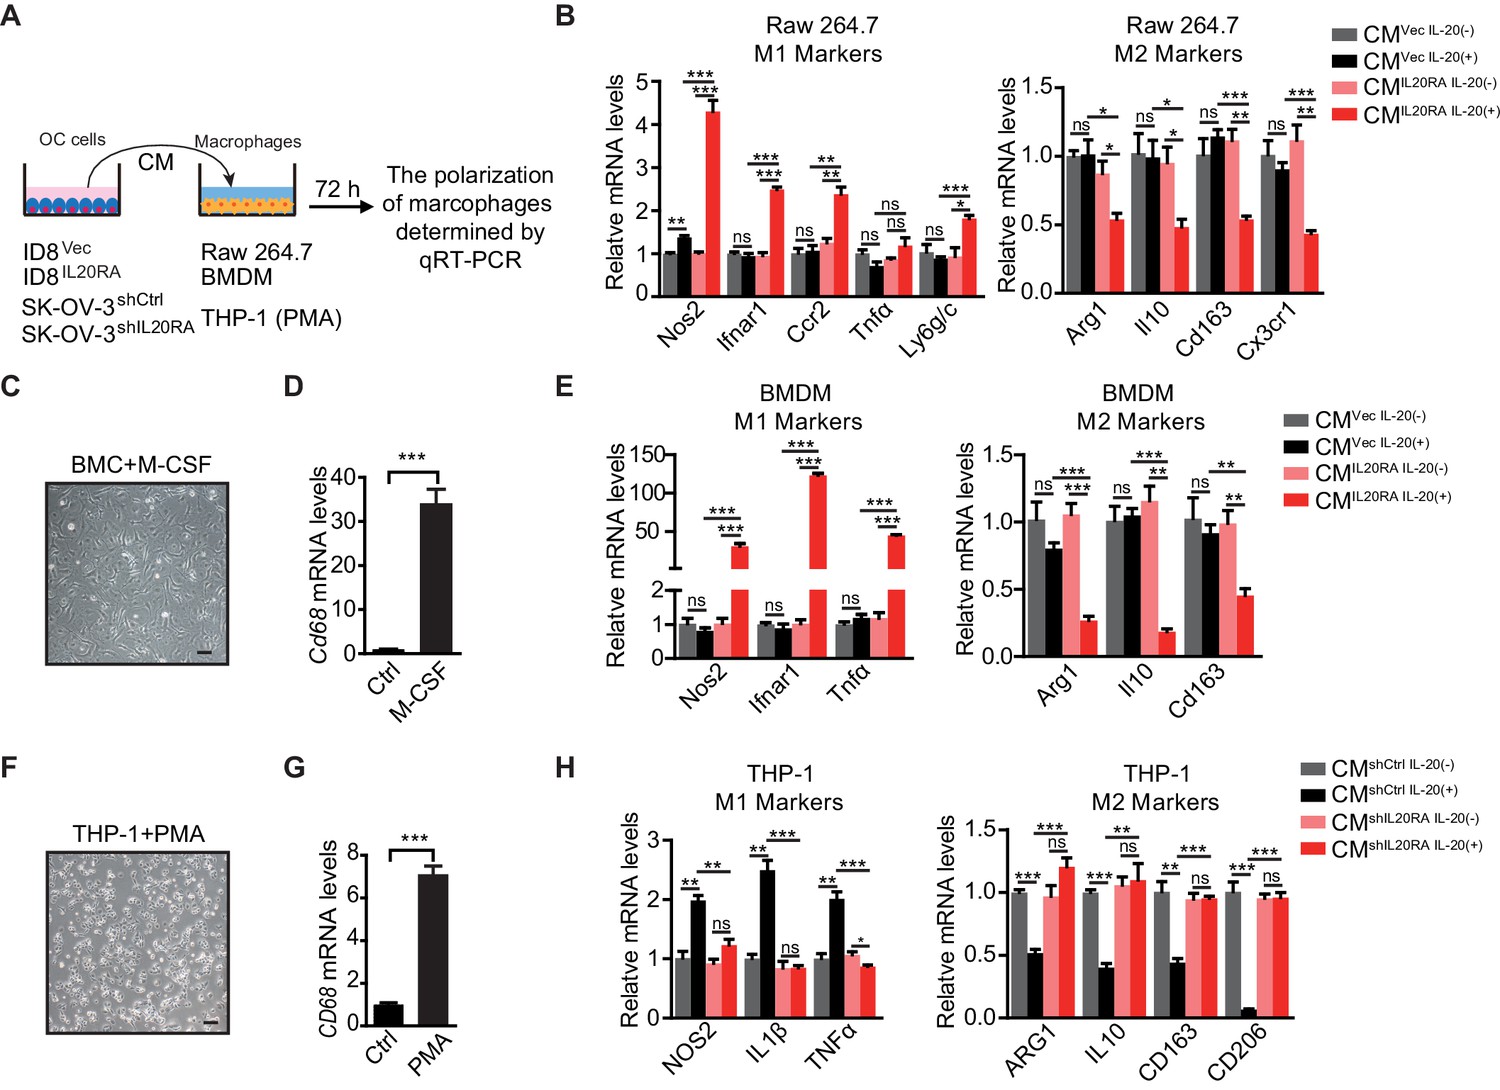
IL20RA mediates a direct crosstalk between ovarian cancer (OC) cells and macrophages to regulate the polarization of macrophages.
(A) Schematic of the in vitro crosstalk experiment using conditioned medium (CM) from OC cells to educate macrophages. (B) qRT-PCR analysis of macrophage marker genes in RAW 264.7 cells stimulated with CM of IL-20-stimulated/unstimulated IL20RA-reconsitituted (CMIL20RA) or control (CMVec) ID8 cells for 72 hr. (C, D) Representative image of bone marrow-derived macrophage (BMDM) differentiated from bone marrow cell with the treatment of macrophage colony stimulating factor for 7 days (C), which were further characterized by qRT-PCR analysis of its marker gene Cd68 (D). Scale bar: 20 μm. (E) qRT-PCR analysis of macrophage marker genes in BMDM treated with CM of IL-20-stimulated/unstimulated IL20RA-reconsitituted (CMIL20RA) or control (CMVec) ID8 cells for 72 hr. (F, G) Image of macrophages differentiated from THP-1 cells with the treatment of phorbol-12-myristate-13-acetate for 48 hr (F) and further characterization by qRT-PCR analysis of CD68 (G). Scale bar: 20 μm. (H) qRT-PCR analysis of macrophage marker genes in THP-1-derived macrophages treated with CM from IL-20-stimulated/unstimulated shIL20RA or control shRNA (shCtrl)-transfected SK-OV-3 cells for 72 hr. All the qRT-PCR data are shown as means ± SEM from three independent experiments, *p<0.05, **p<0.01, ***p<0.001, by unpaired two-sided Student’s t-test.
-
Figure 4—source data 1
An Excel sheet with numerical quantification data.
- https://cdn.elifesciences.org/articles/66222/elife-66222-fig4-data1-v1.xlsx
Figure 4—figure supplement 1
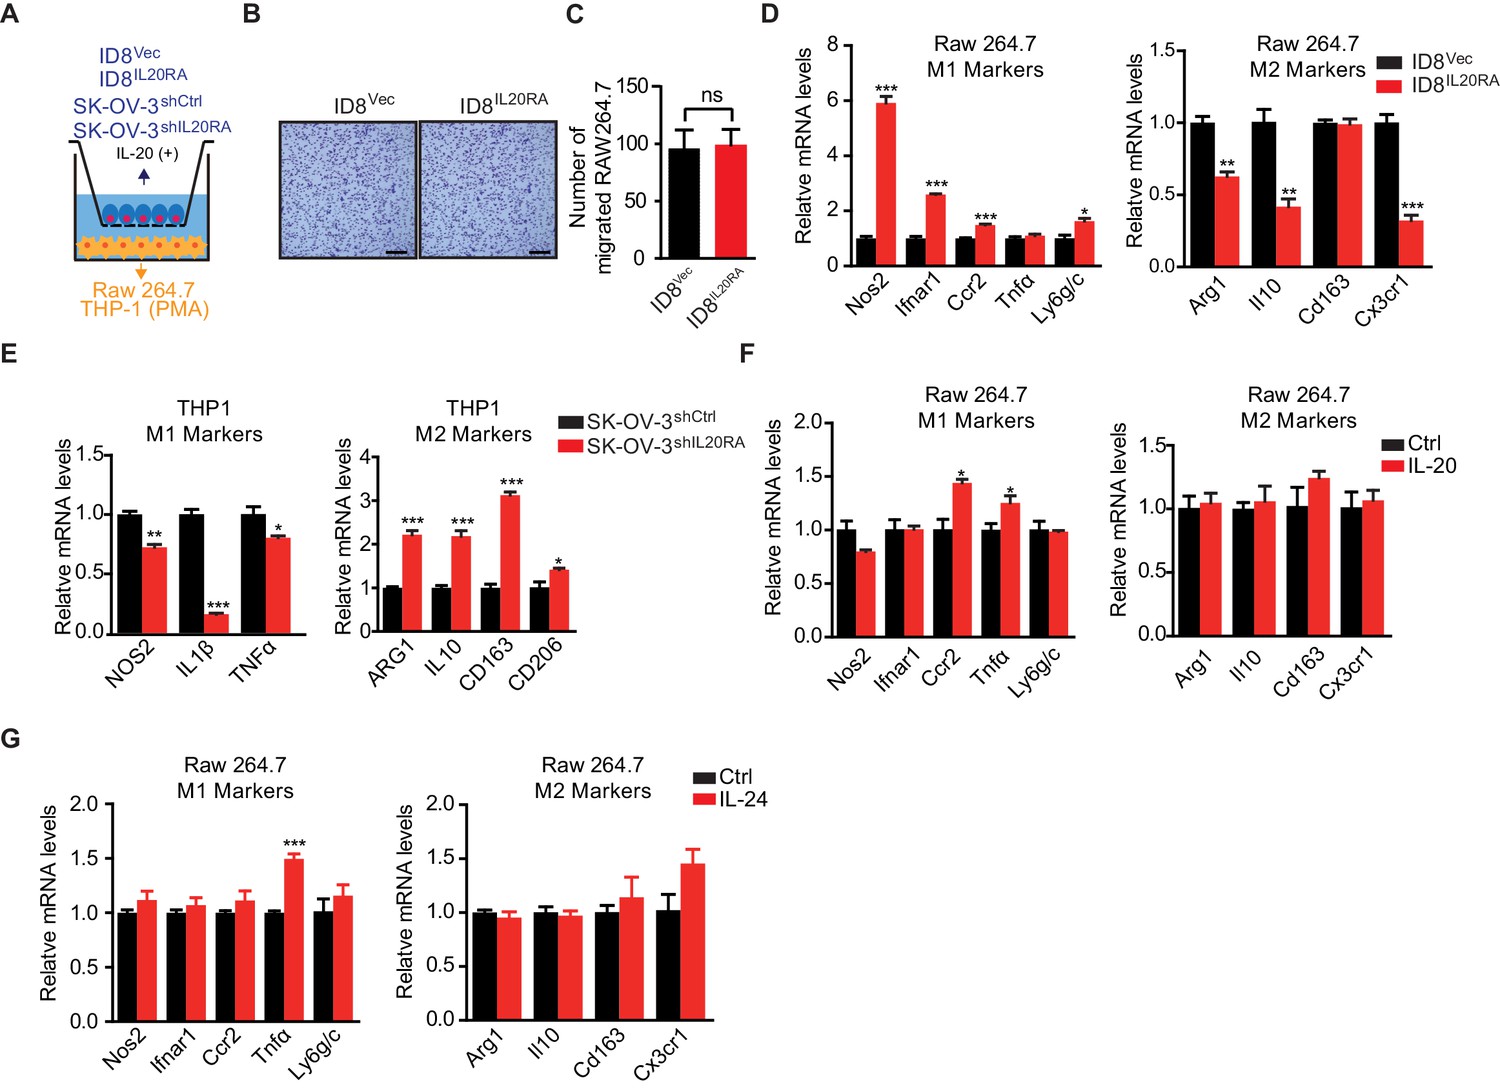
In vitro co-culture experiments to show the IL20RA-mediated crosstalk between ovarian cancer (OC) cells and macrophages for their polarization.
(A) Schematic of the in vitro co-culture experiments. (B, C) Transwell migration assay to show the migrated RAW 264.7 cells co-cultured with IL20RA-reconstituted or control (Vec) ID8 cells (B), which were quantified in (C) (shown as means ± SEM from three independent experiments, ns, not significant, by unpaired two-sided Student’s t-test). Scale bar: 50 μm. (D) qRT-PCR analysis of macrophage marker genes in bone marrow-derived macrophage co-cultured with IL20RA-reconstituted or control (Vec) ID8 cells for 72 hr. (E) qRT-PCR analysis of macrophage marker genes in THP-1-derived macrophages co-cultured with shIL20RA- or shCtrl-transfected SK-OV-3 cells for 72 hr. (F) qRT-PCR analysis of macrophage marker genes in RAW 264.7 cells stimulated with IL-20 protein for 72 hr. (G) qRT-PCR analysis of macrophage marker genes in RAW 264.7 cells stimulated with IL-24 protein for 72 hr. All the qRT-PCR data are shown as means ± SEM from three independent experiments, *p<0.05, **p<0.01, ***p<0.001, by unpaired two-sided Student’s t-test.
Figure 5
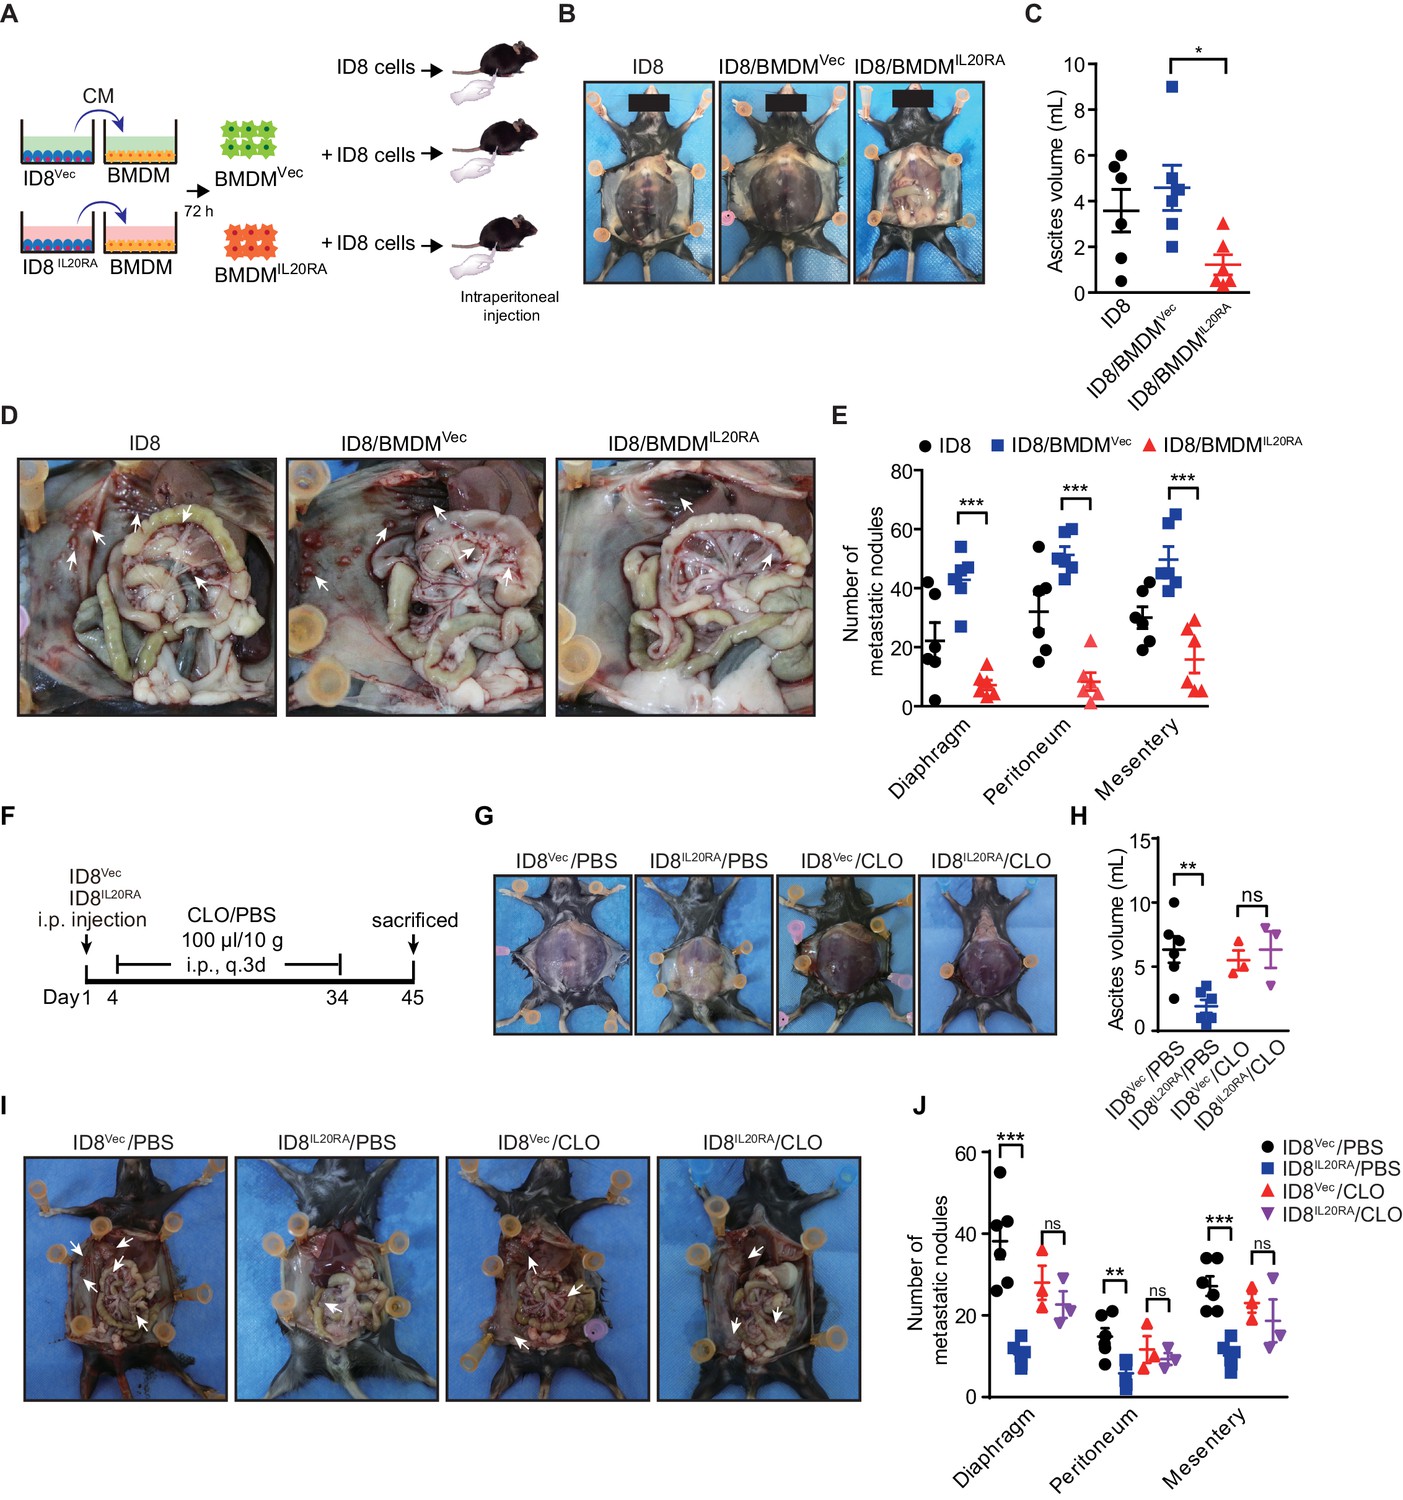
Macrophages play a prominent role in IL20RA-mediated suppression of ovarian cancer (OC) metastasis.
(A) Schematic of the experiments. ID8 cells alone or mixed with CMIL20RA IL-20 (+)- or CMVec IL-20 (+)-stimulated bone marrow-derived macrophage were injected into the peritoneal cavity of C57BL/6 mice. (B–E) Representative images of the ascites formation (B) and metastatic nodules in peritoneal cavity (D) at day 45 post-inoculation. The quantification of ascites and metastatic nodules is shown in (C) and (E), respectively. Data are shown as means ± SEM, n = 6, *p<0.05; **p<0.01; ***p<0.001, by unpaired two-sided Student’s t-test. (F) Schematic of the experiments. IL20RA-reconsitituted or control (Vec) ID8 cells were injected into the peritoneal cavity of C57BL/6 mice. The phosphate-buffered saline liposomes (PBS) or clodronate liposomes (CLO) were intraperitoneal (i.p.) injected every 3 days. (G–J) Representative images of the ascites formation (G) and metastatic nodules in peritoneal cavity (I) at day 45 post-inoculation. The quantification of ascites and metastatic nodules is shown in (H) and (J), respectively. Data are shown as means ± SEM, n = 6 (ID8Vec/PBS and ID8IL20RA/PBS), n = 3 (ID8Vec/CLO and ID8IL20RA/CLO), ns, not significant; **p<0.01; ***p<0.001, by unpaired two-sided Student’s t-test.
-
Figure 5—source data 1
An Excel sheet with numerical quantification data.
- https://cdn.elifesciences.org/articles/66222/elife-66222-fig5-data1-v1.xlsx
Figure 6 with 1 supplement
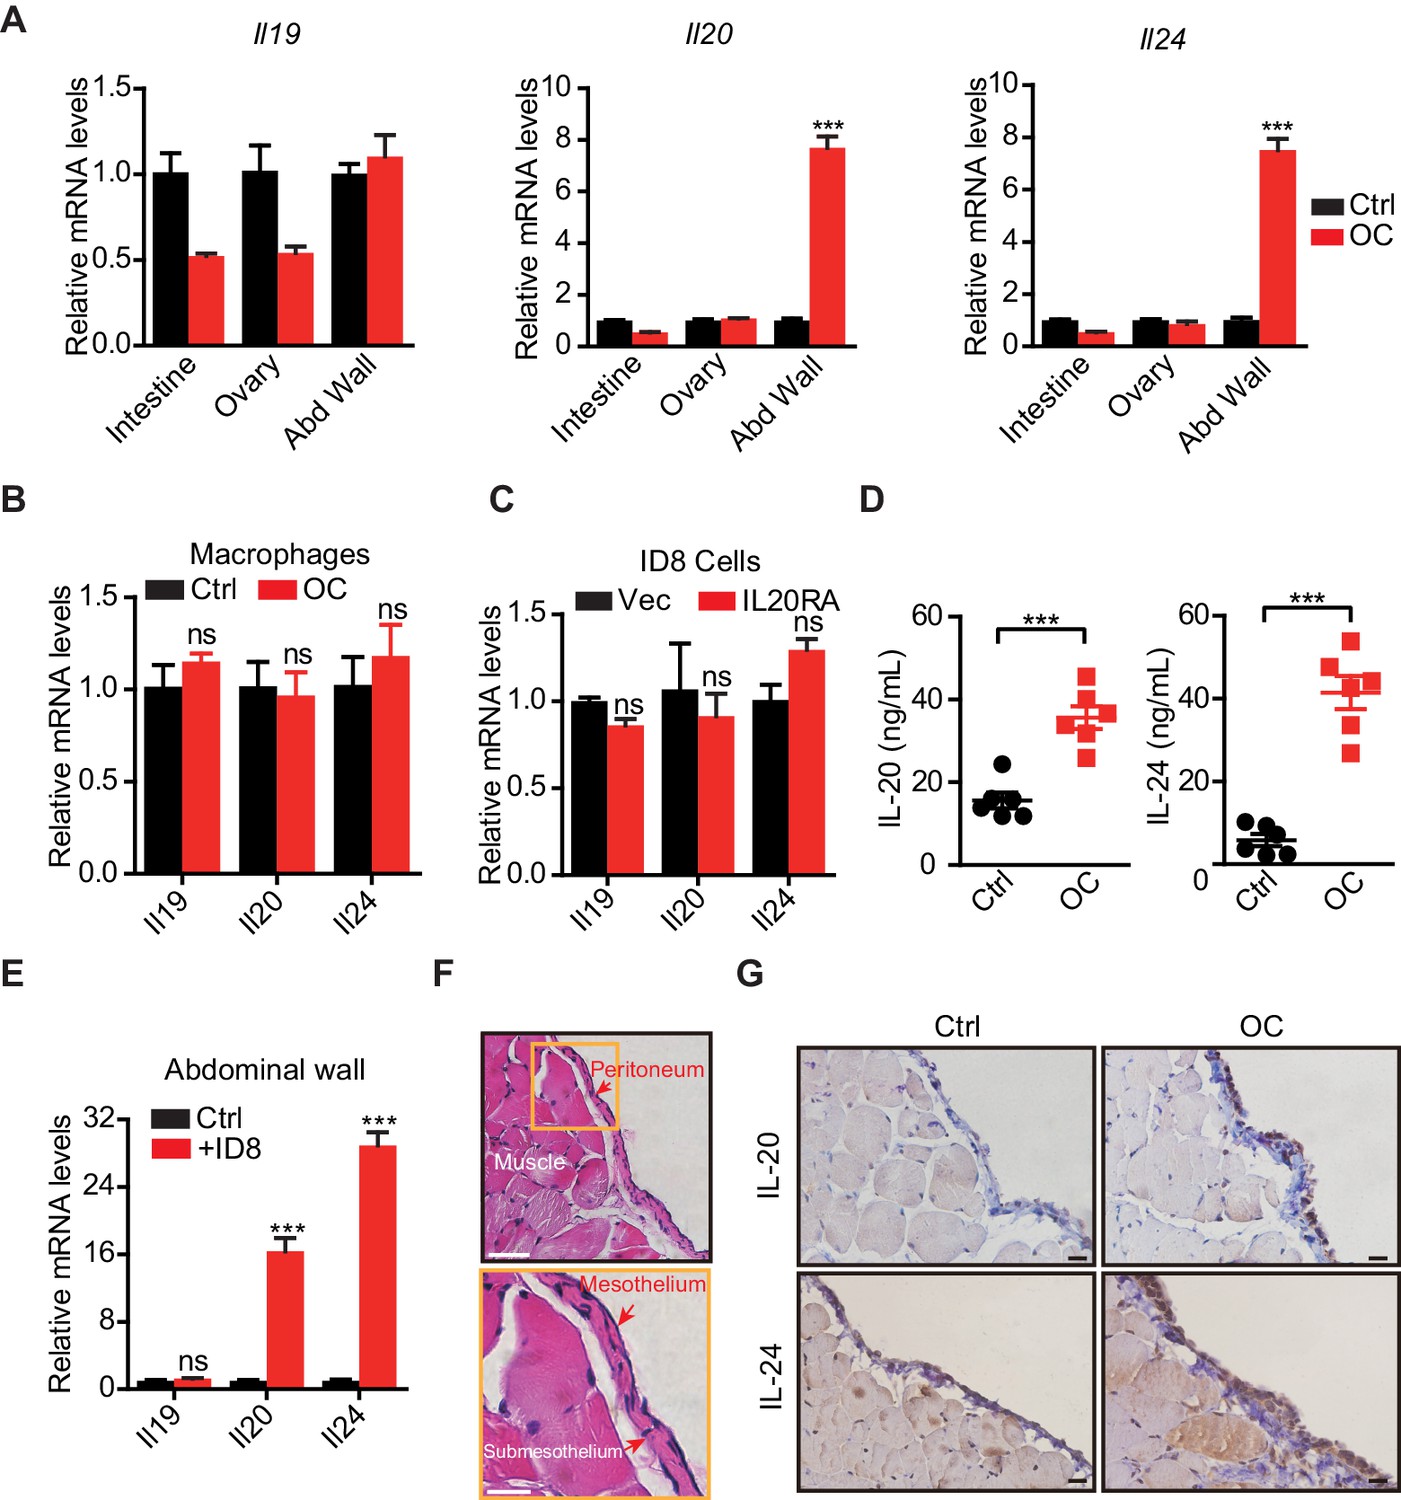
The mesothelial cells in peritoneum produce IL-20 and IL-24 when challenged by disseminated ovarian cancer (OC) cells in the peritoneal cavity.
(A, B) qRT-PCR analysis of IL20RA ligands (Il19, Il20, and Il24) in peritoneal organs (intestinal, abdominal wall, ovary) (A) or peritoneal macrophages (CD11b+ F4/80+) (B) taken from C57BL/6 mice with intraperitoneal injection of ID8 cells (OC) or phosphate-buffered saline (PBS) control (Ctrl) 9 days before. Data are shown as means ± SEM, n = 18 for Ctrl group and n = 6 for OC group, ***p<0.001, ns, not significant, by unpaired two-sided Student’s t-test. (C) qRT-PCR analysis of IL20RA ligands in IL20RA-reconstituted or control (Vec) ID8 cells (means ± SEM, ns, not significant). (D) ELISA measurement of IL-20 and IL-24 in peritoneal flushing fluid from mice with intraperitoneal injection of ID8 cells (OC) or PBS control (Ctrl) 9 days before. n = 6 for each group. Data are shown as means ± SEM, ***p<0.001, by unpaired two-sided Student’s t-test. (E) qRT-PCR analysis of the abdominal walls dissected from C57BL/6 mice and co-cultured with medium (Ctrl) or ID8 cells for 48 hr (means ± SEM from three independent experiments, ***p<0.001, ns, not significant, by unpaired two-sided Student’s t-test). (F) Hematoxylin and eosin staining of the abdominal wall of C57BL/6 mice. Scale bar: 50 μm (upper panel); 20 μm (lower panel). (G) Immunohistochemical staining of IL-20 and IL-24 in abdominal walls dissected from mice with intraperitoneal injection of ID8 cells (OC) or PBS control (Ctrl) 9 days before. Scale bar: 20 μm.
-
Figure 6—source data 1
An Excel sheet with numerical quantification data.
- https://cdn.elifesciences.org/articles/66222/elife-66222-fig6-data1-v1.xlsx
Figure 6—figure supplement 1
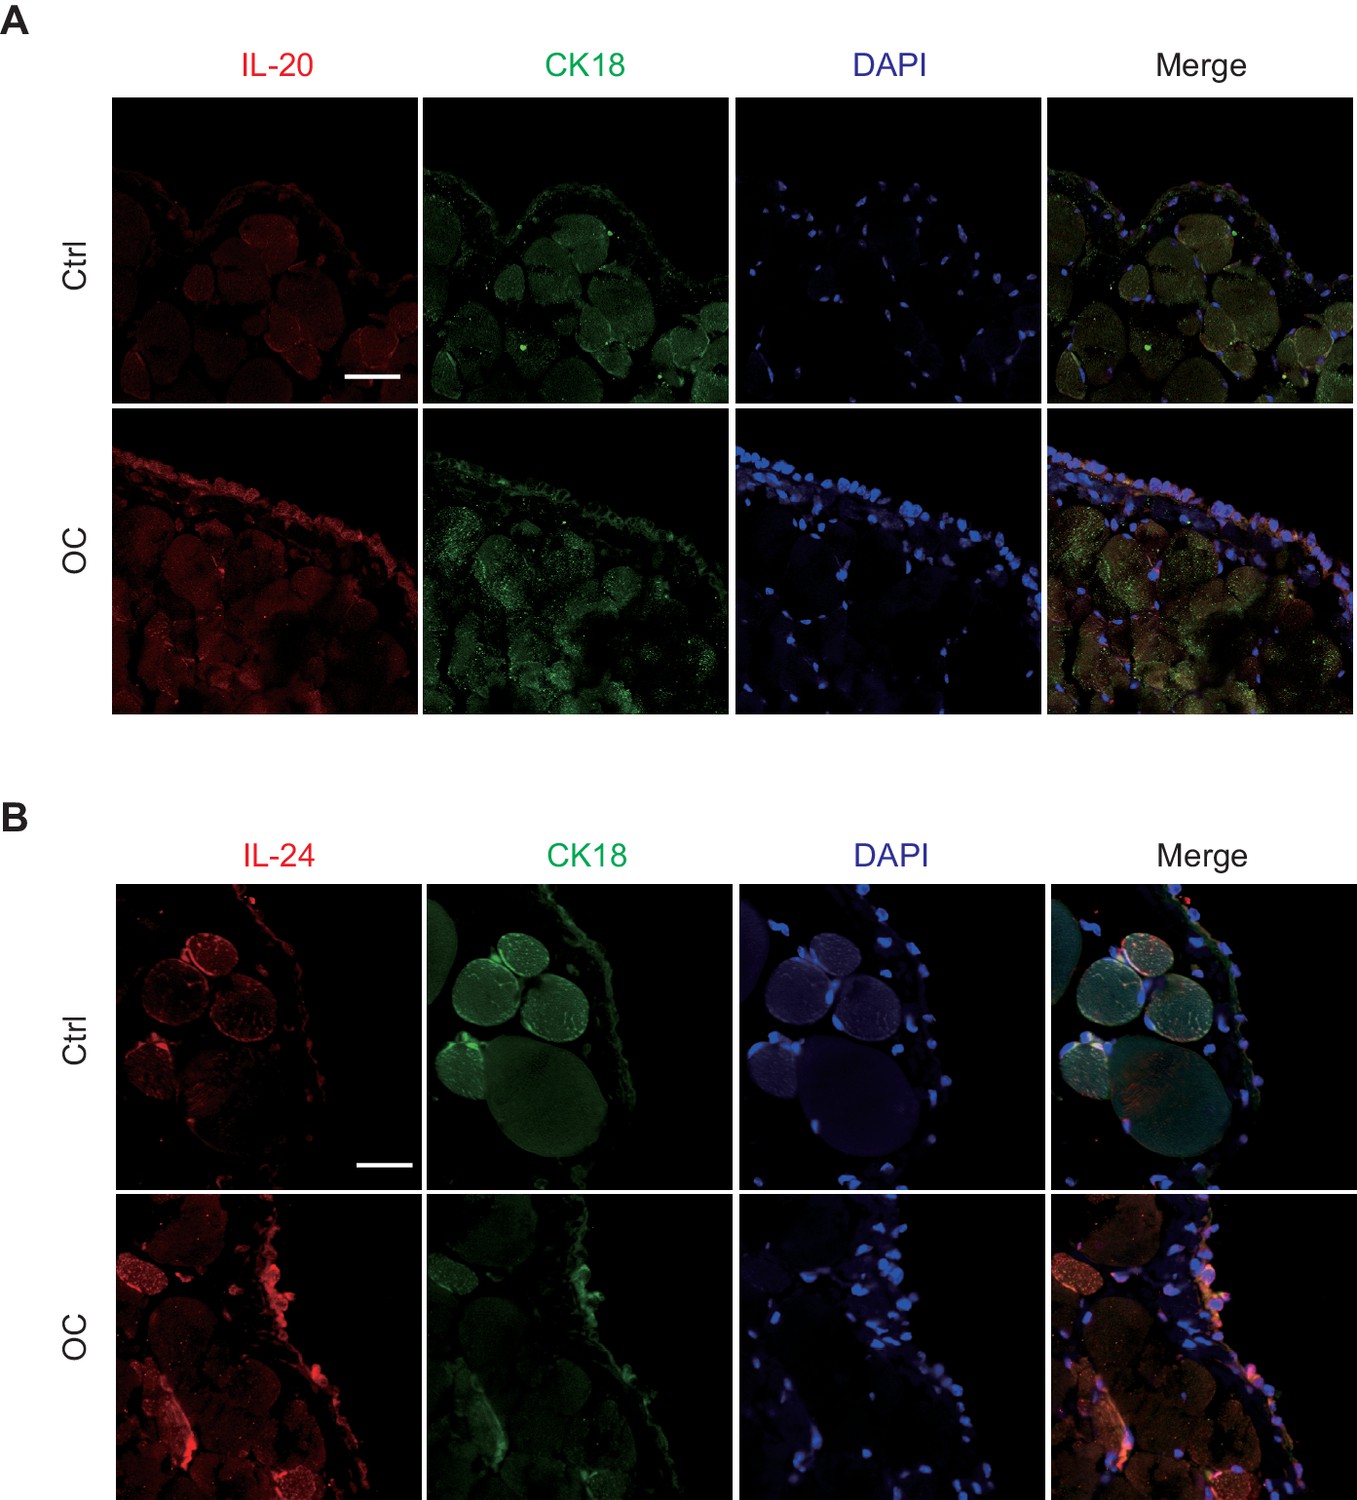
Mesothelial cells in peritoneum are the major source of IL-20 and IL-24 when challenged by ovarian cancer (OC).
(A, B) Immunofluorescent staining of IL-20/IL-24 (red), cytokeratin CK18 (green), and DAPI (blue) in peritoneum dissected from mice with intraperitoneal injection of ID8 cells (OC) or phosphate-buffered saline control (Ctrl) 9 days before. Scale bar: 30 μm.
Figure 7 with 1 supplement
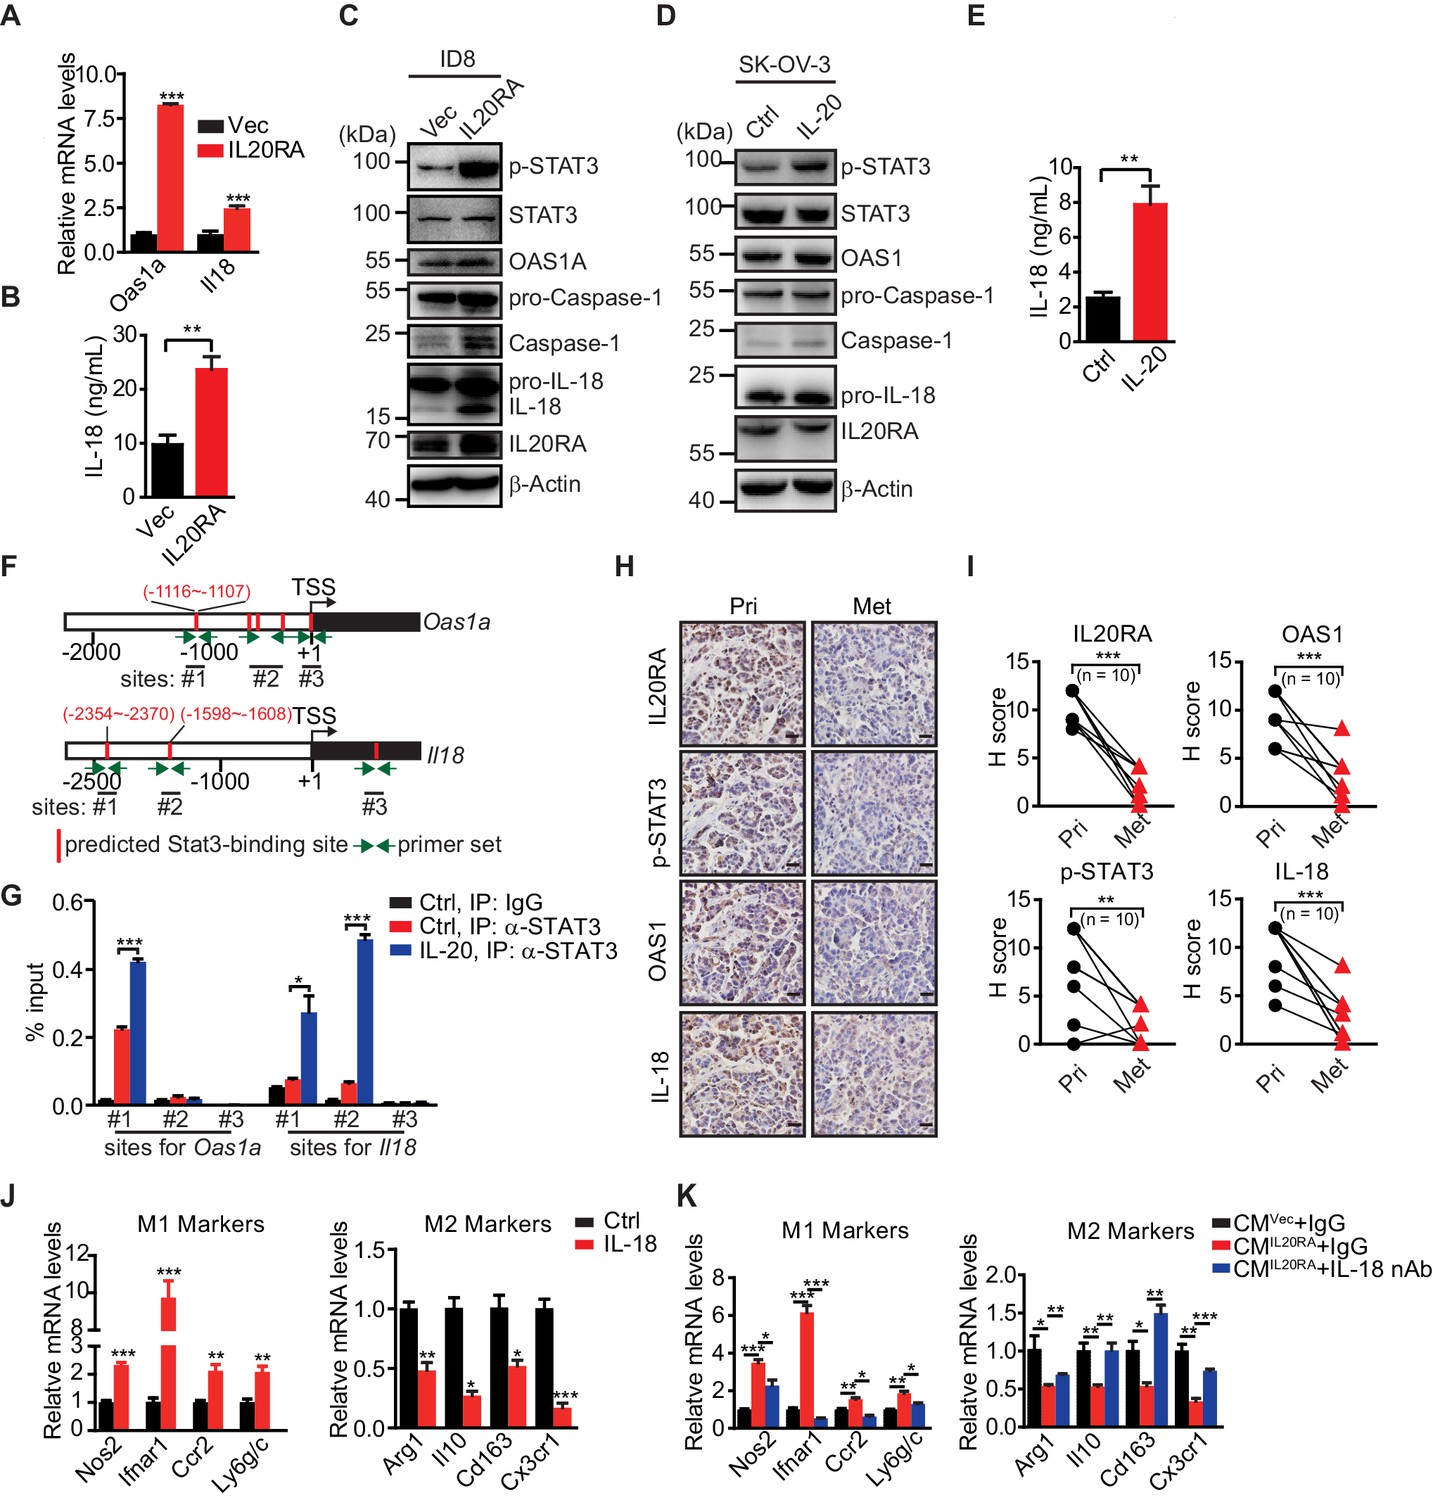
IL-20 activates the IL20RA-STAT3-OAS1/RNase L-NLR signaling to produce IL-18 to regulate the macrophages polarization.
(A) qRT-PCR analysis of Oas1a and Il18 upon IL20RA reconstitution in ID8 cells. (B) The secreted IL-18 from IL20RA-reconstituted and control ID8 cells was measured by ELISA. (C) Western blot analysis of indicated proteins in IL20RA-reconstituted and control ID8 cells under the stimulation of IL-20. (D) Western blot analysis of indicated proteins in SK-OV-3 cells stimulated with IL-20 or phosphate-buffered saline (PBS) (Ctrl) for 24 hr. (E) ELISA measurement of IL-18 secreted from SK-OV-3 cells stimulated by IL-20 for 24 hr. (F) Schematic of the Oas1a promoter and Il18 promoter with predicted STAT3-binding sites and the primer sets. (G) IL20RA-reconstituted ID8 cells were stimulated with IL-20 or PBS (Ctrl) for 24 hr before the STAT3 binding on Oas1a promoter and Il18 promoter was analyzed by ChIP-qPCR. (H, I) Immunohistochemical analysis of IL20RA, p-STAT3, OAS1, and IL-18 in human primary ovarian cancer tissues (Pri) and paired peritoneal metastatic nodules (Met) (H) and quantification (I). **p<0.01; ***p<0.001, by paired two-sided Student’s t-test. Scale bar: 20 μm. (J) qRT-PCR analysis of macrophage marker genes in RAW 264.7 cells stimulated with IL-20 protein for 72 hr. (K) qRT-PCR analysis of macrophage marker genes in RAW 264.7 cells treated by CMIL20RA IL-20 (+) or CMVec IL-20 (+) together with IL-18 neutralizing antibody (nAb) or nonspecific lgG (IgG) for 72 hr. All the qRT-PCR and ELISA data are shown as means ± SEM from three independent experiments, *p<0.05, **p<0.01, ***p<0.001, by unpaired two-sided Student’s t-test.
-
Figure 7—source data 1
An Excel sheet with numerical quantification data.
- https://cdn.elifesciences.org/articles/66222/elife-66222-fig7-data1-v1.xlsx
Figure 7—figure supplement 1
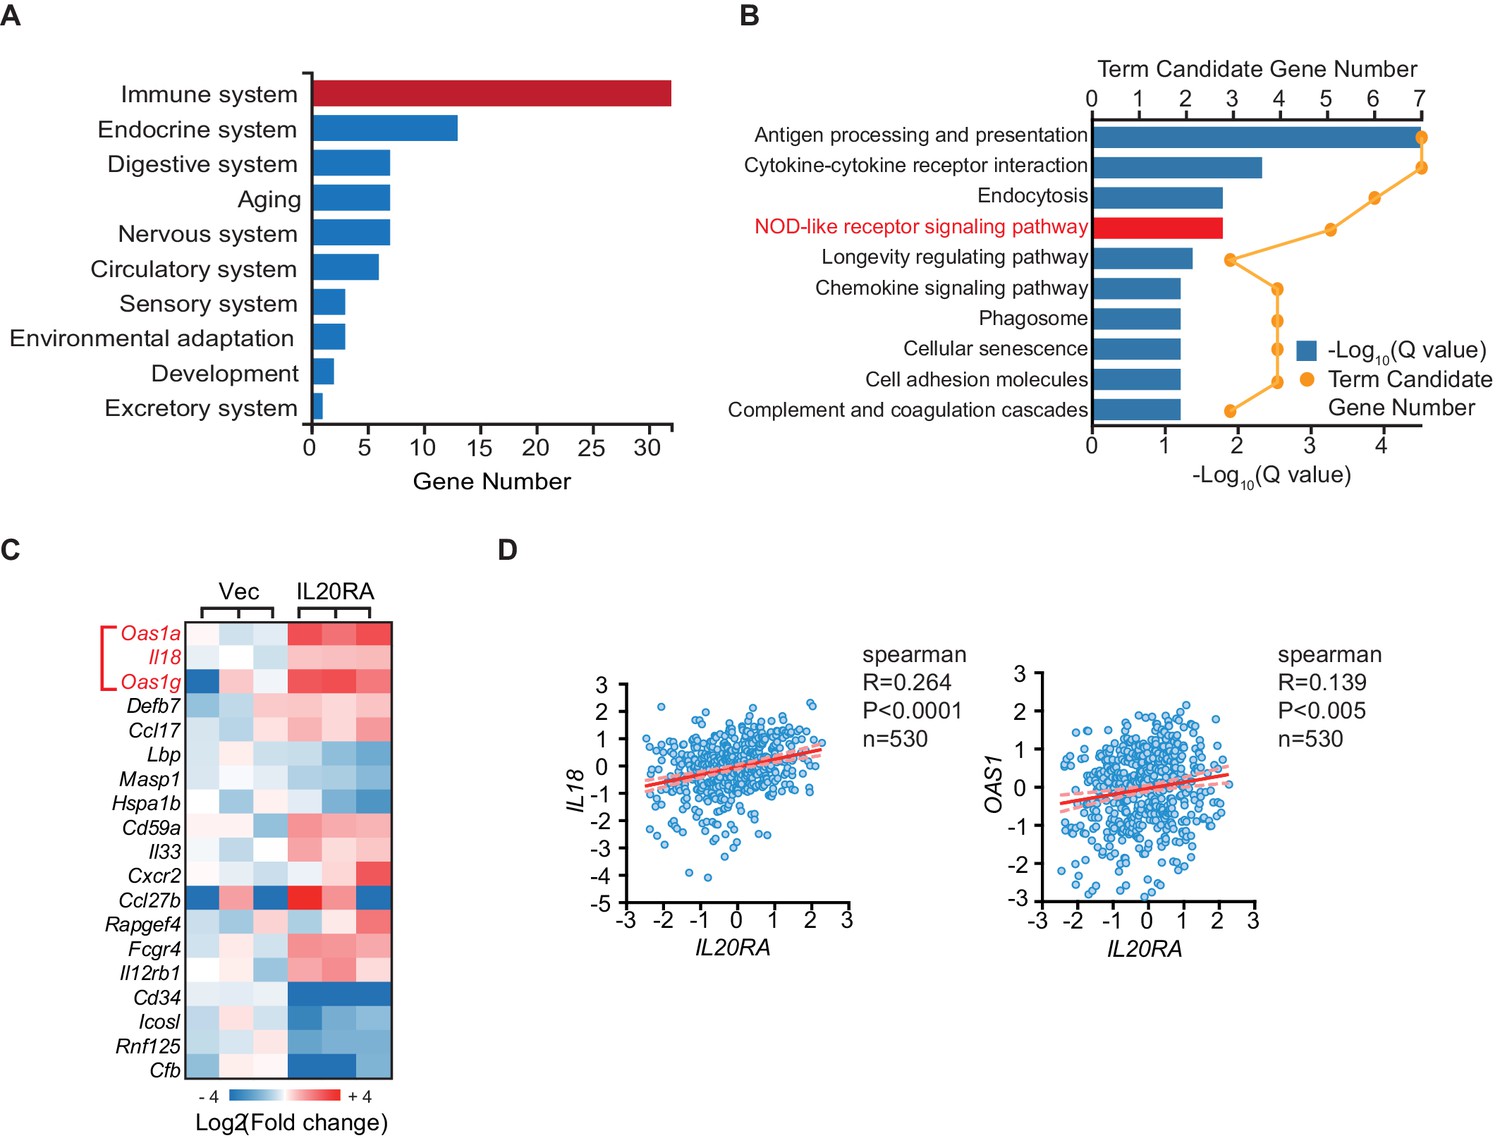
Kyoto Encyclopedia of Genes and Genomes (KEGG) analysis shows that IL-20 activates the OAS1/RNase L-NLR/IL-18 signaling.
(A) KEGG gene set (based on organism systems) enrichment analysis on significantly changed genes in IL20RA-reconstituted ID8 cells. (B) KEGG pathway enrichment analysis on significantly changed, immune-related genes in IL20RA-reconstituted ID8 cells. (C) Heatmap of differentially expressed, immune-related genes in IL20RA-reconstituted ID8 cells. (D) The Spearman’s correlation analysis on the expression of IL20RA, OAS1, and IL18 in ovarian cancer patients.
Figure 8 with 2 supplements
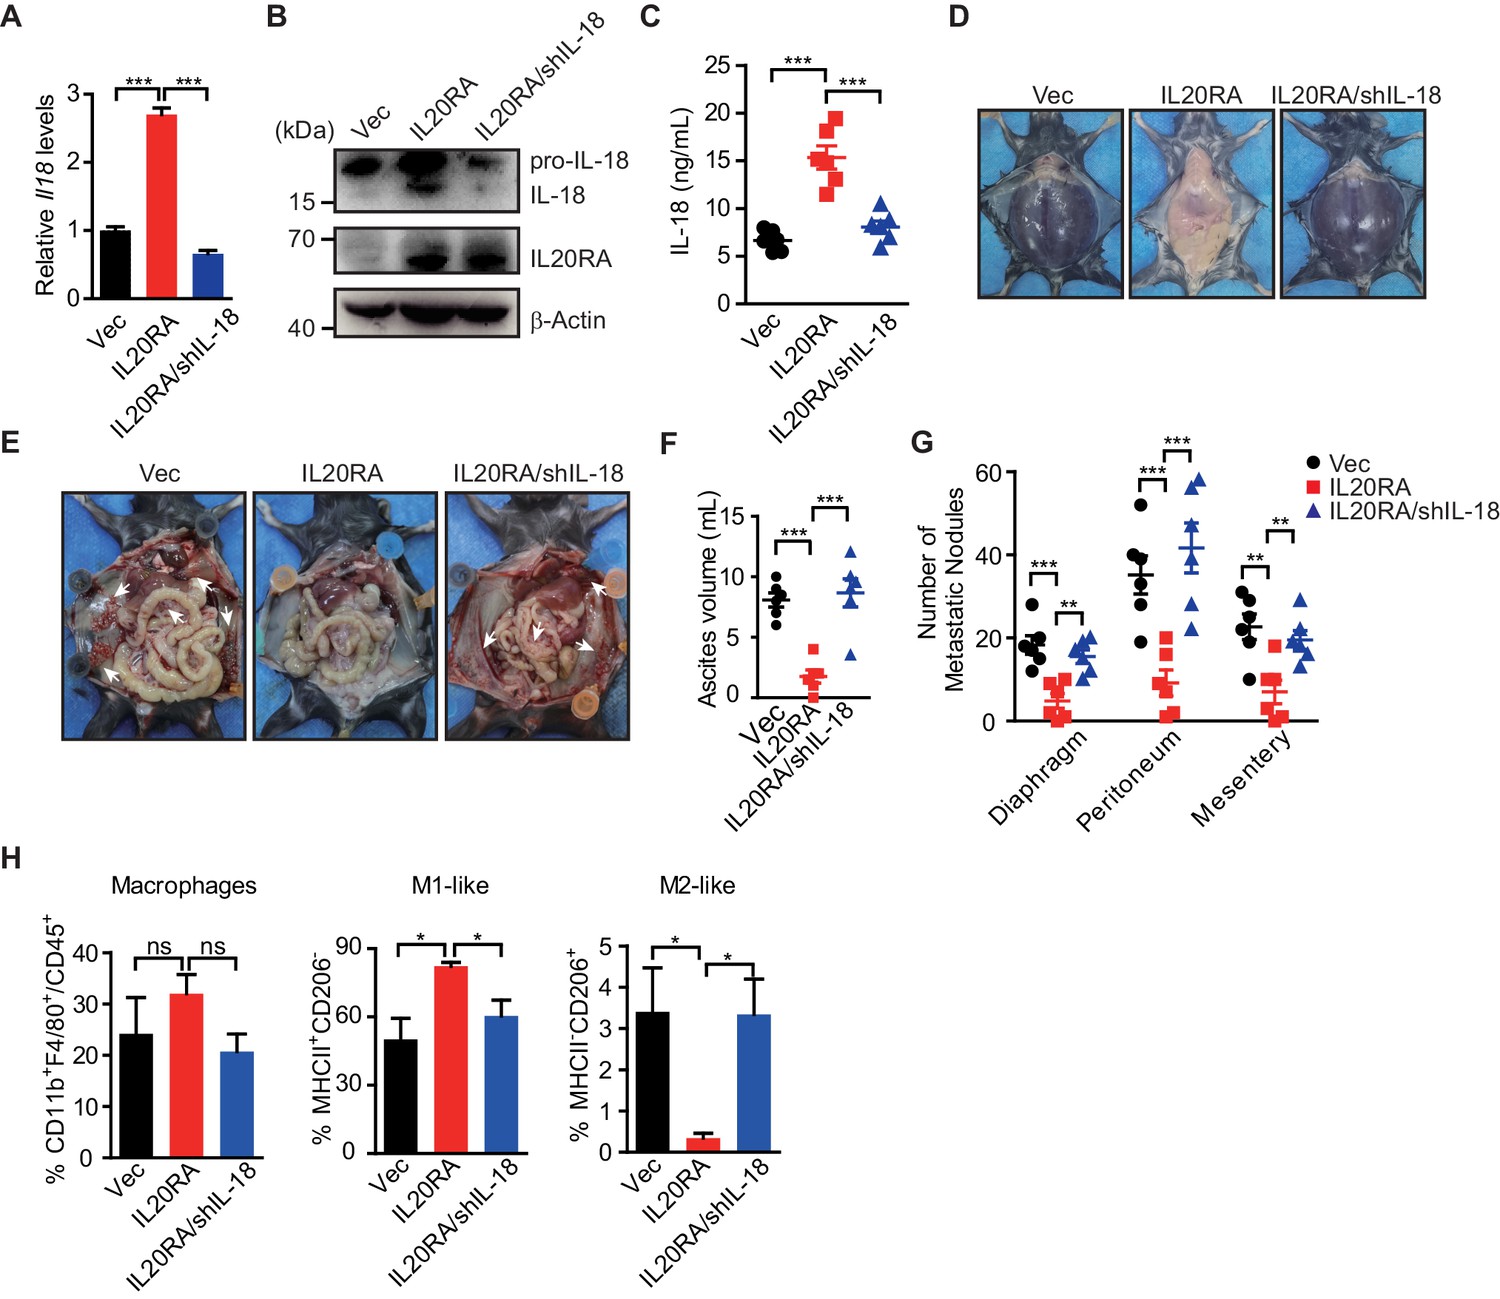
IL-18 is the essential factor downstream IL-20/IL20RA signaling to prevent the ovarian cancer dissemination.
(A) qRT-PCR analysis of Il18 in ID8Vec and ID8IL20RA cells transfected with shCtrl or shIL-18 (means ± SEM, ***p<0.001, by unpaired two-sided Student’s t-test). (B) Western blot analysis of IL-18 in ID8Vec and ID8IL20RA cells transfected with shCtrl or shIL-18. (C) ELISA measurement of IL-18 in ascites from mice with intraperitoneal injection of ID8Vec, ID8IL20RA, and ID8IL20RA/shIL-18 cells 45 days post-injection. Data are shown as means ± SEM, n = 6, ***p<0.001, by unpaired two-sided Student’s t-test. (D–G) Representative images of ascites formation (D) and the metastatic nodules in peritoneal cavity (E) of C57BL/6 mice at day 45 after intraperitoneal injected with ID8Vec, ID8IL20RA, and ID8IL20RA/shIL-18 cells. The quantification of ascites and metastatic nodules is shown in (F) and (G), respectively. Data are shown as means ± SEM, n = 6, **p<0.01, ***p<0.001, by unpaired two-sided Student’s t-test. (H) Flow cytometry analysis of macrophages (CD45+ CD11b+ F4/80+) and M1-like (MHC II+ CD206-) and M2-like (MHC II- CD206+) subpopulations in ascites formed in C57BL/6 mice at day 45 after intraperitoneal injected with ID8Vec, ID8IL20RA, and ID8IL20RA/shIL-18 cells. Data are shown as means ± SEM, n = 3, *p<0.05, ns, not significant, by unpaired two-sided Student’s t-test.
-
Figure 8—source data 1
An Excel sheet with numerical quantification data.
- https://cdn.elifesciences.org/articles/66222/elife-66222-fig8-data1-v1.xlsx
Figure 8—figure supplement 1
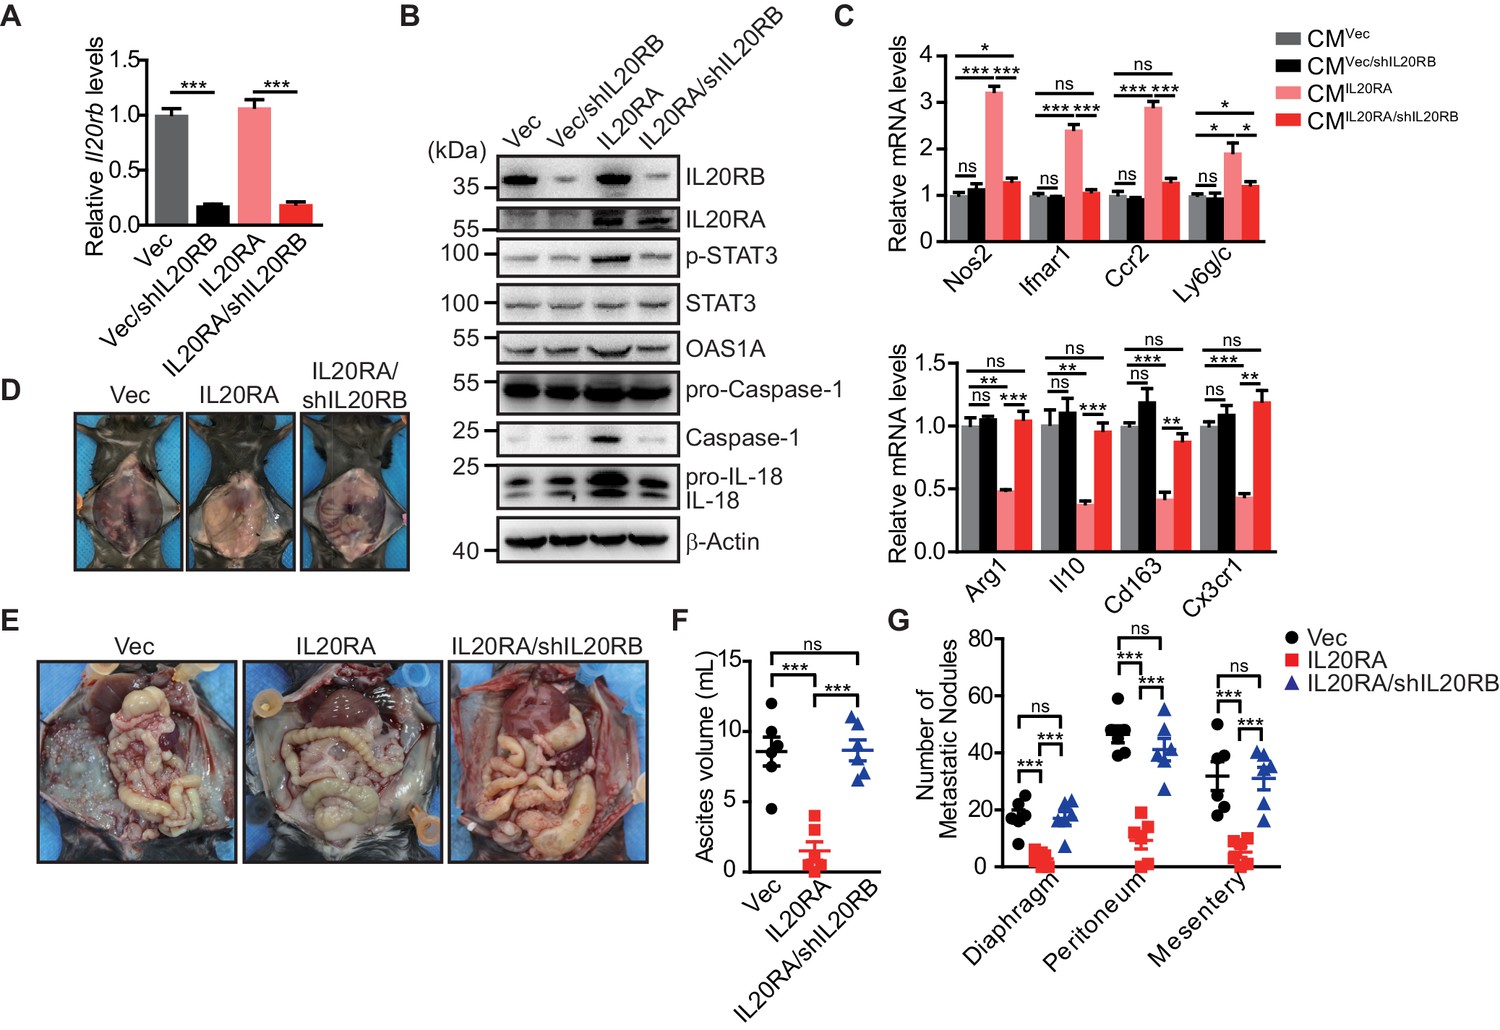
IL20RA signaling-inhibited ovarian cancer dissemination needs the functional IL20RA/IL20RB heterodimer receptor.
(A) qRT-PCR analysis of Il20rb in ID8Vec and ID8IL20RA cells transfected with shCtrl or shIL20RB (means ± SEM, ***p<0.001, by unpaired two-sided Student’s t-test). (B) Western blot analysis of indicated proteins in IL20RB-silenced ID8Vec and ID8IL20RA cells and their control cells under the stimulation of IL-20. (C) qRT-PCR analysis of macrophage marker genes in RAW 264.7 cells stimulated with conditioned medium of IL-20-stimulated IL20RB-silenced ID8Vec and ID8IL20RA cells and their control cells for 72 hr. Data are shown as means ± SEM from three independent experiments, *p<0.05, **p<0.01, ***p<0.001, ns, not significant, by unpaired two-sided Student’s t-test. (D–G) Representative images of ascites formation (D) and the metastatic nodules in peritoneal cavity (E) at day 45 after intraperitoneal injected with ID8Vec, ID8IL20RA, and ID8IL20RA/shIL20RB cells. The quantification of ascites and metastatic nodules is shown in (F) and (G), respectively. Data are shown as means ± SEM, n = 6, ***p<0.001, ns, not significant, by unpaired two-sided Student’s t-test.
Figure 8—figure supplement 2
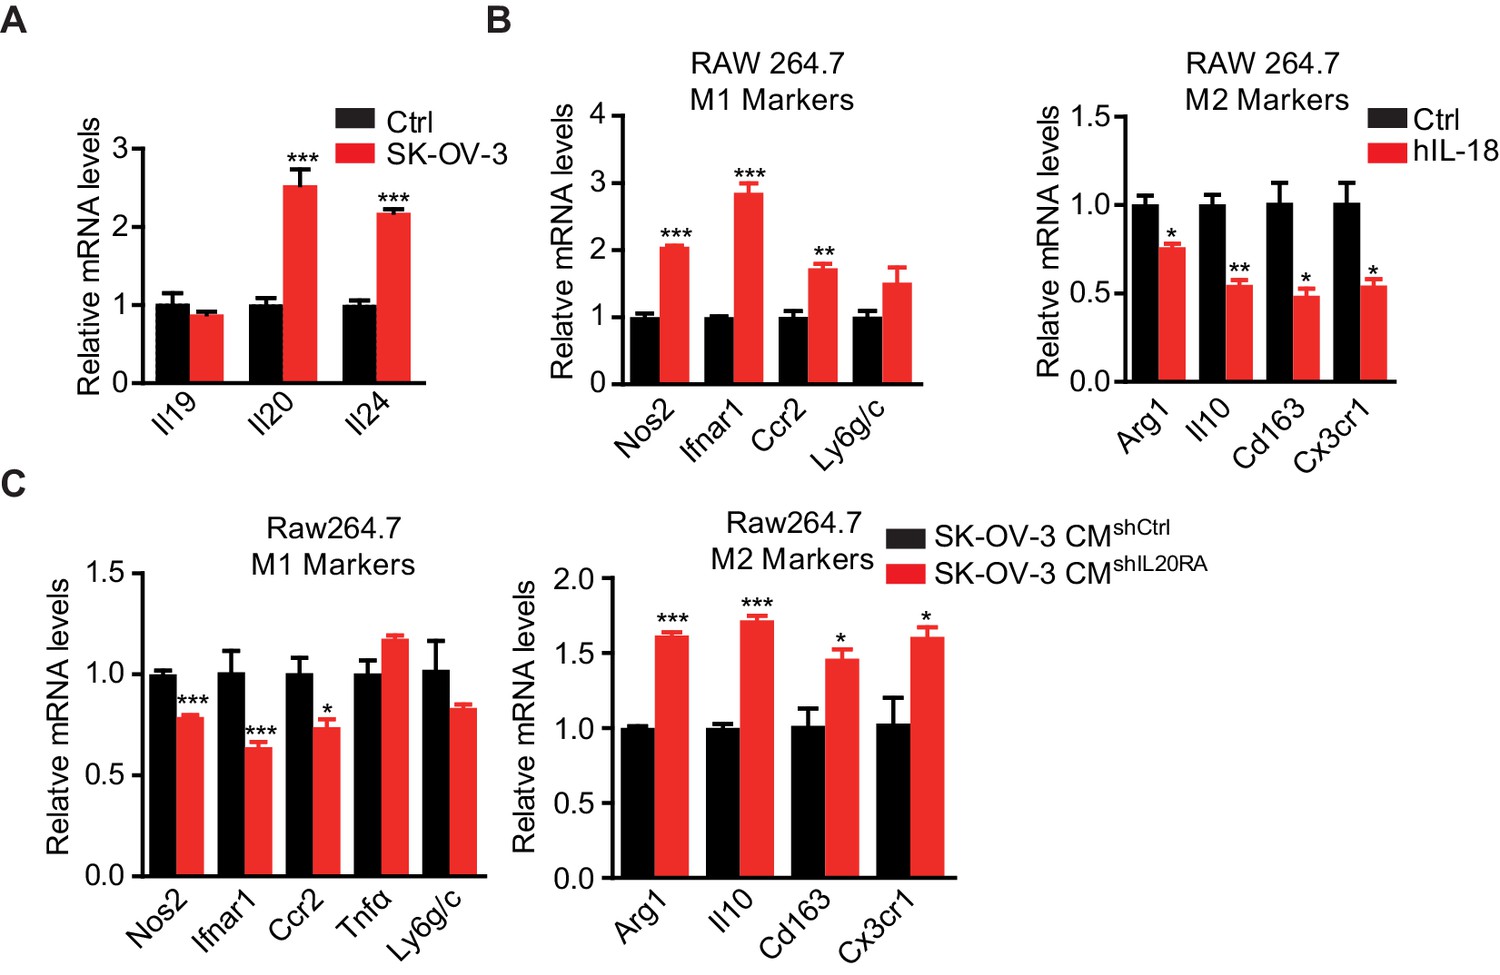
The cross-reaction of cytokines involved in IL20RA-mediated signaling.
(A) qRT-PCR analysis of potential IL20RA ligands from the abdominal wall taken from C57BL/6 mice with intraperitoneal injection of SK-OV-3 cells or phosphate-buffered saline control (Ctrl) 9 days before. (B) qRT-PCR analyses of macrophage marker genes in RAW 264.7 cells stimulated with human IL-18 protein for 72 hr. (C) qRT-PCR analysis of macrophage marker genes in RAW 264.7 cells treated with conditioned medium from IL-20-stimulated shIL20RA or control shRNA (shCtrl)-transfected SK-OV-3 cells for 72 hr. All the qRT-PCR data are shown as means ± SEM from three independent experiments, *p<0.05, **p<0.01, ***p<0.001, by unpaired two-sided Student’s t-test.
Figure 9
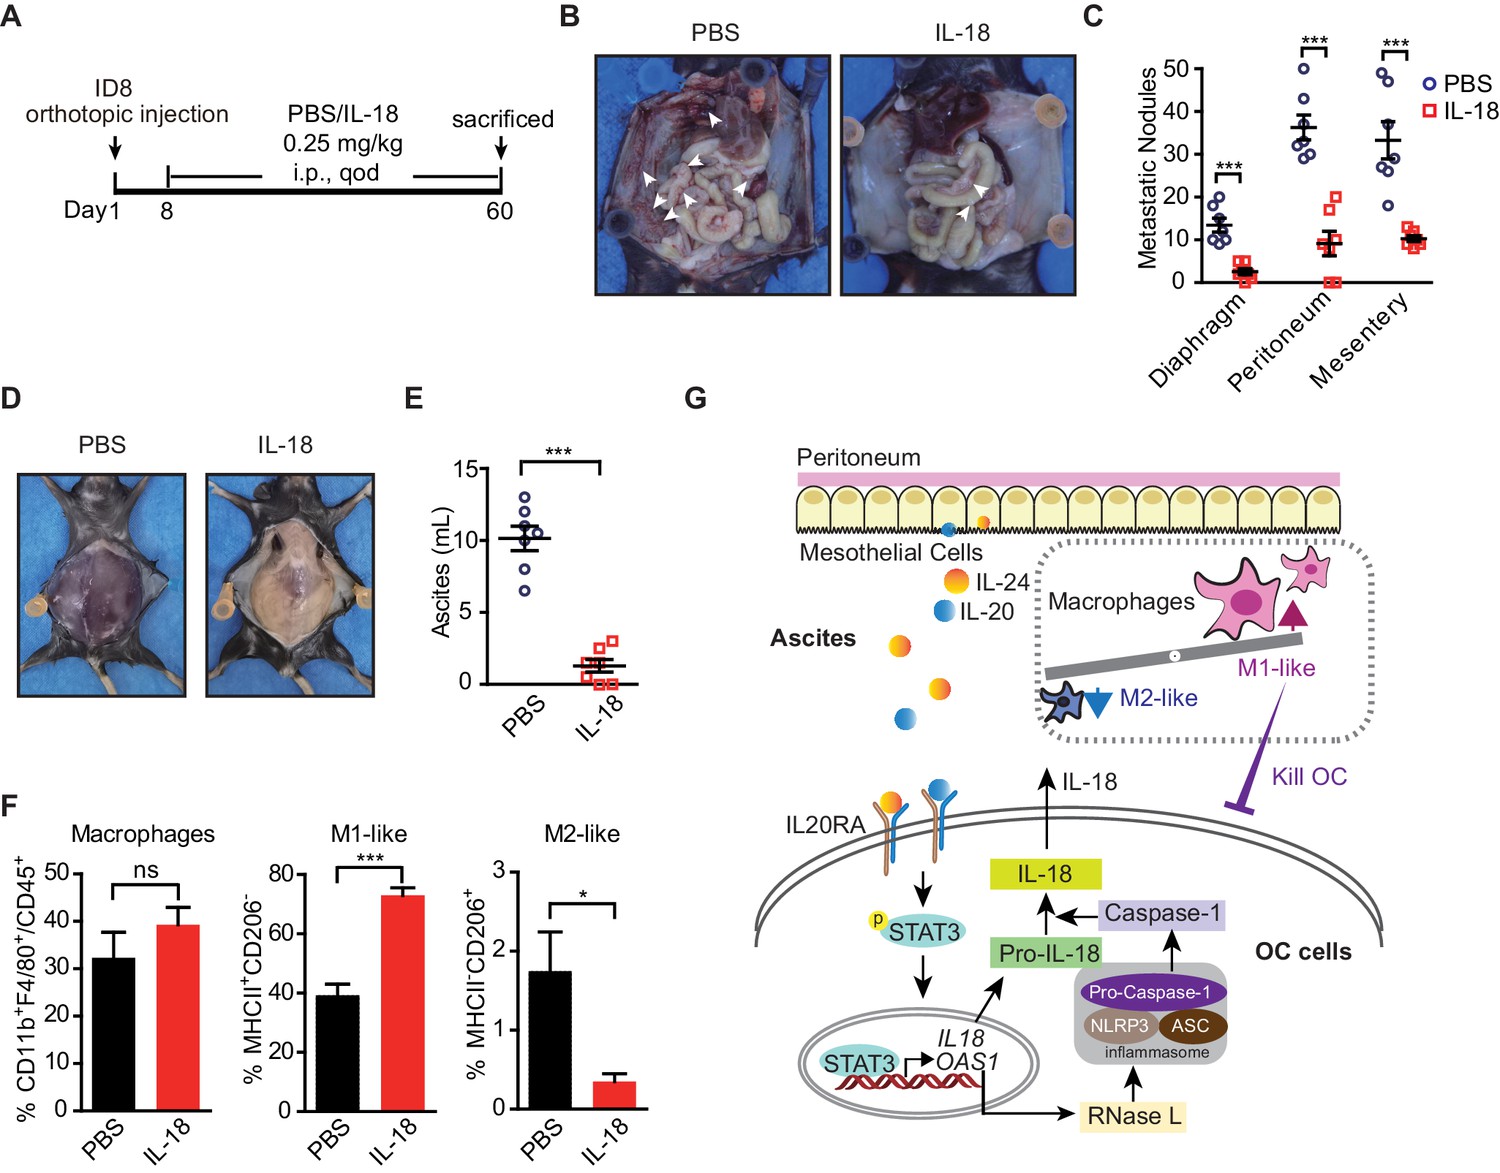
The therapeutic effect of recombinant IL-18 against the metastasis of ovarian cancer (OC).
(A) Schematic of the experiments. ID8 cells were orthotopic injected into the ovaries of C57BL/6 mice. The phosphate-buffered saline or IL-18 protein were intraperitoneal (i.p.) injected every 2 days. (B–E) Representative images of the metastatic nodules in peritoneal cavity (B) and ascites formation (D) at day 60 post-inoculation. The quantification of metastatic nodules and ascites is shown in (C) and (E), respectively. Data are shown as means ± SEM (n = 7). ***p<0.001, by unpaired two-sided Student’s t-test. (F) Flow cytometry analysis of macrophages (CD45+ CD11b+ F4/80+) and M1-like (MHC II+ CD206-) and M2-like (MHC II- CD206+) subpopulations in ascites formed in C57BL/6 mice at 60 days after orthotopically inoculated with ID8 cells (means ± SEM, n = 5, *p<0.05, ***p<0.001, ns, not significant, by unpaired two-sided Student’s t-test). (G) Schematics summarizing the IL-20/IL20RA-OAS1/RNase L-NLR-IL-18 axis in preventing the transcoelomic metastasis of OC.
-
Figure 9—source data 1
An Excel sheet with numerical quantification data.
- https://cdn.elifesciences.org/articles/66222/elife-66222-fig9-data1-v1.xlsx
Author response image 1

The mRNA levels of Tex14 in IL20RA-reconstituted ID8 cells and IL20RA-silenced SK-OV-3 cells.
The cells are treated with 2.5 ng/mL recombinant IL-20 protein before qRT-PCR analysis of Tex14 transcription.
Author response image 2
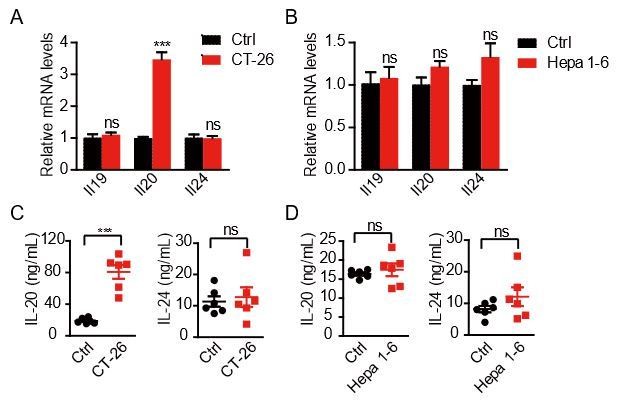
The expression of IL20RA ligands in the abdominal wall challenged by colon cancer cells and hepatocellular carcinoma cells.
A-B. qRT-PCR analysis of IL20RA ligands from the abdominal wall in mice with the intraperitoneal injection of CT-26 cells (A) and Hepa 1-6 cells (B). C-D. ELISA measurement of IL-20 and IL-24 in peritoneal flushing fluid from mice with intraperitoneal injection of CT-26 cells (C) and Hepa 1-6 cells (D).
Tables
Key resources table
| Reagent type (species) or resource | Designation | Source or reference | Identifiers | Additional information |
|---|---|---|---|---|
| Gene (Mus musculus) | Il20ra | GenBank | Gene ID: 237313 | |
| Strain, strain background (Escherichia coli) | DH5α | Shanghai Weidi Biotechnology | Cat.#: DL1002 | |
| Strain, strain background (Escherichia coli) | BL21(DE3) | CWBIO | Cat.#: CW0809S | |
| Cell line (Homo sapiens) | THP-1 | ATCC | RRID:CVCL_0006 | |
| Cell line (Homo sapiens) | HEK 293T | ATCC | RRID:CVCL_0063 | |
| Cell line (Homo sapiens) | SK-OV-3 | ATCC | RRID:CVCL_0532 | |
| Cell line (Mus musculus) | RAW 264.7 | ATCC | RRID:CVCL_0493 | |
| Cell line (Mus musculus) | ID8 | Merck | RRID:CVCL_IU14 | |
| Transfected construct (Homo sapiens) | IL20RA shRNA | Sangon Biotech | ||
| Transfected construct (Mus musculus) | Il18 shRNA | Sangon Biotech | ||
| Transfected construct (Mus musculus) | Il20rb shRNA | Sangon Biotech | ||
| Antibody | Anti-IL20RA (Rabbit polyclonal) | Abcam | RRID:AB_2123854 | WB (1:1000) IHC (1:200) |
| Antibody | Anti-IL20RB (Mouse monoclonal) | Proteintech | RRID:AB_11182930 | WB (1:1000) |
| Antibody | Anti-ACTB (Mouse monoclonal) | Immunoway | RRID:AB_2629465 | WB (1:5000) |
| Antibody | Anti-STAT3 (Mouse monoclonal) | Santa Cruz Biotechnology | RRID:AB_628293 | WB (1:1000) |
| Antibody | Anti-STAT3 (Mouse monoclonal) | Cell Signaling Technology | RRID:AB_331757 | ChIP (5 μL for 7 μg DNA) |
| Antibody | Anti-p-STAT3 (Mouse monoclonal) | Santa Cruz Biotechnology | RRID:AB_628292 | WB (1:1000) |
| Antibody | Anti-p-STAT3 (Rabbit polyclonal) | Signalway Antibody | RRID:AB_895980 | IHC (1:200) |
| Antibody | Anti-IL18 (Rabbit polyclonal) | Proteintech | RRID:AB_2123636 | WB (1:1000) IHC (1:200) |
| Antibody | Anti-OAS1A (Mouse monoclonal) | Santa Cruz Biotechnology | RRID:AB_10990911 | WB (1:1000) |
| Antibody | Anti-OAS1 (Rabbit polyclonal) | Proteintech | RRID:AB_2158292 | WB (1:1000) IHC (1:200) |
| Antibody | Anti-Caspase-1 (Rabbit polyclonal) | Proteintech | RRID:AB_2876874 | WB (1:1000) |
| Antibody | Anti-ARG1 (Rabbit polyclonal) | Proteintech | RRID:AB_2289842 | IHC (1:750) |
| Antibody | Anti-NOS2 (Rabbit polyclonal) | Proteintech | RRID:AB_2782960 | IHC (1:750) |
| Antibody | Anti-IL20 (Rabbit polyclonal) | Abclonal | RRID:AB_2750843 | IF (1:200) IHC (1:200) |
| Antibody | Anti-IL24 (Rabbit polyclonal) | Proteintech | RRID:AB_2880630 | IF (1:200) IHC (1:200) |
| Antibody | Anti-Cytokeratin 18 (Mouse monoclonal) | Abcam | RRID:AB_305647 | IF (1:200) |
| Antibody | Anti-CD16/CD32 (Mouse monoclonal) | eBioscience | RRID:AB_467133 | FACS (1:200) |
| Antibody | Anti-CD45-PE (Mouse monoclonal) | Biolegend | RRID:AB_312971 | FACS (1:200) |
| Antibody | Anti-CD11b-APC (Mouse monoclonal) | Biolegend | RRID:AB_312795 | FACS (1:200) |
| Antibody | Anti-F4/80-APC/CY7 (Mouse monoclonal) | Biolegend | RRID:AB_10803170 | FACS (1:200) |
| Antibody | Anti-I-A/I-E-PERCP/CY5.5 (rat monoclonal) | Biolegend | RRID:AB_2191071 | FACS (1:200) |
| Antibody | Anti-CD206-FITC (Mouse monoclonal) | Biolegend | RRID:AB_10900988 | FACS (1:200) |
| Antibody | Anti-CD11c-FITC (Mouse monoclonal) | BD Biosciences | RRID:AB_396683 | FACS (1:200) |
| Antibody | Anti-CD3-FITC (Mouse monoclonal) | Biolegend | RRID:AB_312661 | FACS (1:200) |
| Antibody | Anti-CD4-APC (Rat monoclonal) | BD Biosciences | RRID:AB_398528 | FACS (1:200) |
| Antibody | Anti-CD8-PE/CY7 (Mouse monoclonal) | eBioscience | RRID:AB_469584 | FACS (1:200) |
| Antibody | Anti-CD45R/B220-FITC (Rat monoclonal) | BD Biosciences | RRID:AB_394617 | FACS (1:200) |
| Recombinant DNA reagent | pLV-H1-EF1α-puro (plasmid) | Biosettia | Cat.#: SORT-B19 | |
| Recombinant DNA reagent | pLV-EF1α-MCS-IRES-Bsd (plasmid) | Biosettia | Cat.#: cDNA-pLV03 | |
| Recombinant DNA reagent | pET-20b(+) vector (plasmid) | Novagen | Cat.#: 69739–3 | |
| Peptide, recombinant protein | Murine recombinant IL-20 protein | Origene | Cat.#: TP723795 | |
| Peptide, recombinant protein | Murine recombinant IL-24 protein | R&D Systems | Cat.#: 7807 ML-010 | |
| Peptide, recombinant protein | Human recombinant IL-20 protein | Sino Biological | Cat.#: 13060-HNAE | |
| Peptide, recombinant protein | Murine recombinant M-CSF | Peprotech | Cat.#: 315-02-10 | |
| Chemical compound | PMA | Sigma-Aldrich | Cat.#: 16561-29-8 | |
| Chemical compound | Clodronate liposomes | LIPOSOMA | Cat.#: CP-030030 | |
| Commercial assay or kit | Murine IL18 ELISA Kit | Wuxin Donglin Sci & Tech Development | Cat.#: DL-IL18-Mu | |
| Commercial assay or kit | Human IL18 ELISA Kit | Wuxin Donglin Sci & Tech Development | Cat.#: DL-IL18-Hu | |
| Commercial assay or kit | Murine IL20 ELISA Kit | Wuxin Donglin Sci & Tech Development | Cat.#: DL-IL20-Mu | |
| Commercial assay or kit | Murine IL24 ELISA Kit | Wuxin Donglin Sci & Tech Development | Cat.#: DLIL24-Mu | |
| Commercial assay or kit | ChIP-IT Express Kits | Active Motif | Cat.#: 53035 |
Additional files
-
Supplementary file 1
Primes for qPCR.
The primers used for qRT-PCR and ChIP- qPCR analyses.
- https://cdn.elifesciences.org/articles/66222/elife-66222-supp1-v1.docx
-
Transparent reporting form
- https://cdn.elifesciences.org/articles/66222/elife-66222-transrepform-v1.pdf
Download links
A two-part list of links to download the article, or parts of the article, in various formats.
Downloads (link to download the article as PDF)
Open citations (links to open the citations from this article in various online reference manager services)
Cite this article (links to download the citations from this article in formats compatible with various reference manager tools)
A systematic CRISPR screen reveals an IL-20/IL20RA-mediated immune crosstalk to prevent the ovarian cancer metastasis
eLife 10:e66222.
https://doi.org/10.7554/eLife.66222


