Uncovering a ‘sensitive window’ of multisensory and motor neuroplasticity in the cerebrum and cerebellum of male and female starlings
- Bio-Imaging Lab, University of Antwerp, Belgium
- Laboratory of Comparative Endocrinology, Biology Department, Belgium
Figures
Figure 1 with 1 supplement
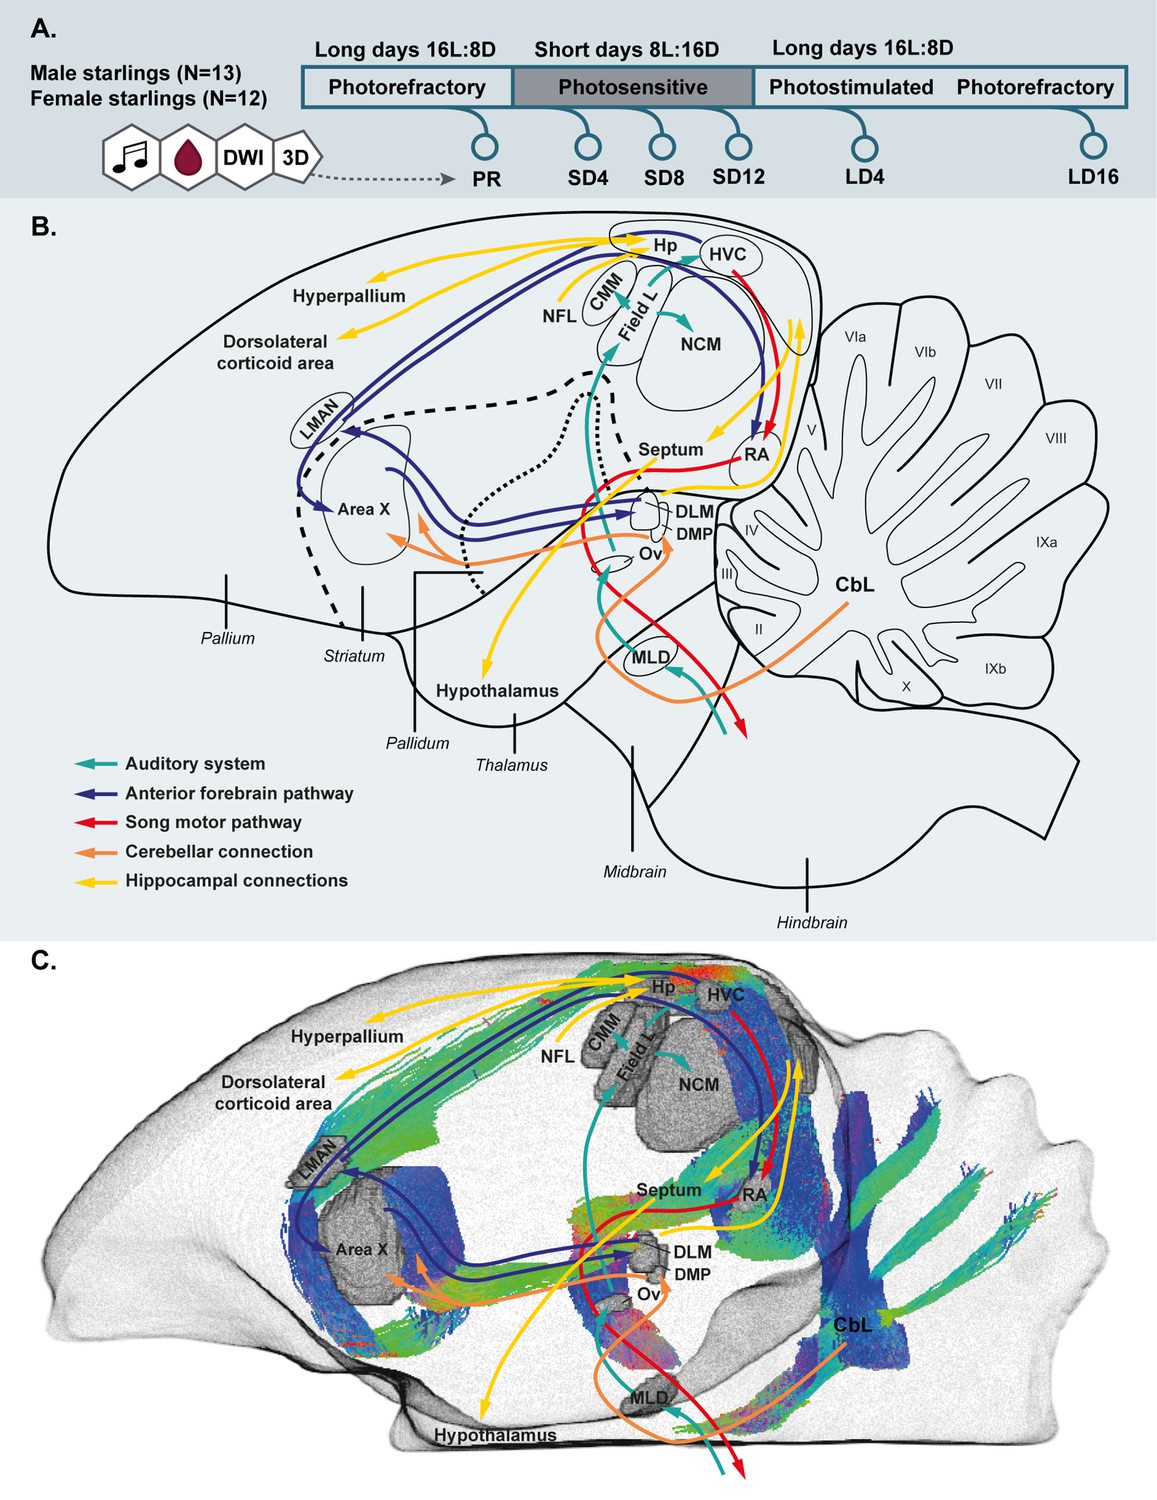
Simplified overview of the experimental setup.
(A). Schematic overview of the song control and auditory system of the songbird brain and the cerebellar and hippocampal connections to the rest of the brain (B) and unilateral DWI-based 3D representation of the different nuclei and the interconnecting tracts as deduced from the tractogram (C). Male and female starlings were measured repeatedly as they went through different photoperiods. At each time point, their songs were recorded, blood samples were collected and T2-weighted 3D anatomical and diffusion weighted images (DWI) were acquired. The 3D anatomical images were used to extract whole brain volume (A). The song control system is subdivided in the anterior forebrain pathway (blue arrows) and the song motor pathway (red arrows). The auditory pathway is indicated by green arrows. The orange arrows indicate the connection of the lateral cerebellar nucleus (CbL) to the dorsal thalamic region further connecting to the song control system as suggested by Person et al., 2008; Pidoux et al., 2018 (B,C). Nuclei in (C) are indicated in gray, the tractogram is color-coded according to the standard red-green-blue code (red = left right orientation (L-R), blue = dorso ventral (D-V) and green = rostro caudal (R-C)).
Figure 1—video 1
Movie of the unilateral 3D representation of the different nuclei and the interconnecting tracts rotating along the vertical axis.
Figure 2 with 1 supplement
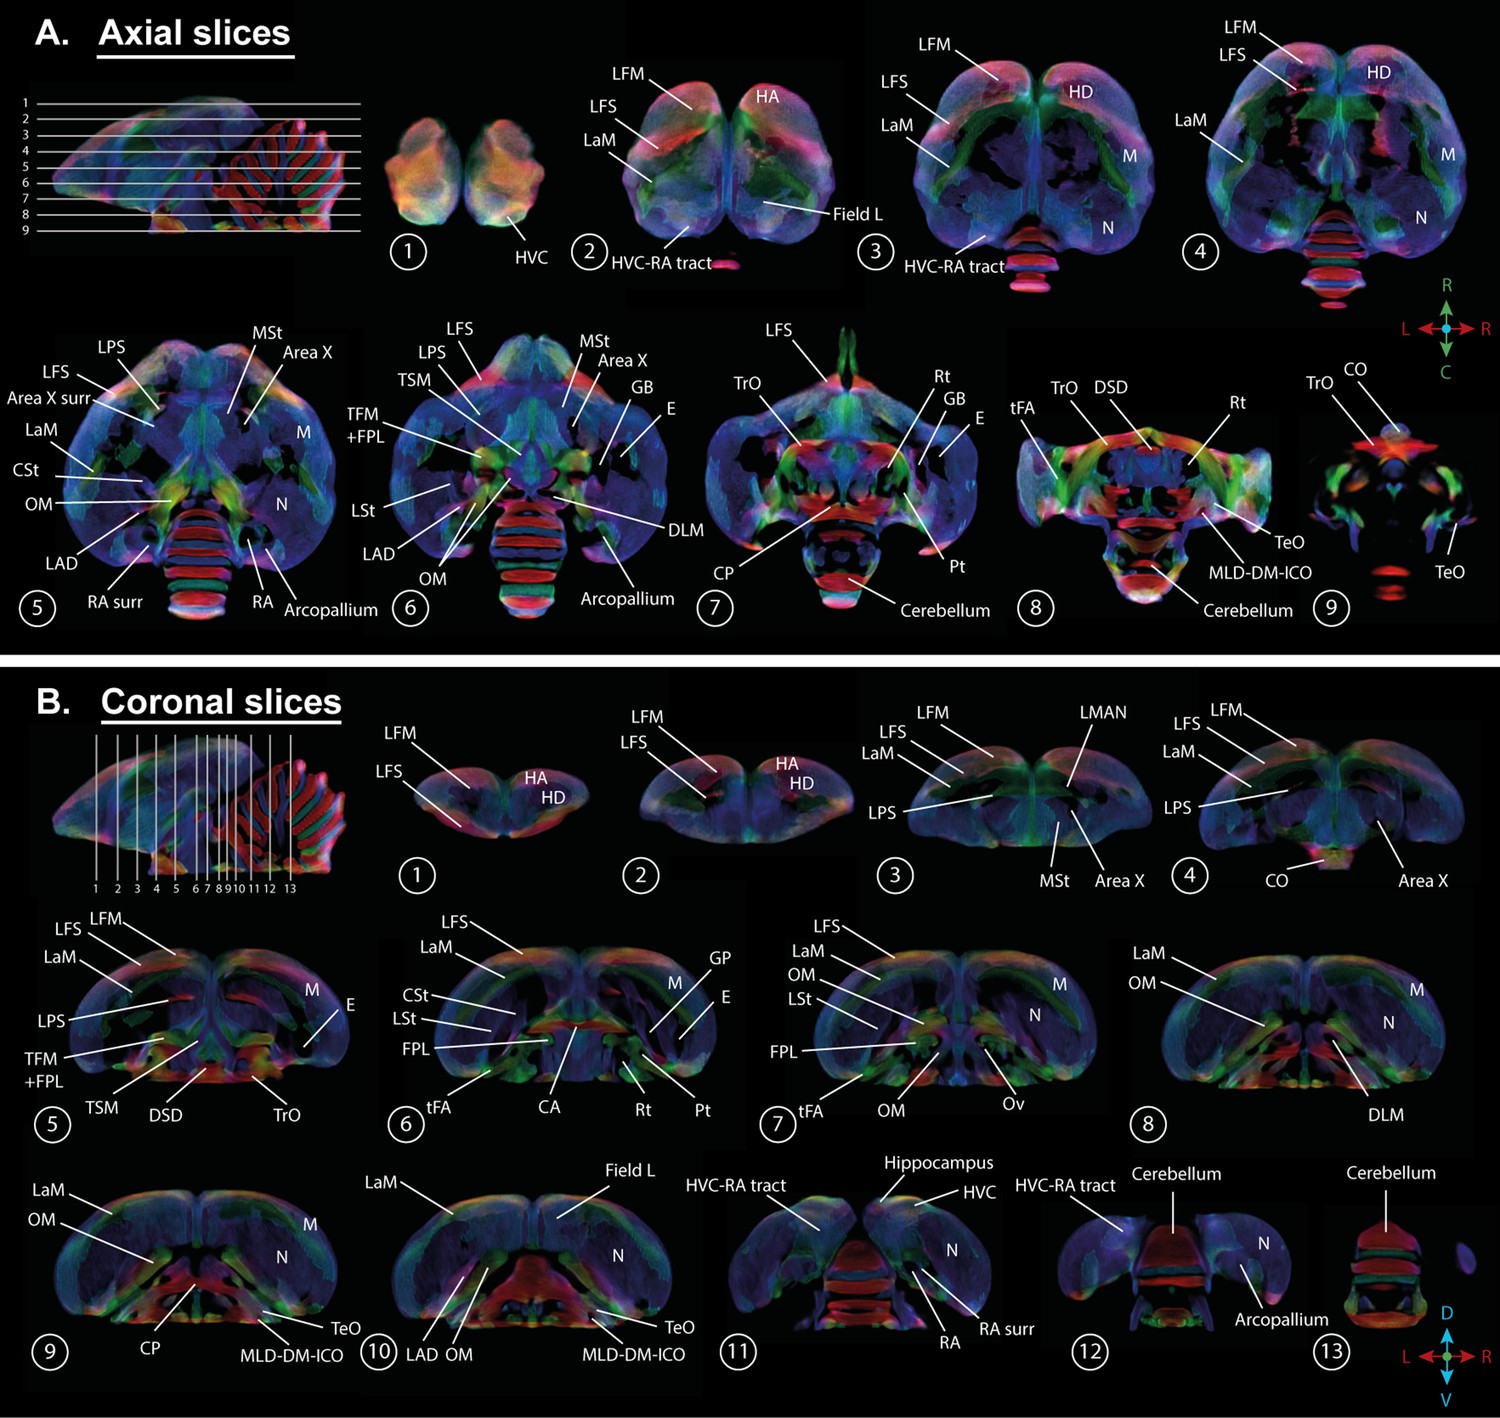
Overview of the population-based tractogram of male and female starlings over the seasons created for the fixel-based analysis with indications of different lamina, interconnecting tracts, nuclei, and brain regions displayed on axial (A) and coronal slices (B) throughout the brain.
The different intervals of the coronal and axial sectioning are indicated on the saggittal inset in the left corner of each panel. The coronal slices do not follow a strict interval to visualise small nuclei such as DLM and Ov. The crosshair indicates the color-coding of the tractogram following the standard red-green-blue code (red = left right orientation (L-R), blue = dorso ventral (D-V) and green = rostro caudal (R-C)).
Figure 2—video 1
Movie of the population-based tractogram of male and female starlings scanning through the coronal slices with the different lamina, interconnecting tracts, nuclei, and brain regions indicated.
Figure 3 with 1 supplement
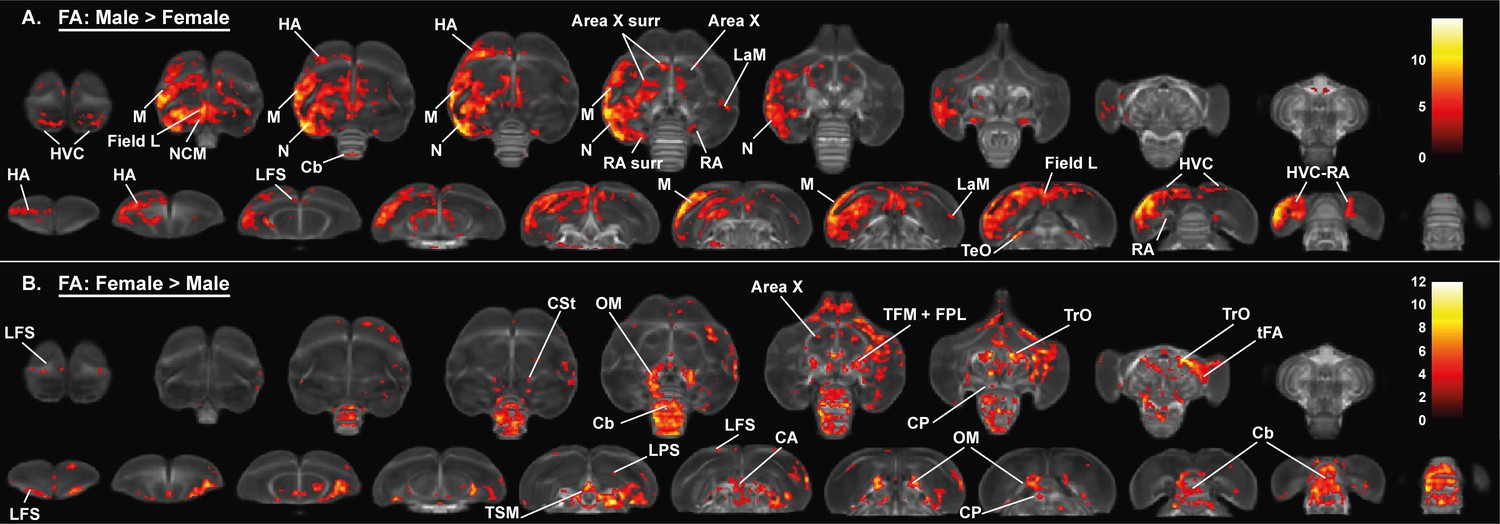
Overview of the general structural sexual dimorphism within the starling brain attributed to differences in fractional anisotropy (FA).
For each sex comparison, the statistical parametric maps are displayed on axial and coronal sections throughout the brain (upper and lower row, respectively). The results are displayed with puncorr <0.001 and kE ≥ 10 voxels, and overlaid on the population fractional anisotropy map. The T-values are color-coded according to the scale on the right. In males, fractional anisotropy was higher in a large cluster lateralized to the left hemisphere and covering parts of the nidopallium and mesopallium, including several regions of the auditory system and surrounding the song control system. Females, on the other hand, have higher fractional anisotropy at the level of the cerebellum and several tracts such as OM, TSM, and TrO.
Figure 3—figure supplement 1
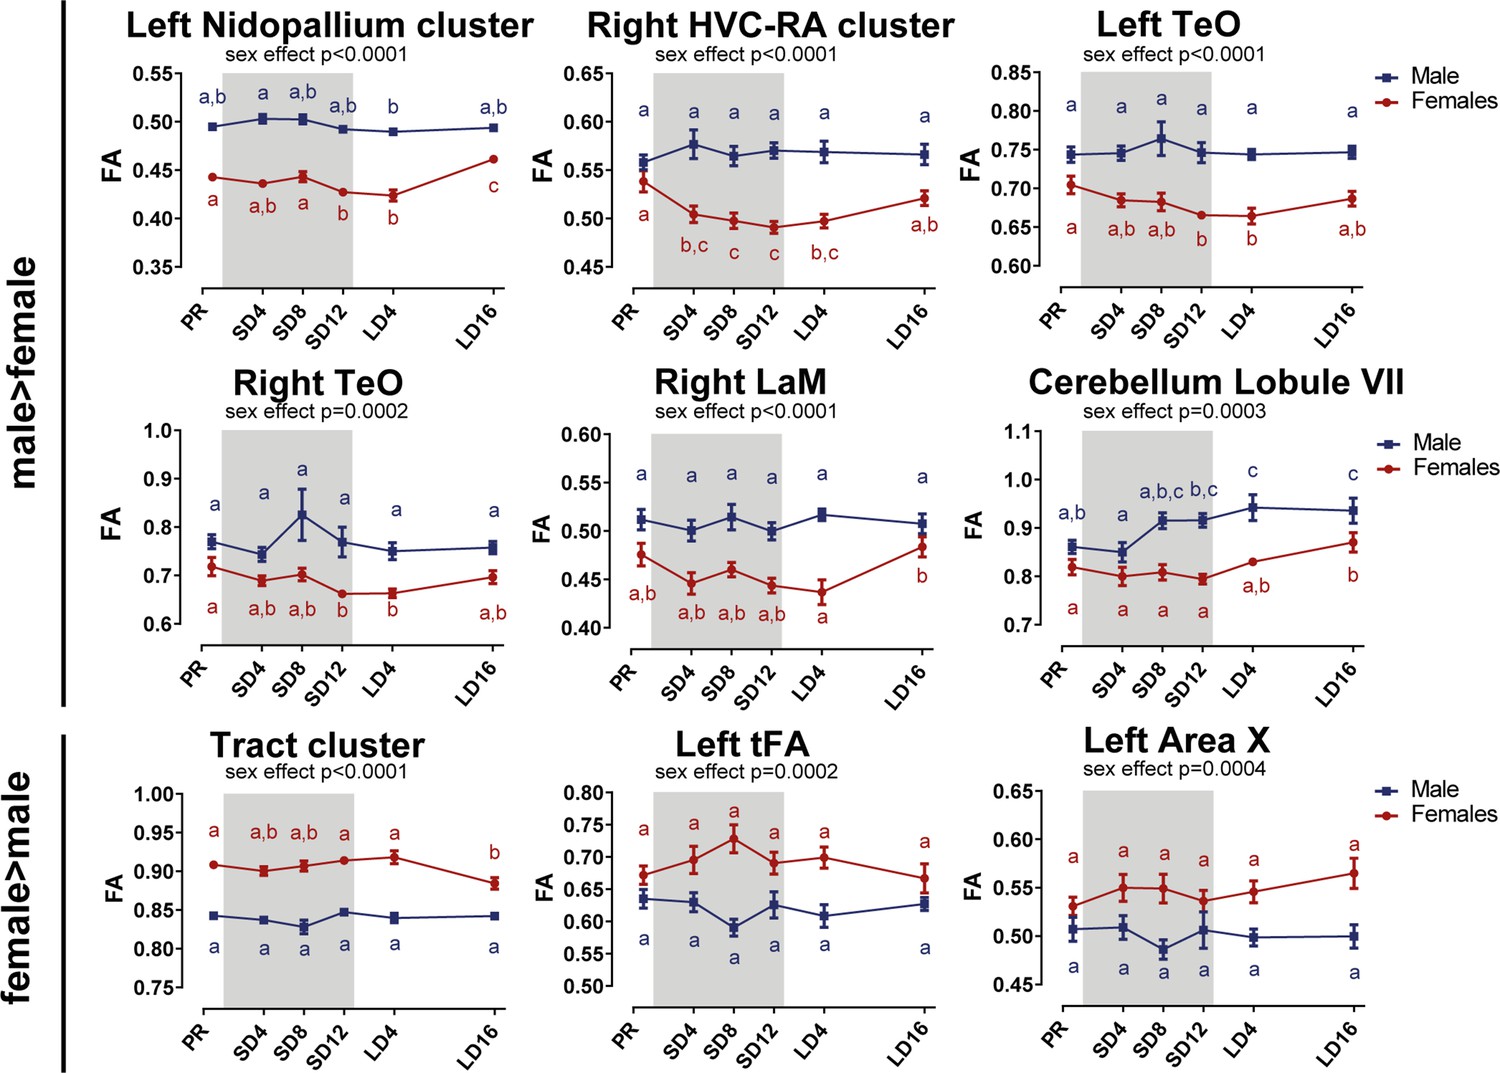
Overview of the fractional anisotropy (FA) changes over time extracted from the relevant ROI-based clusters with significant sex differences.
Many of the singificant regions are part of the same cluster. The nidopallium cluster extends to the mesopallium, left RA and Area X surrounding, and the tract cluster includes the OM, TSM, TFM, FPL, CA, CP, TrO, and cerebellum. The gray area indicates the entire photosensitive period of short days (8L:16D). Significant sex differences are reported with their p-value under the respective ROI-based cluster. Different letters denote significant differences by comparison with each other in post-hoc t-tests with p<0.05 (Tukey’s HSD correction for multiple comparisons) comparing the different time points to each other. If two time points share the same letter, the fractional anisotropy values are not significantly different from each other.
-
Figure 3—figure supplement 1—source data 1
This file contains the source data used to make the graphs presented in Figure 3—figure supplement 1.
- https://cdn.elifesciences.org/articles/66777/elife-66777-fig3-figsupp1-data1-v2.xlsx
Figure 4 with 3 supplements
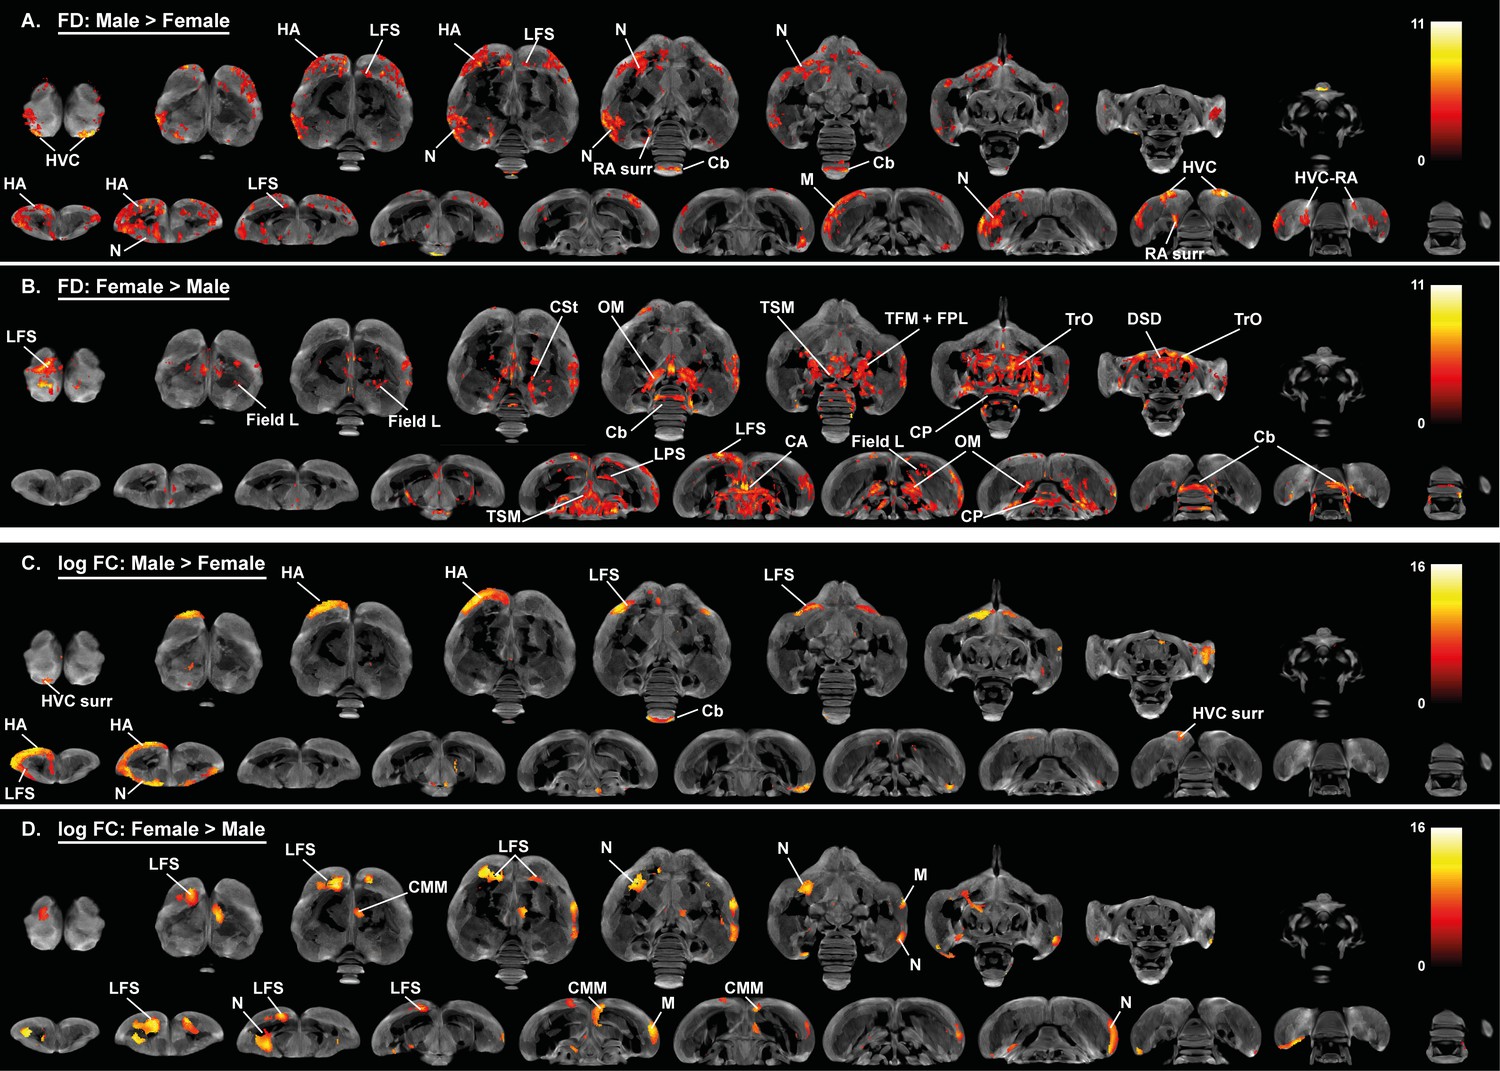
Overview of the general structural sexual dimorphism within the starling brain attributed to microscopic differences in fiber density (FD) (A, B) and macroscopic differences in fiber-bundle cross-section (log FC) (C, D).
For each sex comparison, the statistical parametric maps are displayed on axial and coronal sections throughout the brain (upper and lower row respectively). The results are displayed with puncorr <0.001, and overlaid on the population based tractogram. Only significant tracks are displayed in a color representing the T-value.
-
Figure 4—source data 1
This file contains the source data used to make the graphs presented in Figure 4—figure supplement 2 and 3.
- https://cdn.elifesciences.org/articles/66777/elife-66777-fig4-data1-v2.xlsx
Figure 4—figure supplement 1
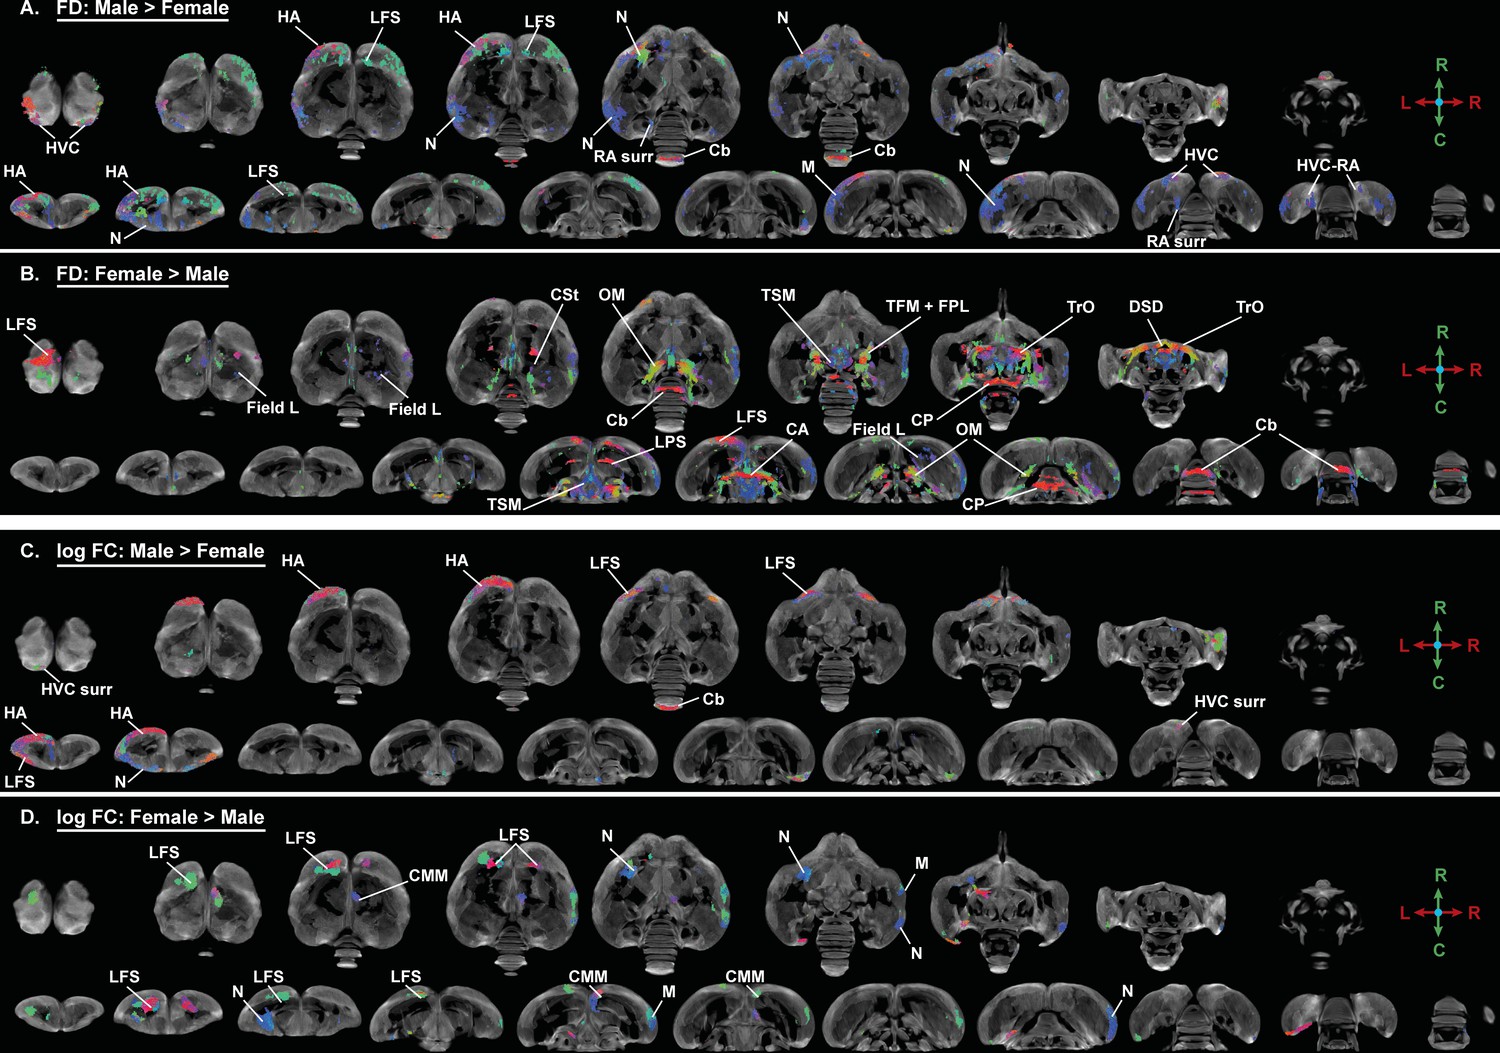
Overview of the general structural sexual dimorphism within the starling brain attributed to microscopic differences in fiber density (FD) (A, B) and macroscopic differences in fiber-bundle cross-section (log FC) (C, D) using fiber orientation color coding.
For each sex comparison, the statistical parametric maps are displayed on axial and coronal sections throughout the brain (upper and lower row, respectively). The results are displayed with puncorr <0.001, and overlaid on the population-based tractogram. Only significant tracks are displayed in a color according to the fiber orientation using the standard red-green-blue code as indicated by the crosshair (red = left right orientation (L-R), blue = dorso ventral (D-V) and green = rostro caudal (R-C)).
Figure 4—figure supplement 2
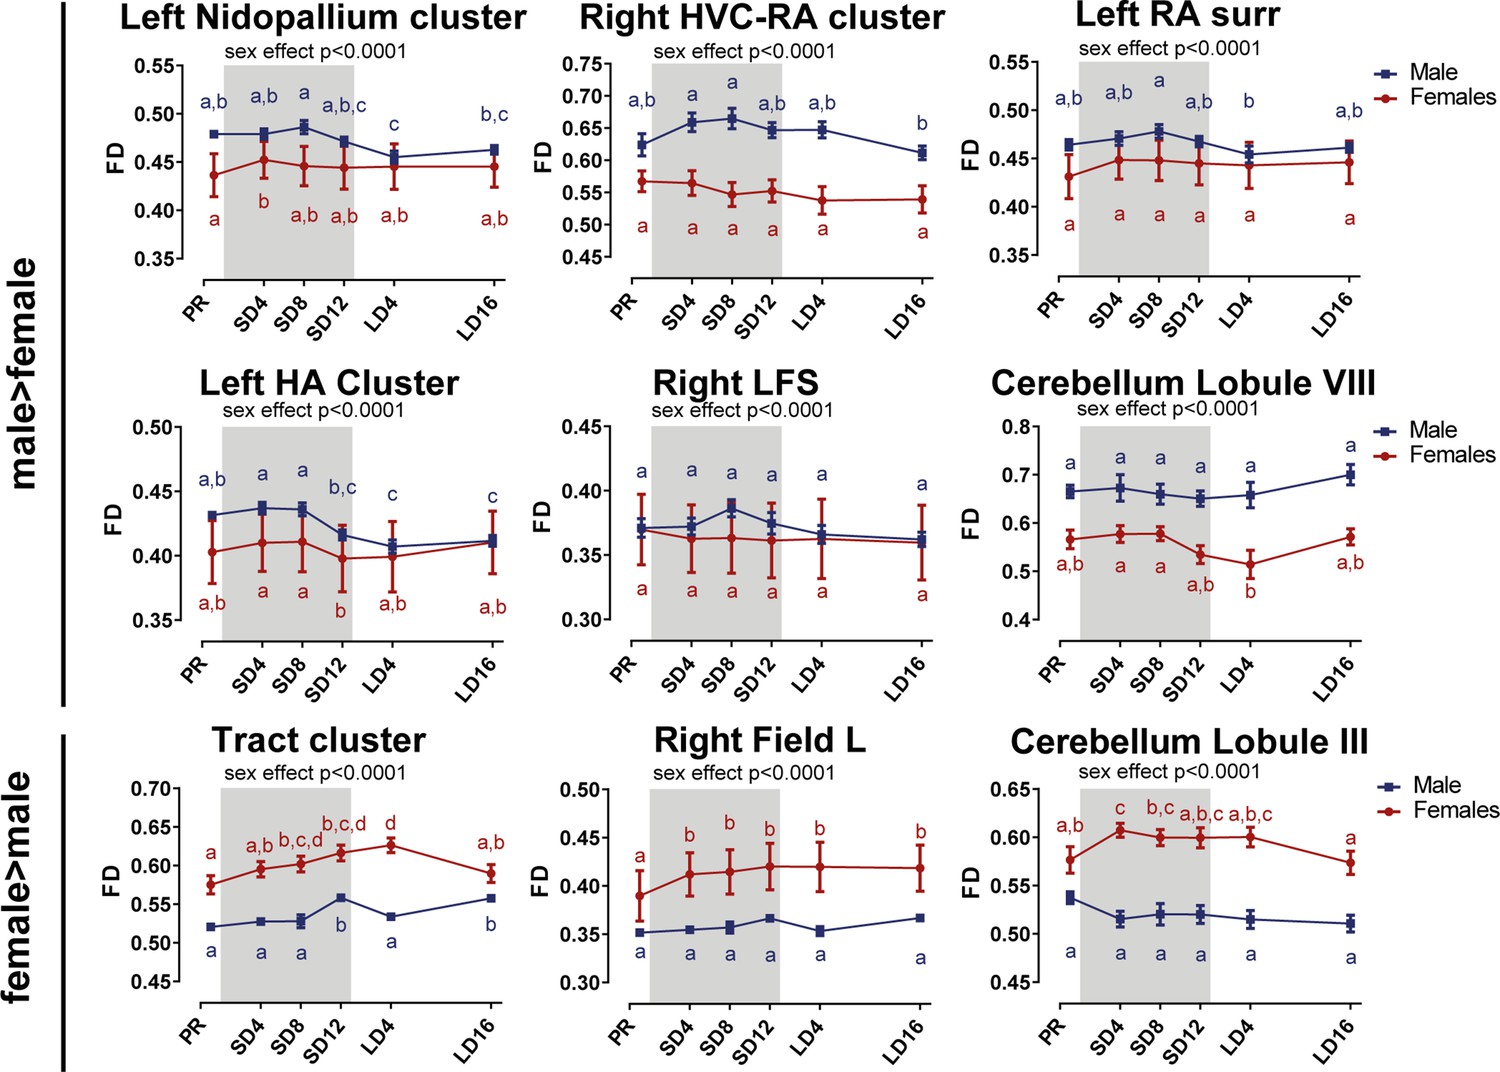
Overview of the fiber density (FD) changes over time extracted from the relevant ROI-based clusters with significant sex differences.
Many of the singificant regions are part of the same cluster. The nidopallium cluster extends to the mesopallium, left RA and Area X surrounding, and the tract cluster includes the OM, TSM, TFM, FPL, CA, CP, TrO. The gray area indicates the entire photosensitive period of short days (8L:16D). Significant sex differences are reported with their p-value under the respective ROI-based cluster. Different letters denote significant differences by comparison with each other in post-hoc t-tests with p<0.05 (Tukey’s HSD correction for multiple comparisons) comparing the different time points to each other. If two time points share the same letter, the FD values are not significantly different from each other. surr, surroundings.
Figure 4—figure supplement 3
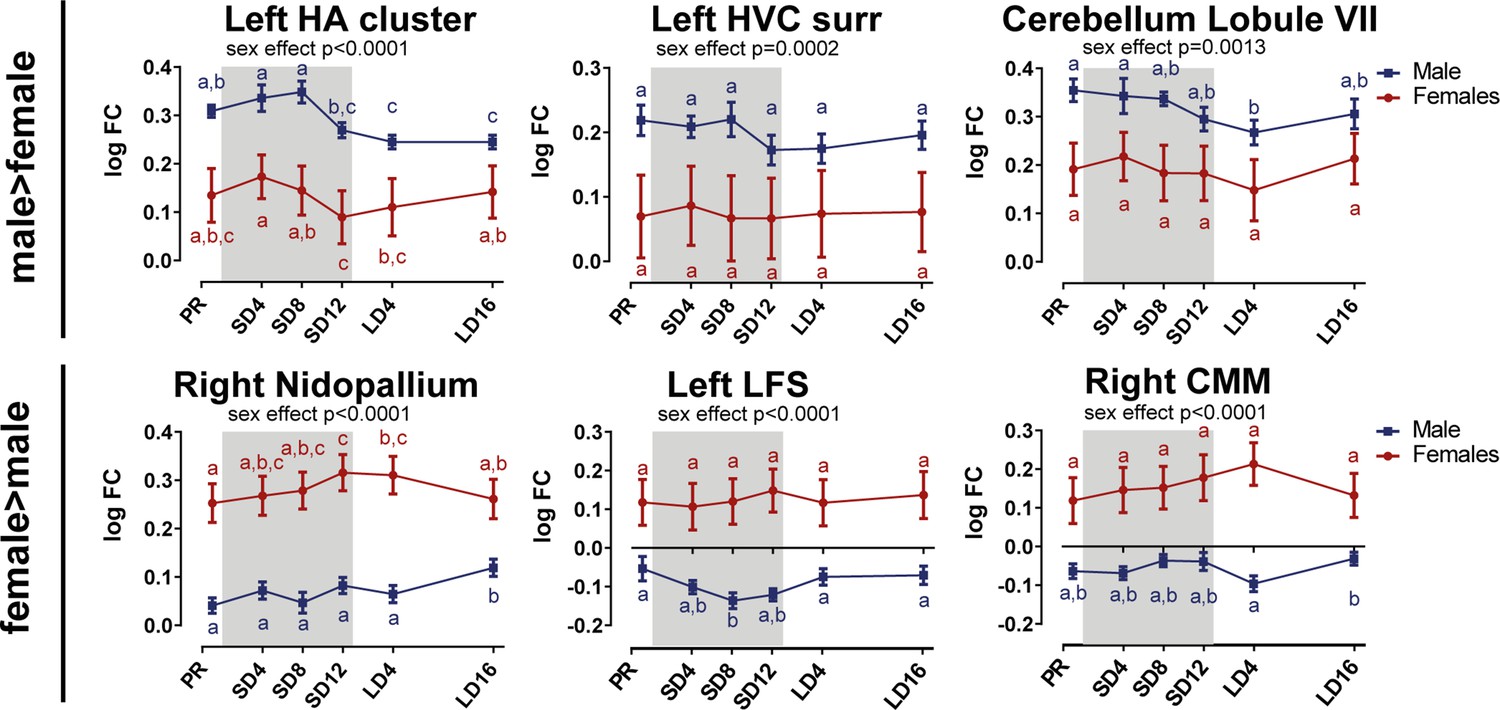
Overview of the fiber-bundle cross-section (log FC) changes over time extracted from the relevant ROI-based clusters with significant sex differences.
The HA cluster extends to the LFS. The gray area indicates the entire photosensitive period of short days (8L:16D). Significant sex differences are reported with their p-value under the respective ROI-based cluster. Different letters denote significant differences by comparison with each other in post-hoc t-tests with p<0.05 (Tukey’s HSD correction for multiple comparisons) comparing the different time points to each other. If two time points share the same letter, the log FC values are not significantly different from each other. surr, surroundings.
Figure 5 with 1 supplement
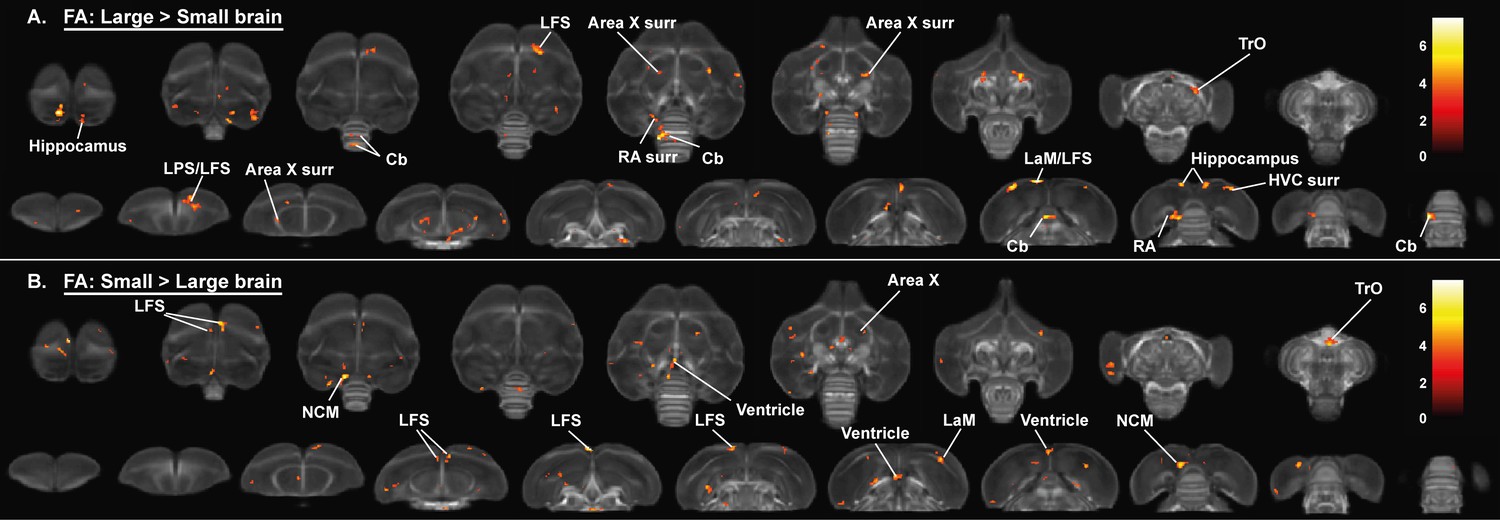
Overview of general structural difference between large and small brain starling in fractional anisotropy (FA).
The statistical parametric maps are displayed on axial and coronal sections throughout the brain (upper and lower row, respectively). The results are displayed with puncorr <0.001 and kE ≥ 10 voxels, and overlaid on the population fractional anisotropy map. The T-values are color-coded according to the scale on the right.
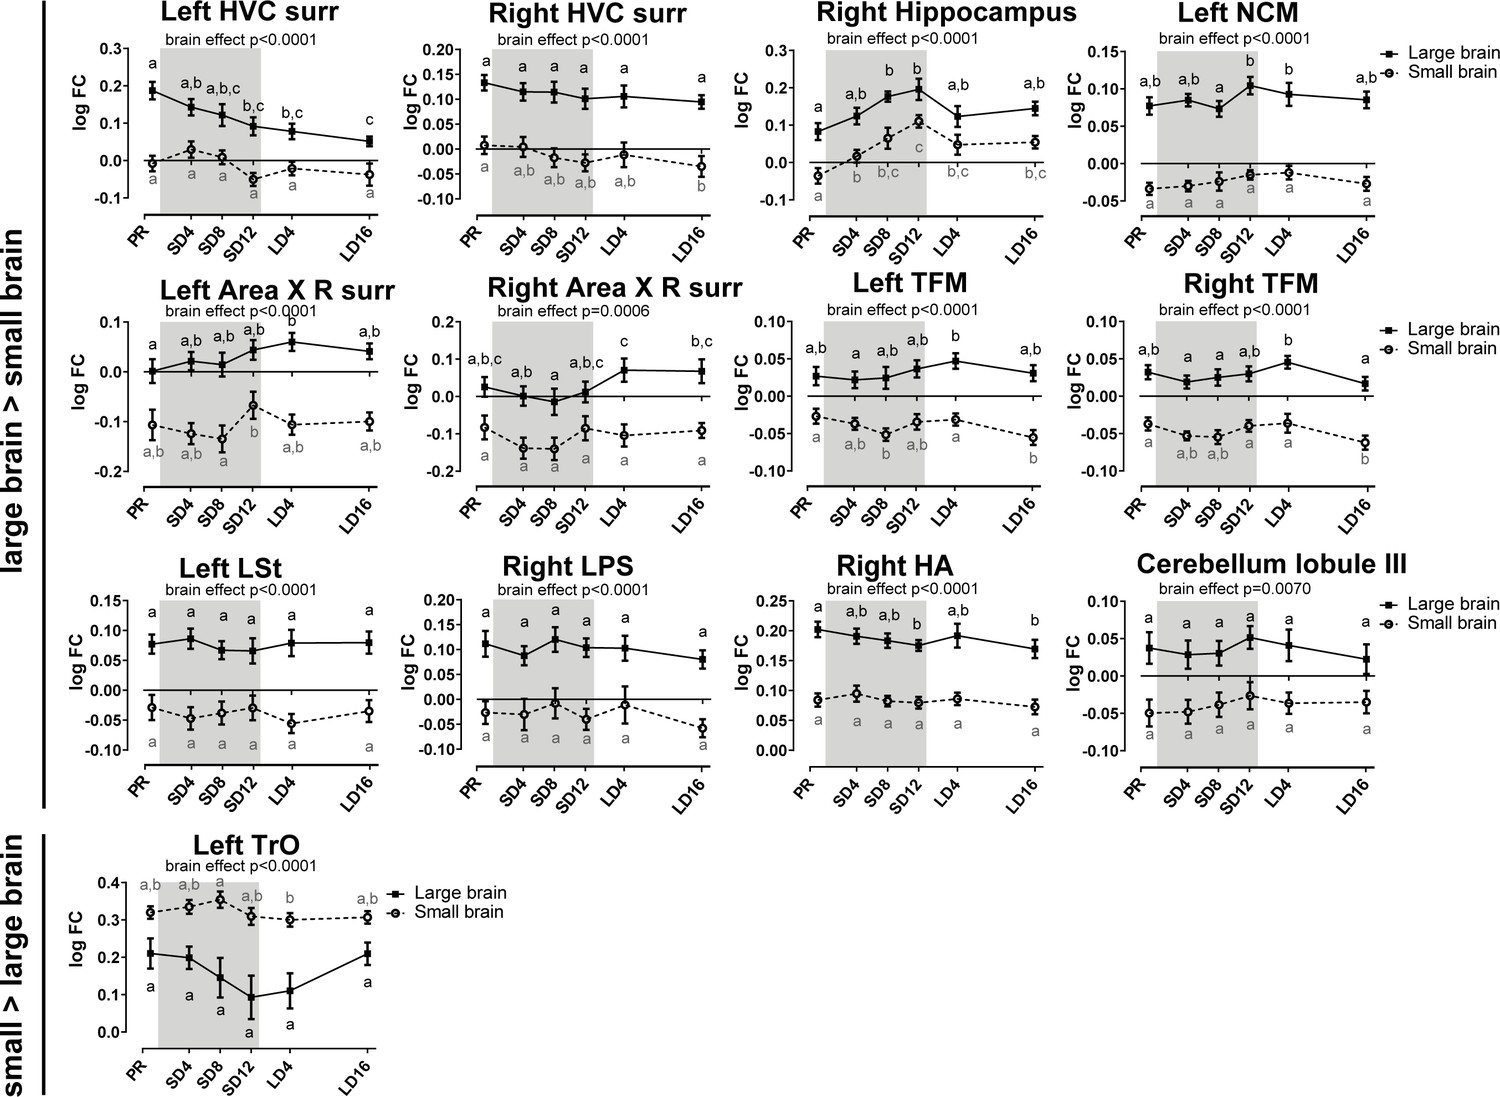
Figure 5—figure supplement 1
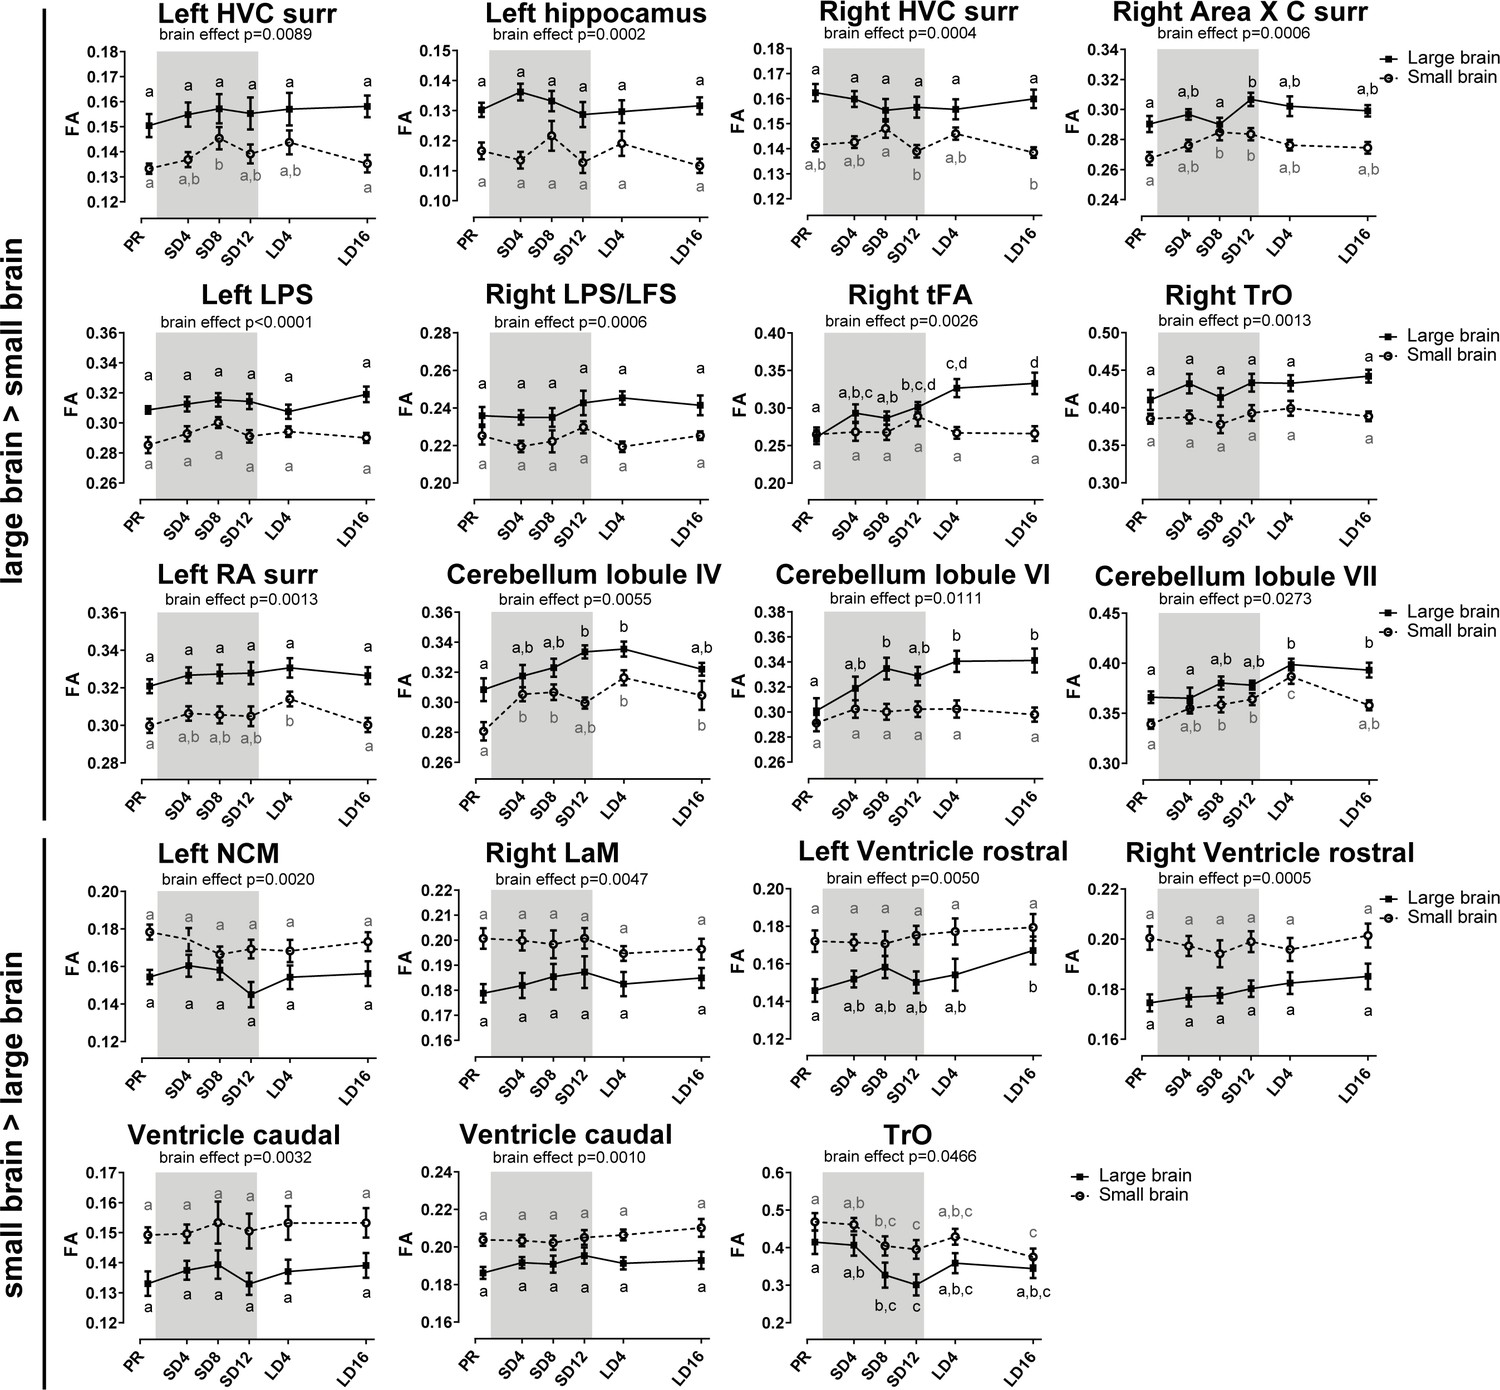
Overview of the fractional anisotropy (FA) changes over time extracted from the relevant ROI-based clusters with significant differences in brain size.
The gray area indicates the entire photosensitive period of short days (8L:16D). Significant brain size differences are reported with their p-value under the respective ROI-based cluster. Different letters denote significant differences by comparison with each other in post-hoc t-tests with p<0.05 (Tukey’s HSD correction for multiple comparisons) comparing the different time points to each other. If two time points share the same letter, the fractional anisotropy values are not significantly different from each other. C, caudal; surr, surroundings.
-
Figure 5—figure supplement 1—source data 1
This file contains the source data used to make the graphs presented in Figure 5—figure supplement 1.
- https://cdn.elifesciences.org/articles/66777/elife-66777-fig5-figsupp1-data1-v2.xlsx
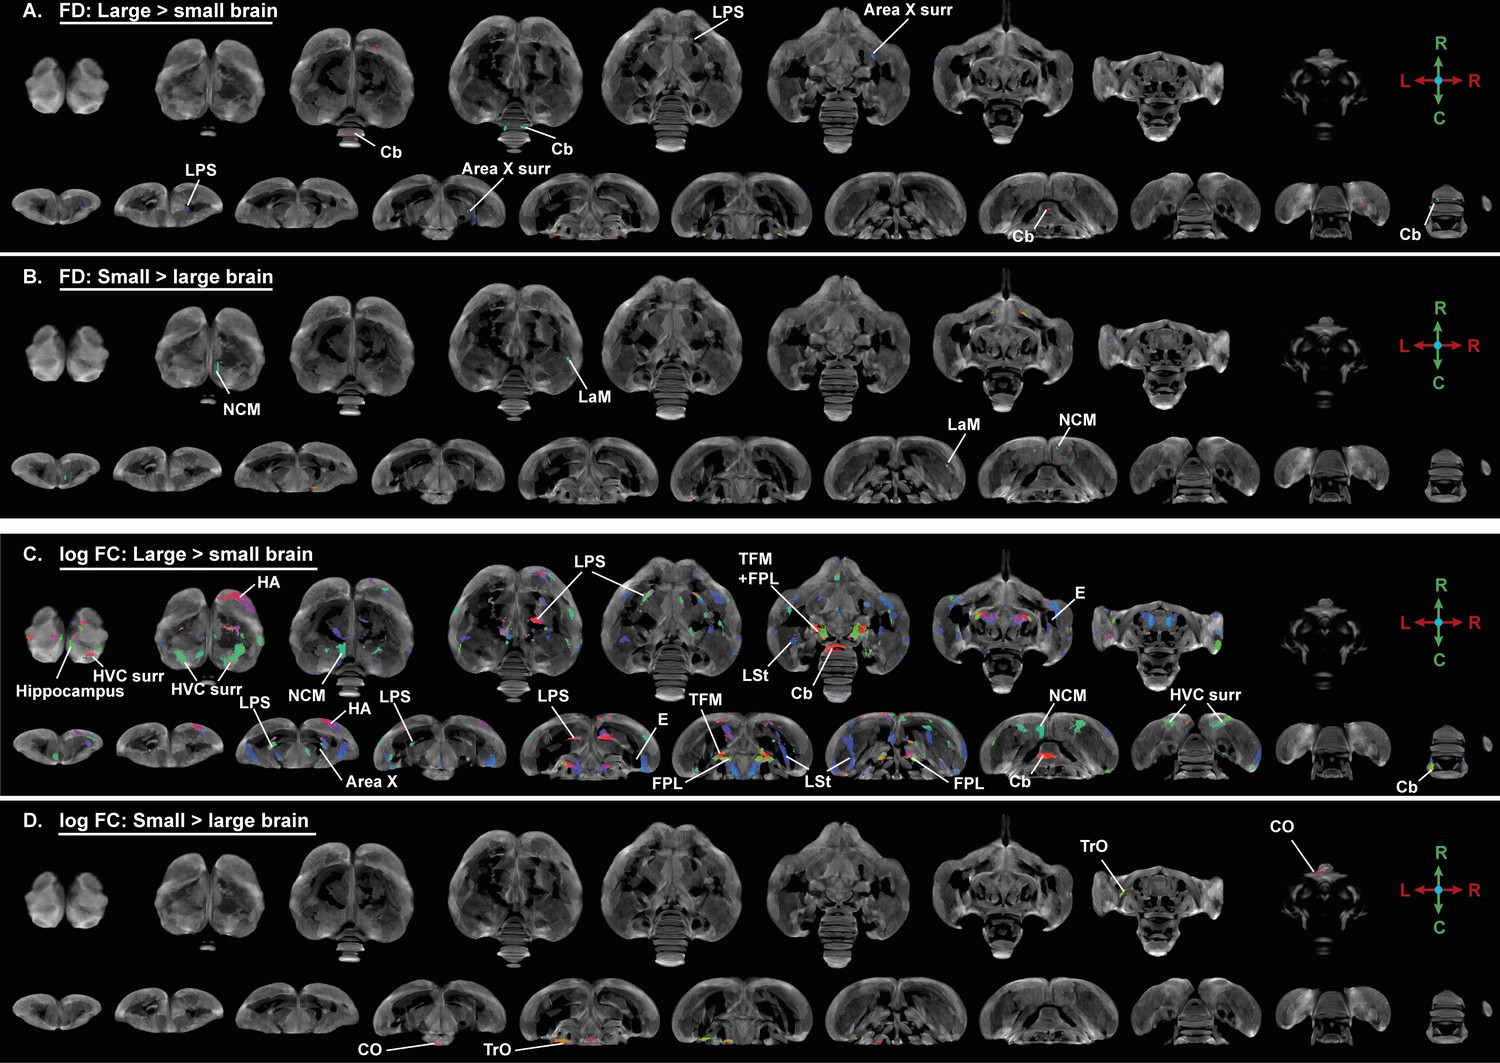
Figure 6 with 3 supplements

Overview of general structural difference between large and small brain starling in microscopic differences in fiber density (FD) (A, B) and macroscopic differences in fiber-bundle cross-section (log FC) (C, D).
The statistical parametric maps are displayed on axial and coronal sections throughout the brain (upper and lower row respectively). The results are displayed with puncorr <0.001, and overlaid on the population-based tractogram. Only significant tracks are displayed and colored according to their significance by T-value.
-
Figure 6—source data 1
This file contains the source data used to make the graphs presented in Figure 6—figure supplement 2 and 3.
- https://cdn.elifesciences.org/articles/66777/elife-66777-fig6-data1-v2.xlsx
Figure 6—figure supplement 1
Overview of general structural difference between large and small brain starling in microscopic differences in fiber density (FD) and macroscopic differences in fiber-bundle cross-section (log FC) using fiber orientation color coding.
The statistical parametric maps are displayed on axial and coronal sections throughout the brain (upper and lower row, respectively). The results are displayed with puncorr <0.001, and overlaid on the population based tractogram. Only significant tracks are displayed and are colored according to the fiber orientation using the standard red-green-blue code as indicated by the crosshair (red = left right orientation (L-R), blue = dorso ventral (D-V) and green = rostro caudal (R-C)).
Figure 6—figure supplement 2
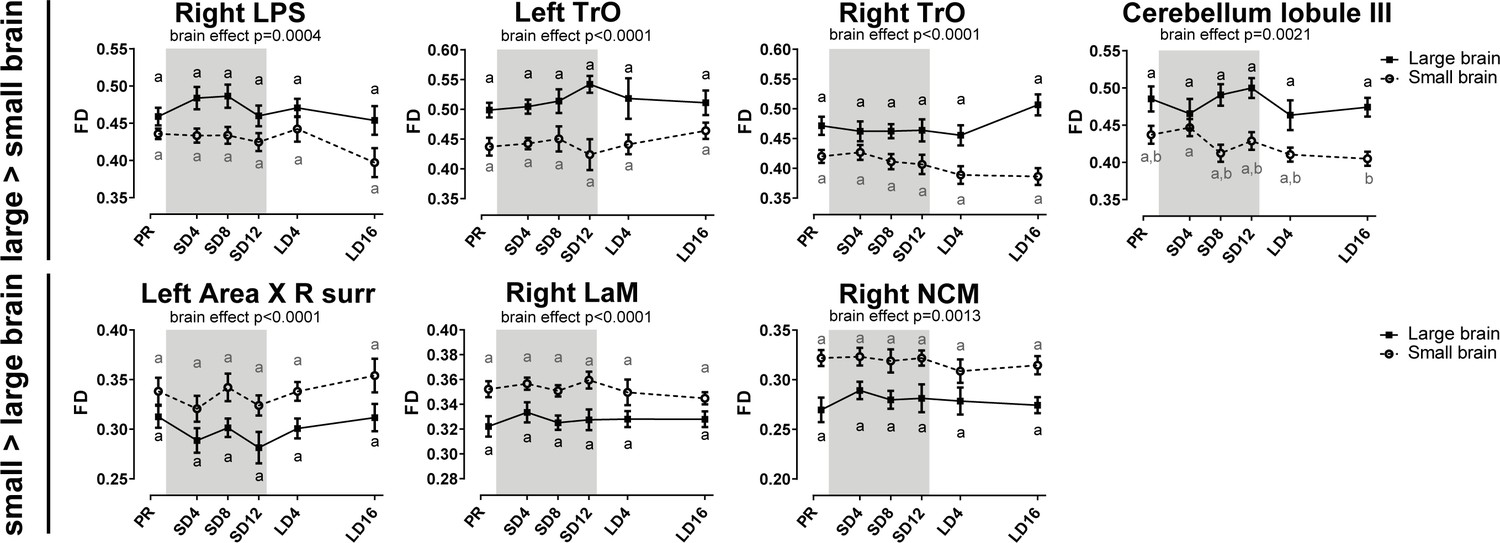
Overview of the fiber density (FD) changes over time extracted from the relevant ROI-based clusters with significant differences in brain size.
The gray area indicates the entire photosensitive period of short days (8L:16D). Significant brain size differences are reported with their p-value under the respective ROI-based cluster. Different letters denote significant differences by comparison with each other in post-hoc t-tests with p<0.05 (Tukey’s HSD correction for multiple comparisons) comparing the different time points to each other. If two time points share the same letter, the FD values are not significantly different from each other. C, caudal; surr, surroundings.
Figure 6—figure supplement 3
Overview of the fiber-bundle cross-section (log FC) changes over time extracted from the relevant ROI-based clusters with significant differences in brain size.
The gray area indicates the entire photosensitive period of short days (8L:16D). Significant brain size differences are reported with their p-value under the respective ROI-based cluster. Different letters denote significant differences by comparison with each other in post-hoc t-tests with p<0.05 (Tukey’s HSD correction for multiple comparisons) comparing the different time points to each other. If two time points share the same letter, the log FC values are not significantly different from each other. C, caudal; surr, surroundings.
Figure 7
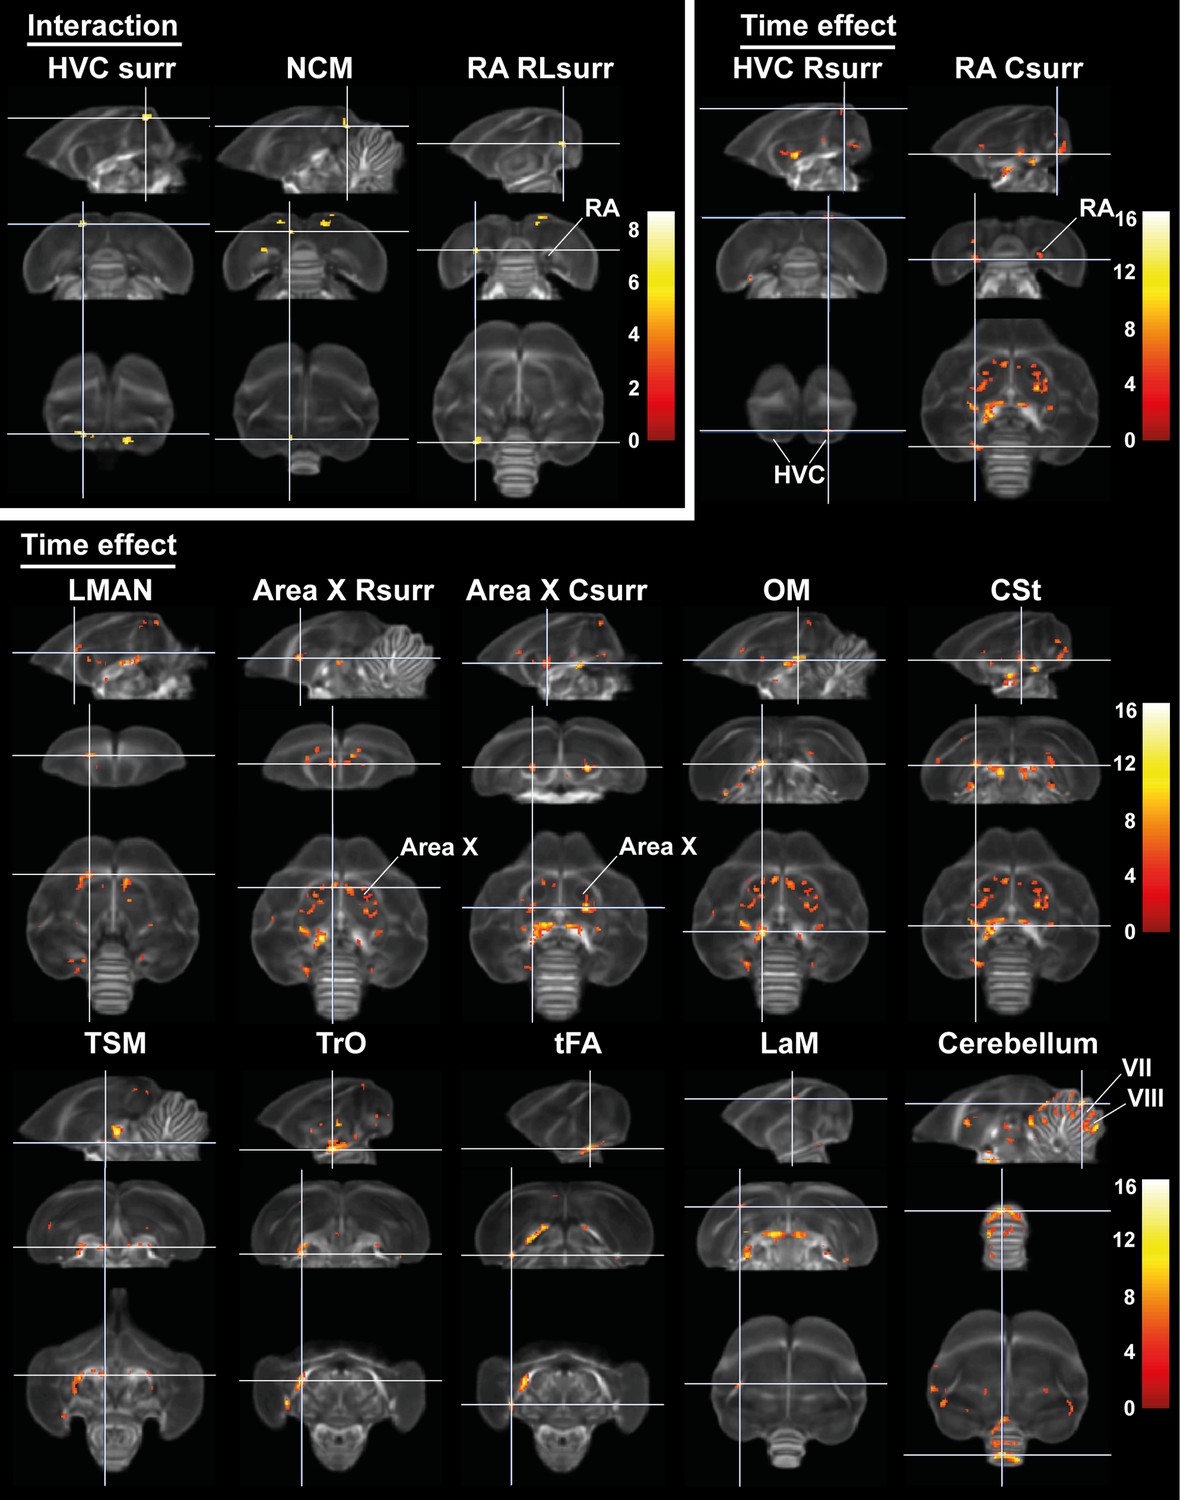
Time effect and interaction between sex and time in fractional anisotropy (FA).
The statistical maps were assessed at puncorr <0.001 and kE ≥ 10 voxels with a small volume correction including regions of the white matter tracts, auditory and song control system. Main time effect of the cerebellum cluster was assessed without the small volume correction. Color scale represents significance by F-value. C, caudal; RL, rostro-lateral; R, rostral; surr, surroundings.
Figure 8 with 4 supplements
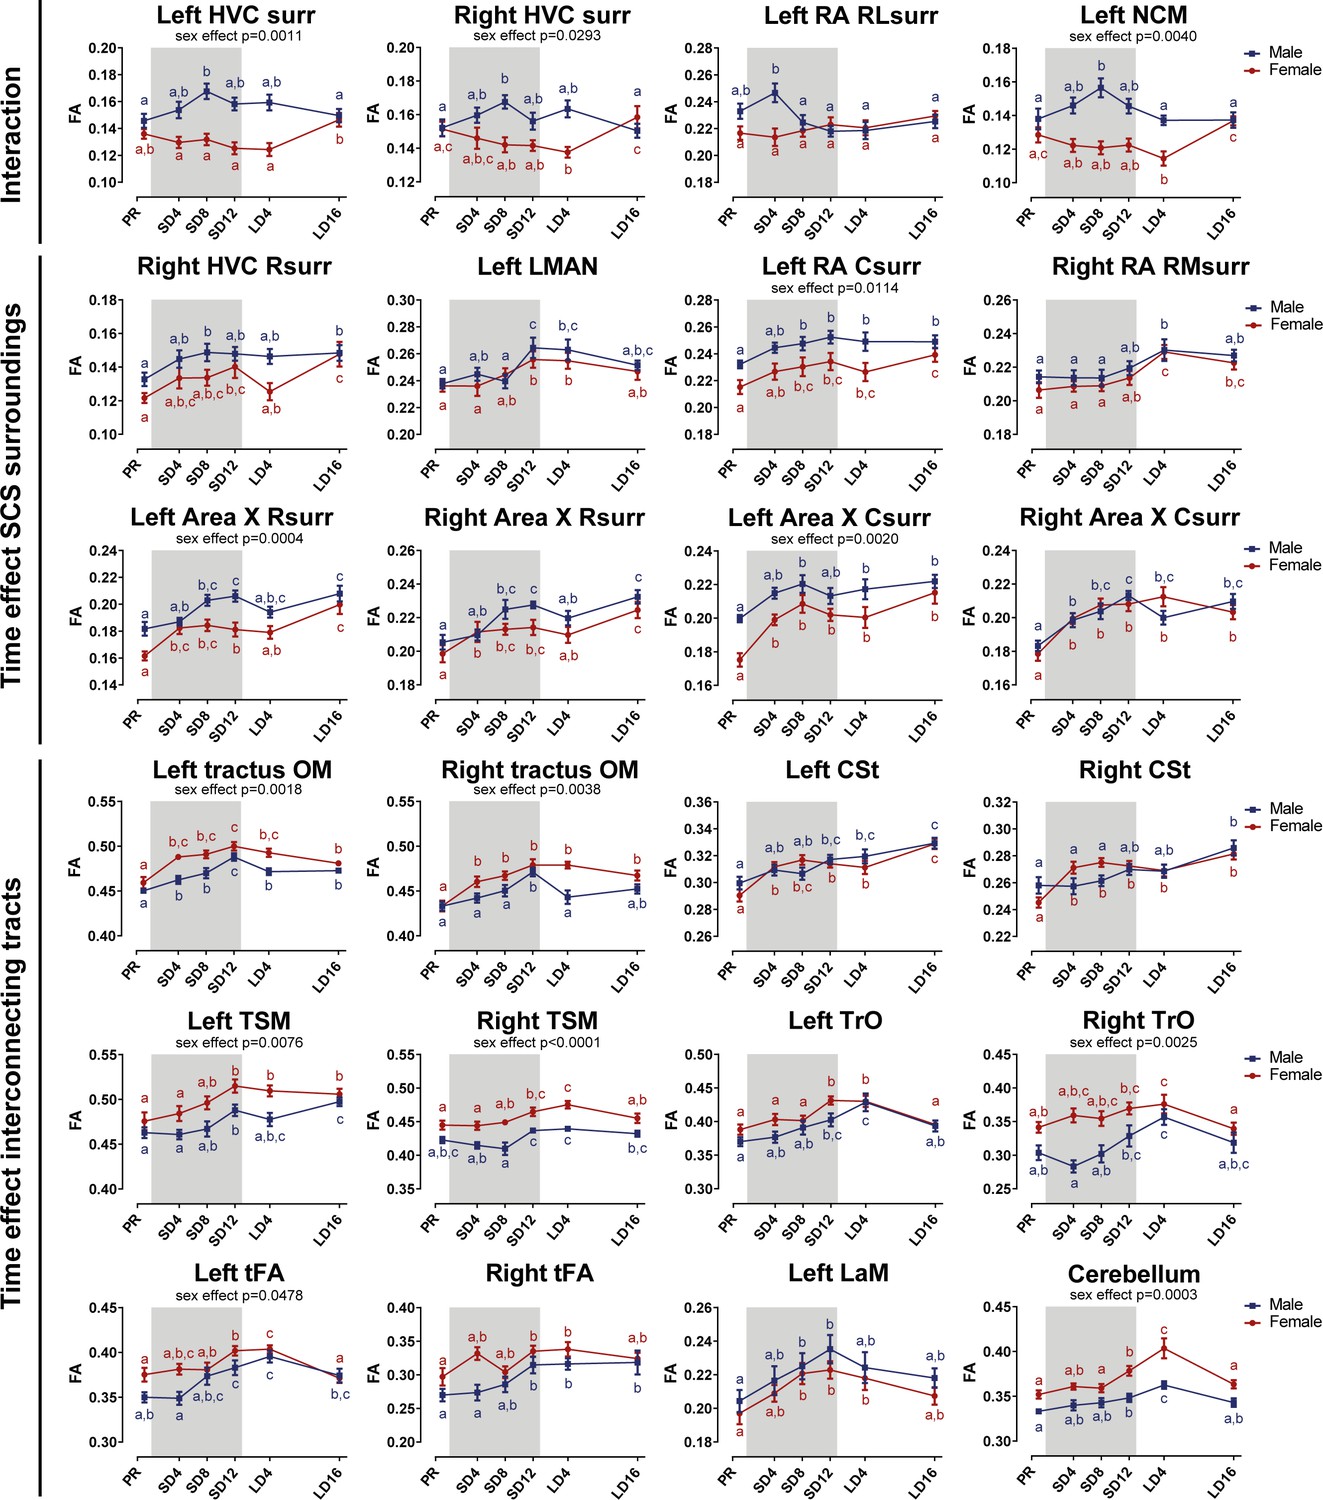
Summary of the longitudinal changes over time of fractional anisotropy (FA) extracted from ROI-based clusters that showed a significant interaction (first row), a significant change over time in the surroundings of song control nuclei (row 2 and 3) or a significant change over time in the fiber tracts (row 4–6).
The gray area indicates the entire photosensitive period of short days (8L:16D). Significant sex differences are reported with their p-value under the respective ROI-based cluster. Different letters denote significant differences by comparison with each other in post-hoc t-tests with p<0.05 (Tukey’s HSD correction for multiple comparisons) comparing the different time points to each other. If two time points share the same letter, the fractional anisotropy values are not significantly different from each other. C, caudal; RL, rostro-lateral; R, rostral; surr, surroundings.
-
Figure 8—source data 1
This file contains the source data used to make the graphs presented in Figure 8 and Figure 8—figure supplement 1–4 .
- https://cdn.elifesciences.org/articles/66777/elife-66777-fig8-data1-v2.xlsx
Figure 8—figure supplement 1
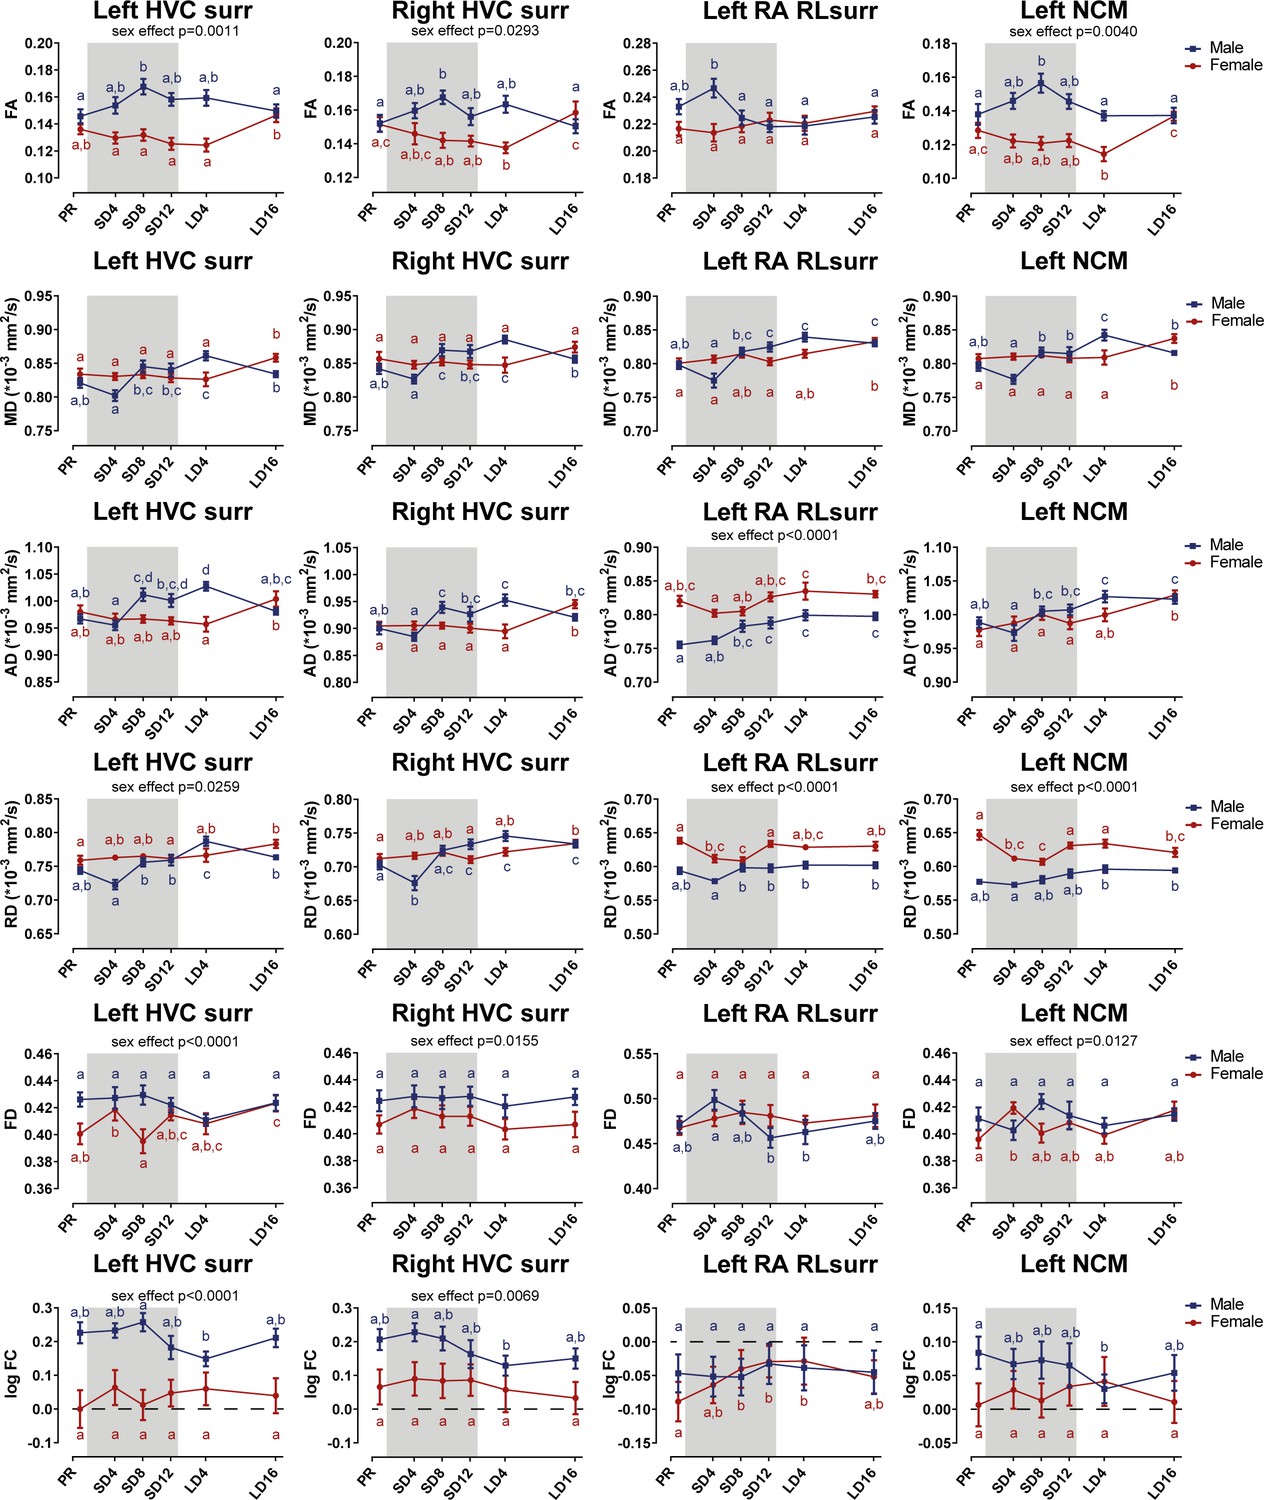
Summary of the longitudinal changes over time in FA, MD, AD, RD, FD, and log FC extracted from ROI-based clusters that had a significant interaction, including HVC surroundings (surr), left RA rostro-lateral surroundings (RLsurr), and NCM.
Figure 8—figure supplement 2
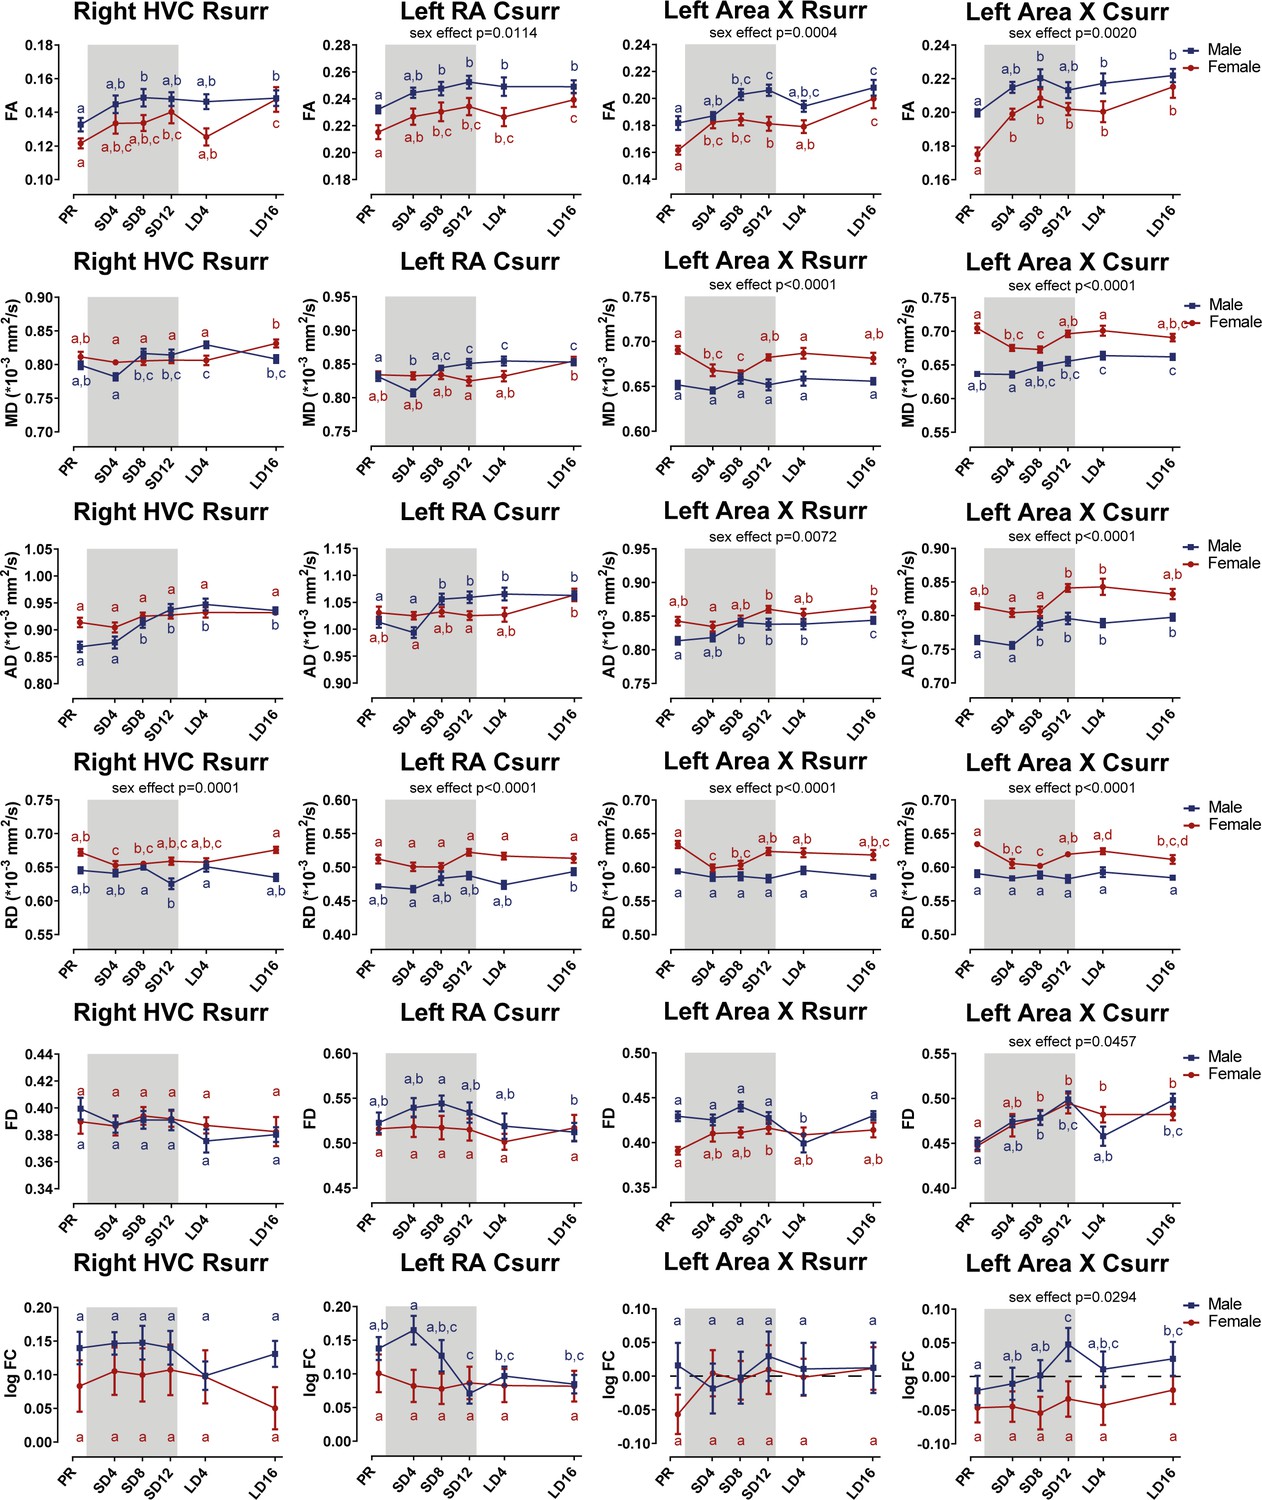
Summary of significant the longitudinal changes over time in FA, MD, AD, RD, FD, and log FC extracted from ROI-based clusters surrounding several song control nuclei including right HVC rostral surroundings (Rsurr), left RA caudal surroundings (Csurr), Area X rostral surroundings, and caudal surroundings.
Figure 8—figure supplement 3
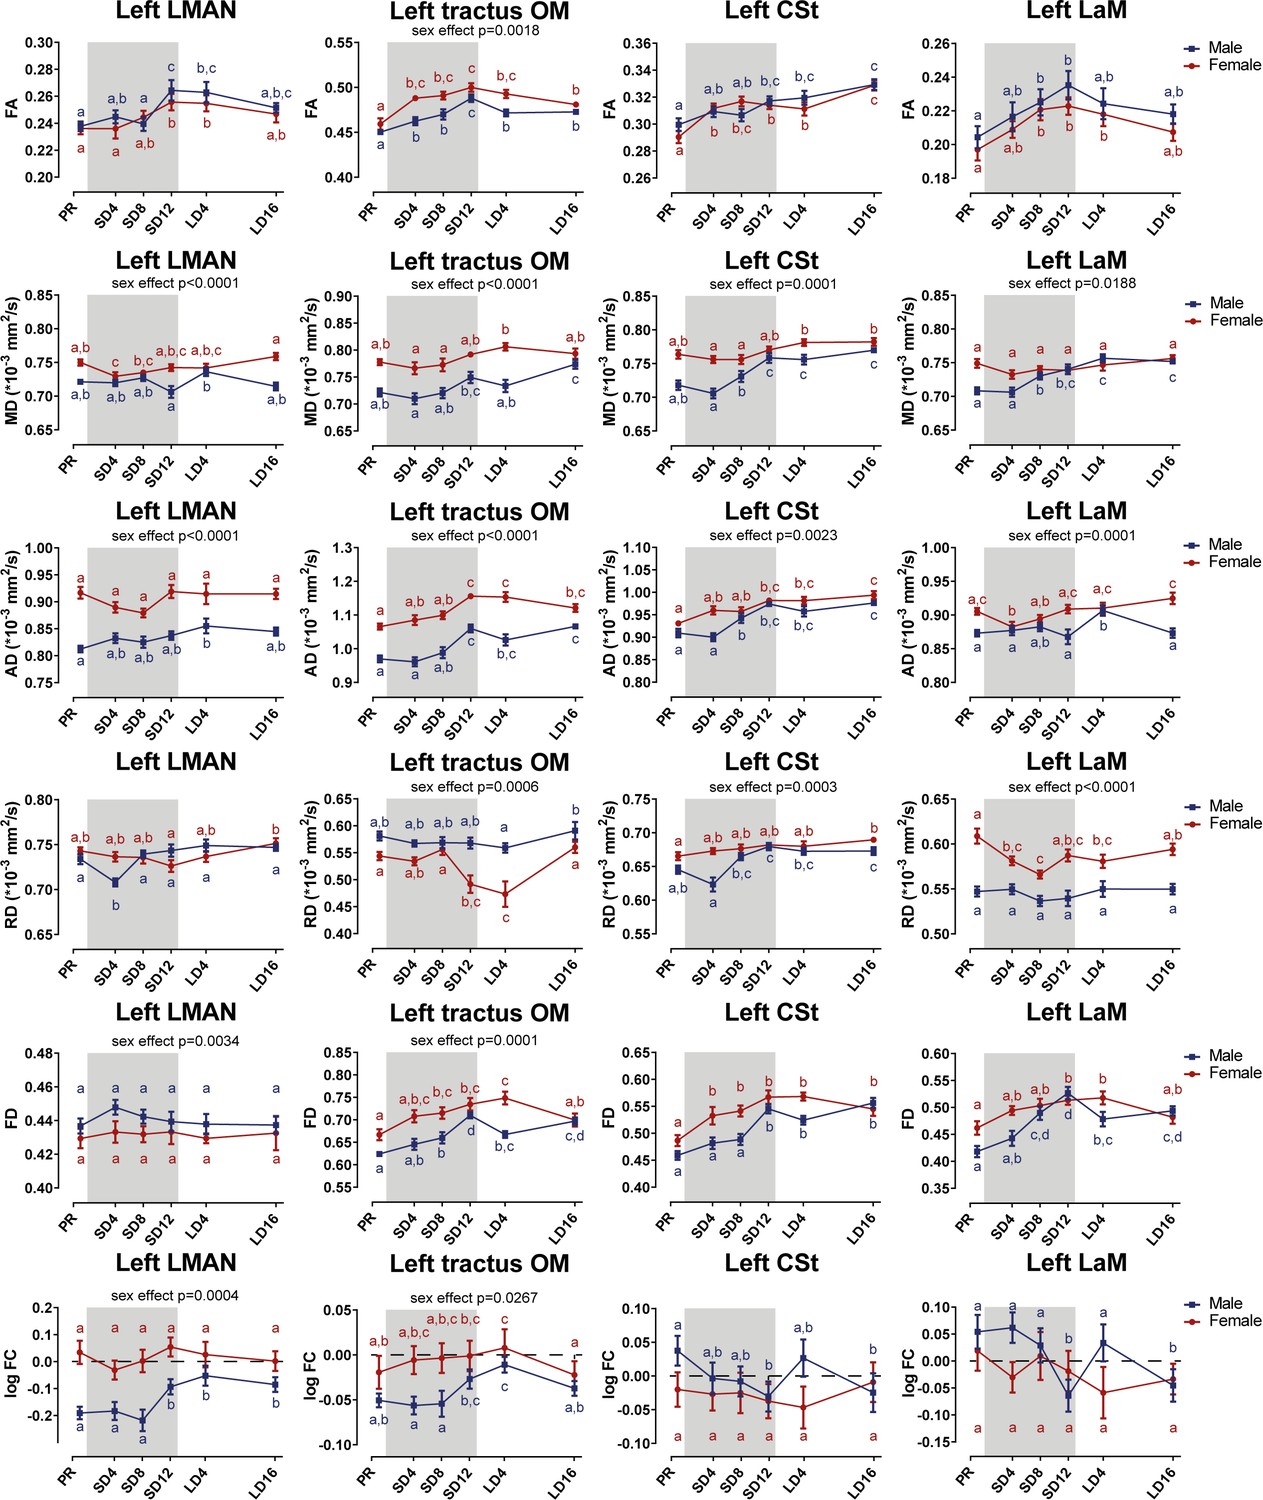
Summary of the significant longitudinal changes over time in FA, MD, AD, RD, FD, and log FC extracted from ROI-based clusters at level of LMAN and several tracts related to song and auditory processing including OM, CSt, and LaM.
Figure 8—figure supplement 4
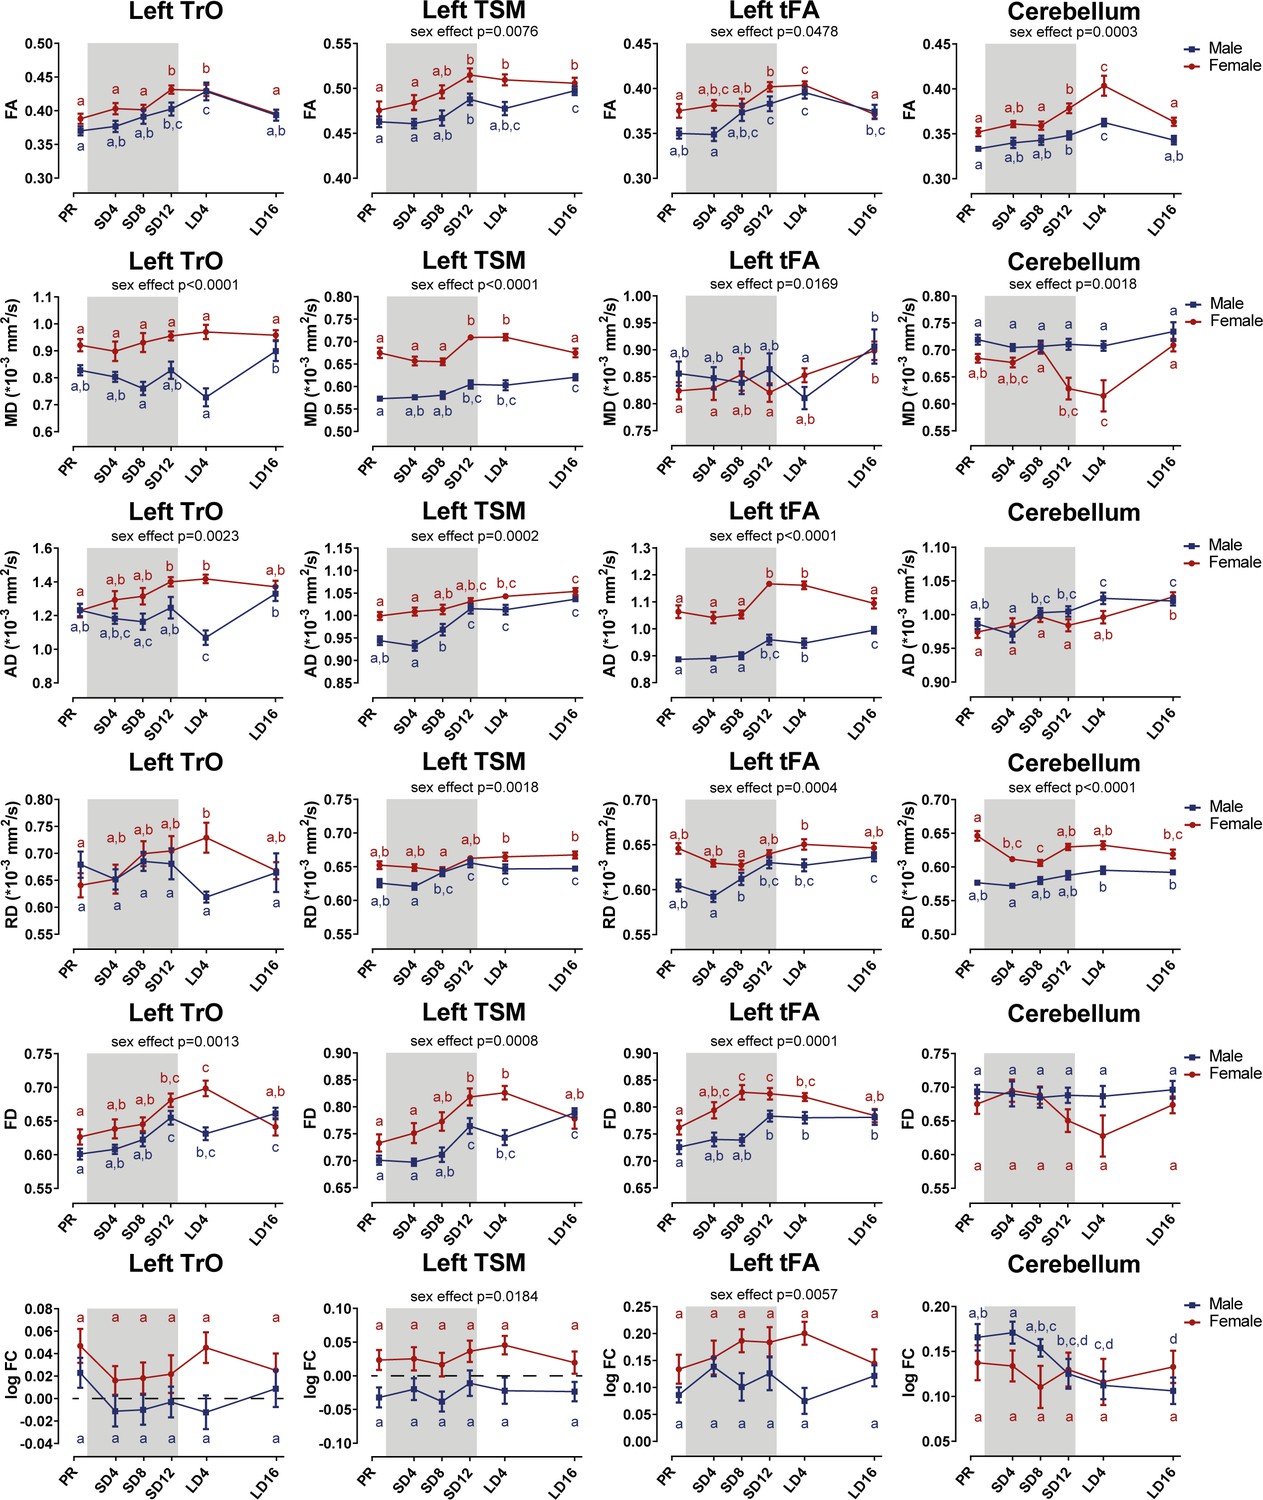
Summary of the significant longitudinal changes over time in FA, MD, AD, RD, FD, and log FC extracted from ROI-based clusters at level of TrO, TSM, tFA, and cerebellum.
Figure 9

Overview of the seasonal changes in plasma testosterone (A, B) and estrogen (C) concentrations in male and female starlings.
Gray lines depict individual animals, while blue and red lines represent the group average with the standard errors of the mean error bars. The gray area indicates the photosensitive period of short days (8L:16D). Different letters denote significant differences by comparison with each other in post-hoc t-tests with p<0.05 (Tukey’s HSD correction for multiple comparisons) comparing the different time points to each other. If two time points share the same letter, the testosterone level or estrogen level are not significantly different from each other.
-
Figure 9—source data 1
This file contains the source data used to make the graphs presented in Figure 9.
- https://cdn.elifesciences.org/articles/66777/elife-66777-fig9-data1-v2.xlsx
Figure 10
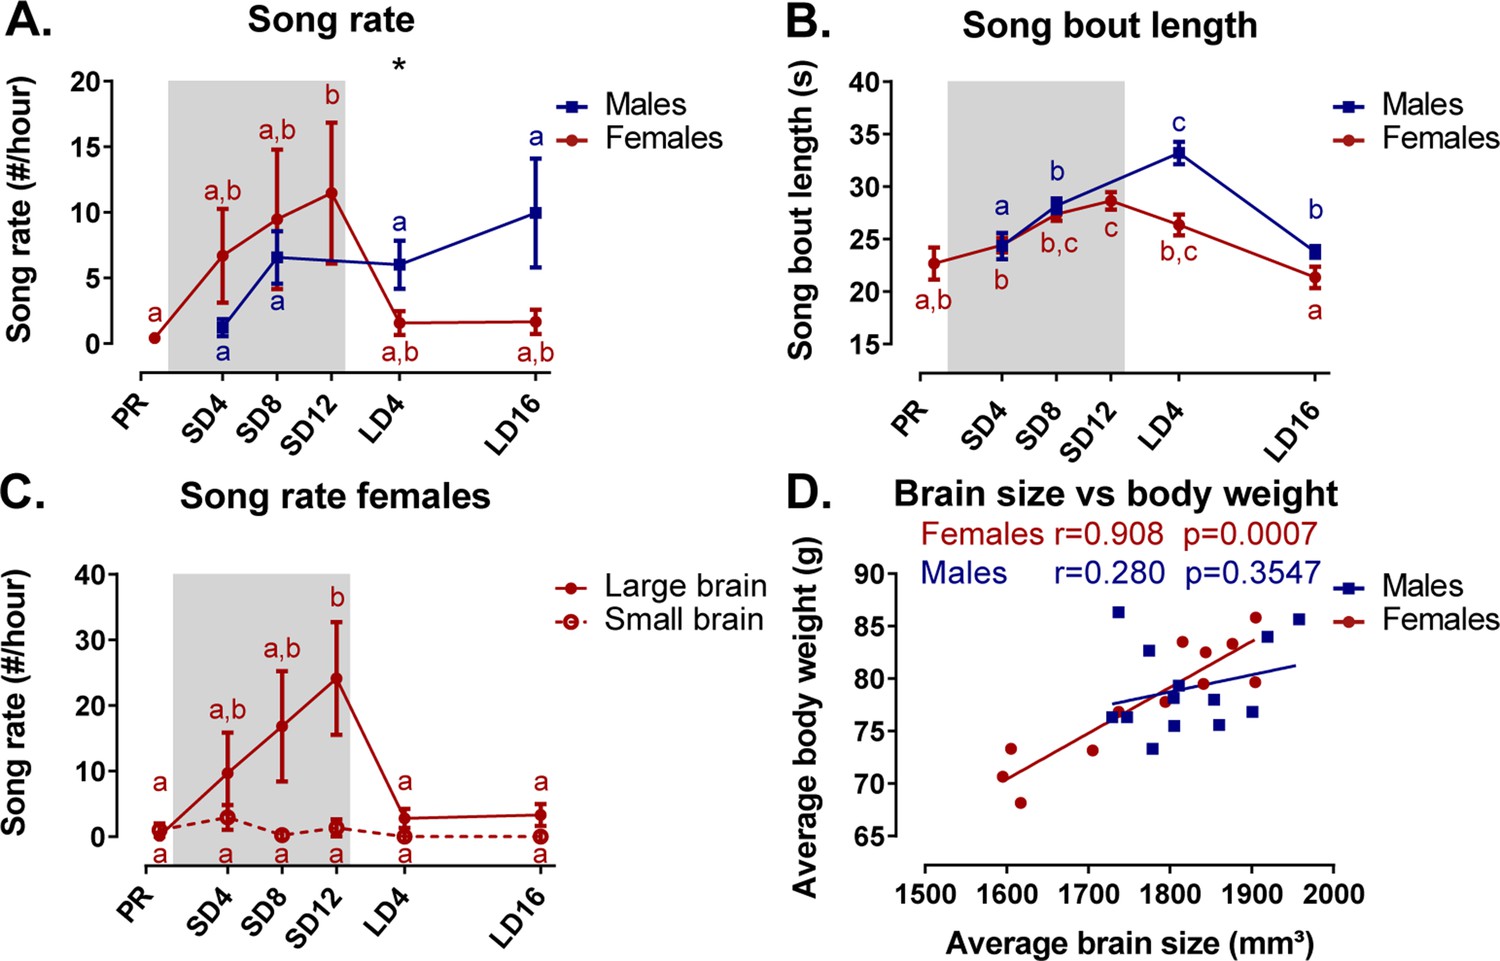
Overview of the seasonal changes in song rate (A) and song bout length (B) in male and female starlings.
Dividing the starlings based on brain size showed that only large brain female starlings sing (C). Females present a significant correlation between the average brain size and body weight (D). (A–C) Blue and red lines represent the group average with the standard errors of the mean error bars. The gray area indicates the photosensitive period of short days (8L:16D). Different letters denote significant differences by comparison with each other in post-hoc t-tests with p<0.05 (Tukey’s HSD correction for multiple comparisons) comparing the different time points to each other. If two time points share the same letter, the song rate or song bout length are not significantly different from each other. (D) The Pearson’s correlation and its significance are reported for males and females.
-
Figure 10—source data 1
This file contains the source data used to make the graphs presented in Figure 10.
- https://cdn.elifesciences.org/articles/66777/elife-66777-fig10-data1-v2.xlsx
Figure 11
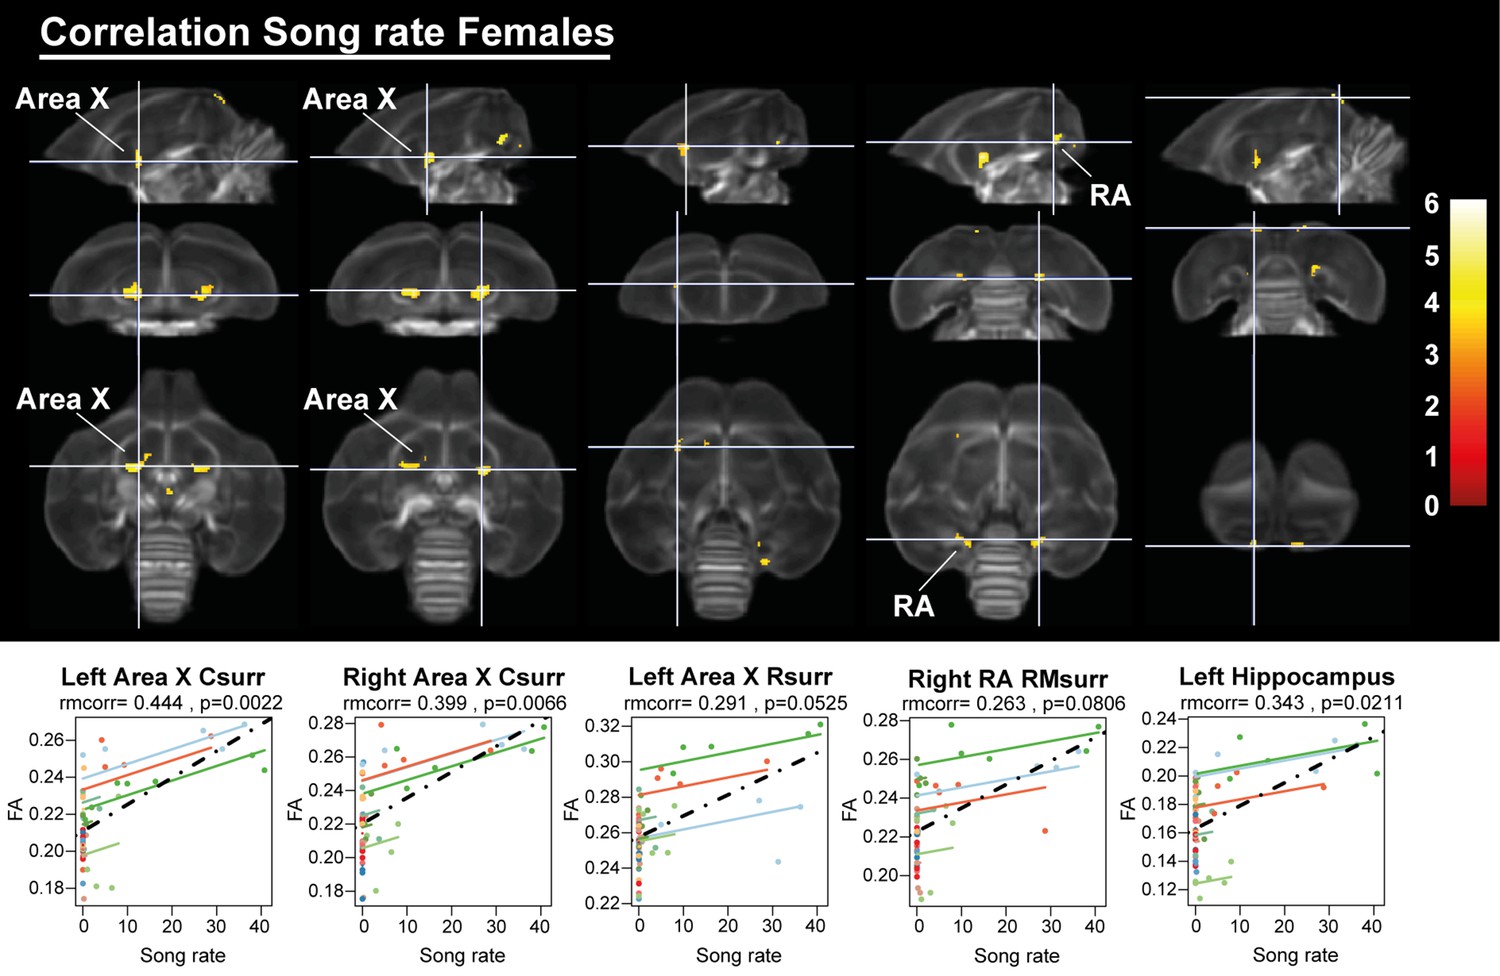
Overview of structural neural correlates of song rate to fractional anisotropy in female starlings.
The statistical maps were assessed at puncorr <0.001 and kE ≥ 10 voxels with a small volume correction including regions of the song control system and other white matter structures. Below each statistical parametric map, the identified correlations were further explored with repeated measures correlation. Solid colored lines show the best linear fit for the within-subject correlation using parallel regression lines for individual animals. The dashed line represents the linear fit of the overall Pearson correlation representing the between-subject correlations. C, caudal; RM, rostro-medial; R, rostral; surr, surroundings.
-
Figure 11—source data 1
This file contains the source data used to make the graphs presented in Figure 11.
- https://cdn.elifesciences.org/articles/66777/elife-66777-fig11-data1-v2.xlsx
Figure 12
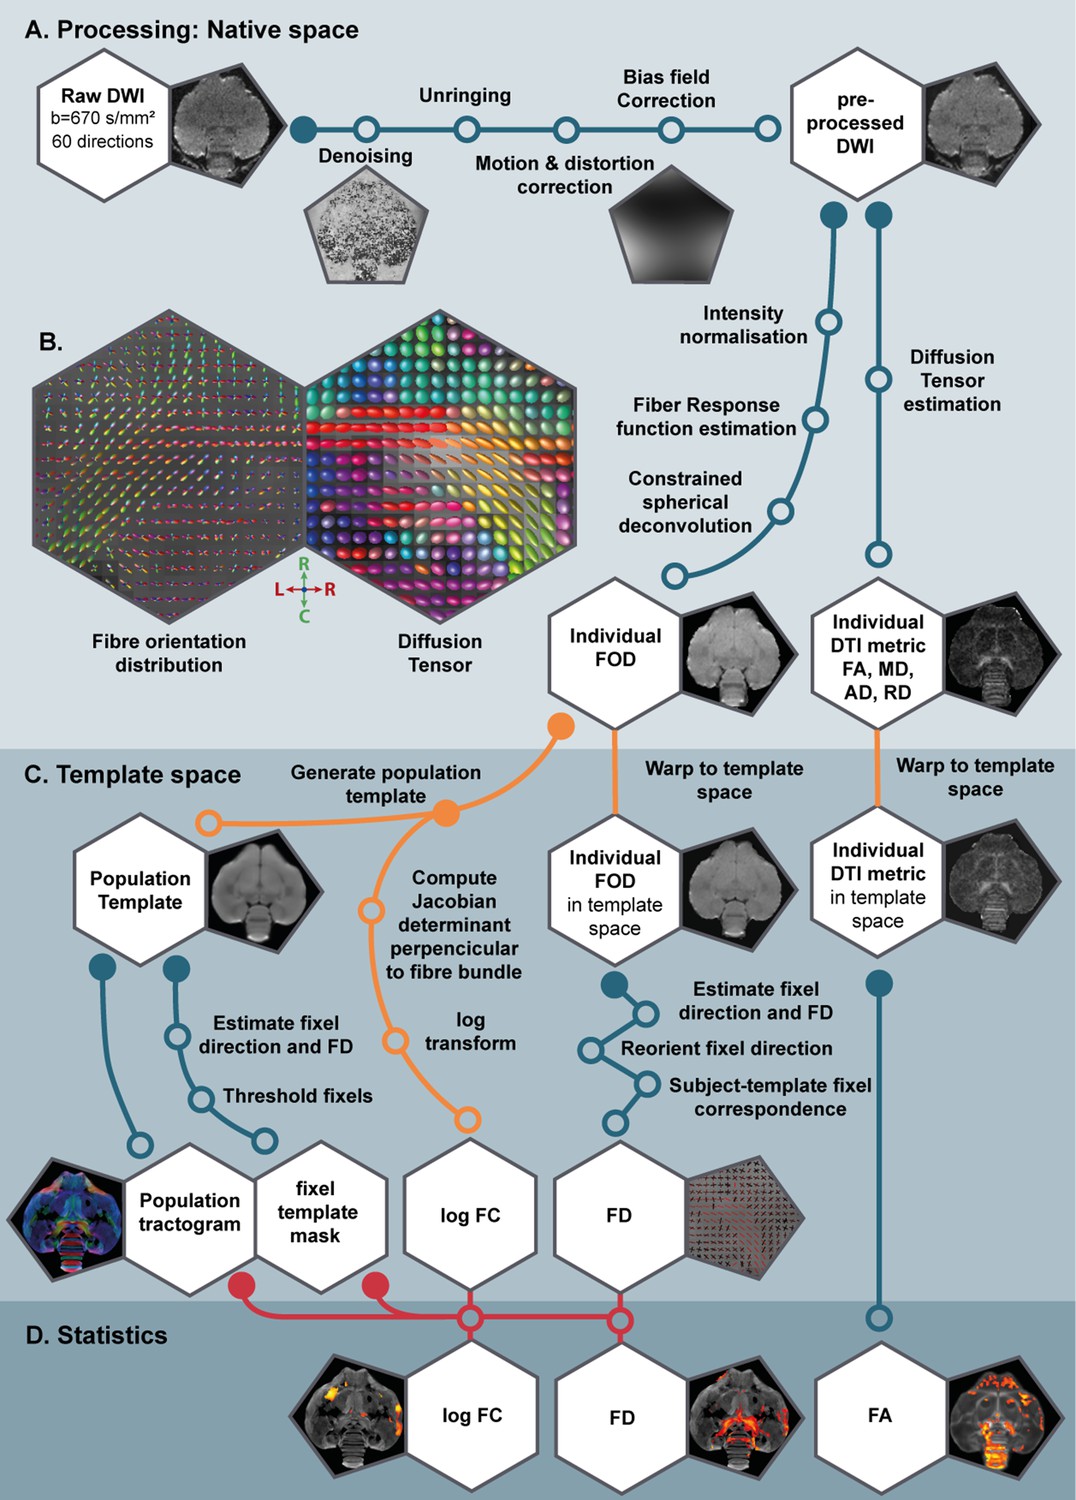
Schematic overview of the various processing steps of the DTI and fixel-based analysis.
(A) Using the DWI, we performed a common DTI analysis and a fixel-based analysis. By doing this, the extracted DTI metrics (such as fractional anisotropy (FA)) and fixel-based metrics (fiber density (FD) and fiber-bundle cross-section (FC)) complemented each other during interpretation of the results. Insets present an example DWI image at each respective processing step. (B) Large insets are at the level of the commisura anterior and OM tract and show the fiber orientation distribution (FOD) and Diffusion Tensor map used in fixel-based and DTI-based analysis respectively as described in Table 1 collored according to the standard red-green-blue code (red = left right orientation (L–R), blue = dorso ventral (D–V) and green = rostro caudal (R–C)). (C) All measures were normalized to a population template, a population-based tractogram and fixel template mask were created which are necessary for the voxel- and fixel-based statistical analysis (D). The material and method section contains the extended explanation on the various processing steps. LD, long days; PR, photorefractory state; SD short days.
Tables
Table 1
Overview of the parameters studied by common DTI analysis and novel fixel-based analysis, including a comprehensive, but not exhaustive, list of some of the microstructural changes to which they are sensitive.
| Metric | Level | Para-meter | Measures | Sensitive to changes in: | |
|---|---|---|---|---|---|
| DTI analysis | Diffusion tensor 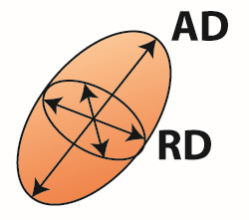 | Voxel | FA | Directionality of water diffusion | Axon number and density, axon diameter, myelination, fiber organization |
| MD | Average diffusion across all directions | Cell size, cell spacing, cell density, dendrite branching, extracellular space | |||
| AD | Diffusion along the fiber direction | Axon number and density | |||
| RD | Diffusion perpendicular to the fiber direction | Axon diameter and myelination | |||
| Fixel-based analysis | Fiber orientation distribution 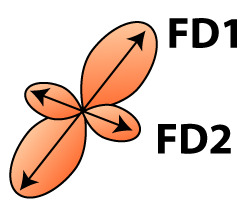 | Fixel | FD | Microscopic density within fiber population | Axon number and density, axon diameter |
| FC | Macroscopic change in cross-sectional area perpendicular to fiber bundle | Fiber bundle size due to changes in extra-axonal space and/or myelination, number of axons |
-
FA, fractional anisotropy; MD, mean diffusivity; AD, axial diffusivity; RD, radial diffusivity; FD, fiber density; FC, fiber-bundle cross-section. Fixel-based analysis can distinguish between different fiber bundles within a voxel and estimate fiber density for each fiber bundle separately (FD1 and FD2). For a complete description and interpretation of these measures we refer to the following reviews of DTI analysis (Beaulieu, 2002; Beaulieu, 2013; Song et al., 2002; Zatorre et al., 2012) and fixel based analysis (Genc et al., 2020; Raffelt et al., 2017).
Table 2
Clusters displaying a sex difference in fractional anisotropy (FA).
Table summarizing the significance at cluster level and peak level. Some clusters are large and cover multiple regions, indicated by the single statistic at cluster level. For each sub-region within this large cluster the peak significance (pFWE) and T-value (T) are reported. p-Values are FWE corrected. KE indicates the number of continuous voxels within a cluster.
| Main sex difference for FA | Cluster | Hemisphere | Cluster | Peak | ||
|---|---|---|---|---|---|---|
| pFWE | kE | pFWE | T | |||
| Male > female | Nidopallium/mesopalium | Left | <0.0001 | 36936 | <0.0001 | 14.25 |
| HVC surr | Left | <0.0001 | 8.35 | |||
| Right | <0.0001 | 7.53 | ||||
| Field L dorsal | Left | <0.0001 | 10.00 | |||
| Right | <0.0001 | 6.93 | ||||
| NCM | Left | <0.0001 | 7.72 | |||
| Right | <0.0001 | 6.72 | ||||
| Area X caudal surr | Left | 0.001 | 5.69 | |||
| Right | 0.001 | 6.07 | ||||
| RA surr | Left | <0.0001 | 7.86 | |||
| HVC-RA tract | Left | <0.0001 | 6.68 | |||
| RA surr | Right | <0.0001 | 441 | 0.001 | 6.08 | |
| HVC-RA tract | Right | <0.0001 | 6.42 | |||
| TeO (superior) | Left | <0.0001 | 189 | <0.0001 | 9.44 | |
| Right | <0.0001 | 125 | <0.0001 | 7.47 | ||
| LaM | Right | <0.0001 | 165 | <0.0001 | 6.97 | |
| Cerebellum | Lobule VII | 0.011 | 101 | <0.0001 | 6.54 | |
| Female > male | TrO | Right | <0.0001 | 24846 | <0.0001 | 12.08 |
| Left | <0.0001 | 8.84 | ||||
| TSM | Left | <0.0001 | 9.62 | |||
| Right | <0.0001 | 9.74 | ||||
| Commisura anterior | Center | 0.222 | 4.85 | |||
| Commisura posterior | Center | 0.066 | 5.19 | |||
| OM | Left | <0.0001 | 8.77 | |||
| Right | <0.0001 | 7.78 | ||||
| CSt | Left | <0.0001 | 8.50 | |||
| Right | <0.0001 | 7.64 | ||||
| Cerebellum | Lobule VIII | <0.0001 | 9.12 | |||
| Lobule VII | <0.0001 | 9.68 | ||||
| Lobule VI | <0.0001 | 7.77 | ||||
| Lobule V | <0.0001 | 7.12 | ||||
| Lobule IV | <0.0001 | 6.58 | ||||
| tFA | Right | <0.0001 | 10.50 | |||
| Left | 0.006 | 113 | <0.0001 | 8.64 | ||
| Area X | Left | 0.139 | 57 | <0.0001 | 6.34 | |
| Right | <0.0001 | 254 | <0.0001 | 6.91 | ||
Table 3
Clusters displaying a difference in brain size versus a difference in sex in fractional anisotropy (FA).
Table summarizing the significance at cluster level and peak level. Some clusters are large and cover multiple regions, indicated by the single statistic at cluster level. For each sub-region within this large cluster the peak significance (pFWE) and T-value (T) are reported. p-Values are FWE corrected. KE indicates the number of continuous voxels within a cluster. The final column reports if a region with a difference in brain size is analogue to other relevant differences such as the general sexual dimorphism in fractional anisotropy (M > F or F > M) or the correlation between song rate and fractional anisotropy in females (↑Singing F).
| Large > small brain | Cluster | Hemisphere | Cluster | Peak | Relevant difference | ||
|---|---|---|---|---|---|---|---|
| pFWE | kE | pFWE | T | ||||
| HVC surr | Left | <0.0001 | 227 | <0.0001 | 6.43 | M > F | |
| Hippocampus | Left | <0.0001 | 155 | <0.0001 | 5.63 | ↑singing F | |
| LaM/LFS | Left | <0.0001 | 7.51 | ||||
| HVC surr | Right | <0.0001 | 417 | <0.0001 | 6.61 | M > F | |
| Hippocampus | Right | <0.0001 | 6.94 | ||||
| Area X caudal surr | Right | <0.0001 | 190 | 0.002 | 5.99 | M > F ↑Singing F | |
| LPS | Left | 0.004 | 126 | 0.006 | 5.78 | ||
| Lps/LFS | Right | <0.0001 | 337 | 0.042 | 5.29 | ||
| tFA | Right | 0.925 | 20 | 0.029 | 5.39 | F > M | |
| TrO | Right | 0.001 | 160 | <0.0001 | 7.29 | F > M | |
| RA surr | Left | <0.0001 | 451 | 0.193 | 4.88 | M > F | |
| Cerebellum | Lobule VI | <0.0001 | 7.50 | ||||
| Cerebellum | Lobule VI | 0.259 | 48 | 0.010 | 5.64 | ||
| Cerebellum | Lobule IV | 0.114 | 62 | 0.003 | 5.94 | ||
| Cerebellum | Lobule VII | 0.101 | 64 | 0.041 | 5.30 | ||
| Small > large brain | NCM | Left | 0.006 | 116 | <0.0001 | 6.39 | M > F |
| LaM | Right | 0.014 | 100 | 0.025 | 5.43 | M > F | |
| Ventricle rostral | Left | 0.217 | 51 | <0.0001 | 7.21 | ||
| Right | <0.0001 | 246 | <0.0001 | 6.83 | |||
| Ventricle caudal | Center | 0.002 | 138 | 0.003 | 5.90 | ||
| Center | 0.004 | 122 | 0.214 | 4.84 | |||
| TrO | Center | 0.011 | 105 | 0.232 | 4.82 | F > M | |
Table 4
Clusters displaying a significant change over time and the interaction between sex and time in fractional anisotropy (FA).
Table summarizing the significance at cluster level and peak level. Some clusters are large and cover multiple regions, indicated by the single statistic at cluster level. For each sub-region within this large cluster, the peak significance (pFWE) and T-value (T) are reported. p-Values are FWE corrected. KE indicates the number of voxels within a cluster. Gray values indicate clusters that are significant at cluster level but not at peak level.surr, surroundings.
| Effect | Cluster | Hemisphere | Cluster | Peak | ||
|---|---|---|---|---|---|---|
| pFWE | kE | pFWE | F | |||
| Interaction time * sex | HVC surr | Left | 0.001 | 61 | 0.013 | 8.75 |
| Right | 0.003 | 50 | 0.136 | 7.31 | ||
| RA rostro-lateral surr | Left | 0.013 | 36 | 0.139 | 7.29 | |
| NCM | Left | 0.048 | 26 | 0.331 | 6.65 | |
| Main time effect | HVC rostral surr | Right | 0.032 | 29 | 0.526 | 6.24 |
| RA caudal surr | Left | <0.0001 | 86 | 0.009 | 8.93 | |
| RA rostro-medial surr | Right | 0.006 | 42 | 0.017 | 8.57 | |
| Area X caudal surr | Right | <0.0001 | 222 | <0.0001 | 14.96 | |
| Right | 0.128 | 19 | 0.016 | 8.61 | ||
| Left | <0.0001 | 131 | 0.129 | 7.35 | ||
| Left | 0.148 | 18 | 0.039 | 8.07 | ||
| Area X rostral surr | Left | <0.0001 | 76 | 0.007 | 9.09 | |
| Left | 0.037 | 28 | 0.144 | 7.27 | ||
| Right | <0.0001 | 176 | <0.0001 | 11.05 | ||
| LMAN | Left | <0.0001 | 140 | 0.022 | 8.40 | |
| OM | Left | <0.0001 | 513 | <0.0001 | 16.44 | |
| Right | <0.0001 | 158 | 0.002 | 9.75 | ||
| CSt | Left | <0.0001 | 82 | 0.003 | 9.53 | |
| Right | 0.001 | 61 | 0.048 | 7.95 | ||
| Right | 0.025 | 31 | 0.242 | 6.89 | ||
| TSM | Right | 0.009 | 39 | 0.009 | 8.97 | |
| Left | 0.001 | 56 | 0.074 | 7.70 | ||
| tFA | Left | <0.0001 | 91 | <0.0001 | 12.73 | |
| Right | 0.015 | 35 | 0.042 | 8.03 | ||
| TrO | Left | <0.0001 | 302 | <0.0001 | 14.18 | |
| Right | 0.001 | 58 | 0.264 | 6.83 | ||
| LaM | Left | 0.037 | 28 | 0.120 | 7.40 | |
| Cerebellum | Lobule VII | <0.0001 | 1779 | <0.0001 | 15.26 | |
| Lobule VIII | <0.0001 | 13.17 | ||||
Table 5
Summary of the voxel-based correlation analysis of song rate vs fractional anisotropy.
This table summarizes for each significant cluster-based ROI the voxel-based FWE corrected p-value at cluster and peak level, next to the overall Pearson’s correlation, the repeated measures correlation (rmcorr) and its significance of the averaged fractional anisotropy values versus the respective song characteristic. KE indicates the cluster size. T reflects the t-value of the maximal peak located within the cluster-based ROI. Voxel-based correlations in gray are significant at the cluster level, but not at peak level. Significant repeated measures correlations are indicated in bold. surr, surroundings.
| Cluster | Hemi-sphere | Cluster | Peak | Pearson’s correlation | Rmcorr | |||
|---|---|---|---|---|---|---|---|---|
| pFWE | kE | pFWE | T | r | r | P | ||
| Area X caudal surr | Left | <0.0001 | 168 | 0.002 | 6.05 | 0.5396 | 0.444 | 0.0023 |
| Right | 0.001 | 116 | 0.015 | 5.45 | 0.5045 | 0.399 | 0.0066 | |
| Area X rostral surr | Left | 0.041 | 45 | 0.427 | 4.24 | 0.4587 | 0.291 | 0.0525 |
| RA rostro-medial surr | Right | 0.015 | 59 | 0.039 | 5.13 | 0.3969 | 0.263 | 0.0806 |
| Hippocampus | Left | 0.132 | 30 | 0.029 | 5.22 | 0.3883 | 0.343 | 0.0211 |
Key resources table
| Reagent type (species) or resource | Designation | Source or reference | Identifiers | Additional information |
|---|---|---|---|---|
| Strain, strain background (Sturnus vulgaris, male and female) | Starlings | Wild caught | See Materials and methods, Section 1 | |
| Commercial assay or kit | estradiol RIA | MP Biomedicals, Solon, Ohio | RRID:SCR_013308 SKU: 0723810-CF | |
| Commercial assay or kit | testosterone RIA | MP Biomedicals, Solon, Ohio | RRID:SCR_013308 SKU: 0718910-CF | |
| Software, algorithm | Raven Pro | Cornell Lab of Ornithology, Ithaca, NY | Version 1.5 | |
| Software, algorithm | MrTrix3 | MrTrix3 (https://www.mrtrix.org) | RRID:SCR_006971 | version 3.0 |
| Software, algorithm | SPM | SPM (https://www.fil.ion.ucl.ac.uk/spm) | RRID:SCR_007037 | Version 12 |
| Software, algorithm | Rmcorr | Bakdash and Marusich, 201710.3389/fpsyg.2017.00456 | Version 0.4.3 | |
| Software, algorithm | JMP Pro 15 | JMP (https://www.jmp.com) | RRID:SCR_014242 | Version 15.1 |
| Software, algorithm | GraphPad prism | GraphPad Prism (https://graphpad.com) | RRID:SCR_002798 | Version 6 |
Additional files
Download links
A two-part list of links to download the article, or parts of the article, in various formats.
Downloads (link to download the article as PDF)
Open citations (links to open the citations from this article in various online reference manager services)
Cite this article (links to download the citations from this article in formats compatible with various reference manager tools)
Uncovering a ‘sensitive window’ of multisensory and motor neuroplasticity in the cerebrum and cerebellum of male and female starlings
eLife 10:e66777.
https://doi.org/10.7554/eLife.66777


