An NKX2-1/ERK/WNT feedback loop modulates gastric identity and response to targeted therapy in lung adenocarcinoma
- Huntsman Cancer Institute, United States
- Department of Pathology, University of Utah, United States
- School of Computing, University of Utah, United States
- Department of Oncological Sciences, University of Utah, United States
Figures
Figure 1 with 2 supplements
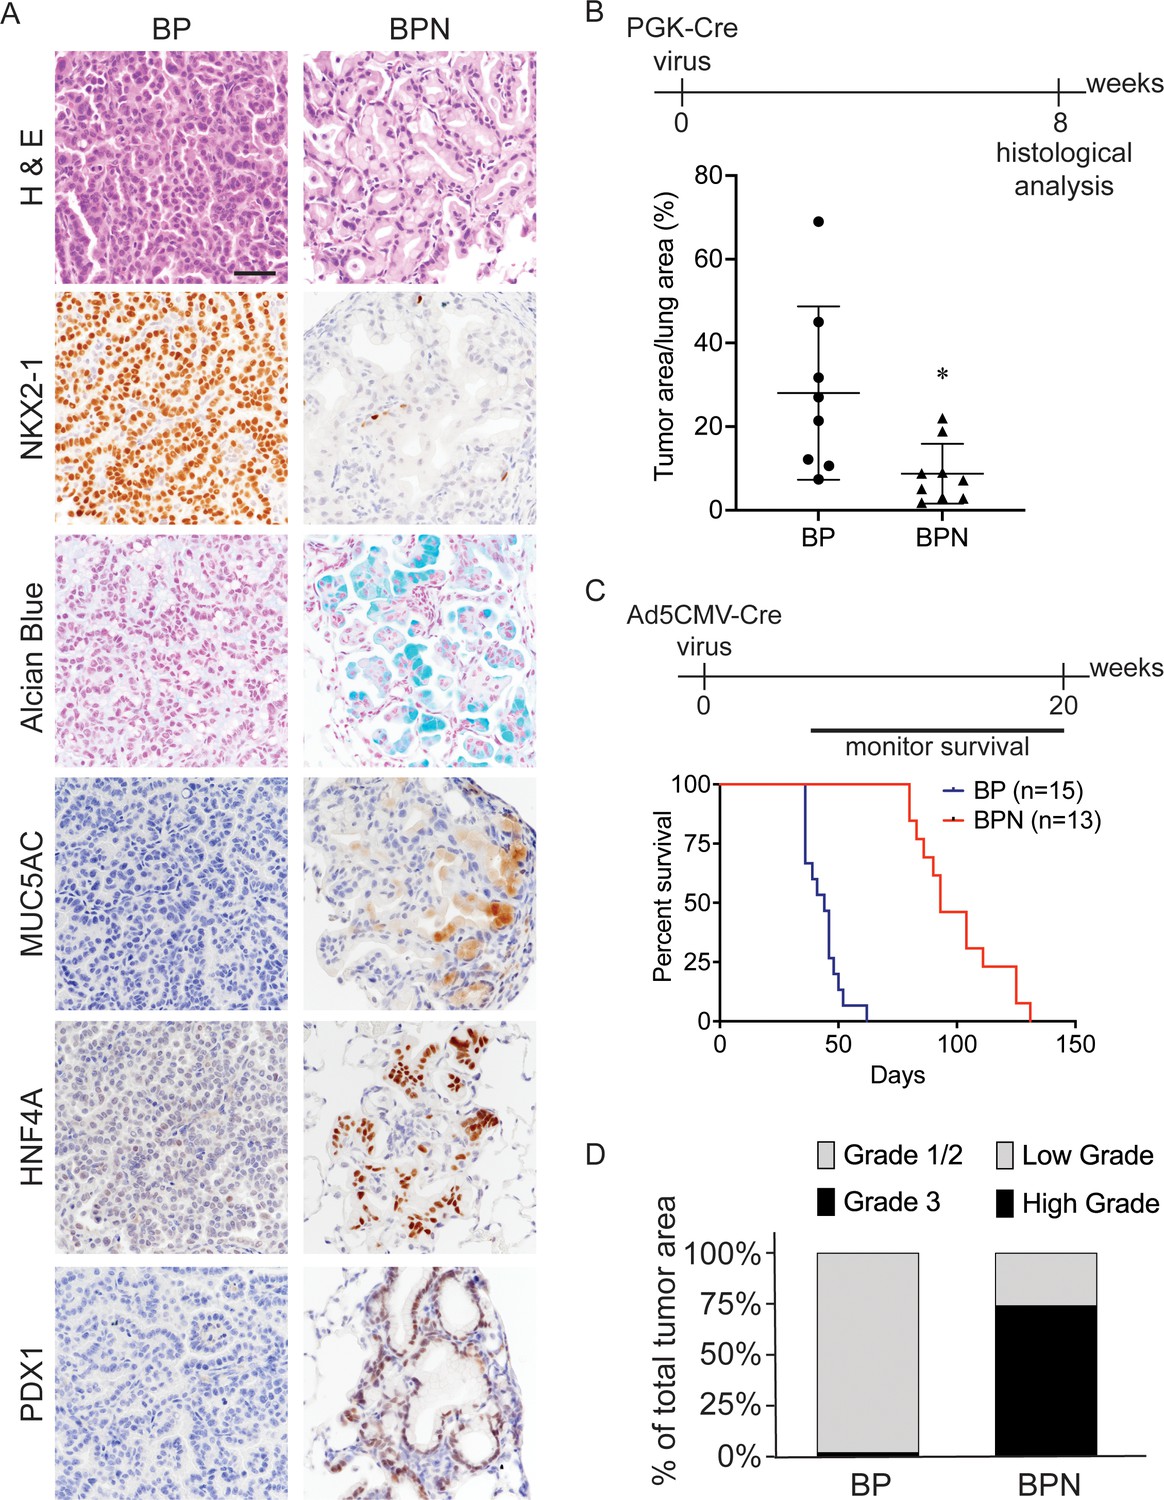
Nkx2-1 deletion induces mucinous adenocarcinoma but impairs tumor initiation in BRAFV600E-driven lung adenocarcinoma.
(A) Representative photomicrographs of lung neoplasia arising 8 weeks after initiation with PGK-Cre lentivirus (5 × 10³ pfu/mouse). BP mice are BrafLSL-V600E/+;Trp53f/f;Nkx2-1f/+;Rosa26LSL-tdTomato/LSL-tdTomato. BPN mice are BrafLSL-V600E/+;Trp53f/f;Nkx2-1f/f;Rosa26LSL-tdTomato/LSL-tdTomato. Hematoxylin and eosin (H and E), Alcian Blue stain for mucin production, and immunohistochemistry (IHC) for NKX2-1, plus, markers of gastrointestinal differentiation. Scale bar: 100 µm. (B) Quantitation of lung tumor burden 8 weeks after initiation with PGK-Cre lentivirus (5 × 10³ pfu/mouse) in indicated genotypes of mice: BP (n = 8), BPN (n = 9). *p=0.019 by Student’s t-test. (C) Long-term survival after tumor initiation with Ad5-CMV-Cre adenovirus (2.5 × 10⁷ pfu/mouse) in mice of indicated genotypes. p<0.0001 by Log-rank test. (D) Histopathologic assessment of the percentage of tumors of indicated grade for mice enrolled in survival study (C).
Figure 1—figure supplement 1
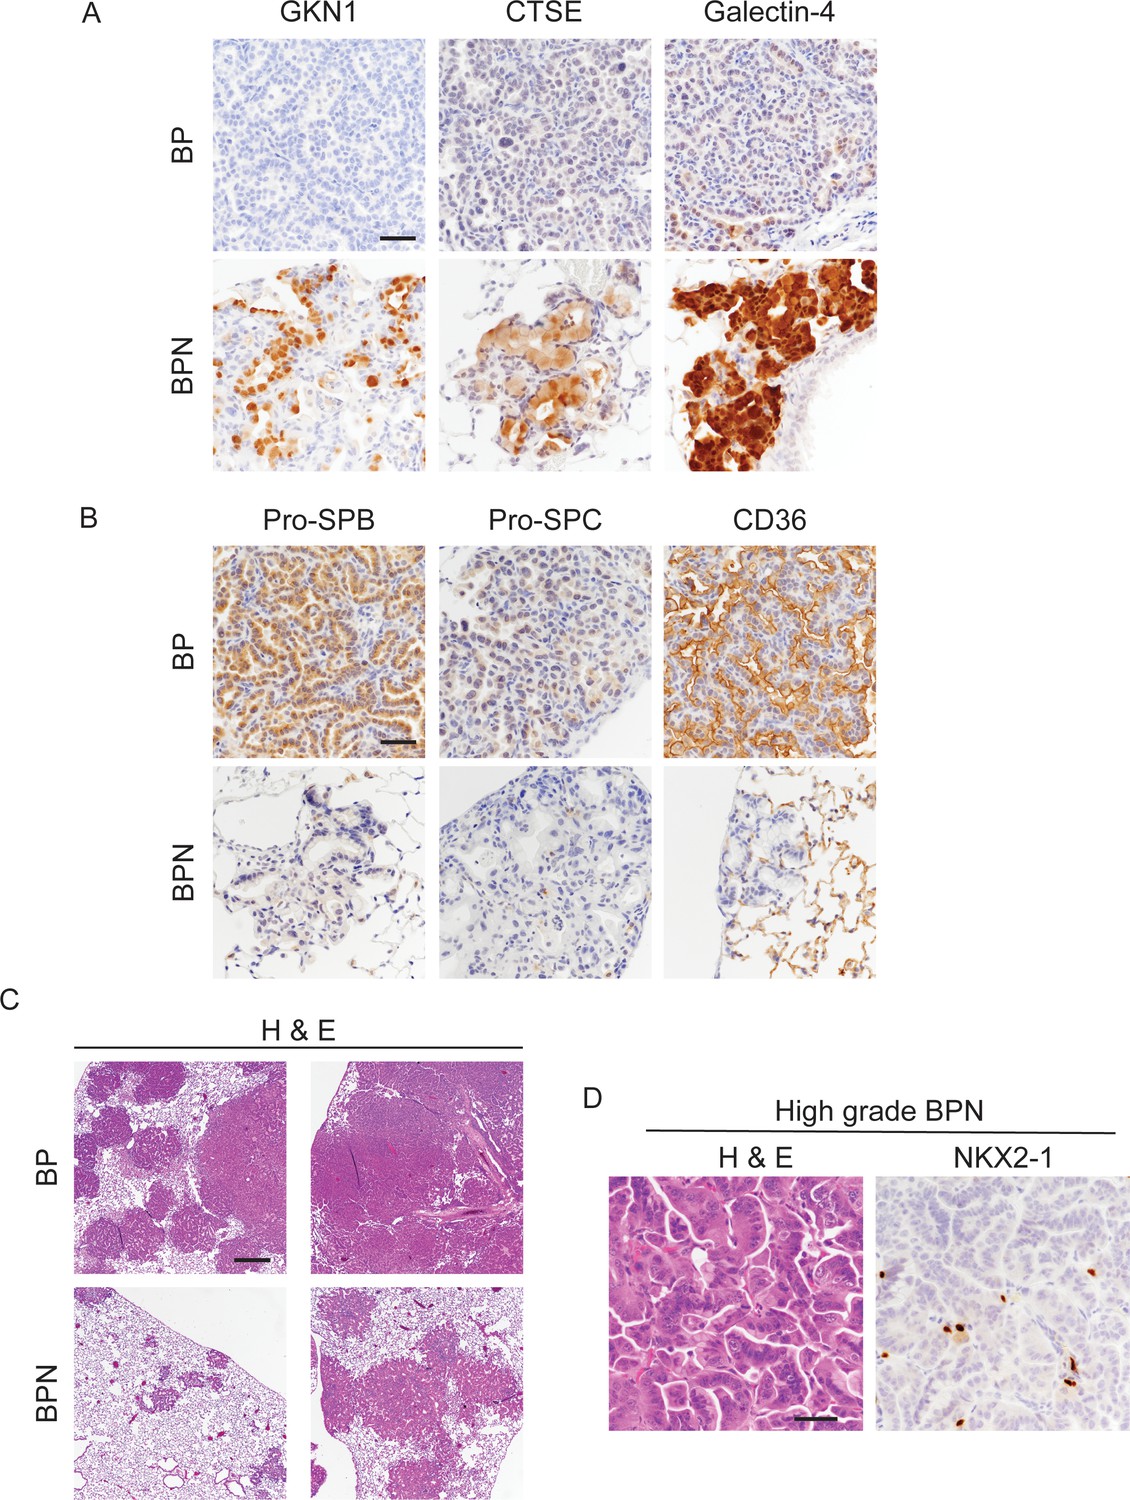
Nkx2-1 deletion induces mucinous adenocarcinoma but impairs tumor initiation in BRAFV600E-driven lung adenocarcinoma.
(A, B) Histologic phenotype of lung neoplasia arising 8 weeks after initiation with PGK-Cre lentivirus (5 × 10³ pfu/mouse) in BrafLSL-V600E/+;Trp53f/f;Nkx2-1f/+;Rosa26LSL-tdTomato/LSL-tdTomato (BP) and BrafLSL-V600E/+;Trp53f/f;Nkx2-1f/f;Rosa26LSL-tdTomato/LSL-tdTomato (BPN) mice. Immunostaining for markers of gastrointestinal (A) and pulmonary (B) differentiation. Scale bar: 100 µm. (C) Low-magnification images of H and Es for representative BP and BPN tumor-bearing lungs. Scale bar: 1000 µm. (D) H and E and NKX2-1 IHC of a representative high-grade BPN lung tumor. Scale bar: 100 µm.
Figure 1—figure supplement 2

Percentage of incomplete recombinant tumors in BrafLSL-V600E/+;Trp53f/f;Nkx2-1f/f;Rosa26LSL-tdTomato/LSL-tdTomato mice from Figure 1C.
Graph represents mean ± S.D.
Figure 2 with 2 supplements
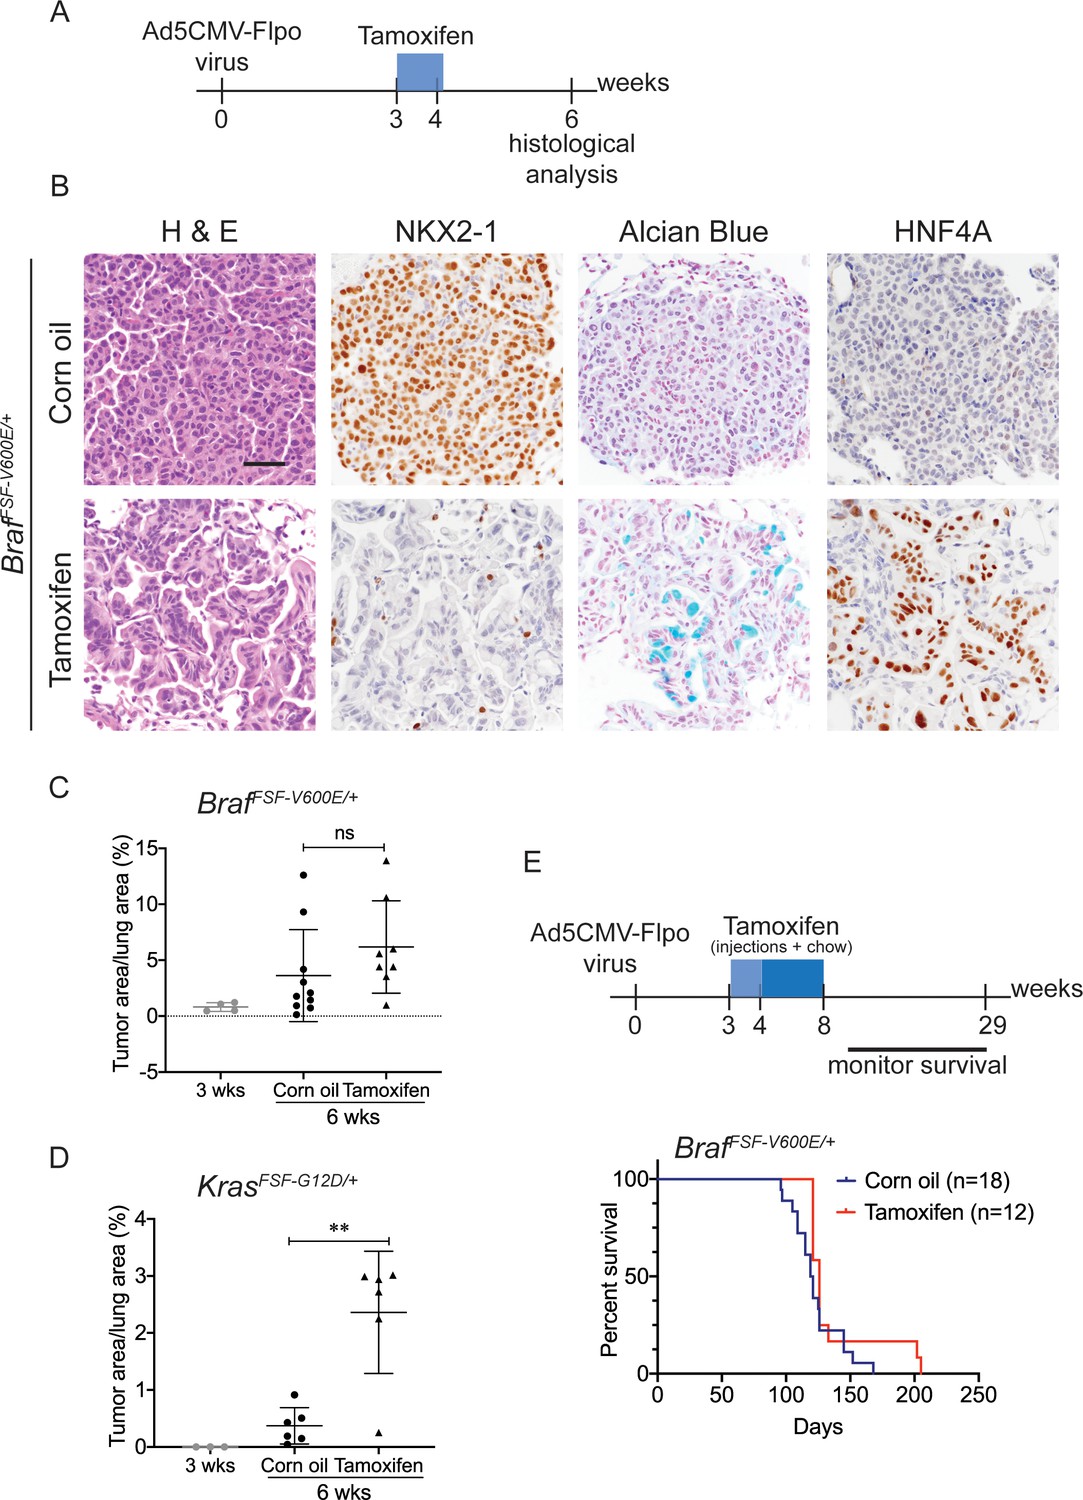
Nkx2-1 deletion in established BRAF-mutant LUAD induces mucinous adenocarcinoma without altering tumor growth.
(A–C) All mice are BrafFSF-V600E/+;Trp53frt/frt;Nkx2-1f/f;Rosa26FSF-CreERT2/FSF-CreERT2. Viral FlpO-recombinase expression simultaneously activated BRAFV600E and CreERT2 and deleted Trp53 by excision of Frt sites. Three weeks post-tumor initiation, mice were injected with corn oil (as vehicle control) or with tamoxifen to recombine LoxP-sites within Nkx2-1 alleles by CreERT2 recombinase. Lungs were harvested 3 weeks thereafter. (A) Experimental scheme. (B) H and E, Alcian Blue, NKX2-1 and HNF4A staining of lung neoplasia arising 6 weeks after initiation with Ad5CMV-FlpO adenovirus (2 × 10⁷ pfu/mouse). Scale bar: 100 µm. (C) Quantitation of tumor burden at 3 weeks (n = 4 mice), and at 6 weeks after initiation, following corn oil treatment (n = 10 mice) or tamoxifen injections (n = 8 mice). Tamoxifen administration consisted of six intraperitoneal doses over 9 days. Graphs represent mean ± S.D. p Values are not statistically significant. (D) Mice are KrasFSF-G12D/+;Trp53frt/frt;Nkx2-1f/f;Rosa26FSF-CreERT2/FSF-CreERT2 and were administered with corn oil (n = 6 mice) or tamoxifen (n = 6 mice) injections as described in (A). Shown is the quantitation of tumor burden at 3 weeks and at 6 weeks post-initiation. Graphs represent mean ± S.D. **p=0.0014 by Student’s t-test. (E) Survival of BrafFSF-V600E/+;Trp53frt/frt;Nkx2-1f/f;Rosa26FSF-CreERT2/FSF-CreERT2 mice that were treated with tamoxifen or vehicle starting at 3 weeks following tumor initiation. Tamoxifen administration consisted of six intraperitoneal doses over 9 days, followed by tamoxifen-containing chow for 1 month.
Figure 2—figure supplement 1
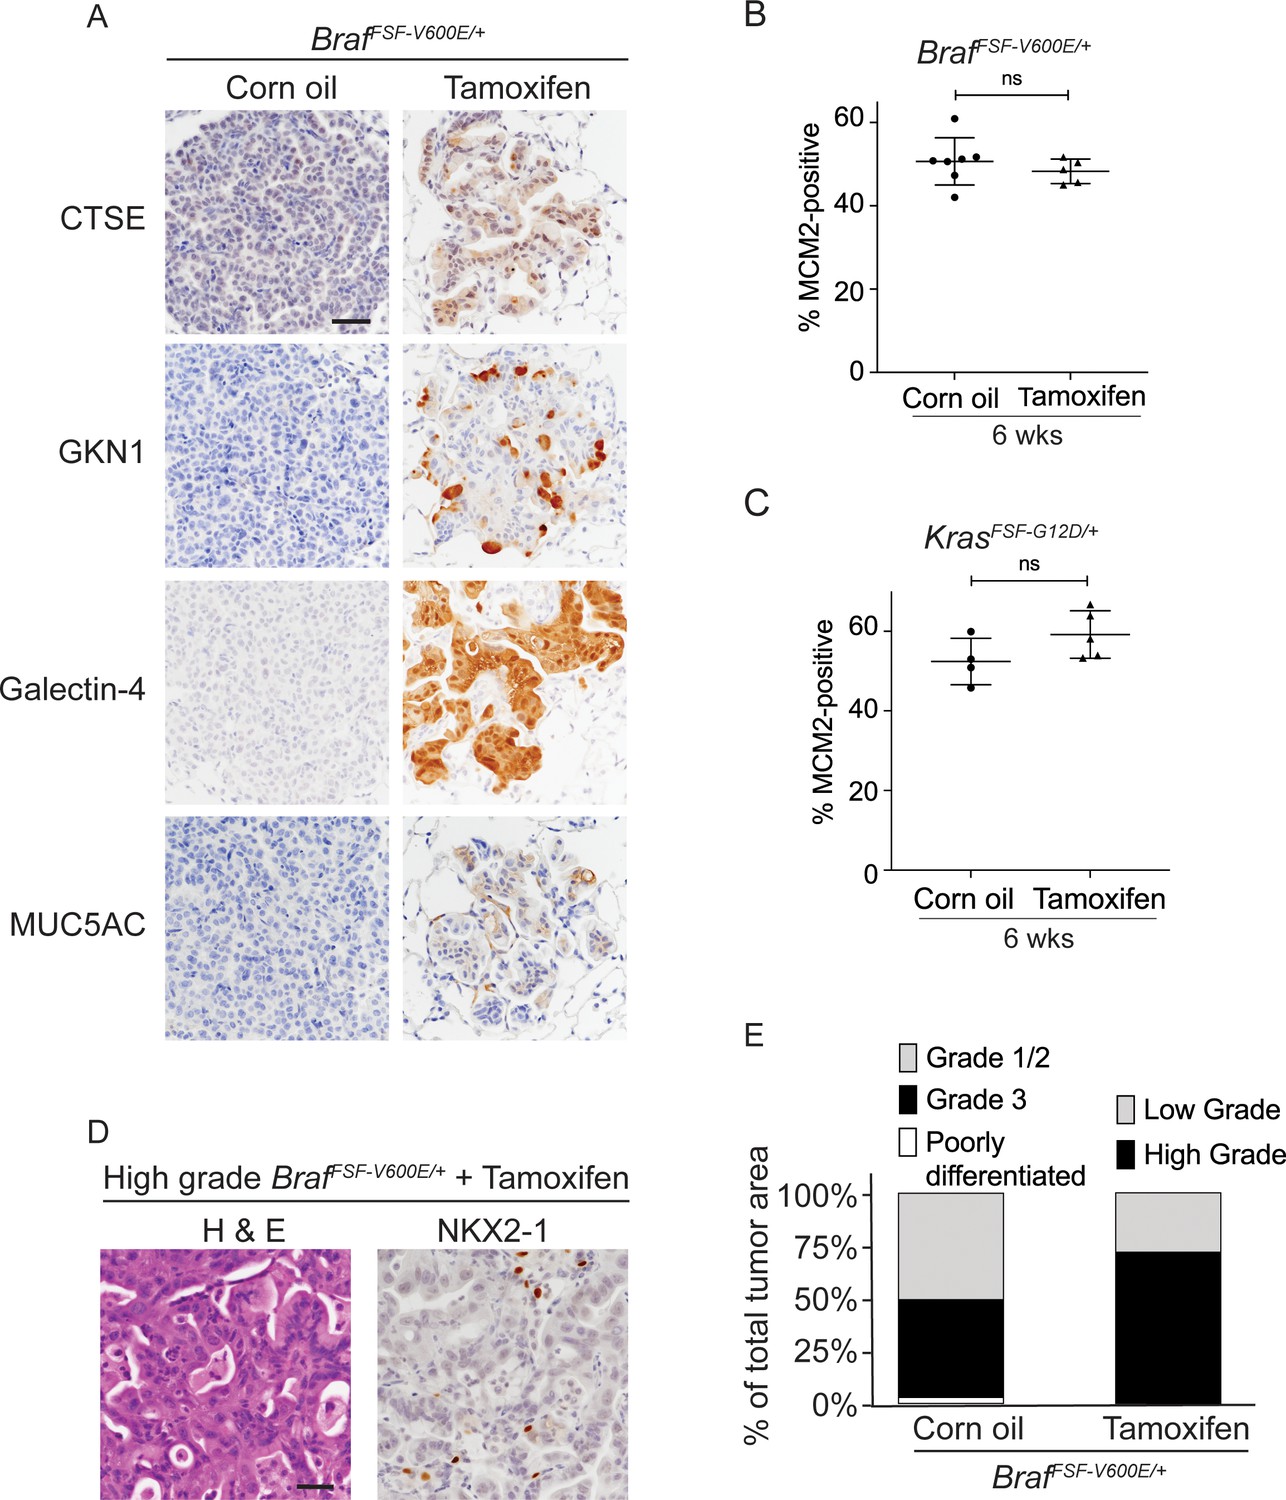
Nkx2-1 deletion in established BRAF-mutant LUAD induces mucinous adenocarcinoma without altering tumor growth.
(A) Immunostaining for indicated mucin/gastric markers in NKX2-1-positive and -negative LUADs. Lung tumor sections were obtained from corn oil or tamoxifen treated BrafFSF-V600E/+;Trp53frt/frt;Nkx2-1f/f;Rosa26FSF-CreERT2/FSF-CreERT2 mice 6 weeks post-initiation with Ad5CMV-FlpO adenovirus (2 × 10⁷ pfu/mouse). Scale bar: 100 µm. (B, C) Quantitation of MCM2-positive cells in lung tumors at 6 weeks after initiation, and following corn oil/tamoxifen injections at 3 weeks. Lung neoplasia was initiated with Ad5CMV-FlpO adenovirus (2 × 10⁷ pfu/mouse) in BrafFSF-V600E/+;Trp53frt/frt;Nkx2-1f/f;Rosa26FSF-CreERT2/FSF-CreERT2 and KrasFSF-G12D/+;Trp53frt/frt;Nkx2-1f/f;Rosa26FSF-CreERT2/FSF-CreERT2 mice. Graphs represent mean ± S.D. Multiple tumors in BrafFSF-V600E/+;Trp53frt/frt;Nkx2-1f/f;Rosa26FSF-CreERT2/FSF-CreERT2 oil (n = 7 mice); tamoxifen administered (n = 5 mice); KrasFSF-G12D/+;Trp53frt/frt;Nkx2-1f/f;Rosa26FSF-CreERT2/FSF-CreERT2 oil (n = 4 mice) and tamoxifen administered (n = 5 mice) were analyzed. (D) Representative images of high-grade tumors obtained from a BrafFSF-V600E/+;Trp53frt/frt;Nkx2-1f/f;Rosa26FSF-CreERT2/FSF-CreERT2 mouse that had received tamoxifen injections. Scale bar: 100 µm. (E) Grades for individual tumors based on criteria described for Figure 1D. Histopathologic assessment was performed for mice enrolled in survival study (Figure 2E).
Figure 2—figure supplement 2
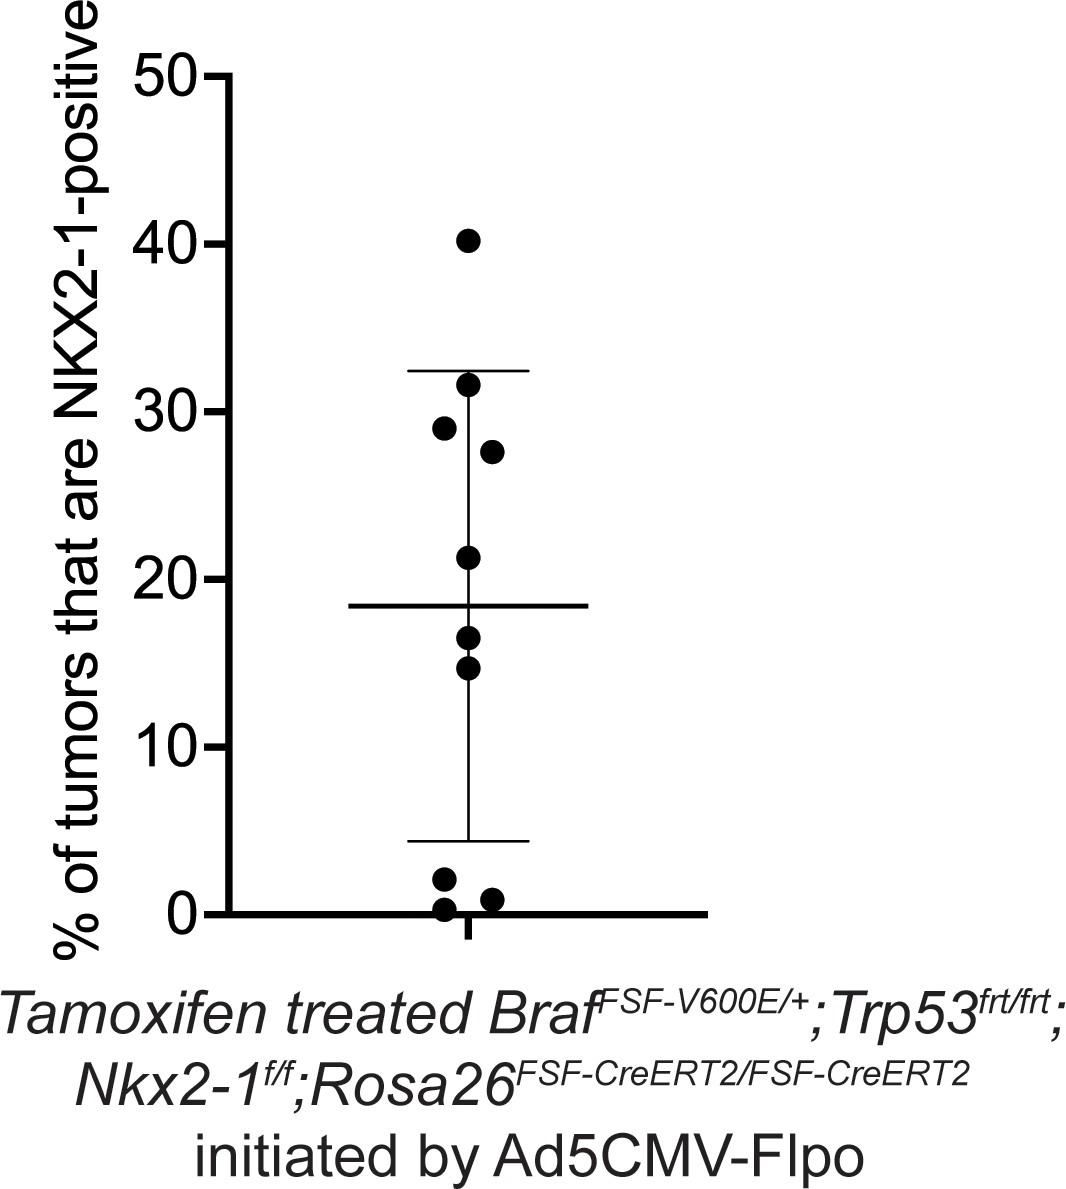
Percentage of incomplete recombinant tumors in BrafFSF-V600E/+;Trp53frt/frt;Nkx2-1f/f;Rosa26FSF-CreERT2/FSF-CreERT2 mice that were treated with Tamoxifen from Figure 2E.
Graph represents mean ± S.D.
Figure 3 with 1 supplement
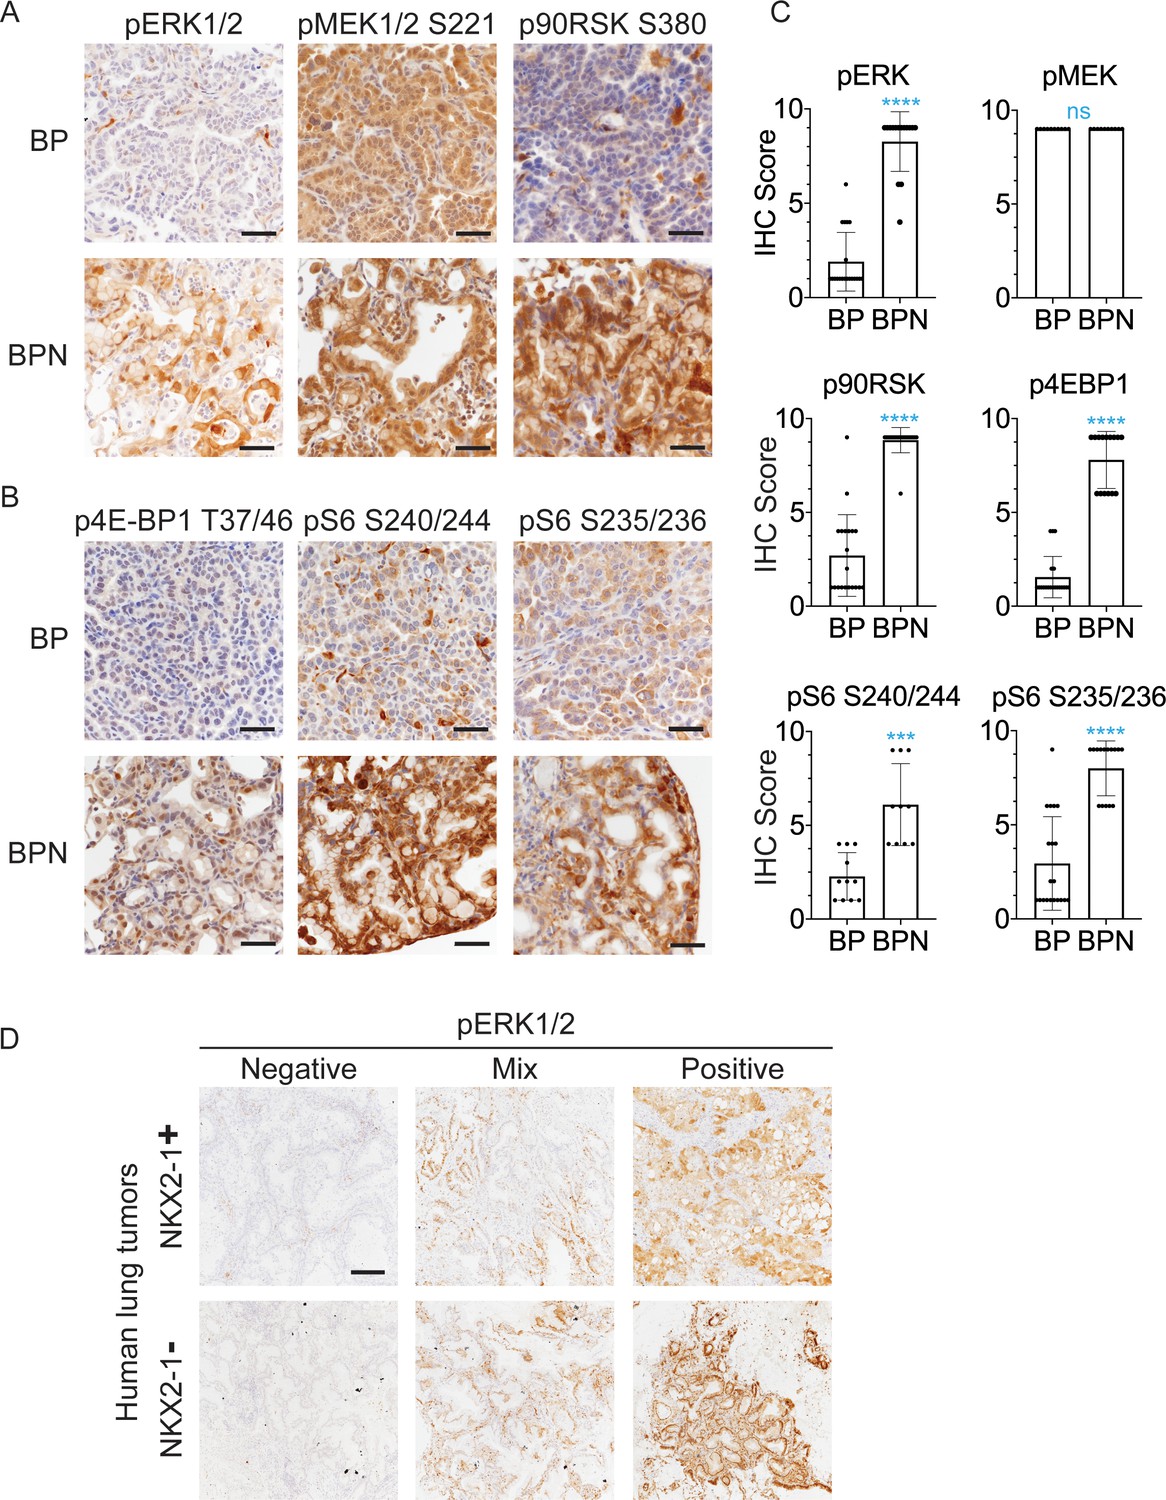
NKX2-1 regulates MAPK pathway in BRAFV600E-driven LUAD.
(A, B) IHC for indicated proteins in lung neoplasia present at 8 weeks post-initiation in BrafLSL-V600E/+;Trp53f/f;Nkx2-1f/+;Rosa26LSL-tdTomato/LSL-tdTomato and BrafLSL-V600E/+;Trp53f/f;Nkx2-1f/f;Rosa26LSL-tdTomato/LSL-tdTomato mice. (C) IHC quantitation of phosphoproteins in indicated tumor types (n = 2–4 mice/genotype). Each dot represents one tumor. Error bars indicate mean ± S.D. ****p<0.0001, ***p<0.001, ns = not significant by Mann-Whitney test. (D) Representative staining of phospho-ERK in human non-mucinous (NKX2-1-positive, n = 51) and mucinous (NKX2-1-negative, n = 17) lung tumors. Scale bar: 500 µm.
Figure 3—figure supplement 1
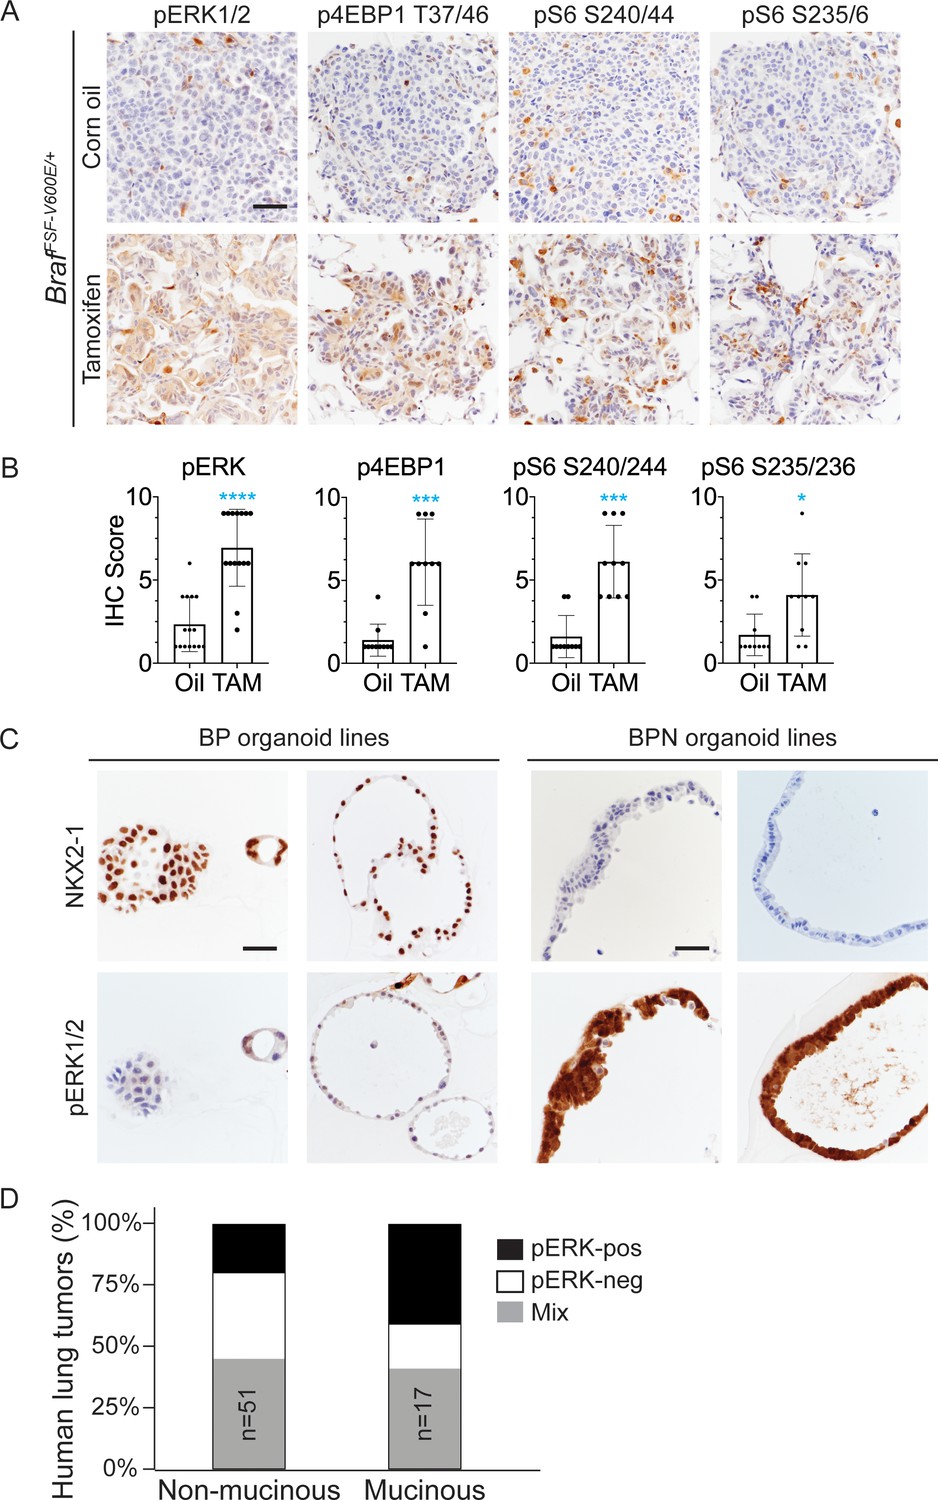
NKX2-1 regulates MAPK pathway in BRAFV600E-driven LUAD.
(A) IHC for indicated phospho-proteins in NKX2-1-positive and -negative LUADs. Lung tumor sections were obtained from corn oil or tamoxifen-treated BrafFSF-V600E/+;Trp53frt/frt;Nkx2-1f/f;Rosa26FSF-CreERT2/FSF-CreERT2 mice 6 weeks post-initiation with Ad5CMV-FlpO. (B) IHC quantitation of phosphoproteins in indicated tumor types. Error bars indicate mean ± S.D. ****p<0.0001, ***p<0.001, *p<0.05 by Mann-Whitney test. At least 10 tumors across 2–3 mice were analyzed. (C) Long-term 3D cultures of primary mouse LUAD cells isolated from BrafLSL-V600E/+;Trp53f/f;Nkx2-1f/+;Rosa26LSL-tdTomato/LSL-tdTomato (BP) and BrafLSL-V600E/+;Trp53f/f;Nkx2-1f/f;Rosa26LSL-tdTomato/LSL-tdTomato (BPN) mice 8 weeks post-initiation. Shown are representative IHC photomicrographs. Scale bar: 100 µm. (D) Quantitation of phospho-ERK levels in human lung tumors relative to NKX2-1 expression/histologic subtype.
Figure 4 with 1 supplement
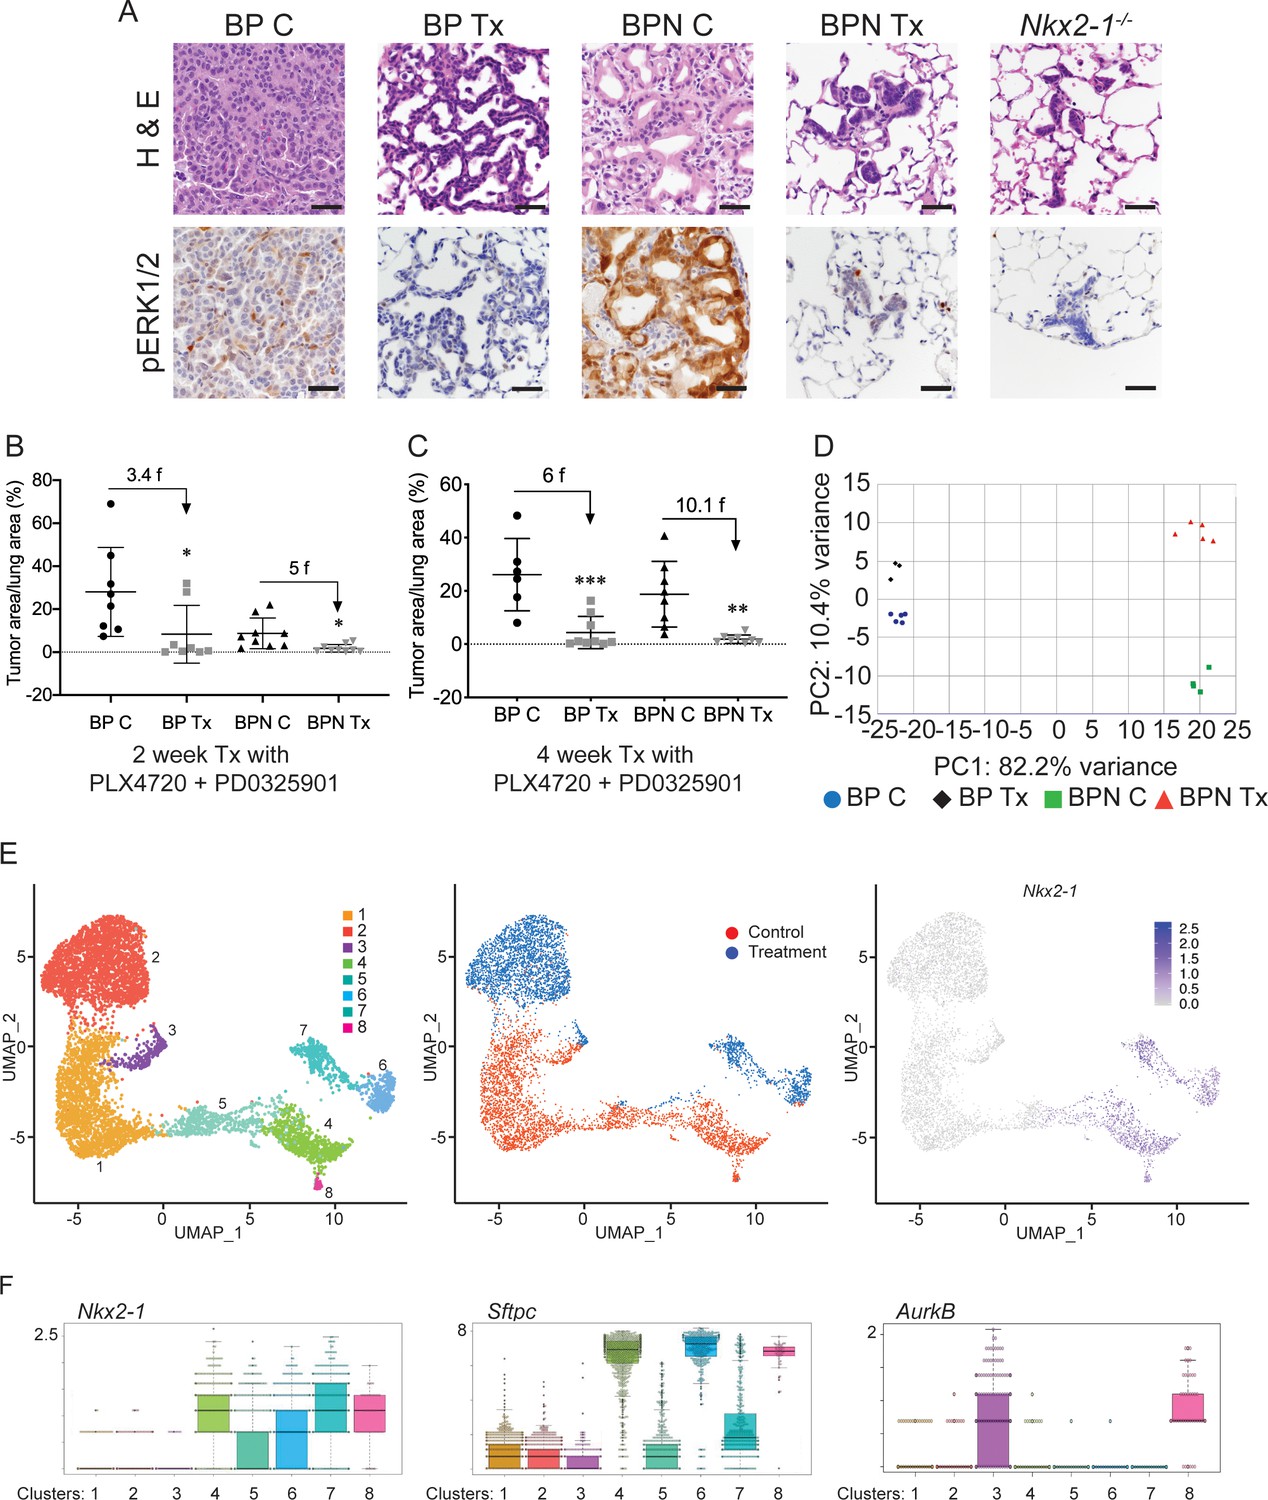
NKX2-1 status modulates response to MAPK pathway inhibitors.
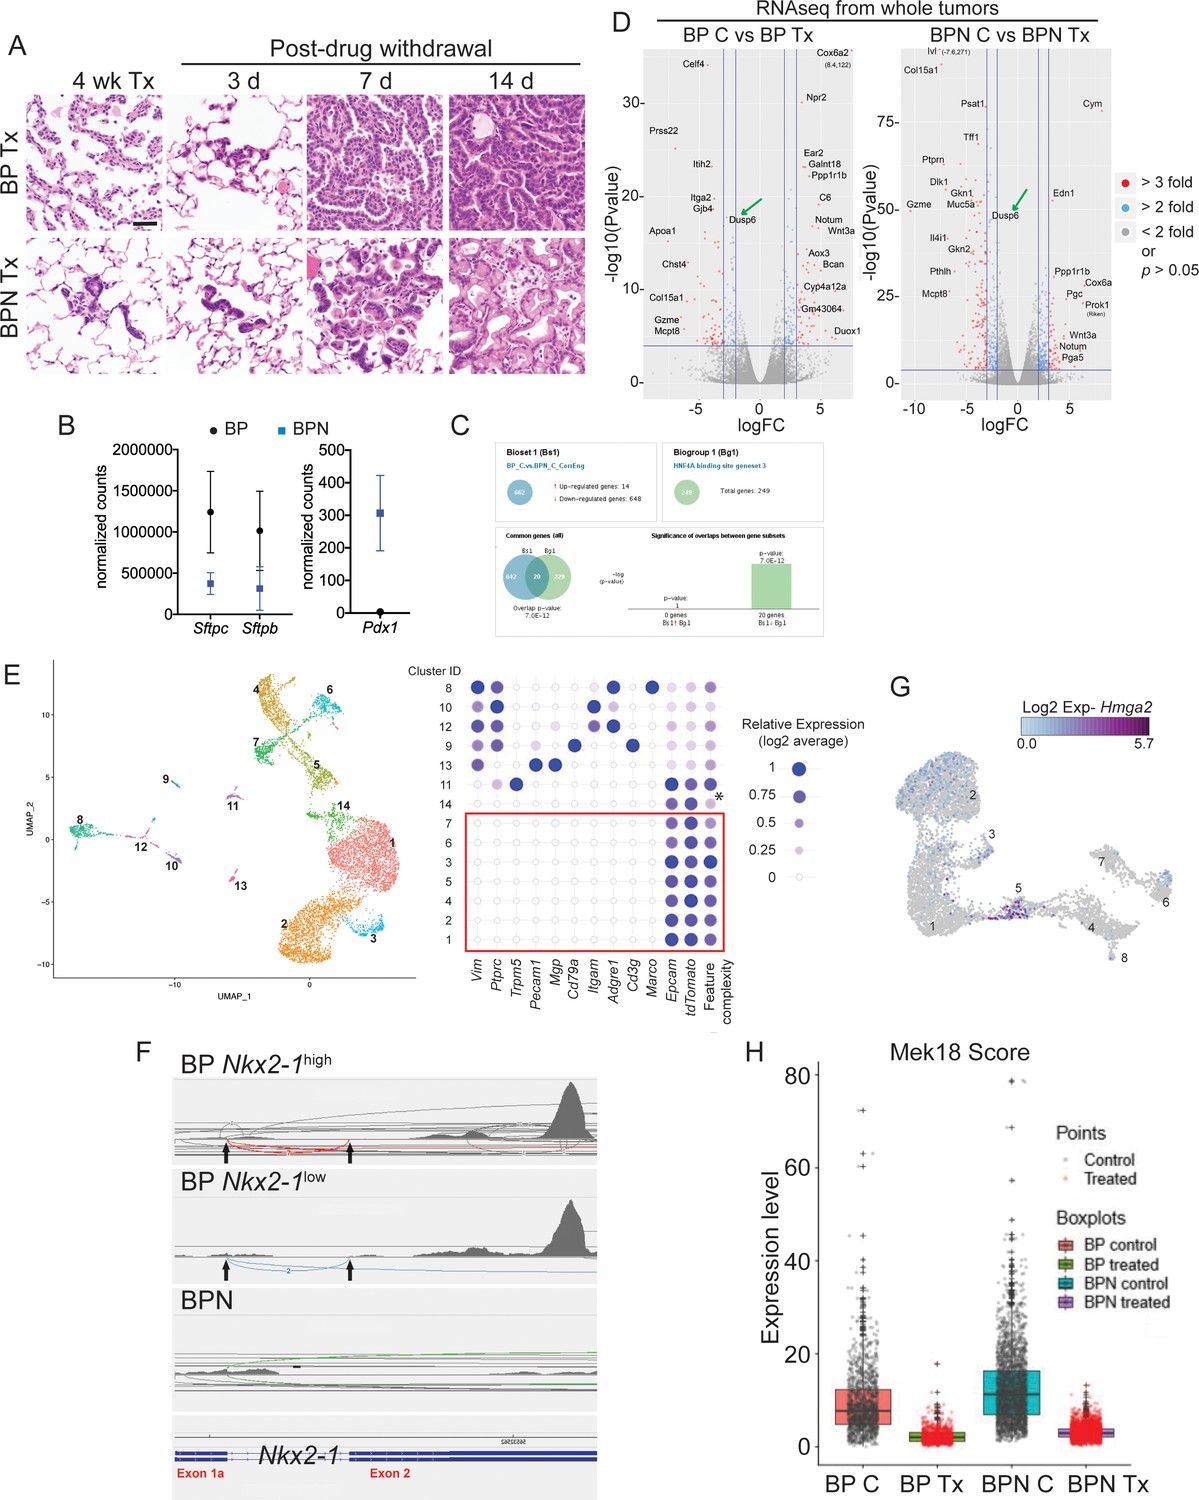
(A) Representative H and E and phospho-ERK1/2 immunostaining photomicrographs of paraffin-embedded lung sections from BrafLSL-V600E/+;Trp53f/f;Nkx2-1f/+;Rosa26LSL-tdTomato/LSL-tdTomato and BrafLSL-V600E/+;Trp53f/f;Nkx2-1f/f;Rosa26LSL-tdTomato/LSL-tdTomato mice that were treated with control chow (BP C/BPN C) or chow containing PLX4720 (200 mg/kg) and PD0325901 (7 mg/kg) inhibitors (BP Tx/BPN Tx) for 2 weeks starting at 6 weeks post-tumor initiation with PGK-Cre lentivirus (5 × 10³ pfu/mouse). Scale bar: 100 µm. (B, C) Quantitation of tumor burden in BP and BPN mice that were fed control chow or chow containing MAPK inhibitors starting at 6 weeks post-tumor initiation with PGK-Cre lentivirus (5 × 10³ pfu/mouse). Graphs represent mean ± S.D. (B) Chow treatment lasted 2 weeks and lungs were harvested at the 8-week timepoint. BP C (n = 8), BP Tx (n = 8), BPN C (n = 9), BPN Tx (n = 9). *p<0.05 by Student’s t-test. Numbers indicated above graphs represent the fold reduction in tumor burden upon inhibitor-chow administration. (C) Chow treatment lasted 4 weeks and lungs were harvested at the 10-week timepoint. BP C (n = 6), BP Tx (n = 9), BPN C (n = 8), BPN Tx (n = 8). **p<0.01, ***p<0.001 by Student’s t-test. Numbers indicated above graphs represent the fold reduction in tumor burden with inhibitor-chow administration. (D) Global gene expression analyses were performed on RNAs from FACS-sorted tdTomato+ BP C (n = 5), BP Tx (n = 3), BPN C (n = 4), and BPN Tx (n = 5) murine lung tumor cells isolated at 7 weeks following initiation with Ad5-Spc-Cre adenovirus (5 × 10⁸ pfu/mouse for BP and 8 × 10⁸ pfu/mouse for BPN mice). Control and MAPK-inhibitor chow treatments were given for 1 week at 6 weeks post-adenoviral instillation. Shown is the principal-component analysis (PCA) plot of the top 500 most variable genes showing that the four experimental groups of lung tumors, BP C, BP Tx, BPN C, and BPN Tx, had distinct global patterns of gene expression. (E) UMAP plots showing relatedness of high-quality, tumor cell scRNA-seq profiles from BPN control (n = 2) and BPN MAPKi-treated (n = 2) mice. Tumor cluster designations are indicated (left). Control and treated cells indicated (middle). Nkx2-1 expression in scRNA-seq data indicating that clusters 4–8 represent incomplete recombinants (right). Single tumor cells were obtained by FACS-sorting tdTomato+ cells isolated at 7 weeks following initiation with Ad5-Spc-Cre adenovirus (8 × 10⁸ pfu/mouse). Control and MAPK-inhibitor chow treatments were given for 1 week at 6 weeks post- adenoviral instillation. (F) Beeswarm plots of single cell sequencing data showing expression levels of Nkx2-1, Sftpc and Aurkb transcripts in tumor clusters 1–8.
Figure 4—figure supplement 1
NKX2-1 status modulates response to MAPK pathway inhibitors.
(A) Representative histology of BP and BPN tumors after 4 weeks of combined BRAFV600E and MEK inhibitor chow treatment, as well as at different timepoints following drug withdrawal demonstrating rapid tumor relapse. (B) Graphs comparing absolute expression levels of direct NKX2-1 targets (Sftpc and Sftpb) as well as the gastrointestinal marker Pdx1 in BP (n = 8) and BPN (n = 9) tumors, data obtained from RNA sequencing from whole tumors. (C) Whole-tumor RNA-seq analyses of BP and BPN tumors via Illumina Correlation Engine indicating that HNF4A-binding site geneset three becomes significantly enriched upon loss of Nkx2-1. (D) Volcano plots of whole-tumor RNA sequencing data from control and MAPK inhibitor-treated BP tumors (left) and BPN tumors (right) indicating differentially expressed genes (EdgeR) (see also Supplementary file 2, 3). Select highly differentially expressed genes are highlighted. (E) Left- UMAP visualization of single cell transcriptome relatedness indicating 14 distinct clusters. Right- Relative expression of stromal marker genes and feature complexity score used in selecting high complexity tumor clusters that lack stromal marker gene expression for further analysis (red box). * Lower than average complexity. Note that the cluster ID labels for tumor cell clusters used in Figure 4E (post-stromal cell exclusion) and E are different. (F) Sashimi plots visualizing raw RNA-seq densities along Nkx2-1 exons and splice junction for Nkx2-1-positive and Nkx2-1-negative single tumor cells from their alignment data. Exon 1a-2 junctions and exon two reads are only detected in cells expressing Nkx2-1 to variable degree indicating that these are incomplete recombinants (BP cells). (G) UMAP visualization of Hmga2 expression in tumor clusters 1–8. (H) Quantitation of MAPK activation levels in single cell RNA sequencing data using Mek18 transcriptional signature (Dry et al., 2010). BP indicates cells from clusters 4–8; BPN indicates cells from clusters 1–3 (see Figure 4E, F). (C) Control, Tx = BRAFi/MEKi treatment.
Figure 5 with 1 supplement
Differential impact of MAPK inhibitors on the cell cycle in NKX2-1-positive and NKX2-1-negative tumors.
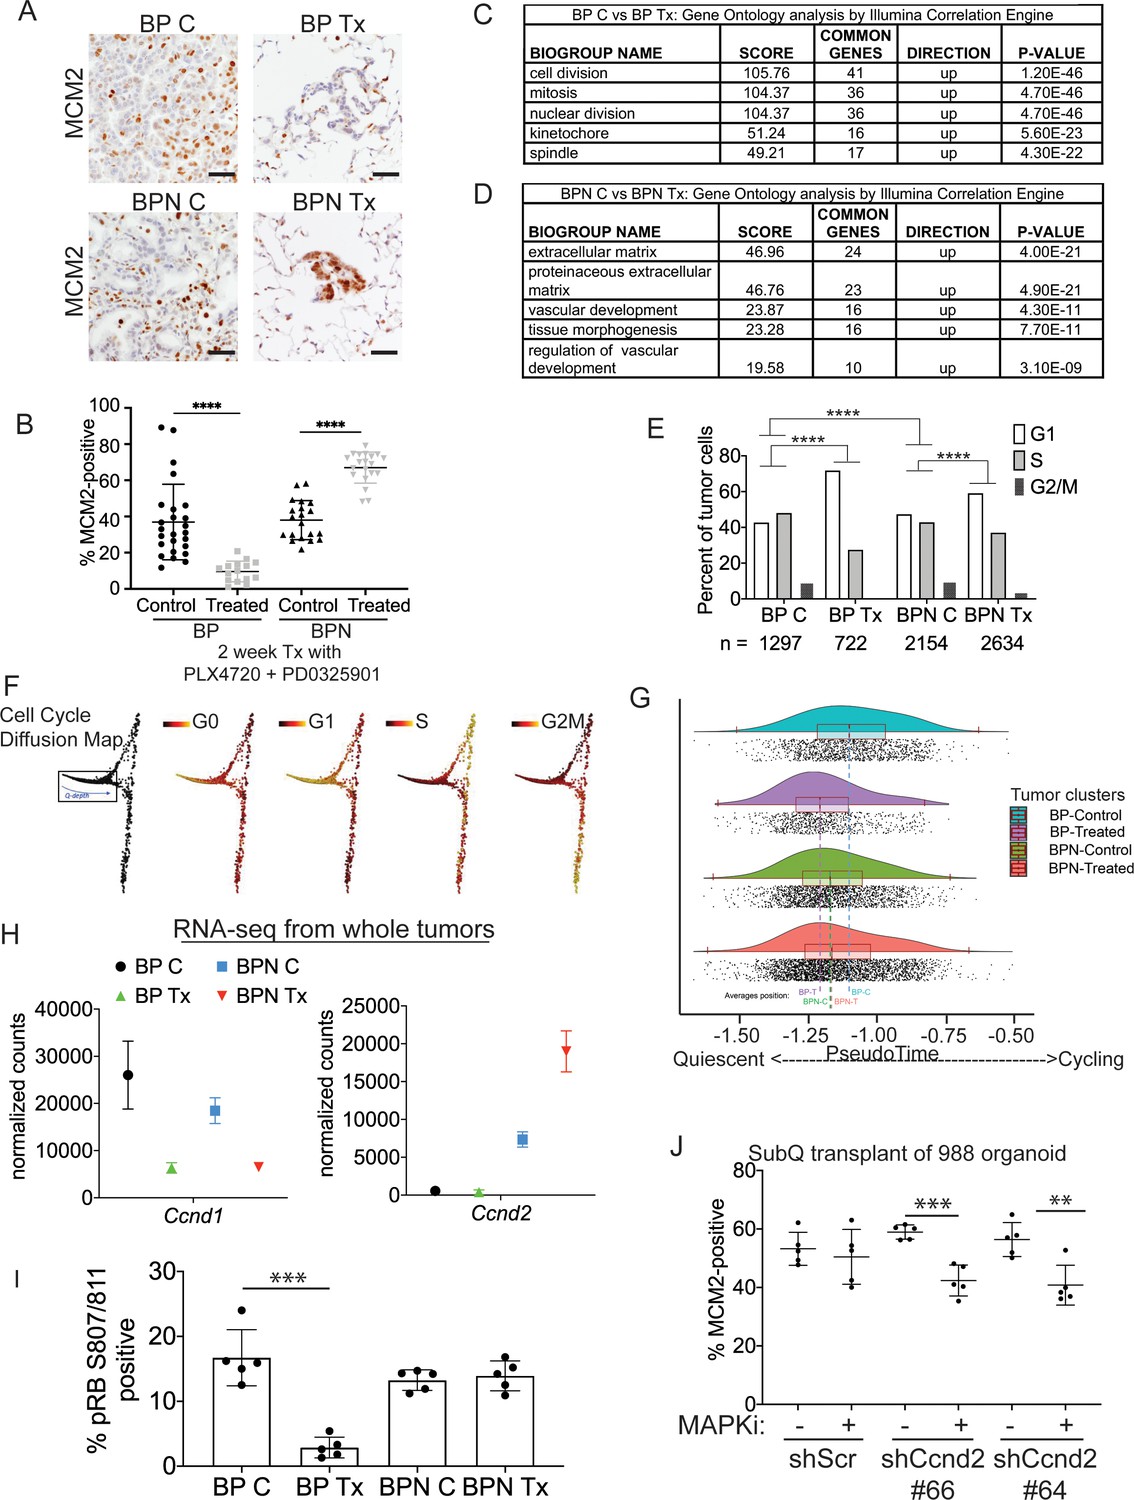
(A, B) Immunostaining for and quantitation of the proliferation marker MCM2 in tumors from BP and BPN mice at 8 weeks post-initiation. Control or MAPK-inhibitor infused chow feeding started at 6 weeks and was maintained for 2 weeks. BP C (25 tumors from four mice), BP Tx (15 tumors from three mice), BPN C (20 tumors from three mice), BPN Tx (20 tumors from three mice). Scale bar: 100 µm. Graphs represent mean ± S.D. ****p<0.0001 by Student’s t-test. (C, D) Lists of the top-scoring Gene Ontology pathway terms of differentially expressed genes between control- and MAPKi drug-chow-treated BP (C) or BPN (D) tumors, as determined by Illumina Correlation Engine analyses of whole-tumor RNA-seq data. UP = enriched in control relative to treated samples. (E) Analysis of cell cycle score in single-cell RNA sequencing data using Seurat package. Utilized cell cycle genes as defined by Mizuno et al., 2009. ****p<0.0001 by Wilcox test. BP C = clusters 4, 5, 8; BP Tx = clusters 6, 7; BPN C = clusters 1, 3control; BPN Tx = clusters 2, 3treated (see Figure 4E). (F) Diffusion map of cell cycle phase signatures in scRNA-seq data showing coherent enrichment for phase specific signatures at specific graphical regions. > 80% of cells are disturbed in the box that correlates with G0 and G1 signatures and along which we fit a principle curve to model likely depth of quiescence (Q-depth). (G) Positioning of scRNA-seq profiles from the indicated cell clusters along the Q-depth curve. BPN control = cluster 1; BPN treated = cluster 2; BP control = cluster 4+5; BP treated = cluster 6+7. (H) Graph comparing absolute expression levels of Ccnd1 and Ccnd2, data obtained from RNA sequencing of whole tumors. (I) Quantitation of phospho-RB-positive tumor cells in the indicated tumor types at 8 weeks post-initiation. Control or MAPK-inhibitor chow feeding started at 6 weeks and was maintained for 2 weeks. Graphs represent mean ± S.D. Multiple lesions per mouse, for five mice in each cohort, were analyzed. ***p<0.001 by Student’s t-test. (J) Effect of knocking down CyclinD2 on MCM2 marker expression. A BPN organoid line was stably transduced with control or Ccnd2-targeting shRNA constructs followed by subcutaneous transplantation and MAPK-inhibitor chow treatment after 8 weeks of growth. Subcutaneous tumors were harvested after 1 month of drug treatment. MCM2 quantitation was confined to glandular structures that most closely resemble autochthonous BPN tumors. Graphs are mean ± S.D. ***p<0.001, **p<0.01 by Student’s t-test. N = 5 mice per cohort.
Figure 5—figure supplement 1
Differential impact of MAPK inhibitors on the cell cycle in NKX2-1-positive and NKX2-1-negative tumors.
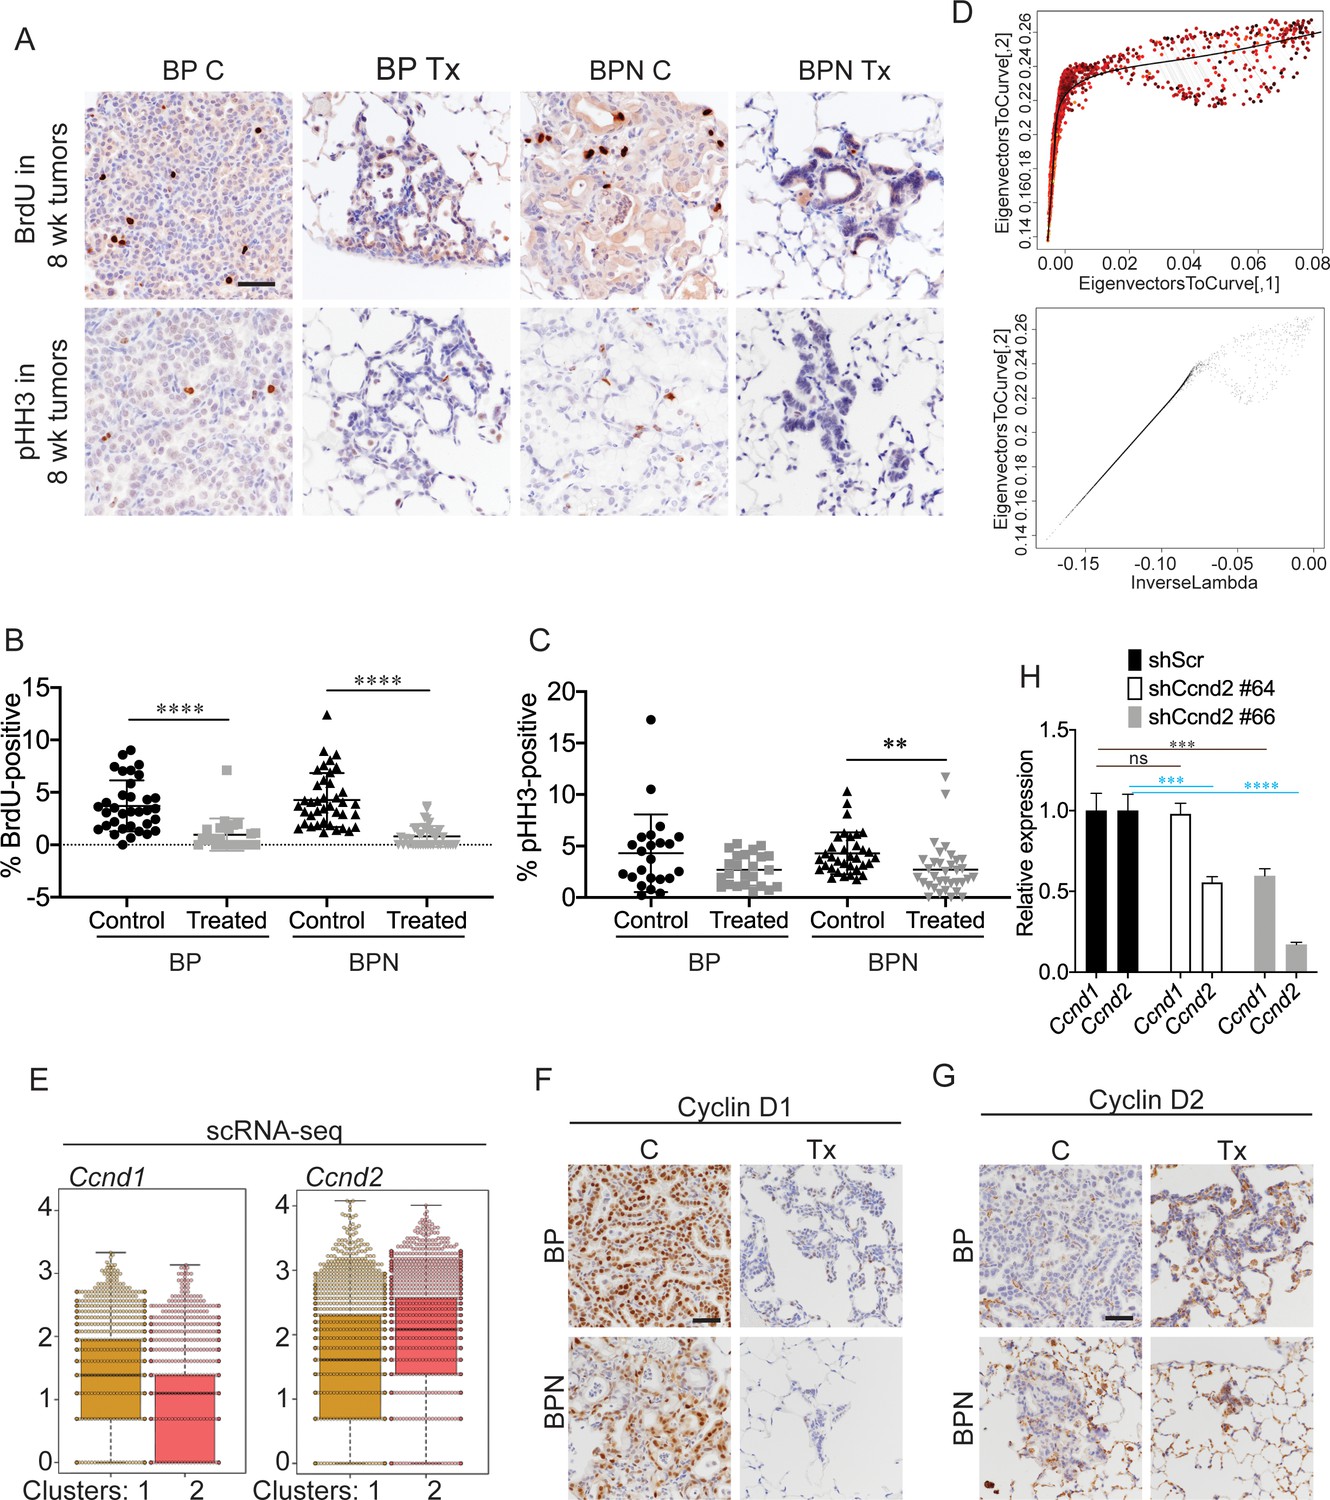
(A) Detection of proliferation markers, BrdU incorporation and phospho-histone H3 Ser10, by IHCs in neoplasia arising 8 weeks after tumor initiation with PGK-Cre lentivirus (5 × 10³ pfu/mouse). At the 6 week timepoint, BP and BPN mice were given control or PLX4720 plus PD0325901 inhibitor chow for 2 weeks. Scale bar: 100 µm. (B) Quantitation of BrdU-positive tumor cells from mice treated as in (A). Graphs represent mean ± S.D. BP C (34 tumors from three mice), BP Tx (23 tumors from three mice), BPN C (39 tumors from three mice), BPN Tx (40 tumors from three mice) were analyzed. ****p<0.0001 by Student’s t-test. (C) Quantitation of phospho-HH3-positive tumor cells from mice treated as in (A). Graphs represent mean ± S.D. BP C (23 tumors from two mice), BP Tx (24 tumors from two mice), BPN C (34 tumors from two mice), BPN Tx (34 tumors from two mice) were analyzed. **p=0.0058 by Student’s t-test. (D) Graphs showing how the trajectory for Q-depth was set. Top is a flattened version of the diffusion map based on arithmetic combination of the first three diffusion components with a principal curve to the resulting two dimensional graph and bottom plot is a pseudotime trajectory based on lambda values of the principal curve referred to here as Quiescence depth and shown on the x-axis. (E) Relative abundance of Ccnd1 and Ccnd2 transcripts in scRNA-seq data on a cell-by-cell basis for clusters 1 and 2. (F, G) Representative IHC images for Cyclin D1 and Cyclin D2 immunostaining on tumors from BP and BPN mice at 8 weeks post-initiation. Control or MAPK-inhibitor chow was administered for 2 weeks. Scale bar: 100 µm. (H) Efficiency of CyclinD2 knockdown by control versus Ccnd2-targeting short hairpins in stably transduced 988 organoids as assessed by qRT-PCR. ****p<0.0001, ***p<0.001, ns = not significant by Student’s t-test.
Figure 6 with 2 supplements
MAPK activity regulates cellular identity in NKX2-1-negative tumors.
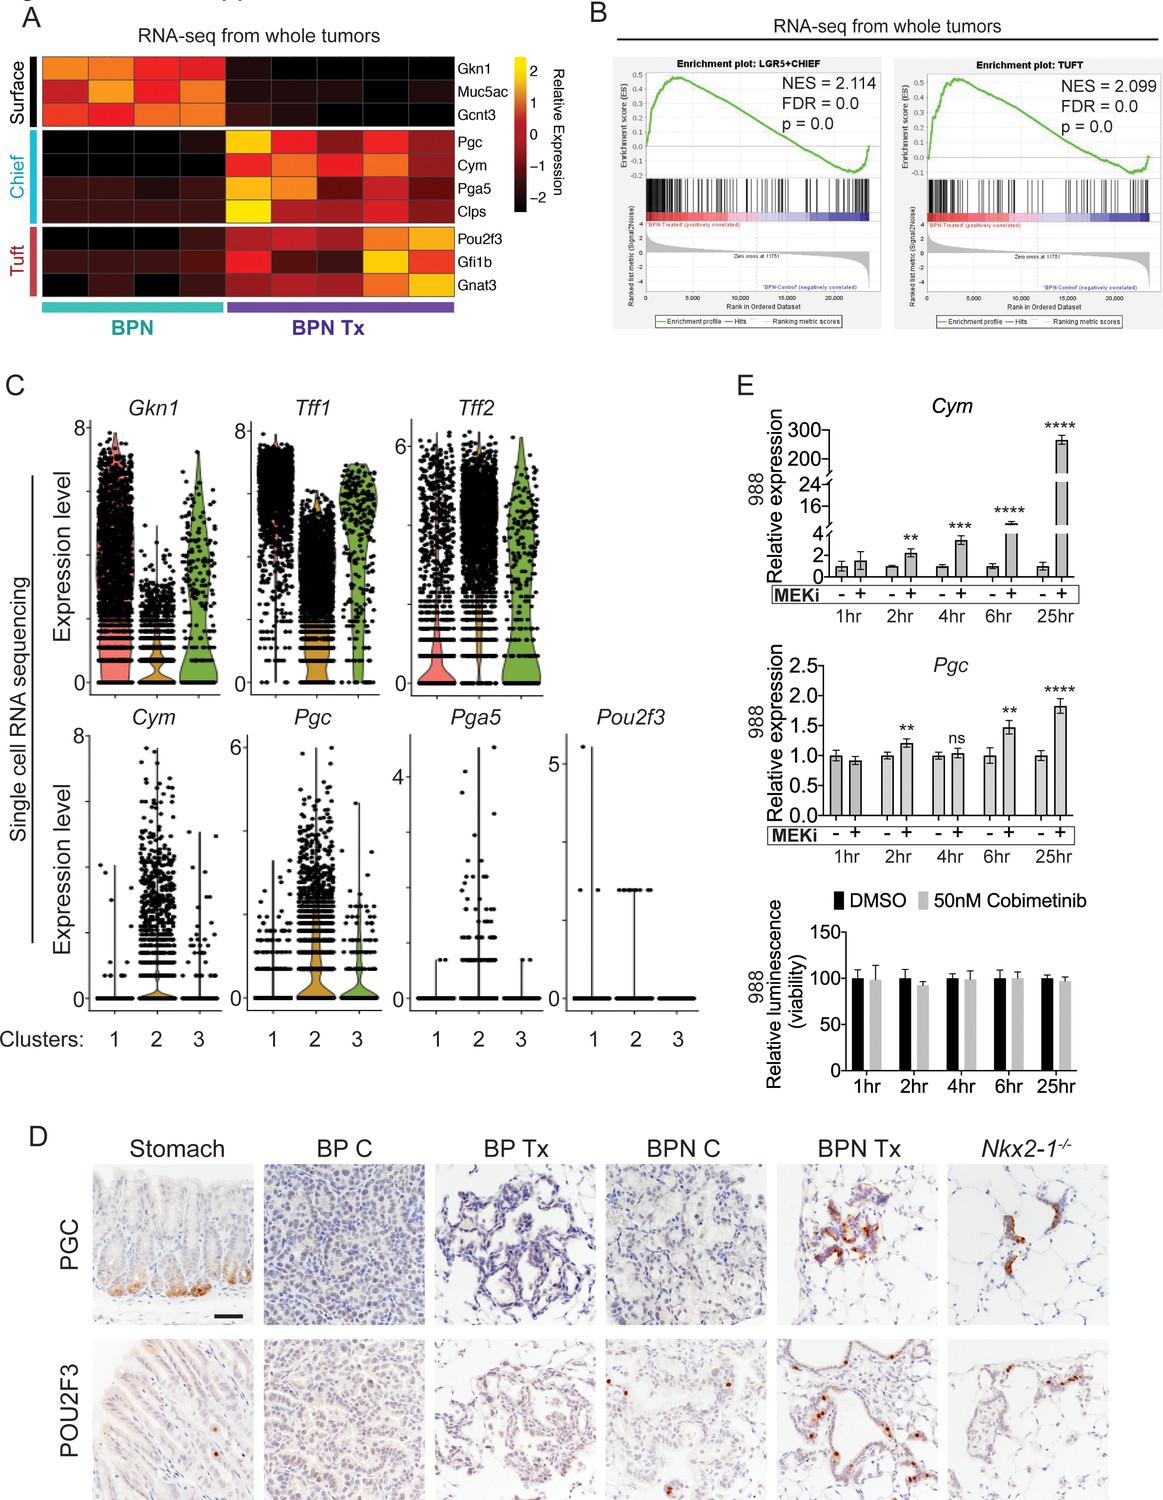
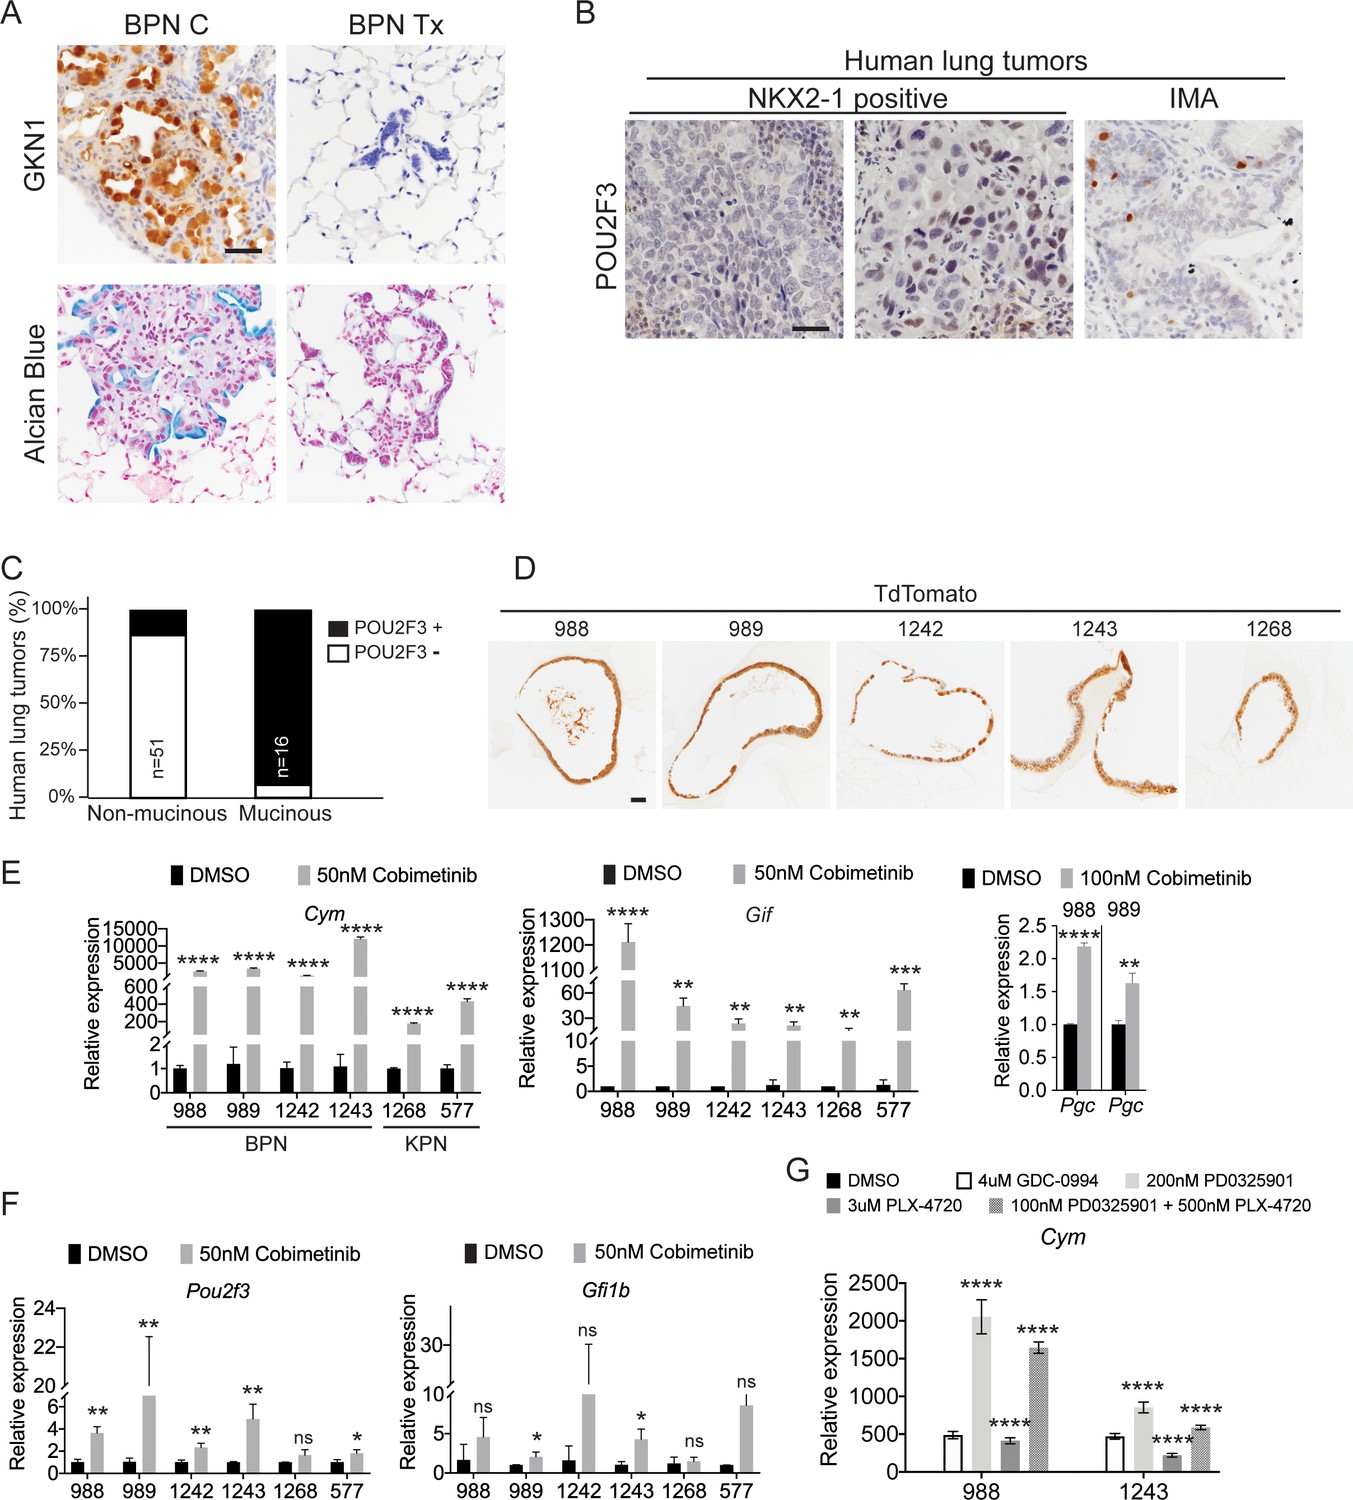
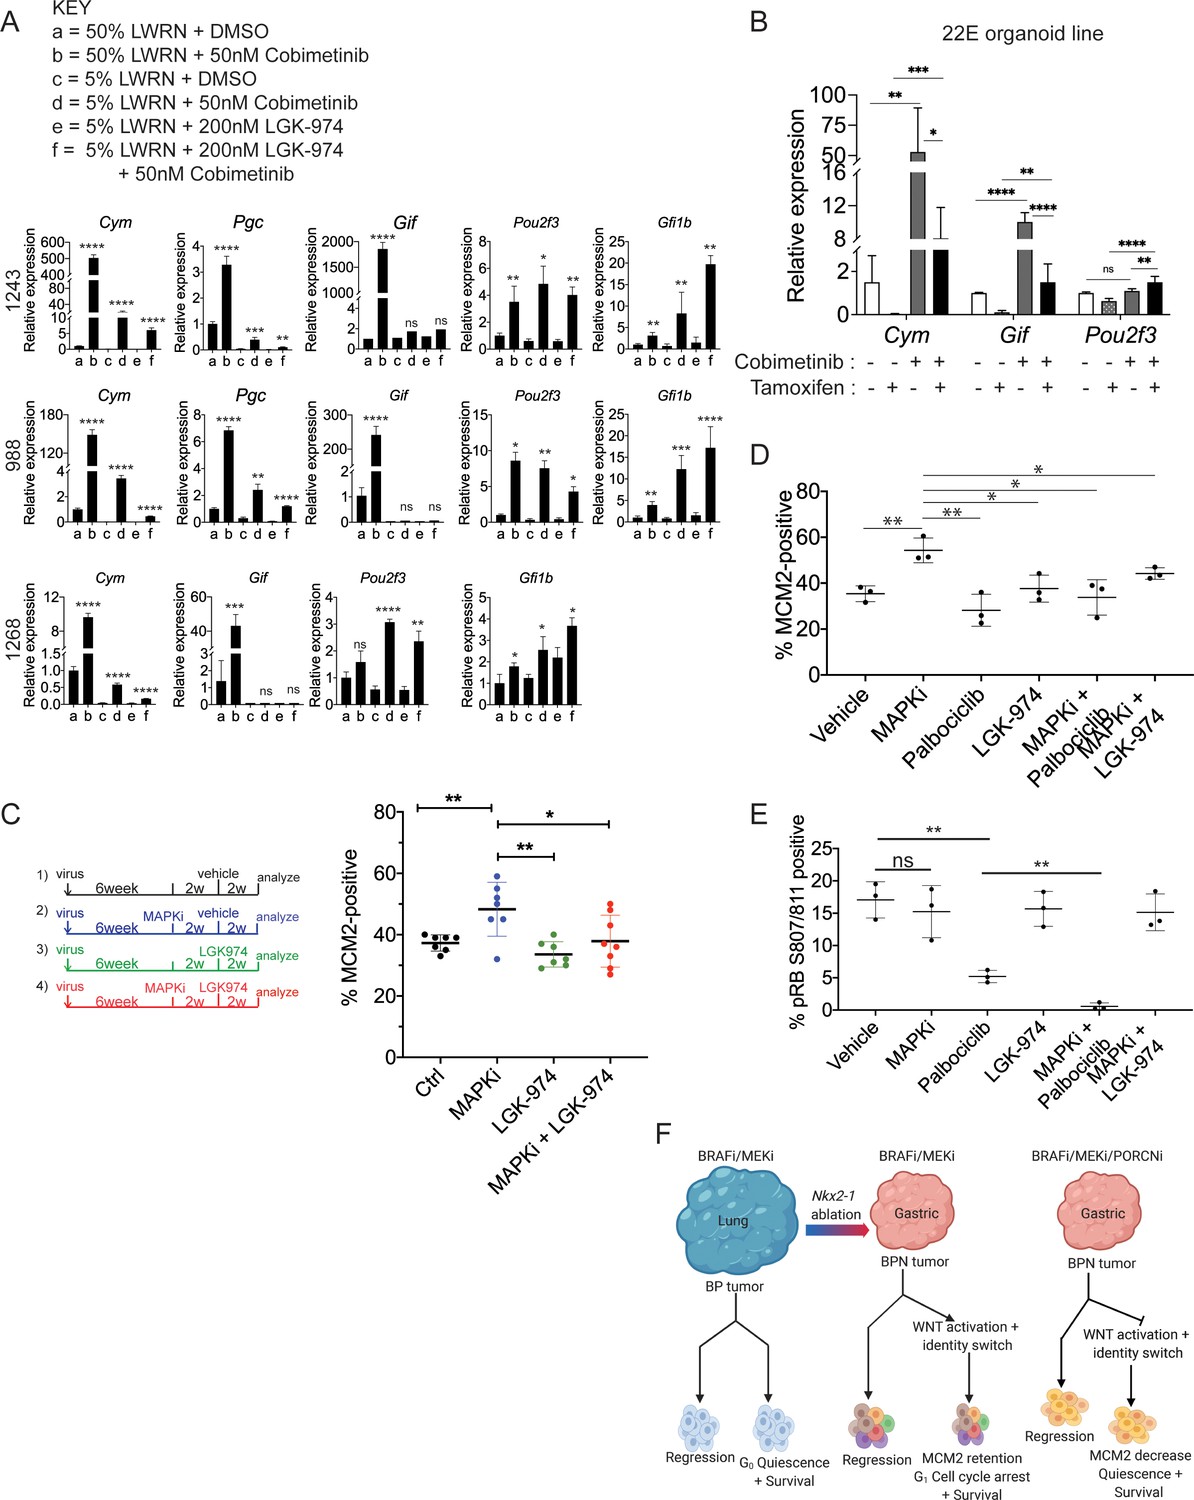
(A) Transcriptome analysis comparing control BPN cells with MAPKi-treated BPN tumor cells. Heatmap depicts gastric surface mucous cell markers whose expression diminished versus gastric chief cell or tuft cell markers whose expression increased in MAPK-inhibitor-treated BPN cells relative to untreated. adjP <0.05 for each comparison. RNA-seq data was derived from tdTomato-expressing tumor cells FACS-sorted from BPN mice. Six weeks after tumor initiation, mice were treated for 1 week with control chow (n = 4) or chow containing BRAFV600E inhibitor plus MEK inhibitor (n = 5). (B) GSEA against chief and tuft cell signatures. (C) Violin plots of single-cell sequencing data showing expression levels of Gkn1, Tff1, Tff2, Cym, Pgc, Pga5, and Pou2f3 transcripts in BPN tumor clusters 1–3 and highlighting key drug-mediated cell-identity changes. (D) IHC for a gastric chief cell marker (Pepsinogen C) and a tuft cell marker (POU2F3) on LUAD sections derived 7 weeks following tumor initiation with PGK-Cre lentivirus (5 × 10³ pfu/mouse). At 6 weeks, BrafLSL-V600E/+;Trp53f/f;Nkx2-1f/+;Rosa26LSL-tdTomato/LSL-tdTomato and BrafLSL-V600E/+;Trp53f/f;Nkx2-1f/f;Rosa26LSL-tdTomato/LSL-tdTomato mice were given control or MAPK-inhibitor chow for 1 week. Also shown are sections of normal stomach epithelium as positive controls. Note that in hyperplasia that arise from Nkx2-1 deletion in distal lung without concomitant oncogenic activation also upregulate these lineage-restricted markers. Nkx2-1f/f mice were infected with Ad5-Spc-Cre (109 pfu/mouse). Lungs were harvested 16 weeks later. Scale bar: 100 µm. (E) Chief cell markers are rapidly induced in tumor organoids treated with 50 nM Cobimetinib. qRT-PCR analysis of chief cell markers Cym and Pgc on RNA isolated from drug/DMSO-treated organoids for the indicated times. Data are mean ± S.D. ****p<0.0001, ***p<0.001, **p<0.01, ns = not significant by Student’s t-test. A representative experiment of three is shown. Bottom plot: Measurement of viability in organoid cultures treated with vehicle or Cobimetinib using 3D CellTiter-Glo Luminescent cell viability assay at the indicated timepoints. Data are mean ± S.D. A representative experiment of three is shown.
Figure 6—figure supplement 1
MAPK activity regulates cellular identity in NKX2-1-negative tumors.
(A) IHC for detection of the surface neck mucous marker, GKN1, and Alcian Blue staining in control BPNs and BPN tumors that were treated with drug chow for 2 weeks. Scale bar: 100 µm. (B) IHC for the tuft cell marker, POU2F3, in human non-mucinous lung adenocarcinoma and IMA tumors. Scale bar: 100 µm. (C) Percentage of NKX2-1-positive and NKX2-1-negative human lung adenocarcinomas that contain POU2F3-positive tumor cells. (D) Immunostaining for tdTomato on BPN and KPN organoid FFPE sections indicating that primary spheroid cultures contain only tumor-derived epithelial cells. (E-G) qRT-PCR determination of the expression levels of select stomach epithelium lineage markers in multiple lung tumor organoid lines. Spheroid cultures were established from BrafLSL-V600E/+;Trp53f/f;Nkx2-1f/f;Rosa26LSL-tdTomato/LSL-tdTomato mice (for BPN lines: 988, 989, 1242 and 1243), or for the KPN lines from KrasLSL-G12D/+;Trp53f/f;Nkx2-1f/f;Rosa26LSL-tdTomato/LSL-tdTomato mice (for 1268), and from tamoxifen-treated KrasFSF-G12D/+;Trp53frt/frt;Nkx2-1f/f;Rosa26FSF-CreERT2/FSF-CreERT2 mice (for 577). Spheroids were subsequently cultured long term in 50% L-WRN conditioned media. For experiments, organoids were seeded (day 0) and allowed to recover overnight in the absence of DMSO/inhibitors. In each case, data are presented as fold change (mean + S.D.) compared with DMSO control values. (E, F) RNA derived from indicated BPN and KPN organoid lines that had been treated with DMSO or Cobimetinib for 72 hr. (E) qRT-PCR for detection of markers of gastric gland base cell types. (F) qRT-PCR for detection of tuft cell-specific transcripts. Data shown for each marker are representative of least three independent experiments. (G) Chief cell marker, Cym, is significantly induced in organoids treated with additional MAPK-pathway inhibitors for 24 hr: GDC-0994 (ERKi), PD0325901 (MEKi), and PLX4720 (BRAFi). Data is representative of three independent experiments. (E–G) ****p<0.0001, ***p<0.001, **p<0.01, *p<0.05, ns = not significant by Student’s t-test.
Figure 6—figure supplement 2
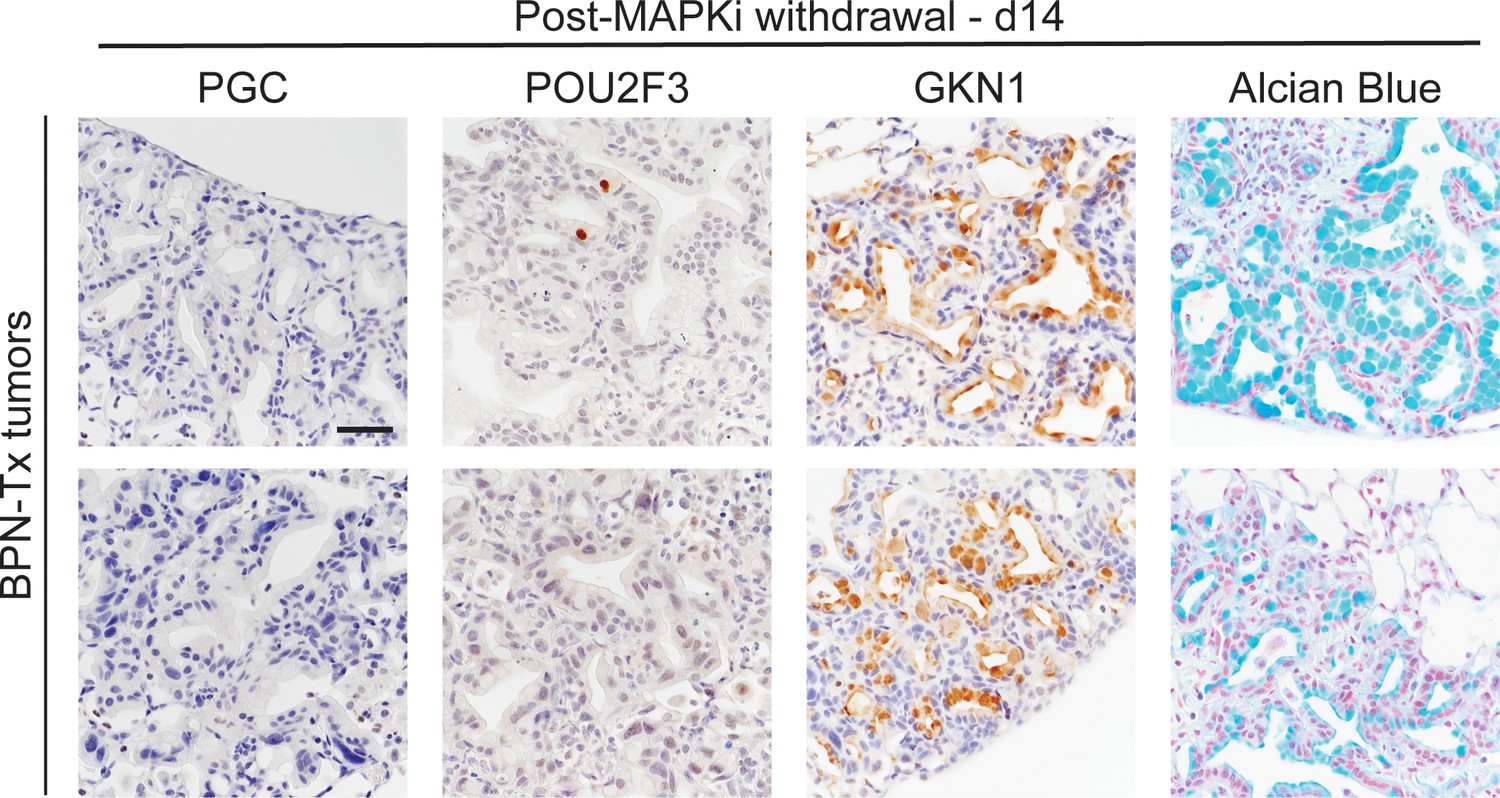
Durability of BRAF/MEK inhibitor-induced cell identity changes in NKX2-1-negative tumors.
IHC for indicated markers, plus Alcian Blue staining, on BPN tumors from mice treated with BRAF/MEK inhibitor chow for 1 month. Tumors were harvested 2 weeks after drug cessation. Scale bar: 100 µm.
Figure 7 with 2 supplements
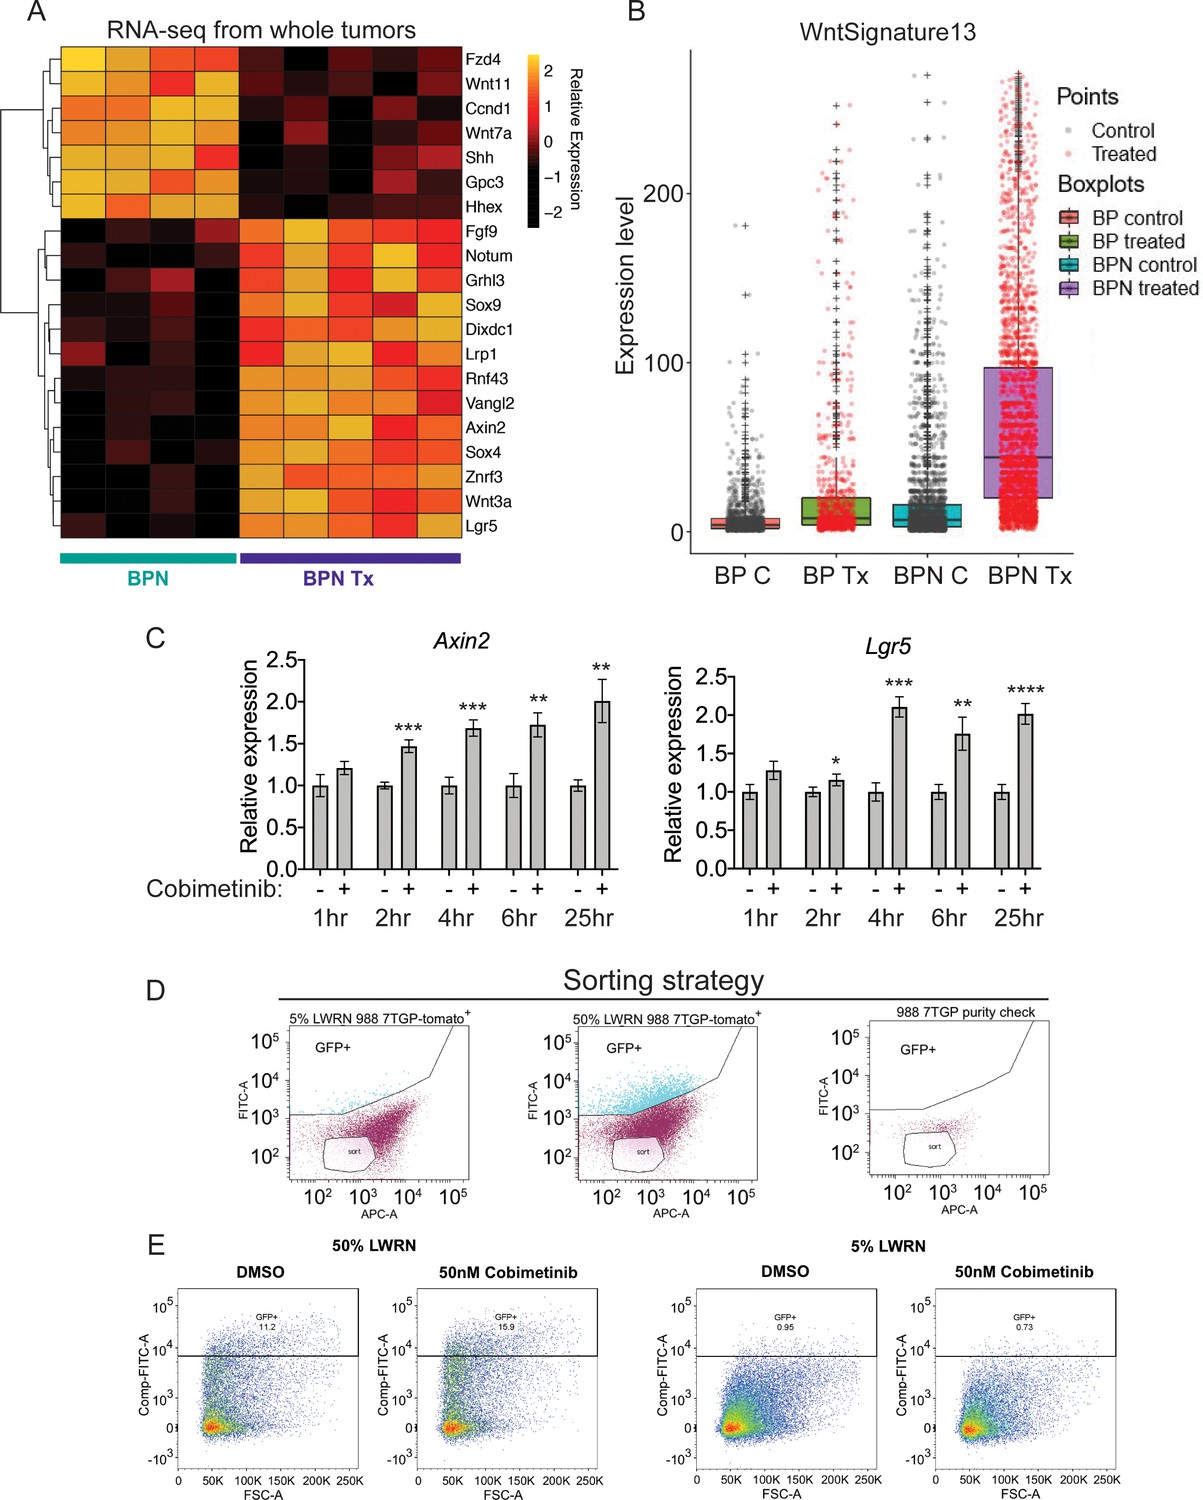
MAPK inhibition activates WNT signaling in NKX2-1-negative tumors.
(A) Transcriptome analysis of genes comprising the canonical WNT pathway gene ontology (AmiGO) in RNA purified from FACS-sorted BPN tumor cells 1 week post- treatment with PLX4720+PD0325901 or control chow. adjP <0.05 for each comparison. Color key indicates normalized expression levels (Log10). (B) Analysis of WNT pathway activity in scRNA-seq data using a WNT activation signature. BP indicates cells from clusters 4–8; BPN indicates cells from clusters 1–3 (see Figure 4E, F). C : control, Tx = drug treatment. (C) Kinetics of WNT signaling induction following MAPK-inhibitor treatment as indicated by qRT-PCR analysis of the canonical WNT signaling markers, Axin2 and Lgr5, on RNA isolated from drug/DMSO treated organoids for the indicated times. Data are mean ± S.D. A representative experiment of three is shown. ****p<0.0001, ***p<0.001, **p<0.01, *p<0.05 by Student’s t-test. (D, E) WNT-low cells can give rise to WNT-high cells. BPN organoid lines, 988 shown here, were stably transduced with a WNT-reporter construct (7TGP, Addgene Plasmid #24305) and FACS-sorted to isolate cells with undetectable WNT activity (pink gate) (D). (E) Dynamics of sorted WNT-low cells when cultured in WNT rich spheroid media (50% LWRN vs. 5% LWRN) or in the presence of MEK-inhibitor. Numbers shown are the percentage of live tdTomato+GFP+ cells in each culture as quantified by flow cytometry (FlowJo). Data shown is a representative of two independent sorting experiments.
Figure 7—figure supplement 1
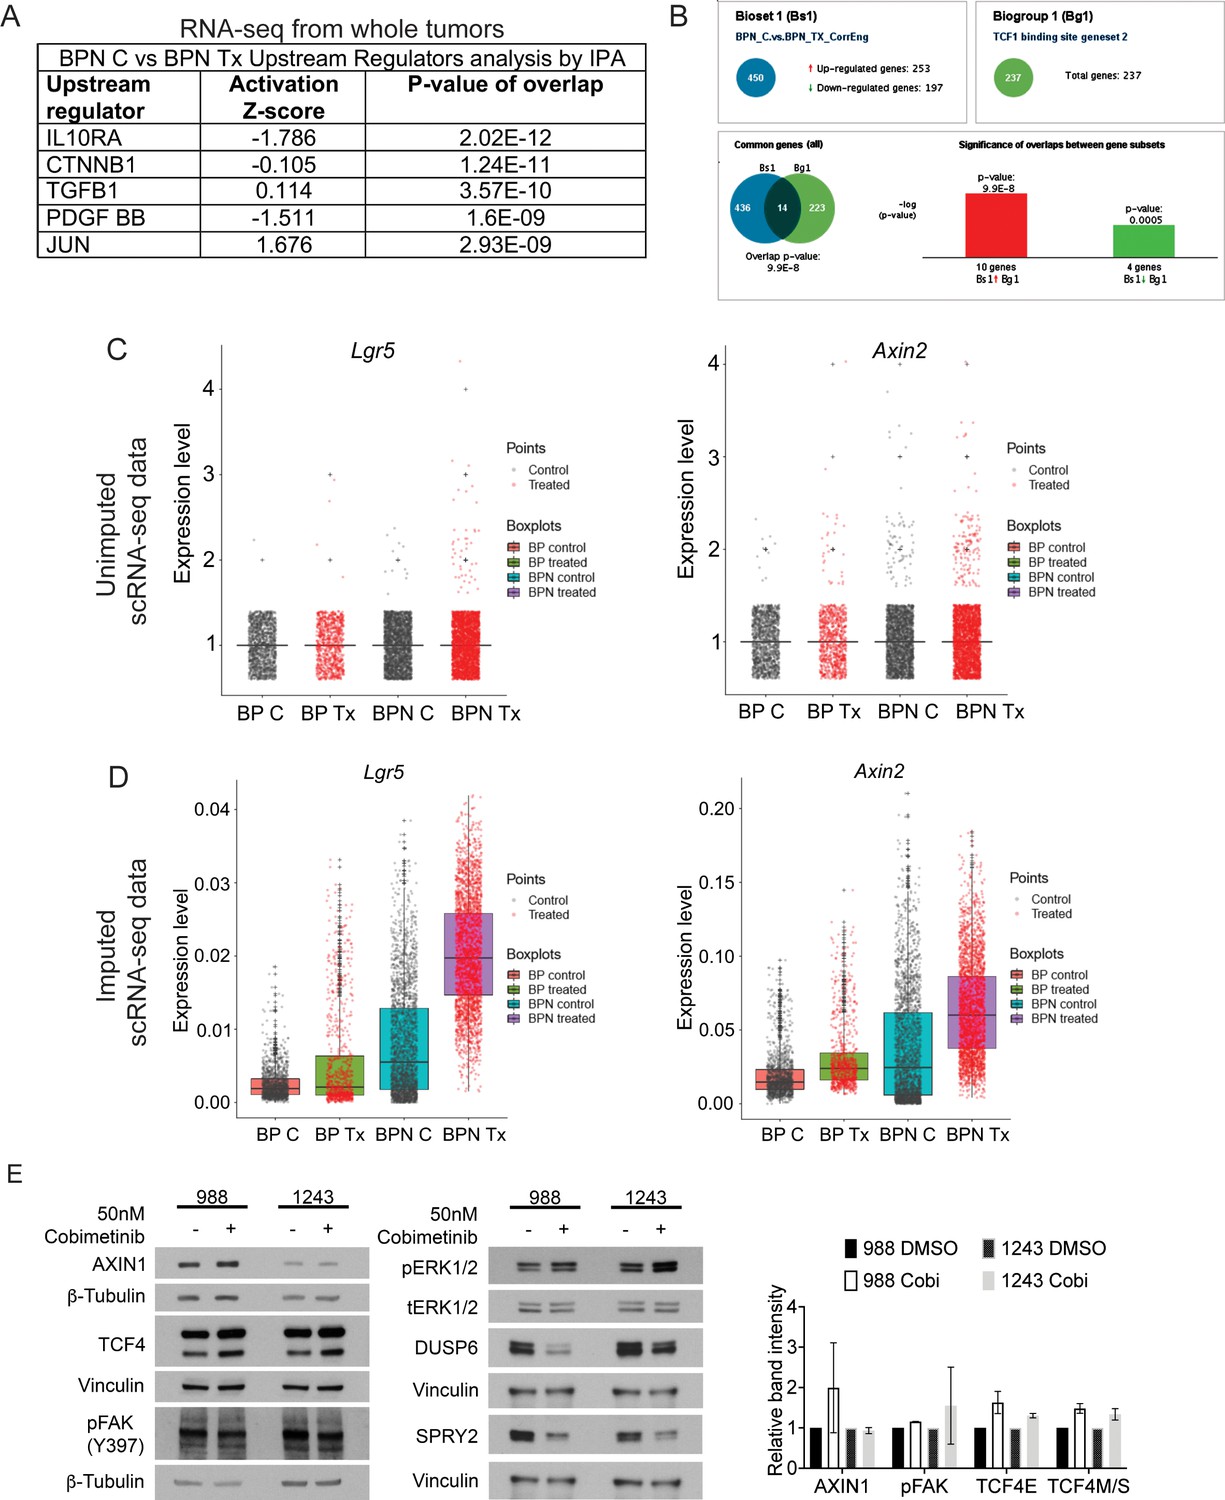
MAPK inhibition activates WNT signaling in NKX2-1-negative tumors.
(A) List of the top-scoring genes in IPA Upstream Regulator analysis when comparing differentially expressed genes between control- and BRAFi/MEKi-chow treated BPN tumors in whole-tumor RNA sequencing data. (B) Regulator Motif analysis by Illumina Correlation Engine identifies significant differences in TCF1 binding site genesets between control and treated BPN tumors. (C, D) Plots of normalized raw and imputed expression values for Lgr5 and Axin2 transcripts in scRNA-seq data as readouts of canonical WNT activation levels in indicated clusters. (E) Candidate mechanisms by which a cross-talk between ERK and WNT pathways can occur as evaluated by immunoblotting. Representative western blot image and quantitation of band intensity (ImageJ) from two independent experiments is provided. None of the changes in protein abundance between control and drug-treated (24 hr) organoid samples are statistically significant. Graphs indicate mean ± S.D.
Figure 7—figure supplement 2
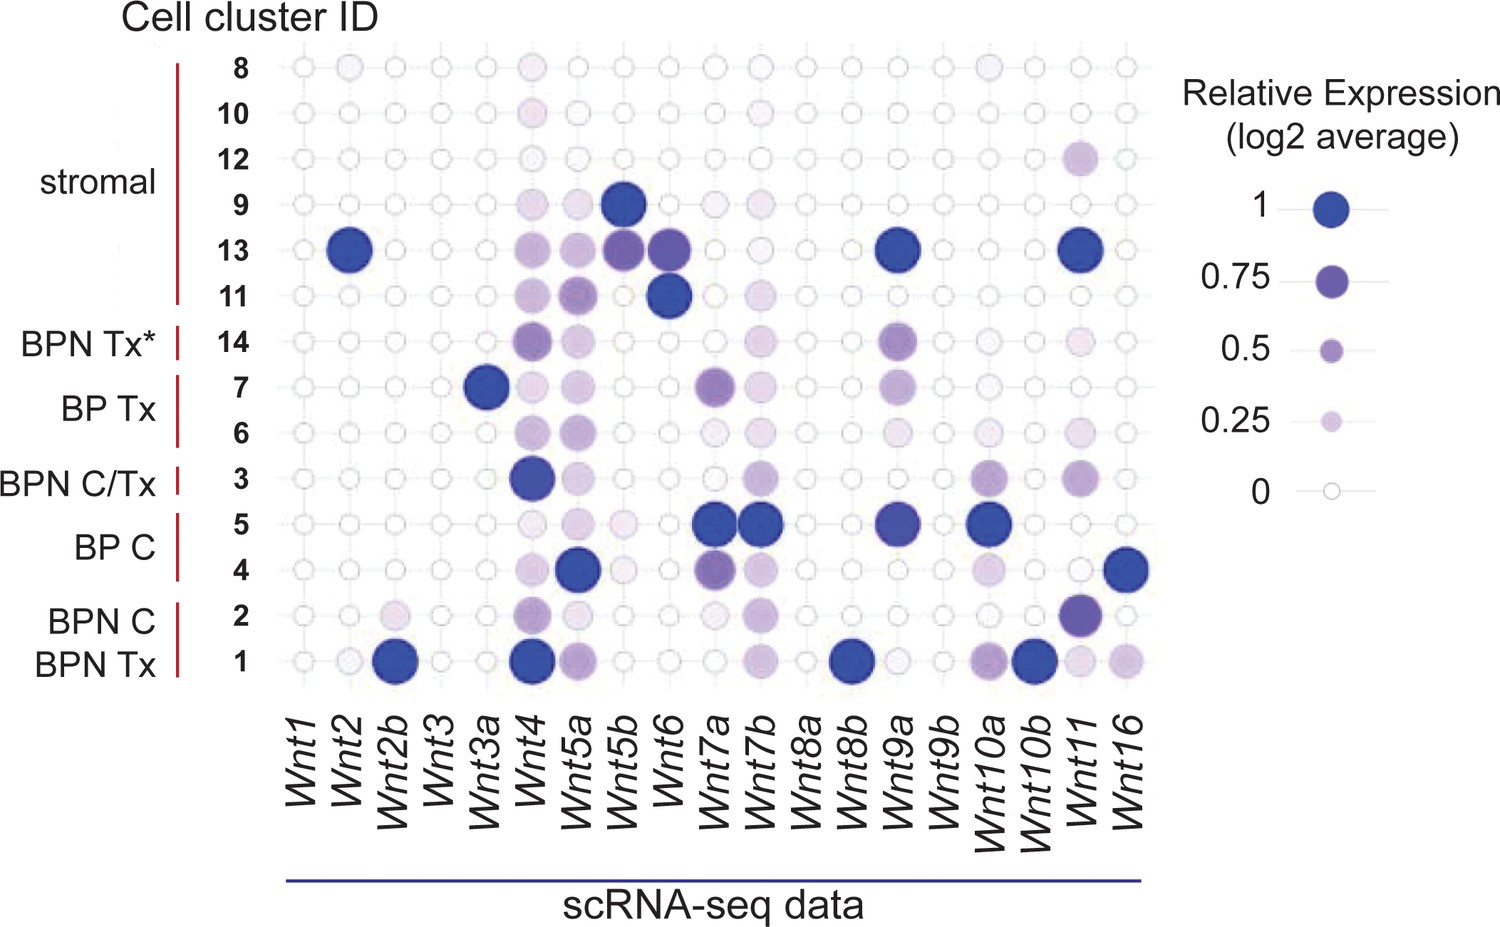
Multiple sources for WNT ligands in BRAFV600E-driven lung adenocarcinoma.
Relative expression values for all Wnt genes in tumor and stromal cells from BP and BPN tumors profiled by scRNA-seq. Values were derived as follows: first, raw gene expression values in each cluster were logged. Then, the average value of each cluster was divided by the maximum value to calculate relative expression. Cluster ID labels correspond to nomenclature used in Figure 4—figure supplement 1E.
Figure 8 with 2 supplements
WNT signaling and the transcription factors FoxA1/FoxA2 are partially required for lineage switching induced by MAPK inhibition.
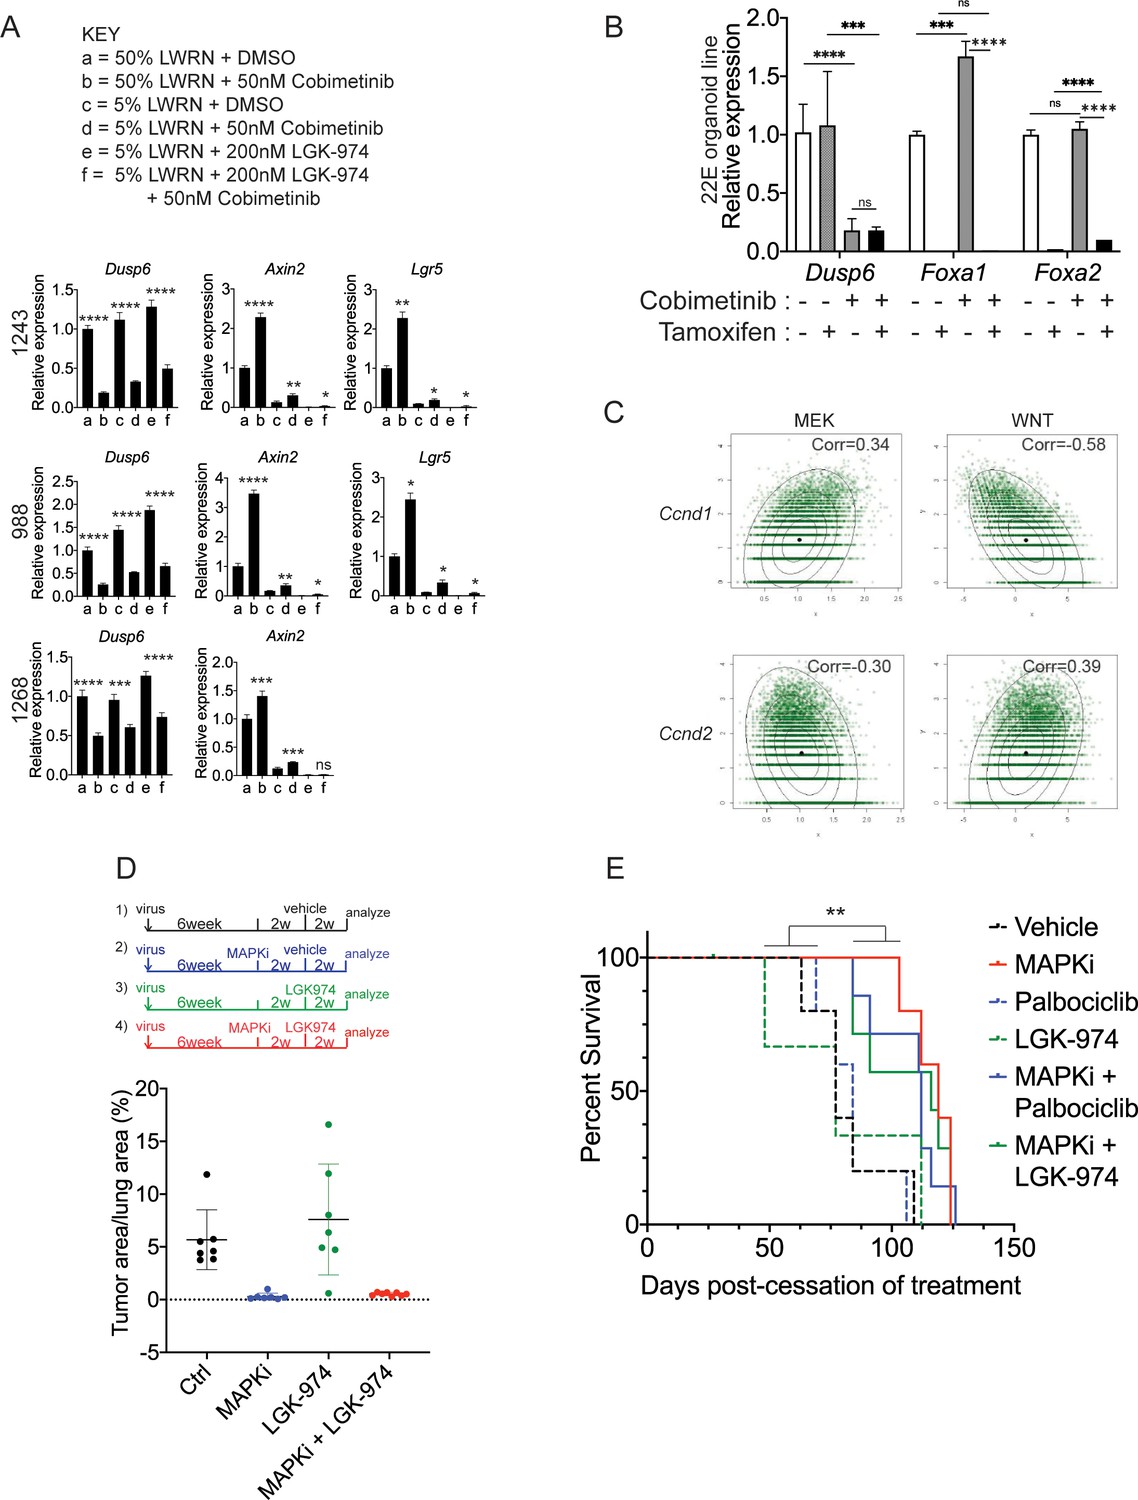
(A) Analyses of indicated gene expression levels in BPN (1243 and 988) and KPN (1268) tumor organoid lines by qRT-PCR at 24 hr and under different treatment conditions. Organoids were cultured in 50% L-WRN (a, b) or reduced 5% L-WRN media (c, d, e, f) and treated with DMSO (a, c), single agent Cobimetinib (b, d) or the Porcupine inhibitor, LGK-974 (e), and both inhibitors (f). Graphs indicate mean ± S.D. [p values are for a-b; c-d; or e-f comparisons]. Experiment was reproducibly performed three times. (B) qRT-PCR analysis of the expression levels of indicated cell identity markers in the 22E organoid line under four different conditions. 22E (derived from a lung tumor in a KrasFSF-G12D/+;Trp53frt/fr+;Foxa1f/f; Foxa2f/f;Rosa26FSF-CreERT2/FSF-CreERT2 mouse) lacks NKX2-1 expression and harbors conditional alleles of Foxa1 and Foxa2. Tamoxifen treatment induces CreERT2-mediated Foxa1/Foxa2 deletion. Data are mean ± S.D and a pool of two independent experiments. (C) Quantitation of the proliferation marker MCM2 in 10 week autochthonous BPN lung tumors under four different treatment conditions: (1) control (n = 7); (2) MAPK-inhibitor chow (n = 7); (3) LGK-974 (n = 7); and (4) MAPK-inhibitor chow and LGK-974 (n = 8). (D, E) Abundance of MCM2 or phospho-RB-positive cells in 10-week autochthonous lung tumors from BPN mice under the indicated conditions. Vehicle or drug treatments were administered at 6 weeks post tumor initiation for 4 weeks. Multiple tumors from n = 3 mice/group were quantitated. (A – E) ****p<0.0001, ***p<0.001, **p<0.01, *p<0.05, ns = not significant by Student’s t-test. (F) Graphical depiction of the molecular and pharmacological regulation of differentiation programs in LUAD (BioRender). Here, we investigated genotype-specific drug response. Cancer therapy triggers two alternative fates in drug-treated tumors of both genotypes: either regression or survival in a drug tolerant state. Molecularly, the drug tolerant state appears distinct in BP versus BPN tumors and can be exploited pharmacologically by targeting the cell cycle and/or drug-induced signaling pathways.
Figure 8—figure supplement 1
WNT signaling and the transcription factors FoxA1/FoxA2 are partially required for lineage switching induced by MAPK inhibition.
(A) Analyses of indicated gene expression levels in BPN (1243 and 988) and KPN (1268) tumor organoid lines by qRT-PCR at 24 hr and under different treatment conditions. Organoids were cultured in 50% L-WRN (a, b) or reduced 5% L-WRN media (c, d, e, f) and treated with DMSO (a, c), single agent Cobimetinib (b, d) or the Porcupine inhibitor, LGK-974 (e), and both inhibitors (f). Graphs indicate mean±S.D. ****p<0.0001, ***p<0.001, **p<0.01, *p<0.05, ns = not significant by Student’s t-test. [p values are for a-b; c-d; or e-f comparisons]. Experiment was reproducibly performed three times. (B) qRT-PCR analysis of indicated gene expression in 22E organoid line under MEK inhibition (Cobimetinib) and/or tamoxifen induced Foxa1 and Foxa2 deletion. Data are mean ± S.D and a representative of two independent experiments. ****p<0.0001, ***p<0.001, ns = not significant by Student’s t-test. (C) Density plots and correlation values for a MEK activation signature (x-axis left two panels) and a WNT signature (x-axis right two panels) versus Ccnd1 and Ccnd2 transcript levels as indicated based on scRNA-seq. (D) Quantitation of lung tumor burden 10 weeks post-initiation in BPN mice under four different treatment conditions: (1) control (n = 7); (2) MAPK-inhibitor chow (n = 7); (3) LGK-974 (n = 7); and (4) MAPK-inhibitor chow and LGK-974 (n = 8). (E) Overall survival of BPN tumor bearing mice that were enrolled in six different treatment conditions for 4 weeks. Vehicle (n = 5), MAPK-inhibitor chow (n = 5), Palbociclib (n = 5), LGK-974 (n = 4); MAPK-inhibitor chow + Palbociclib (n = 7), and MAPK-inhibitor chow + LGK-974 (n = 7). **p=0.0017 by Log-rank test.
Figure 8—figure supplement 2
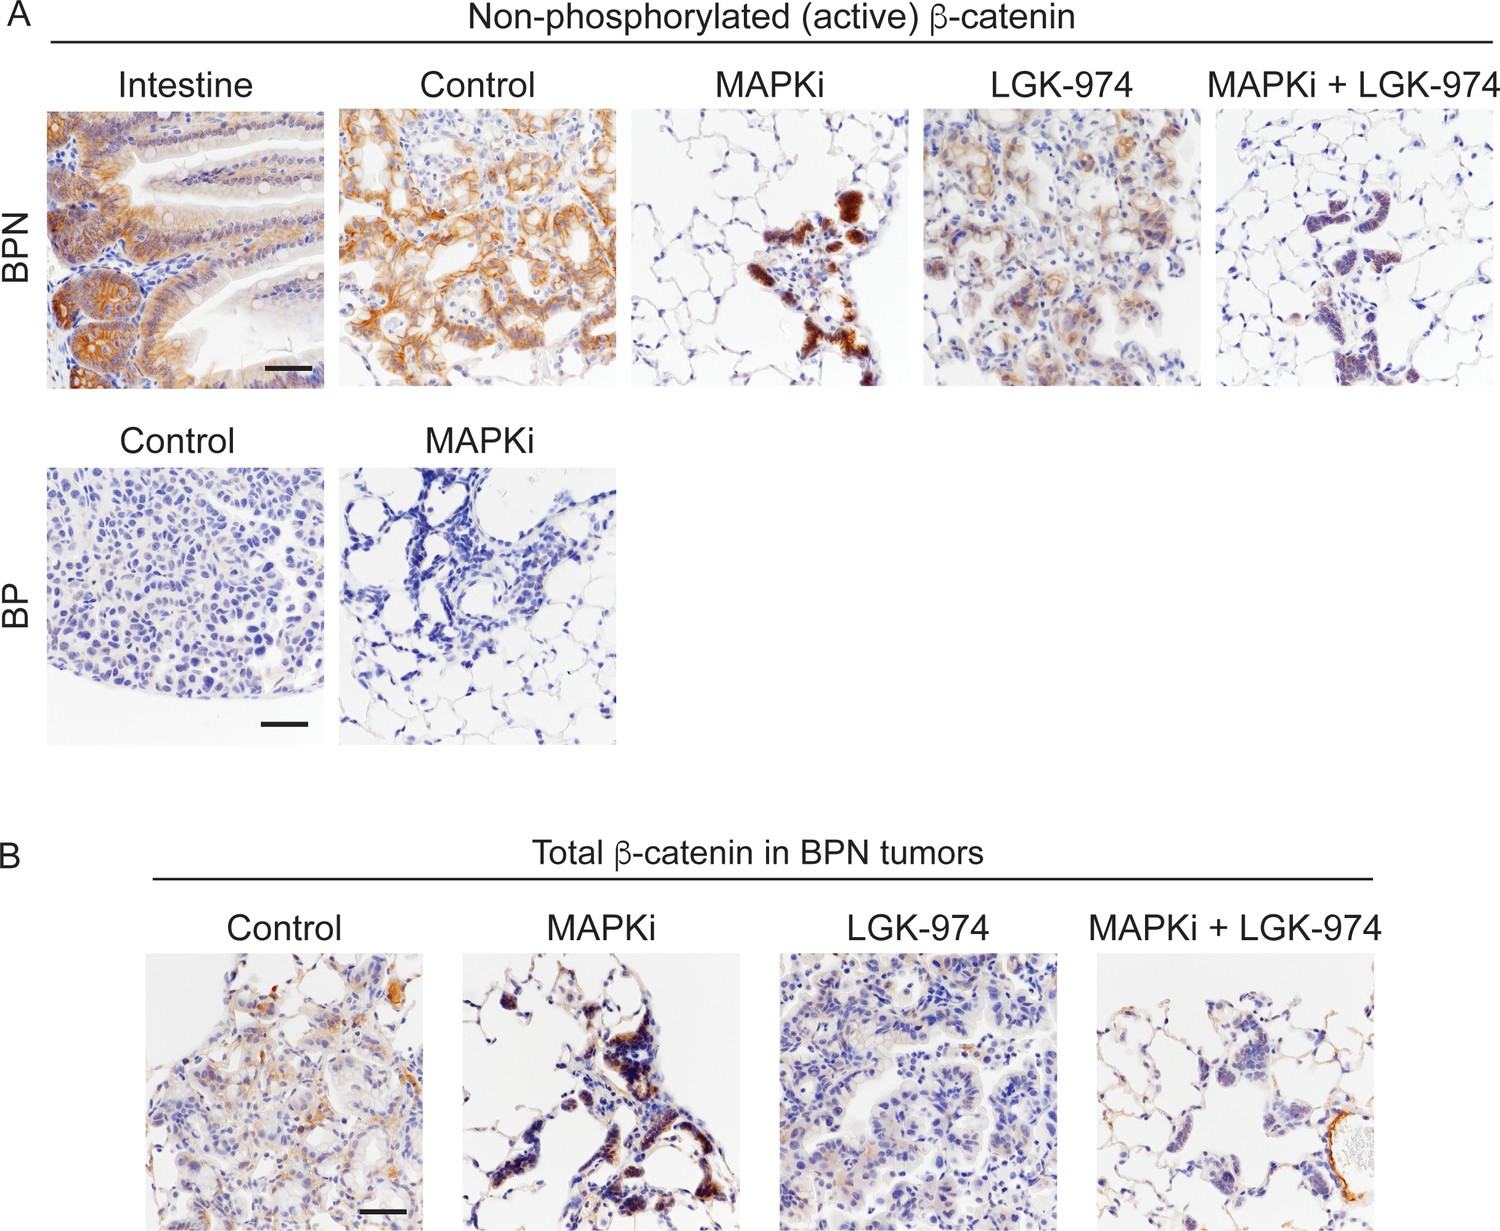
Characterization of MAPK inhibitor-driven signaling changes.
(A, B) Active (unphosphorylated on T41, S37, S33 residues) and total β-catenin staining in tumors under indicated treatment conditions. For BPN tumors, see Figure 8C for experimental details. BP tumors are 8-week autochthonous lung tumors from mice that received control or MAPK-inhibitor chow for 2 weeks (See Figure 1A for more experimental details). Small intestine: positive control for detection of active β-catenin. Scale bar: 100 µm.
Tables
Key resources table
| Reagent type (species) or resource | Designation | Source or reference | Identifiers | Additional information |
|---|---|---|---|---|
| Genetic reagent (Mus musculus) | BrafLSL-V600E/+ | Dankort et al., 2007 PMID:17299132 | MGI:3711771 | Dr. Martin McMahon (HCI, Salt Lake City, Utah); mixed C57BL/6J × 129SvJ background |
| Genetic reagent (Mus musculus) | BrafFSF-V600E/+ | Shai et al., 2015 PMID:26001956 | Dr. Martin McMahon (HCI, Salt Lake City, Utah); mixed C57BL/6J × 129SvJ background | |
| Genetic reagent (Mus musculus) | Trp53f/f | Jonkers et al., 2001 PMID:11694875 | MGI:1931011 | Dr. Anton Berns, University of Amsterdam; Jackson Laboratories (Bar Harbor, Maine); mixed C57BL/6J × 129SvJ background |
| Genetic reagent (Mus musculus) | Trp53frt/frt | Lee et al., 2012 PMID:22228755 | MGI:5306612 | Dr. David G Kirsch (Duke University Medical Center, Durham, North Carolina); mixed C57BL/6J × 129SvJ background |
| Genetic reagent (Mus musculus) | KrasLSL-G12D/+ | Jackson et al., 2001 PMID:11751630 | MGI:2429948 | Dr. Tyler Jacks (MIT, Cambridge, Massachusetts); mixed C57BL/6J × 129SvJ background |
| Genetic reagent (Mus musculus) | KrasFSF-G12D/+ | Young et al., 2011 PMID:21512139 | MGI:5007794 | Dr. Tyler Jacks (MIT, Cambridge, Massachusetts); mixed C57BL/6J × 129SvJ background |
| Genetic reagent (Mus musculus) | Nkx2-1f/f | Kusakabe et al., 2006 PMID:16601074 | MGI: 3653706 | Dr. Shioko Kimura (NCI, NIH, Bethseda, Maryland); mixed C57BL/6J × 129SvJ background |
| Genetic reagent (Mus musculus) | Rosa26LSL-tdTomato Ai14 | Madisen et al., 2010 PMID:20023653 | MGI: 4436847 | Jackson Laboratories (Bar Harbor, Maine); mixed C57BL/6J × 129SvJ background |
| Genetic reagent (Mus musculus) | Rosa26FSF-CreERT2 | Schönhuber et al., 2014 PMID:25326799 | MGI: 5616874 | Dr. Dieter Saur (Technische Universitat Munchen, Munchen, Germany); mixed C57BL/6J × 129SvJ background |
| Genetic reagent (Mus musculus) | Foxa1f/f | Gao et al., 2008 PMID:19141476 | MGI: 3831163 | Dr. Klaus H. Kaestner (Univ. of Pennsylvania School of Medicine, Philadelphia, PA); mixed C57BL/6J × 129SvJ background |
| Genetic reagent (Mus musculus) | Foxa2f/f | Sund et al., 2000 PMID:10866673 | MGI: 2177357 | Dr. Klaus H. Kaestner (Univ. of Pennsylvania School of Medicine, Philadelphia, PA); mixed C57BL/6J × 129SvJ background |
| Genetic reagent (Mus musculus) | NOD/SCID-gamma chain deficient (NSG) | The Jackson Laboratory | 005557 | |
| Cell line (Homo sapiens) | 293T | DuPage et al., 2009 PMID:19561589 | ||
| Cell line (Mus musculus) | L-WRN | ATCC | CRL-3276 | |
| Recombinant DNA reagent | d8.9 (plasmid) | DuPage et al., 2009 PMID:19561589 | ||
| Recombinant DNA reagent | VSV-G (plasmid) | DuPage et al., 2009 PMID:19561589 | ||
| Recombinant DNA reagent | 7TGP (plasmid) | Addgene | 24305 | |
| Chemical compound, drug | Tamoxifen | Sigma Aldrich | T5648 | |
| Chemical compound, drug | Tamoxifen supplemented chow | Envigo | TD.130858 | |
| Chemical compound, drug | PLX4720 supplemented chow | Plexxikon/ Research Diets | Tsai et al., 2008 | |
| Chemical compound, drug | PD0325901 supplemented chow | Plexxikon/ Research Diets | Trejo et al., 2012 | |
| Chemical compound, drug | PLX4720 | Selleckchem | S1152 | |
| Chemical compound, drug | PD0325901 | Selleckchem | S1036 | |
| Chemical compound, drug | GDC-0994 | Genentech | Blake et al., 2016 | |
| Chemical compound, drug | Cobimetinib GDC-0973 | Genentech | ||
| Chemical compound, drug | Palbociclib | LC Laboratories | P-7744 | |
| Chemical compound, drug | LGK-974 | Selleckchem | S7143 | |
| Antibody | Anti-NKX2-1 (Rabbit monoclonal) | Abcam | Cat# ab76013 | (1:2000) |
| Antibody | Anti-DUSP6 (Rabbit monoclonal) | Abcam | Cat# ab76310 | (1:500) |
| Antibody | Anti-SPRY2 (Rabbit monoclonal) | Abcam | Cat# ab180527 | (1:1000) |
| Antibody | Anti-pERK (Rabbit monoclonal) | Cell Signaling Technology | Cat# 4370 | (1:500) |
| Antibody | Anti-ERK (Mouse monoclonal) | Cell Signaling Technology | Cat# 4696 | (1:2000) |
| Antibody | Anti-pRSK S380 (Rabbit monoclonal) | Cell Signaling Technology | Cat# 11989 | (1:300) |
| Antibody | Anti-p4EBP1 (Rabbit monoclonal) | Cell Signaling Technology | Cat# 2855 | (1:400) |
| Antibody | Anti-pS6 S235/236 (Rabbit monoclonal) | Cell Signaling Technology | Cat# 4858 | (1:400) |
| Antibody | Anti-pS6 S240/244 (Rabbit monoclonal) | Cell Signaling Technology | Cat# 5364 | (1:1000) |
| Antibody | Anti-pMEK S221 (Rabbit monoclonal) | Cell Signaling Technology | Cat# 2338 | (1:100) |
| Antibody | Anti-PGC (Rabbit polyclonal) | Cell Signaling Technology | Cat# HPA031718 | (1:100) |
| Antibody | Anti-POU2F3 (Rabbit polyclonal) | Cell Signaling Technology | Cat# HPA019652 | (1:200) |
| Antibody | Anti-pRB S807/S811 (Rabbit polyclonal) | Cell Signaling Technology | Cat# 8516 | (1:800) |
| Antibody | Anti-CD36 (Rat monoclonal) | R and D Systems | Cat# MAB25191 | (1:300) |
| Antibody | Anti-proSPB (Rabbit polyclonal) | Millipore | Cat# AB3430 | (1:3000) |
| Antibody | Anti-proSPC (Rabbit polyclonal) | Millipore | Cat# AB3786 | (1:4000) |
| Antibody | Anti-Gastrokine 1 (Mouse monoclonal) | Abnova | Cat# H00056287-M01 | (1:50) |
| Antibody | Anti-Muc5AC (Mouse monoclonal) | Abnova | Cat# MAB13117 | (1:100) |
| Antibody | Anti-Histone H3 phospho-Ser10 (Rabbit polyclonal) | Abcam | Cat# ab5176 | (1:200) |
| Antibody | Anti-HNF4A (Rabbit monoclonal) | Cell Signaling Technology | Cat# 3113 | (1:400) |
| Antibody | Anti-MCM2 (Rabbit monoclonal) | Abcam | Cat# ab108935 | (1:5000) |
| Antibody | Anti-PDX1 (Mouse monoclonal) | DSHB | Cat# F109-D12 | (1:20) |
| Antibody | Anti-RFP (Rabbit polyclonal) | Rockland Immunochemicals | Cat# 600-401-379 | (1:1200) |
| Antibody | Anti-β-catenin (Mouse monoclonal) | BD Biosciences | Cat# 610153 | (1:200) |
| Antibody | Anti-Non-phospho β-catenin (Rabbit monoclonal) | Cell Signaling Technology | Cat# 8814 | (1:1600) |
| Antibody | Anti-Vinculin (Rabbit monoclonal) | Abcam | Cat# ab129002 | (1:20,000) |
| Antibody | Anti-β-tubulin (Mouse monoclonal) | DSHB | Cat# E7 | (1:15,000) |
| Antibody | Anti-Axin1 (Rabbit monoclonal) | Cell Signaling Technology | Cat# 2087 | (1:1000) |
| Antibody | Anti-TCF4 (Rabbit monoclonal) | Cell Signaling Technology | Cat# 2569 | (1:1000) |
| Antibody | Anti-pFAK Y397 (Rabbit polyclonal) | Sigma Aldrich | Cat# SAB4504403 | (1:1000) |
| Antibody | Anti-Galectin 4 (Goat polyclonal) | R and D Systems | Cat# AF2128 | (1:200) |
| Antibody | Anti-Cathepsin E (Rabbit polyclonal) | Lifespan Biosciences | Cat# LSB523 | (1:12,000) |
| Antibody | Anti-BrdU (Rat monoclonal) | Abcam | Cat# ab6326 | (1:400) |
| Antibody | Anti-CyclinD1 (Rabbit monoclonal) | Abcam | Cat# ab137875 | (1:100) |
| Antibody | Anti-CyclinD2 (Mouse monoclonal) | NeoMarkers | Cat# MS-213-P1ABX | (1:500) |
| Other | PGK-Cre | DuPage et al., 2009 PMID:19561589 | Lentivirus | |
| Other | Ad5CMVFlpo | Gene Transfer Vector Core, University of Iowa, IA | VVC-U of Iowa-530HT | Adenovirus |
| Other | Ad5CMVCre | Gene Transfer Vector Core, University of Iowa, IA | VVC-U of Iowa-5-HT | Adenovirus |
| Other | Ad5SpcCre | Gene Transfer Vector Core, University of Iowa, IA | VVC-Berns- 1168 | Adenovirus |
| Other | Dusp6 | ThermoFisher Scientific | Mm00518185_m1 | TaqMan Gene Expression Assay (FAM) |
| Other | Pgc | ThermoFisher Scientific | Mm00482488_m1 | TaqMan Gene Expression Assay (FAM) |
| Other | Cym | ThermoFisher Scientific | Mm01204823_m1 | TaqMan Gene Expression Assay (FAM) |
| Other | Axin2 | ThermoFisher Scientific | Mm00443610_m1 | TaqMan Gene Expression Assay (FAM) |
| Other | Lgr5 | ThermoFisher Scientific | Mm00438890_m1 | TaqMan Gene Expression Assay (FAM) |
| Other | Gif | ThermoFisher Scientific | Mm00433596_m1 | TaqMan Gene Expression Assay (FAM) |
| Other | Ppia | ThermoFisher Scientific | Mm02342429_g1 | TaqMan Gene Expression Assay (FAM) |
| Other | Gfi1b | ThermoFisher Scientific | Mm00492318_m1 | TaqMan Gene Expression Assay (FAM) |
| Other | Pou2f3 | ThermoFisher Scientific | Mm00478293_m1 | TaqMan Gene Expression Assay (FAM) |
| Other | Ccnd1 | ThermoFisher Scientific | Mm00432359_m1 | TaqMan Gene Expression Assay (FAM) |
| Other | Ccnd2 | ThermoFisher Scientific | Mm00438070_m1 | TaqMan Gene Expression Assay (FAM) |
| Other | Foxa1 | ThermoFisher Scientific | Mm00484713_m1 | TaqMan Gene Expression Assay (FAM) |
| Other | Foxa2 | ThermoFisher Scientific | Mm01976556_s1 | TaqMan Gene Expression Assay (FAM) |
| Other | RBC Lysis Buffer | eBioscience | 00-4333-57 | |
| Other | Collagenase type I | Thermofisher Scientific | 17100017 | Enzyme |
| Other | Dispase | Corning | 354235 | Enzyme |
| Other | Deoxyribonuclease I | Sigma Aldrich | DN25 | Enzyme |
Additional files
-
Supplementary file 1
Whole-tumor RNA sequencing DESeq2 analysis.
- https://cdn.elifesciences.org/articles/66788/elife-66788-supp1-v3.xlsx
-
Supplementary file 2
Differentially expressed genes between control and MAPKi-treated tumors used for generating volcano plots.
- https://cdn.elifesciences.org/articles/66788/elife-66788-supp2-v3.xlsx
-
Supplementary file 3
Top 10 upregulated genes per tumor cluster in scRNA-seq data.
- https://cdn.elifesciences.org/articles/66788/elife-66788-supp3-v3.xlsx
-
Supplementary file 4
Full list of DEGs from single cell sequencing analysis.
- https://cdn.elifesciences.org/articles/66788/elife-66788-supp4-v3.xlsx
-
Supplementary file 5
GO analysis by Correlation Engine comparing BP C and BP Tx tumors.
- https://cdn.elifesciences.org/articles/66788/elife-66788-supp5-v3.xlsx
-
Supplementary file 6
GO analysis by Correlation Engine comparing BPN C and BPN Tx tumors.
- https://cdn.elifesciences.org/articles/66788/elife-66788-supp6-v3.xlsx
-
Supplementary file 7
Published gene expression dataset for gastric chief cells.
- https://cdn.elifesciences.org/articles/66788/elife-66788-supp7-v3.xlsx
-
Supplementary file 8
Published gene expression dataset for tuft cells.
- https://cdn.elifesciences.org/articles/66788/elife-66788-supp8-v3.xlsx
-
Transparent reporting form
- https://cdn.elifesciences.org/articles/66788/elife-66788-transrepform-v3.docx
Download links
A two-part list of links to download the article, or parts of the article, in various formats.
Downloads (link to download the article as PDF)
Open citations (links to open the citations from this article in various online reference manager services)
Cite this article (links to download the citations from this article in formats compatible with various reference manager tools)
An NKX2-1/ERK/WNT feedback loop modulates gastric identity and response to targeted therapy in lung adenocarcinoma
eLife 10:e66788.
https://doi.org/10.7554/eLife.66788


