Surface-associated antigen induces permeabilization of primary mouse B-cells and lysosome exocytosis facilitating antigen uptake and presentation to T-cells
- Department of Cell Biology and Molecular Genetics, University of Maryland, United States
- Immunology Division, Garvan Institute of Medical Research, Australia
- Immunology, Garvan Institute of Medical Research, Australia
Figures
Figure 1 with 6 supplements
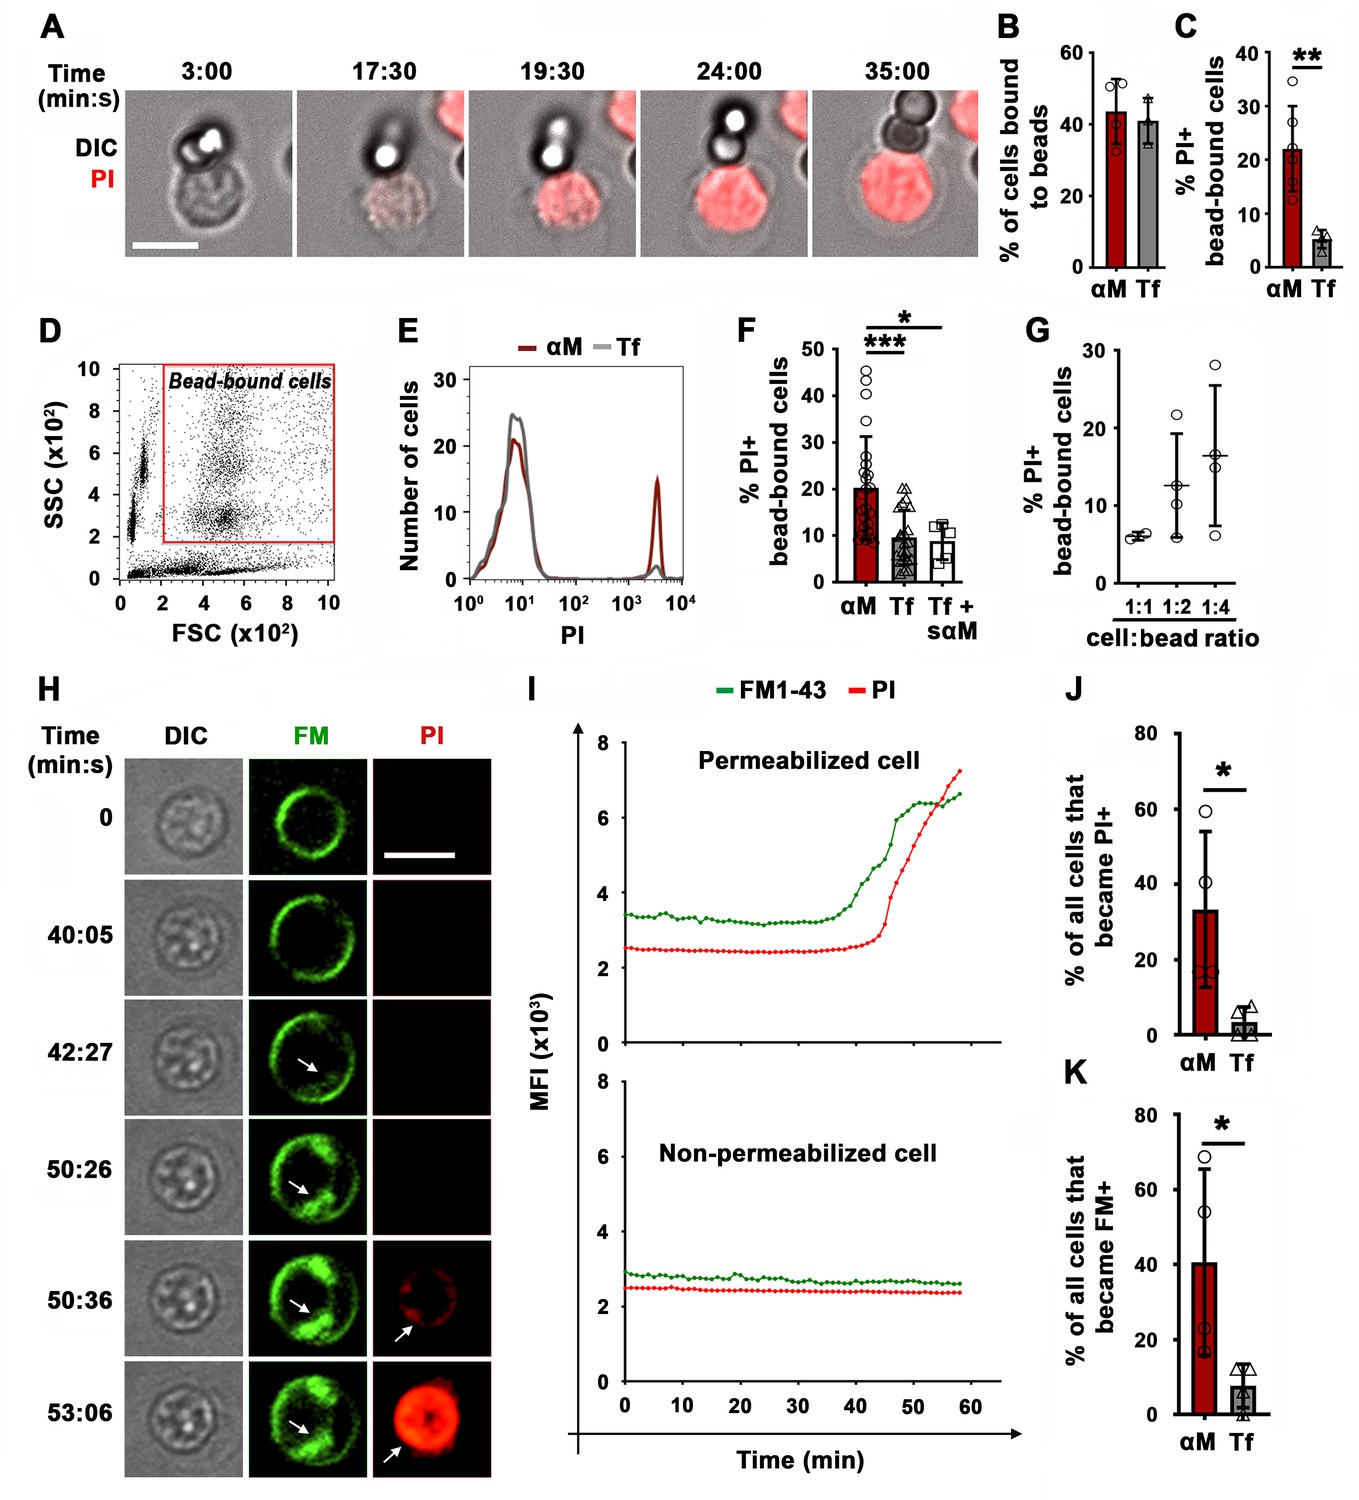
BCR binding to surface-associated ligands causes B-cell PM permeabilization.
(A) Time-lapse images of a splenic B-cell incubated with αM-beads (1:2 cell:bead ratio) in the presence of PI (Video 1). (B) Percentages of B-cells bound to beads. (C) Percentages of PI-positive (PI+) cells in bead-bound B-cells at 30 min. (D) Gate for bead-bound B-cells in forward and side scatter flow cytometry dot plot. (E) Histograms of PI fluorescence intensity (FI) of αM- and Tf-bead-bound B-cells after 30 min incubation, showing 1000 cells per condition. (F) Percentages of PI+ bead-bound B-cells after 30 min incubation with αM- or Tf-beads with or without soluble αM (sαM). (G) Percentages of PI+ bead-bound B-cells after 30 min at indicated cell:αM bead ratios. (H) Time-lapse images of a B-cell interacting with αM-PLB in the presence of FM1-43 and PI (arrows, FM1-43 or PI entry, Video 4). (I) Mean fluorescence intensity of FM1-43 (green lines) and PI (red lines) in a defined intracellular region of a permeabilized (top) and non-permeabilized (bottom) cell over time. (J) Percentages of PI+ B cells interacting with αM- or Tf-PLB for 60 min. (K) Percentages of B-cells interacting with αM- or Tf-PLB for 30 min showing intracellular FM staining (FM+). Data points represent independent experiments (mean ± SD) (B, C, F, G, J, K). Bars, 5 μm. *p ≤ 0.05, **p ≤ 0.01, ***p ≤ 0.005, unpaired Student’s t-test (B, C, J, K) or one-way ANOVA (F).
Figure 1—figure supplement 1
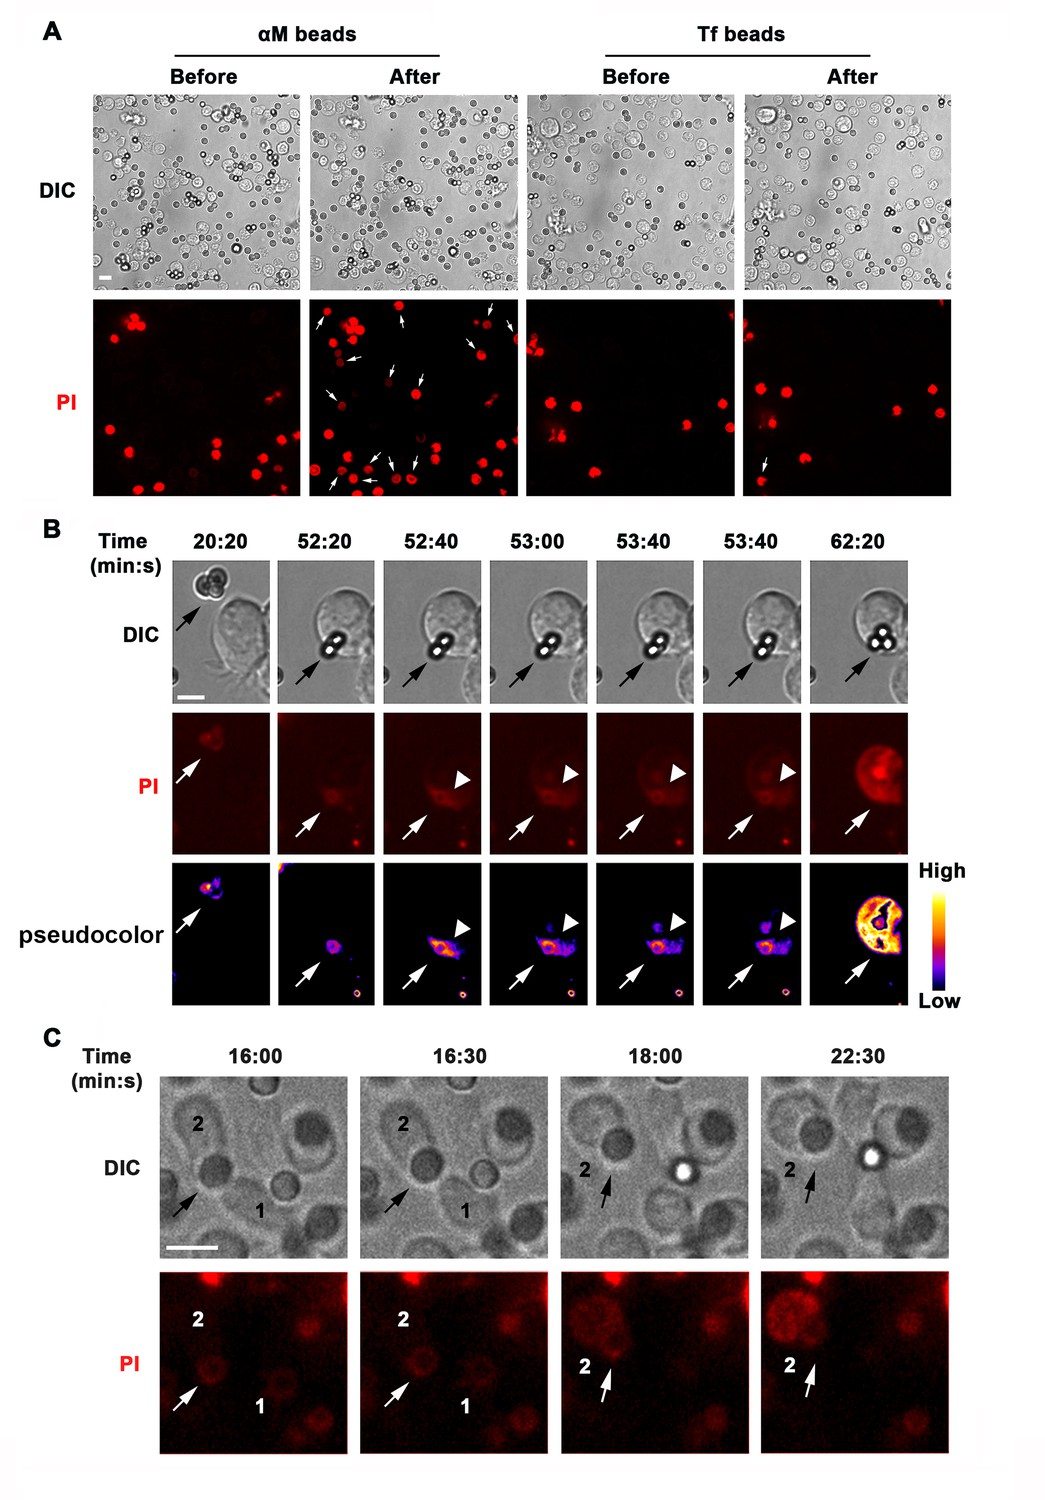
BCR binding to αM-beads causes localized PM permeabilization in B-cells.
(A) Live spinning-disk microscopy images of splenic B-cells incubated with αM- or Tf-beads before and after 60 min at 37°C in the presence of PI. The arrows point to bead-bound B-cells that became PI+ during the incubation (Video 1). (B) Live spinning disk time-lapse images and corresponding fluorescence intensity (FI) pseudo-color images of A20 B-cells incubated with αM-beads in the presence of PI. The arrow points to beads that caused permeabilization; the arrowhead points to the site of PI entry (Video 2). Beads appear faintly red due to autofluorescence. (C) Live spinning disk time-lapse images of splenic B-cells incubated with αM-beads in the presence of PI. The arrow points to a bead that was exchanged between cells (#1, #2) and caused permeabilization of cell #2 (Video 3). Bars, 5 μm.
Figure 1—figure supplement 2
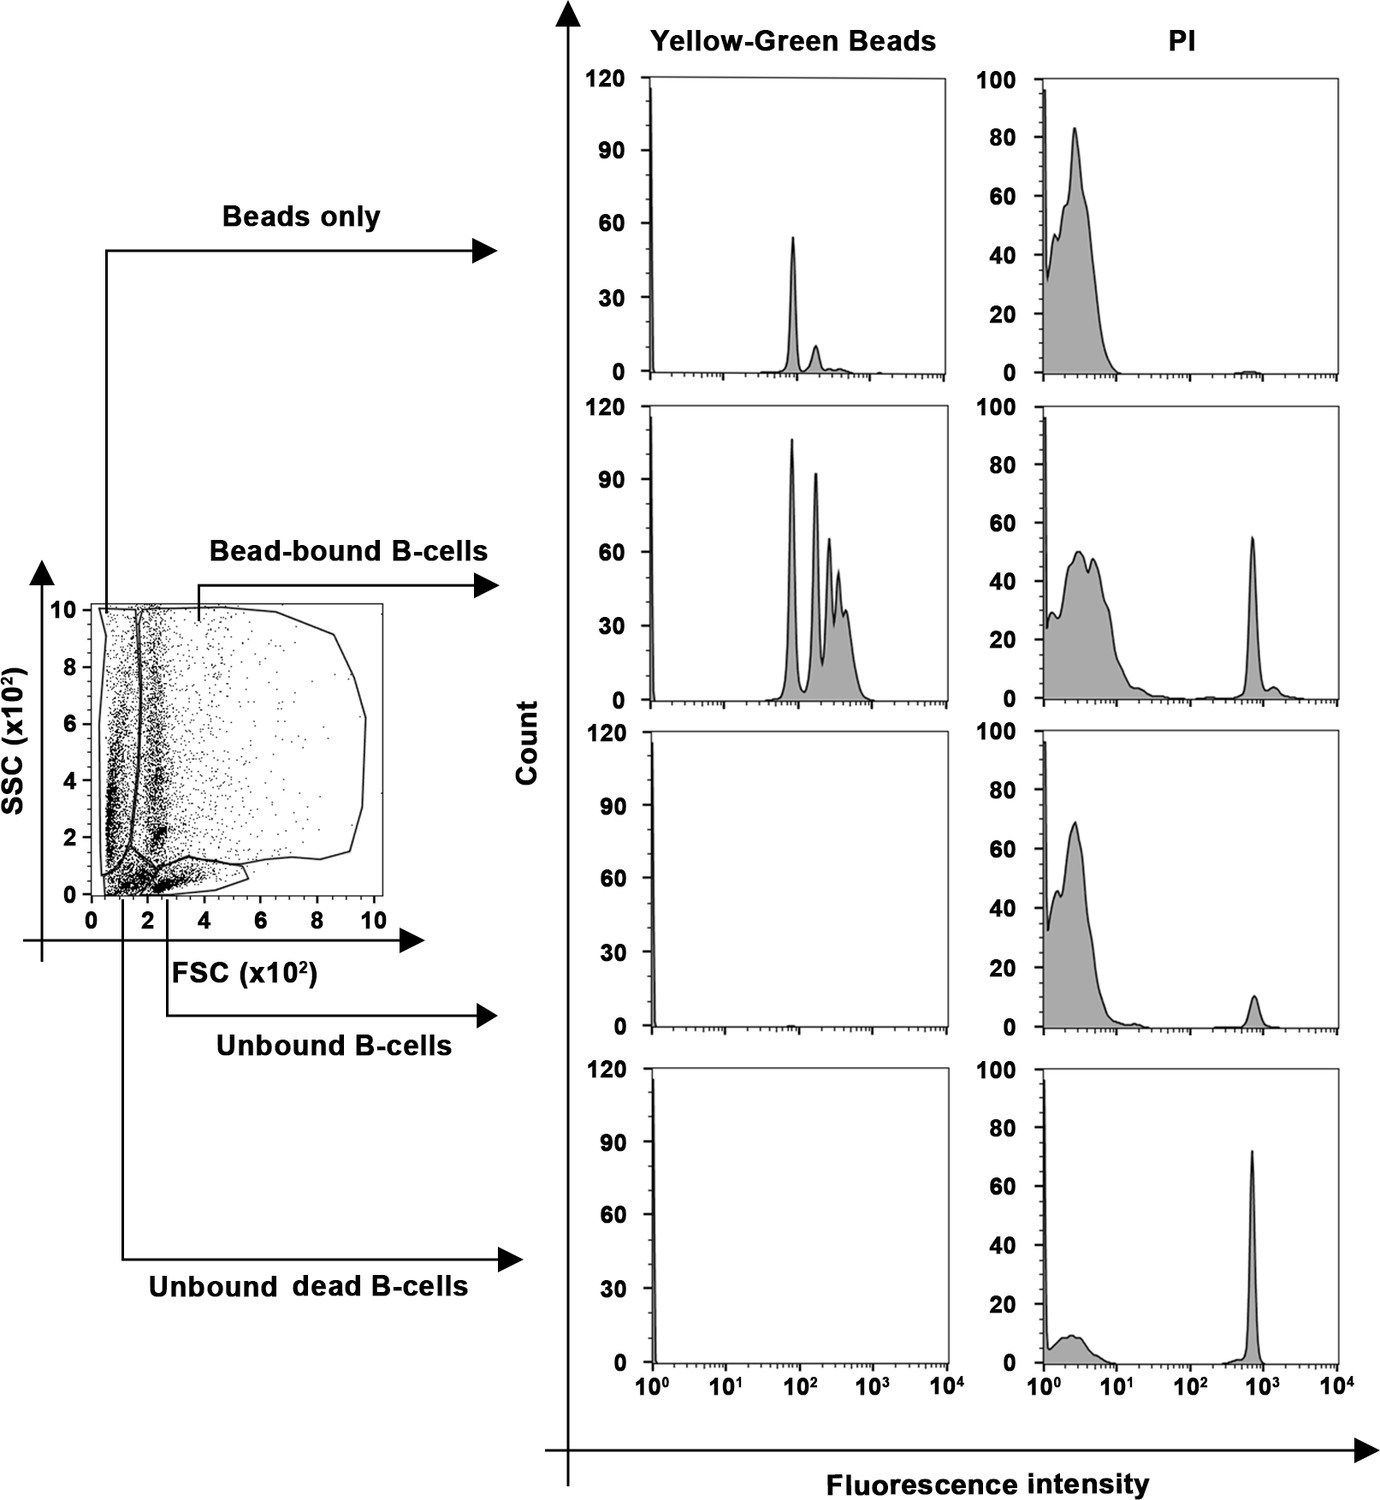
Identification of bead-bound B-cells by flow cytometry.
Splenic B-cells were incubated with αM-conjugated yellow-green fluorescence beads in the presence of PI and analyzed by flow cytometry. Representative dot plots of side scatter (SSC) versus forward scatter (FSC) and fluorescence intensity histograms of yellow-green beads and PI are shown. Bead-bound B-cells were identified by sizes and the presence of yellow-green fluorescence.
Figure 1—figure supplement 3
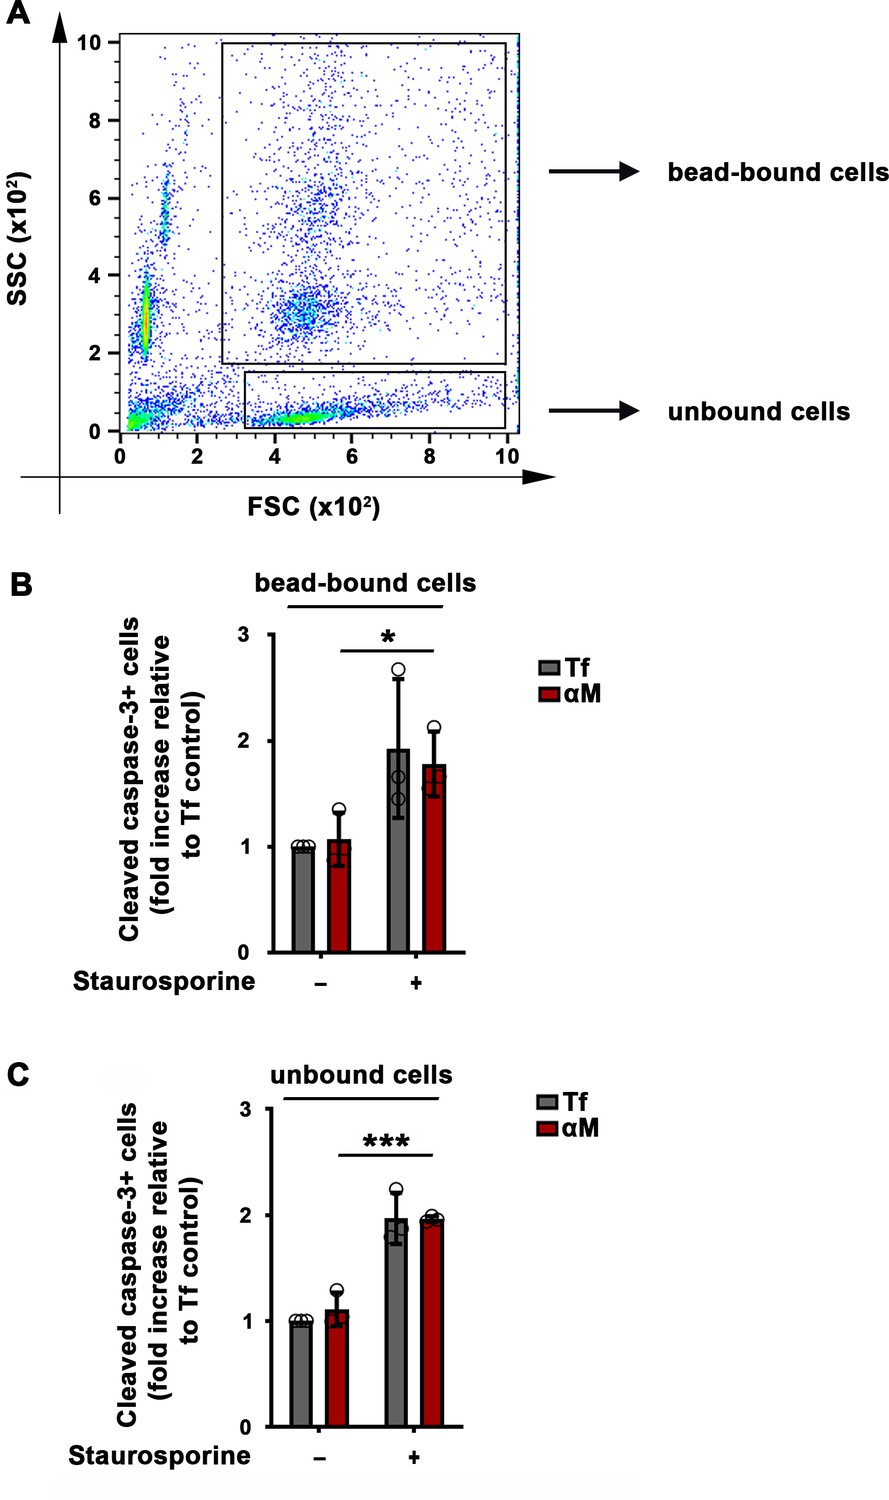
BCR binding to αM-beads does not increase apoptosis in B-cells.
Splenic B-cells treated or not with staurosporine for 24 hr were incubated with αM- or Tf-beads for 30 min at 37°C, fixed, permeabilized, stained with antibodies against cleaved caspase-3, and analyzed by flow cytometry. (A) Identification of bead-bound and unbound B-cell populations on a side scatter (SSC) versus forward scatter (FSC) plot. The percentage of cells positive for cleaved caspase-3 was determined in the bead-bound (B) or unbound (C) cell populations and expressed relative to the Tf-bead control. Data points represent independent experiments (mean ± SD). *p ≤ 0.05; ***p ≤ 0.005, unpaired Student’s t-test.
Figure 1—figure supplement 4
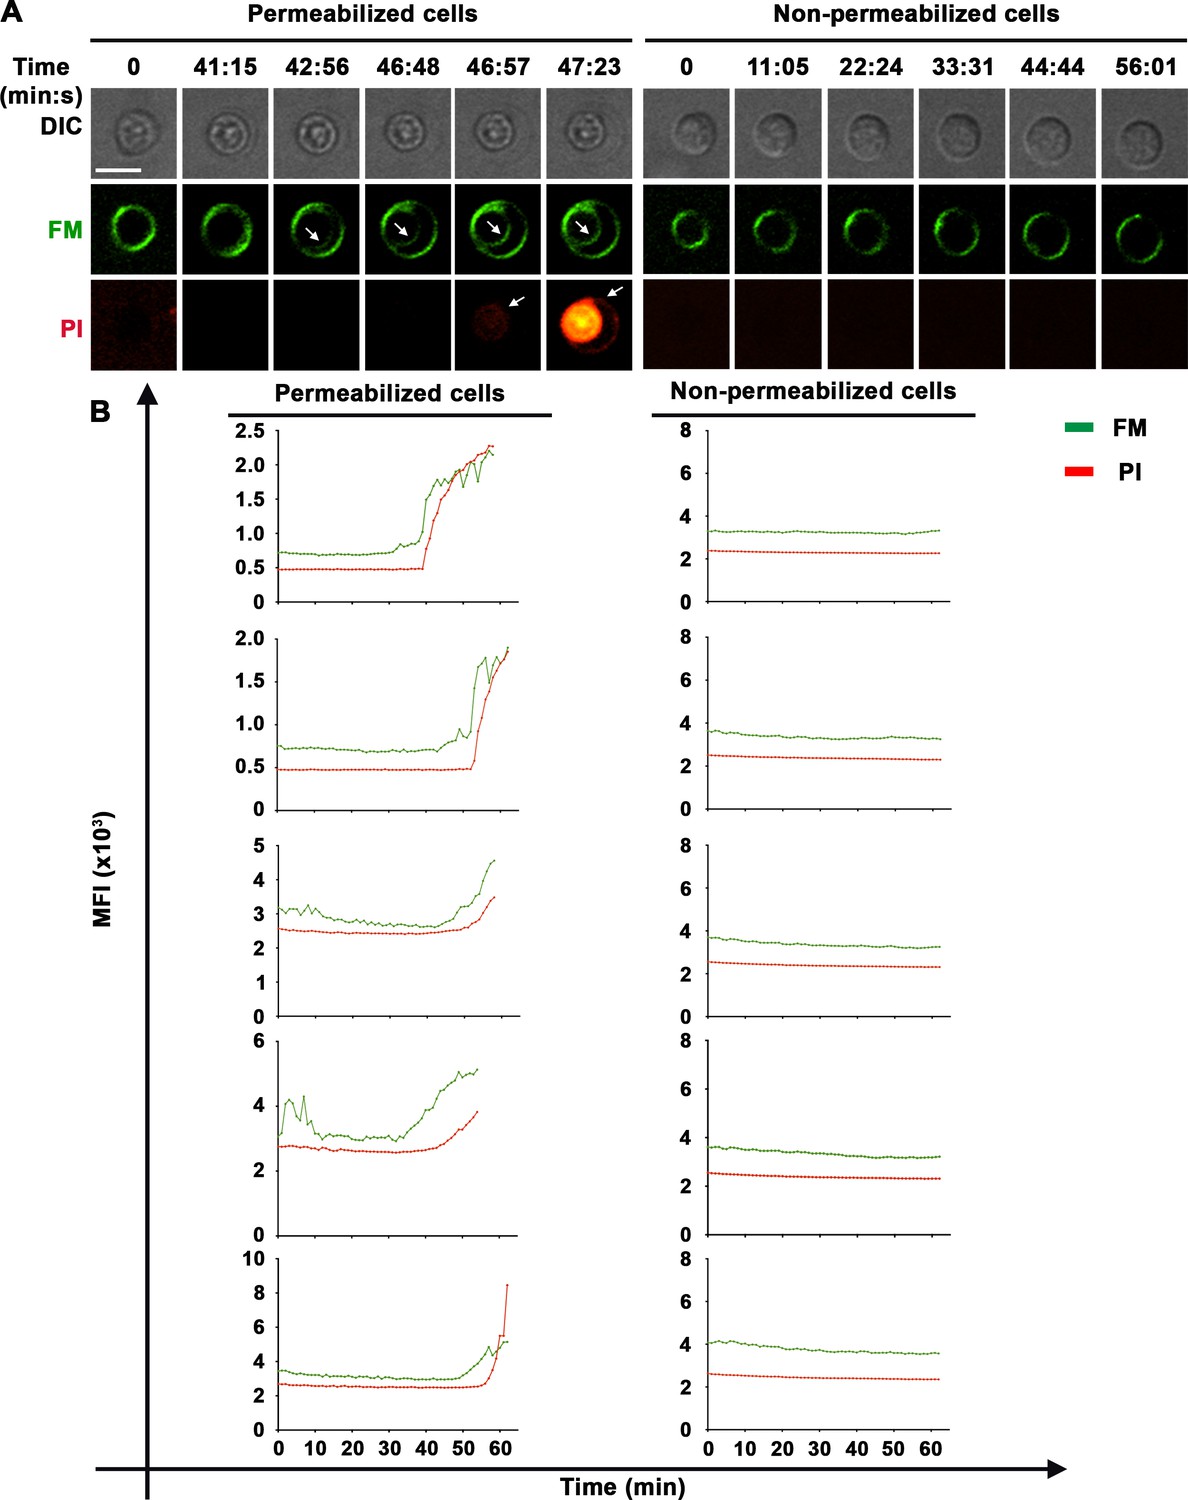
Sudden increases in intracellular staining with the lipophilic FM dye in B-cells permeabilized by interaction with αM-PLB.
(A) Live spinning disk time-lapse images of splenic B-cells (permeabilized or non-permeabilized) after contact with αM-PLB in the presence of FM1-43 and PI at 37 °C. The arrows point to B-cell sites where intracellular FM or PI was initially detected. (B) Mean fluorescence intensity (MFI) of FM (green) and PI (red) over time in a defined intracellular region (Video 4) in permeabilized (left, 5 examples) or non-permeabilized cells (right, 5 examples). Bar, 5 µm.
Figure 1—figure supplement 5
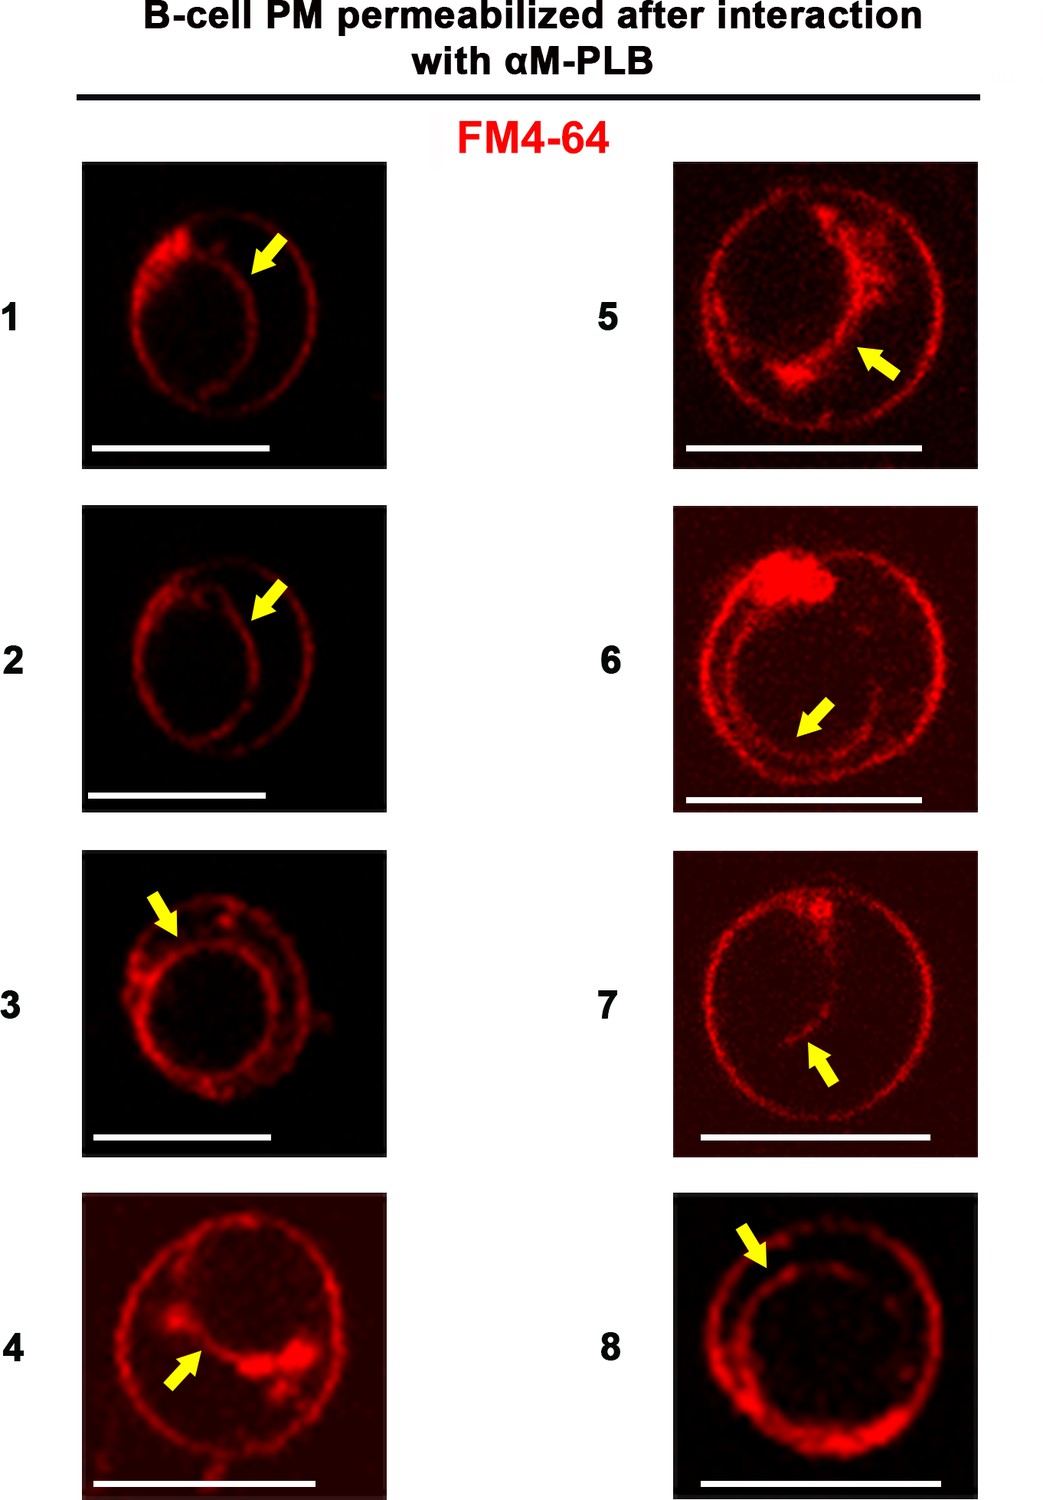
The lipophilic FM dye enters B-cells permeabilized by αM-PLB and stains the nuclear envelope.
The images show eight examples of FM4-64 nuclear envelope staining (arrows) in splenic B-cells permeabilized by αM-PLB after 60 min incubation at 37°C and imaged by live spinning disk fluorescence microscopy. Bar, 5 µm.
Figure 1—figure supplement 6
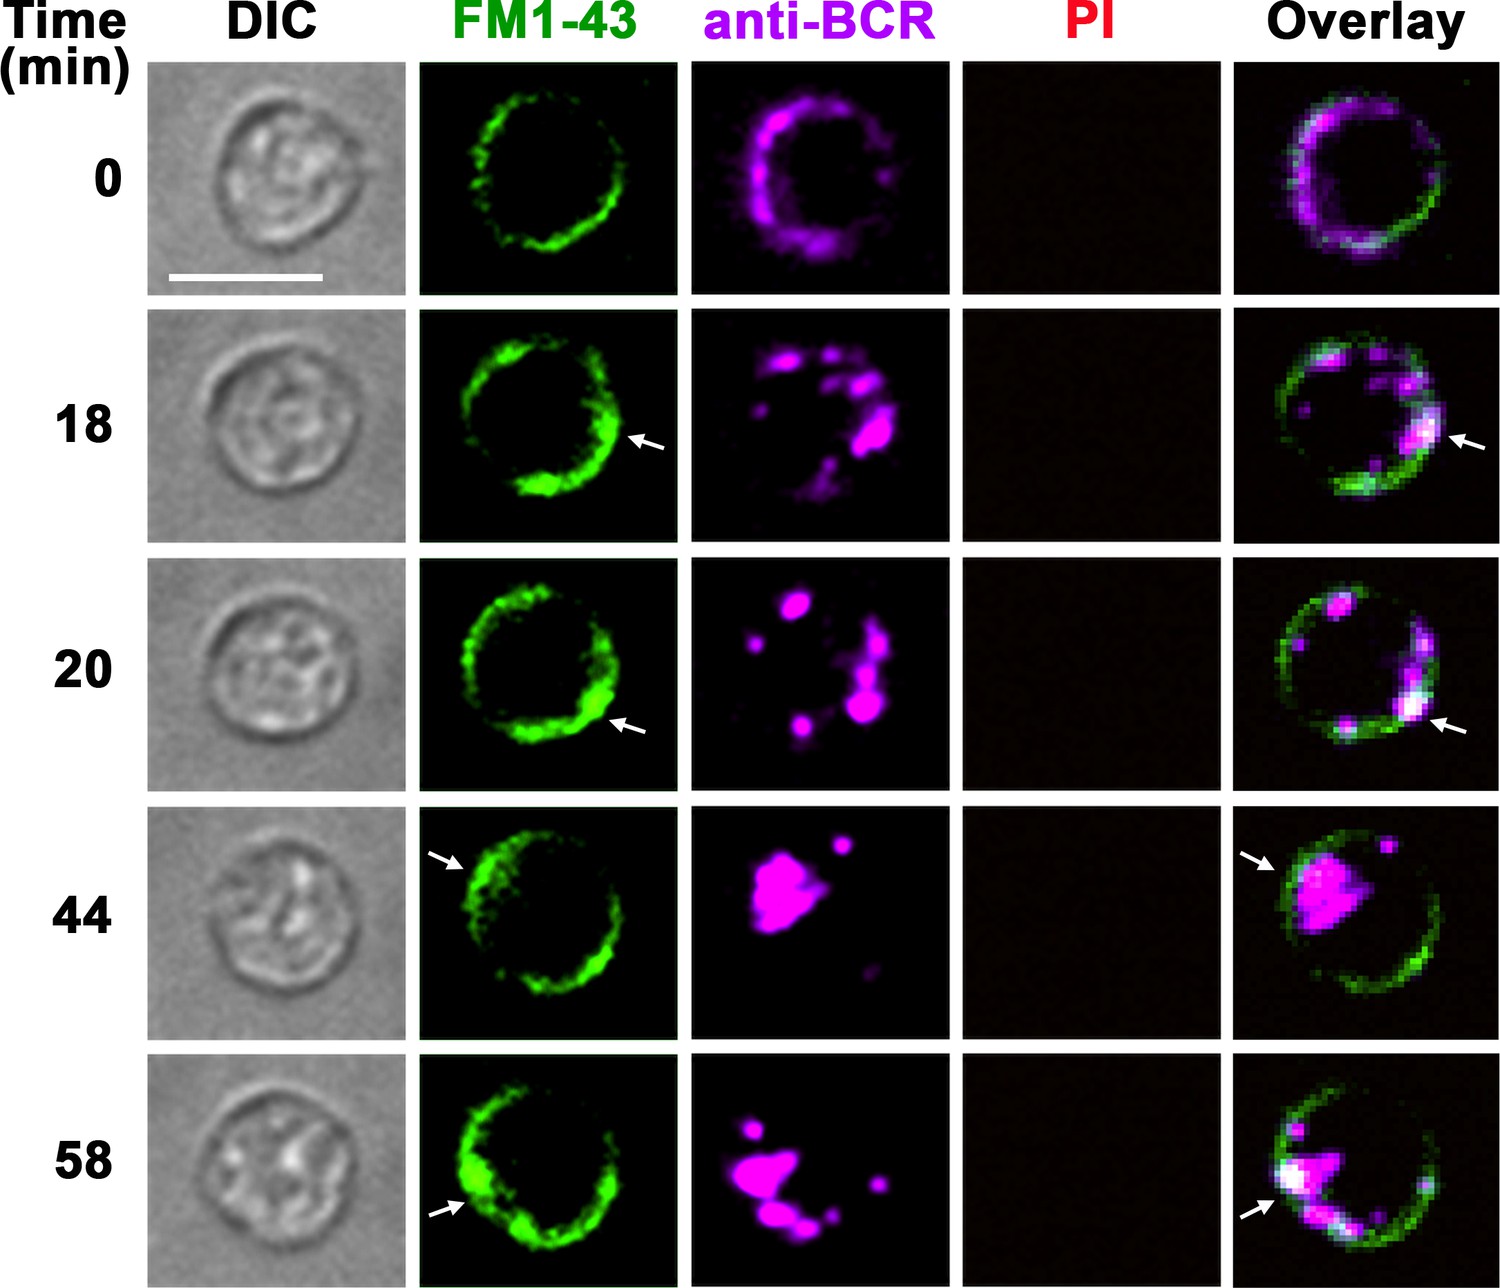
BCR cross-linking with soluble ligands does not permeabilize B-cells but induces a punctate form of FM uptake at the cell periphery that is distinct from the massive FM influx induced by surface-associated ligands.
Spinning disk time-lapse images of B-cells pre-labeled with soluble anti-BCR antibodies and FM1-43 (green) at 4°C and then imaged at 37°C after addition of secondary fluorochrome-labeled crosslinking antibodies (magenta), in the presence of FM1-43 (green) and PI (red, not detected). The arrows point to areas at the cell periphery where small puncta of internalized FM1-43 were visualized next to anti-BCR clusters (Video 4). No PI influx was detected, indicating that the B-cells were not permeabilized. Bars, 5 μm.
Figure 2
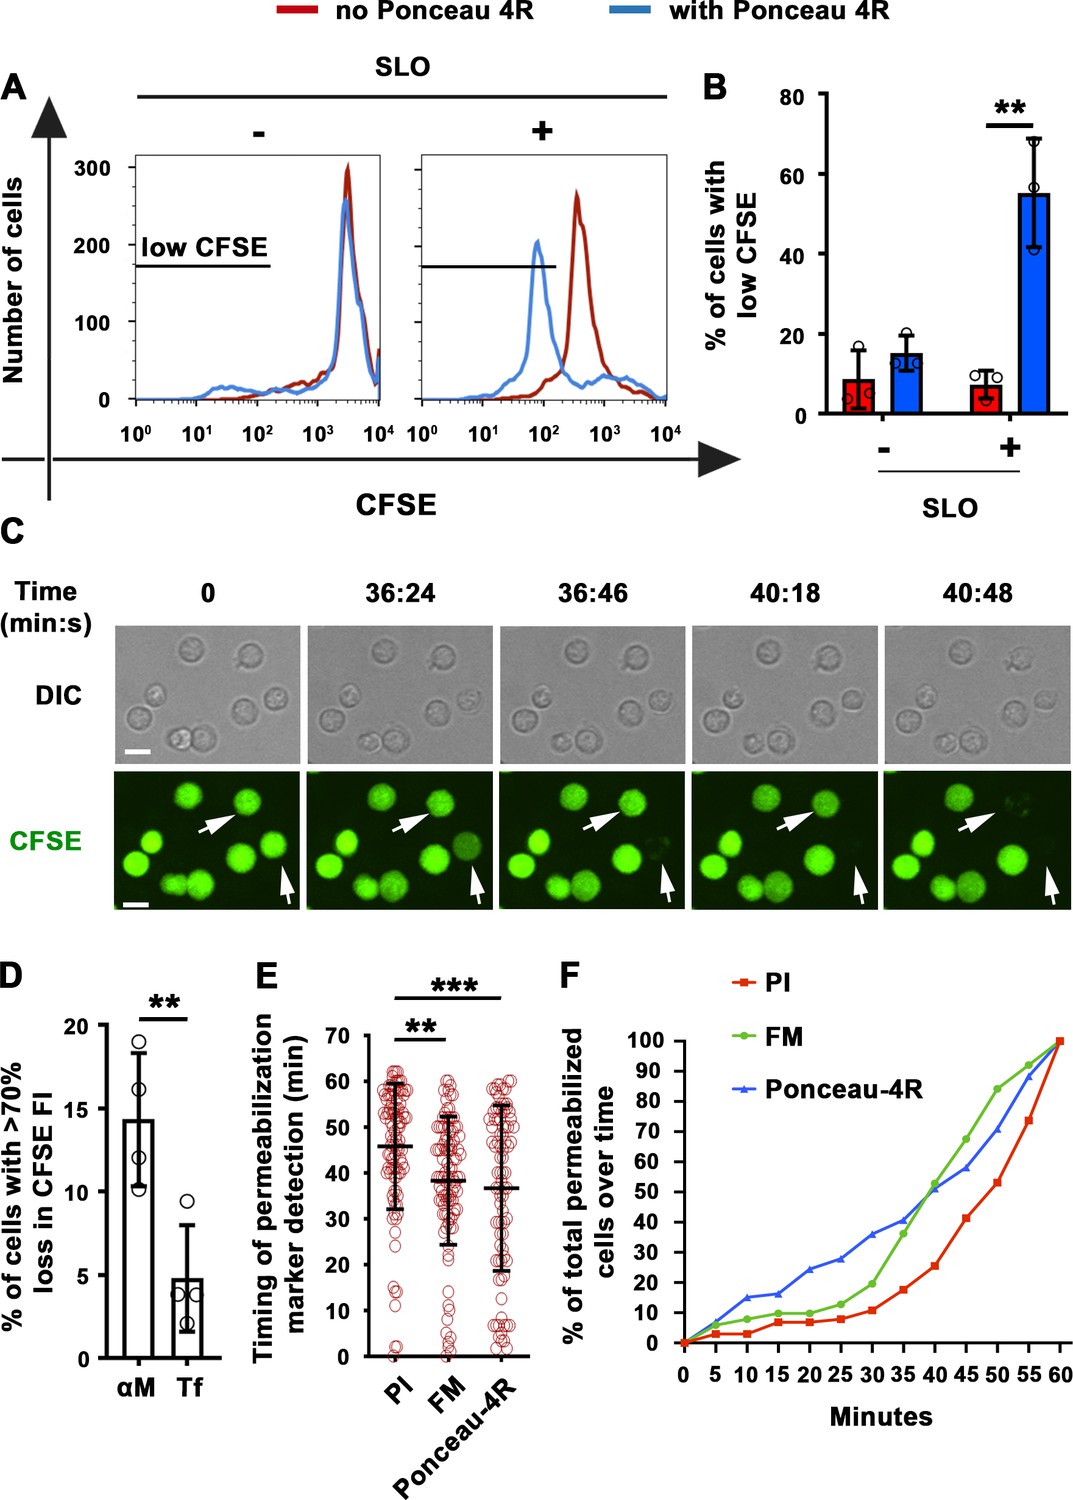
Extracellular Ponceau 4R quenches cytoplasmic CFSE in αM-PLB-permeabilized B-cells.
(A) Flow cytometry histograms of CFSE FI in B-cells incubated with or without SLO for 10 min in the presence or absence of Ponceau 4R, showing 8500 cells per condition. (B) Percentages of cells with reduced CFSE in the presence or absence of Ponceau 4R after treatment with or without SLO. Data points represent independent experiments (mean ± SD). (C) Time-lapse images of B-cells pre-stained with CFSE interacting with αM-PLB in the presence of Ponceau 4R (arrows, cells with Ponceau 4R quenching of cytoplasmic CFSE) (Video 5). (D) Percentages of B-cells with more than 70 % loss of CFSE FI after 60 min interaction with αM- or Tf -PLB. Data points represent independent experiments (mean ± SD). (E) Timing of PI, FM1-43 entry or Ponceau 4R-mediated CFSE quenching in B-cells interacting with αM-PLB. Data points represent individual cells in at least four independent experiments (mean ± SD). (F) Cumulative percentages of total permeabilized B-cells detected over time in four independent experiments. Bars, 5 μm. **p ≤ 0.01, ***p ≤ 0.005, unpaired Student’s t-test (B, D) or one-way ANOVA (E).
Figure 3
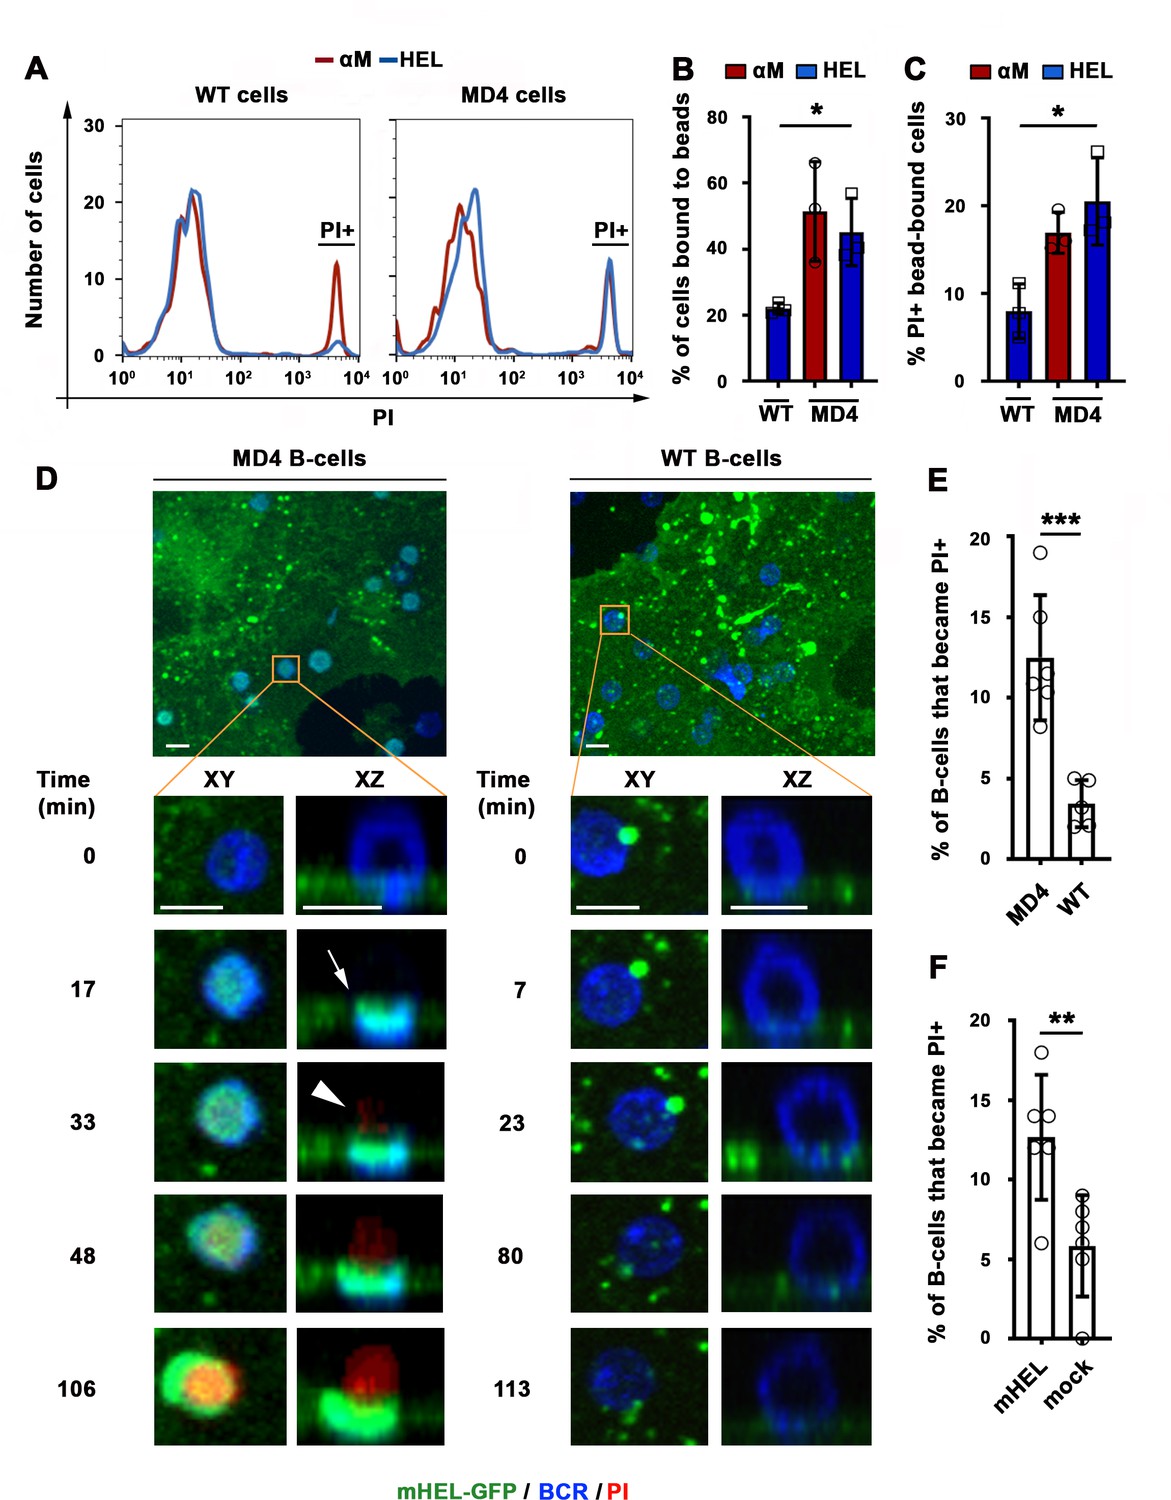
BCR-mediated binding of HEL coupled to beads or expressed as a transmembrane protein on COS-7 cells causes B-cell PM permeabilization.
(A) Flow cytometry histograms of PI FI in WT or MD4 B-cells incubated with αM- or HEL-beads for 30 min by flow cytometry, showing 1000 cells per condition. (B) Percentages of WT and MD4 B-cells binding αM- or HEL-beads. Data points represent independent experiments (mean ± SD). (C) Percentages of PI+ bead-bound WT or MD4 B-cells after 30 min incubation. Data points represent independent experiments (mean ± SD). (D) Spinning disk time-lapse images of a MD4 B-cell (left panels) and a WT B-cell (right panels) interacting with a mHEL-GFP-expressing COS-7 cell in the presence of PI (Videos 6 and 7). Arrows, clustering of mHEL-GFP during B-cell binding; arrowheads, PI entry in the B-cell. (E) Percentages of PI+ MD4 and WT B-cells interacting with COS-7 cells transfected with mHEL-GFP. (F) Percentages of PI+ MD4 B-cells interacting with COS-7 cells transfected with mHEL-GFP or mock-transfected. Data points (E and F) represent individual videos from three to four independent experiments (mean ± SD). Bars, 5 μm *p ≤ 0.05, **p ≤ 0.01, ***p ≤ 0.005, unpaired Student’s t-test (E, F) or one-way ANOVA (B, C).
Figure 4 with 3 supplements
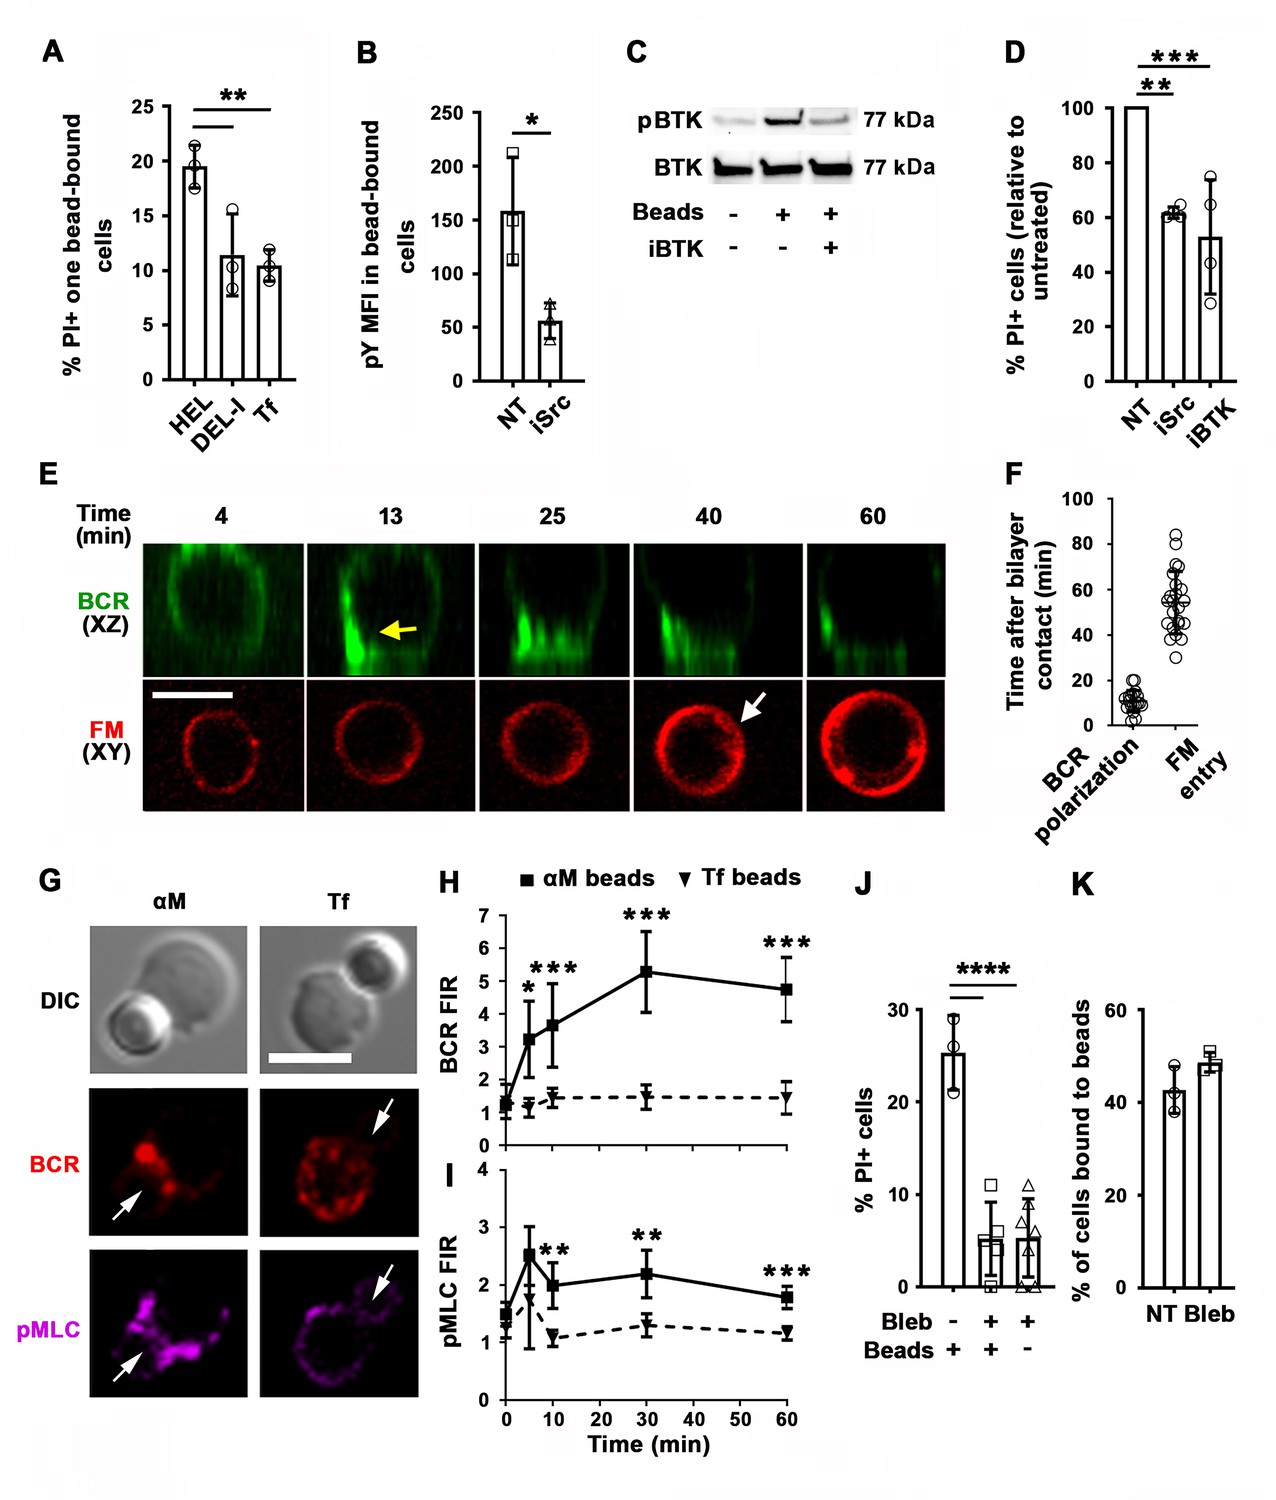
PM permeabilization induced by surface-associated antigen depends on high-affinity BCR-antigen binding, BCR signaling, and non-muscle myosin II (NMII) motor activity.
(A) Percentages of PI+ single bead-binding B-cells after incubation with HEL-, DEL-I- or Tf-beads (1:4 cell:bead ratio) for 30 min. Data points represent independent experiments (mean ± SD). (B) Mean fluorescence intensity (MFI) of phosphotyrosine (pY) in HEL-bead-bound B-cells treated or untreated (NT) with a Src kinase inhibitor (iSrc) by flow cytometry. Data points represent independent experiments (mean ± SD). (C) Western blot analysis of phosphorylated BTK (pBTK) and BTK in B-cells incubated with HEL-beads in the presence or absence of a BTK inhibitor (iBTK) for 30 min. (D) Percentages of PI+ HEL-bead-bound cells treated with iSrc or iBTK relative to not-treated (NT) at 30 min. Data points represent independent experiments (mean ± SD). (E) Spinning disk time-lapse images of BCR polarization (yellow arrow) in a B-cell incubated with αM-PLB in the presence of FM4-64 (white arrow, intracellular FM). (F) Timing of BCR polarization and FM entry of individual cells interacting with αM-PLB (Video 8). Data points represent individual cells in three independent experiments (mean ± SD). (G) Confocal images of BCR and phosphorylated NMII light chain (pMLC) staining in B-cells interacting with αM- or Tf-beads (arrows, bead binding sites). (H and I) FI ratio (FIR) of BCR (H) and pMLC (I) staining at the bead-binding site relative to the opposite PM in αM- and Tf-bead-bound cells over time. Data represent the averages of three independent experiments (mean ± SD). (J) Percentages of PI+ bead-binding B-cells incubated with αM-beads for 30 min with or without blebbistatin (Bleb). Data points represent individual videos from three independent experiments (mean ± SD). (K) Percentages of bead-bound B-cells incubated with αM-beads for 30 min in the presence or absence of Bleb. Data points represent independent experiments (mean ± SD). Bars, 5 μm. *p ≤ 0.05, **p ≤ 0.01, ***p ≤ 0.005, ****p ≤ 0.001, unpaired Student’s t-test (B, H, I, K) or one-way ANOVA (A, D, J).
Figure 4—figure supplement 1
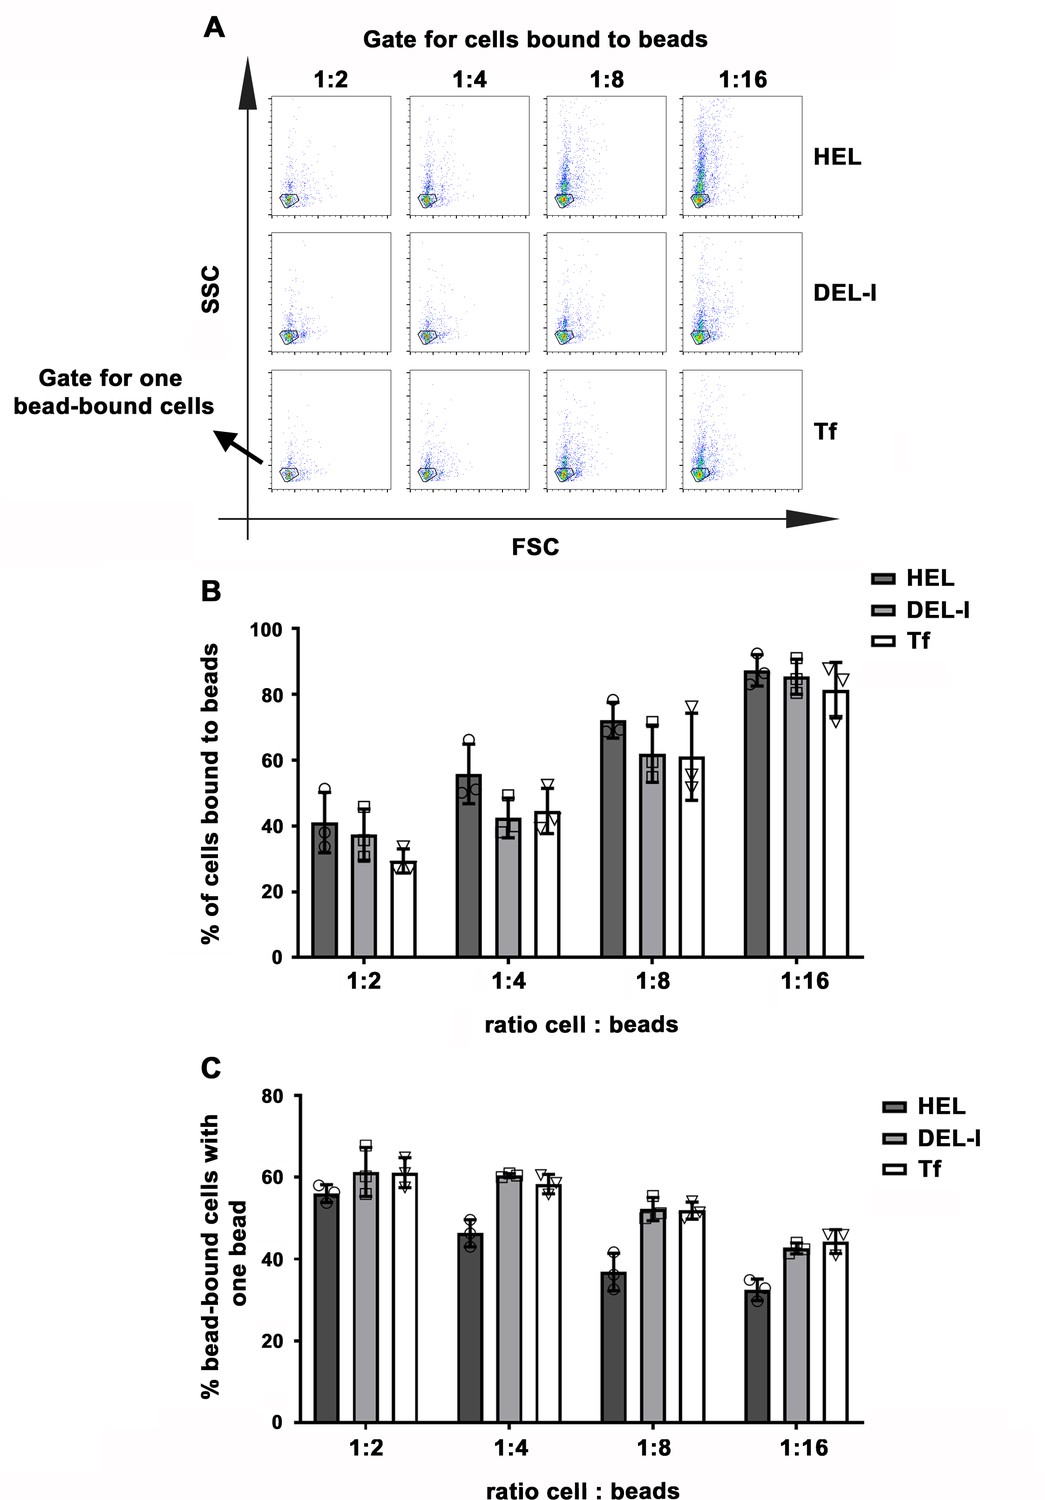
Impact of BCR-antigen affinity on B-cell-bead binding.
Splenic B-cells were incubated with HEL, DEL-I or Tf-beads at the indicated cell:bead ratios for 30 min at 37 °C and analyzed by flow cytometry. (A) Representative SSC versus FSC dot plots gated for bead-bound populations. Outlined areas indicate populations of cells binding one single bead. (B) Percentages of total B-cells that bound to beads. Data points represent independent experiments (mean ± SD). (C) Percentages of bead-bound B-cells binding one single bead. Data points represent independent experiments (mean ± SD). No statistically significant differences were detected (one-way ANOVA).
Figure 4—figure supplement 2
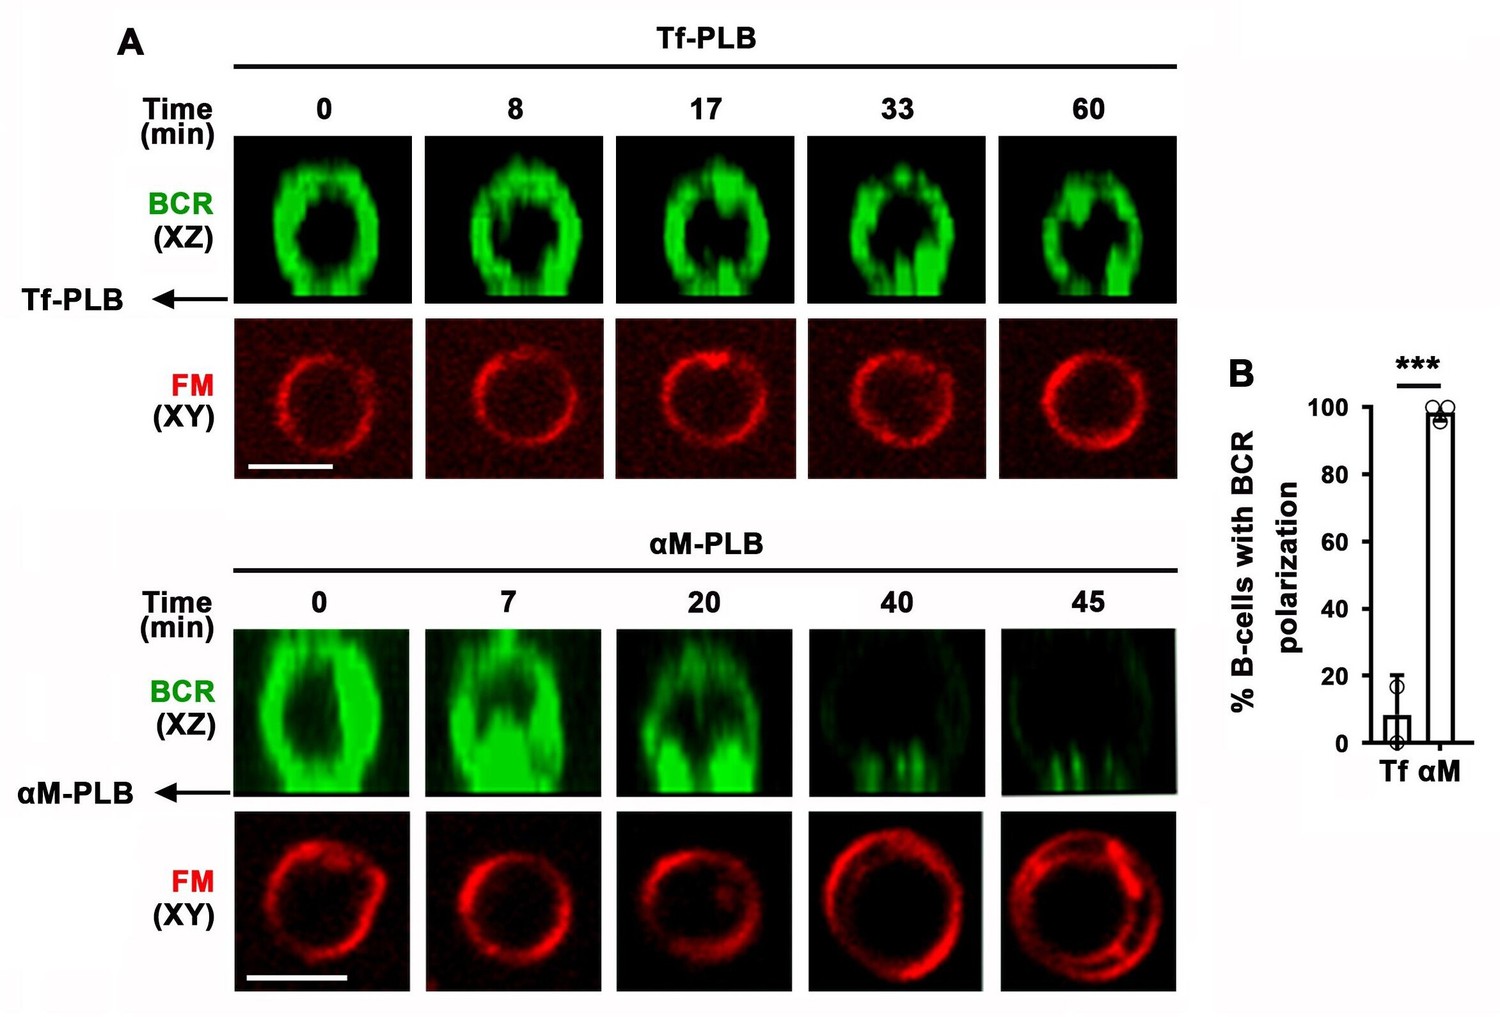
B-cell binding to αM-PLB but not to Tf-PLB triggers BCR polarization first and PM permeabilization later.
(A) Splenic B-cells stained for surface BCR (green) were incubated with Tf-PLB (top panels) or αM-PLB (bottom panels) for 60 min at 37 °C in the presence of FM4-64 (red) and imaged by live spinning disk fluorescence microscopy. (B) Percentages of B-cells with BCR polarization after incubation with Tf- or αM-PLB. Data points represent independent experiments (mean ± SD). ***p ≤ 0.005, unpaired Student’s t-test.
Figure 4—figure supplement 3
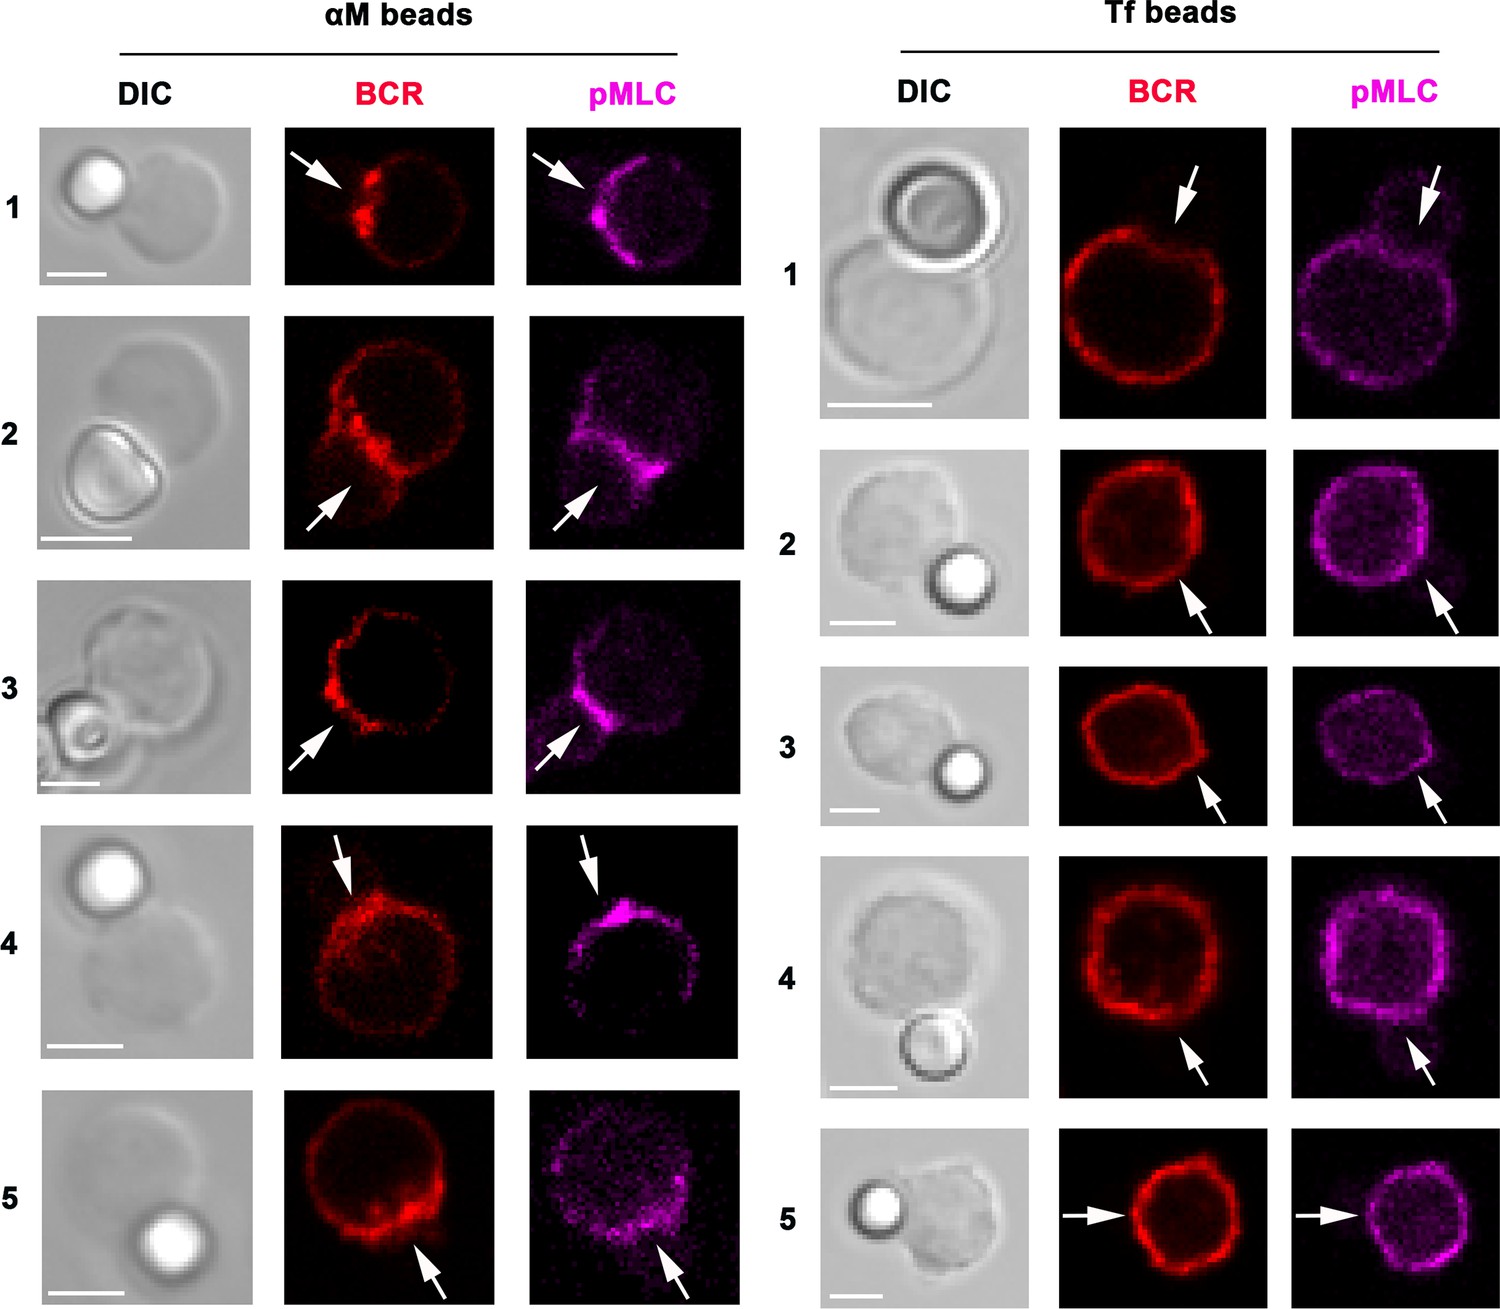
BCR and phosphorylated myosin light chain (pMLC) polarize toward αM-bead binding sites.
The images show several examples of splenic B-cells stained for surface BCRs with a Cy3-labeled Fab fragment of donkey anti-mouse IgM+G (red), incubated with αM (left, 5 examples)- or Tf (right, 5 examples)-beads, fixed, permeabilized, and stained for pMLC (magenta) and analyzed by confocal fluorescence microscopy. The arrows point to bead contact sites in B-cells. Bars, 3 μm.
Figure 5 with 2 supplements
Antigen-induced permeabilization triggers lysosomal exocytosis.
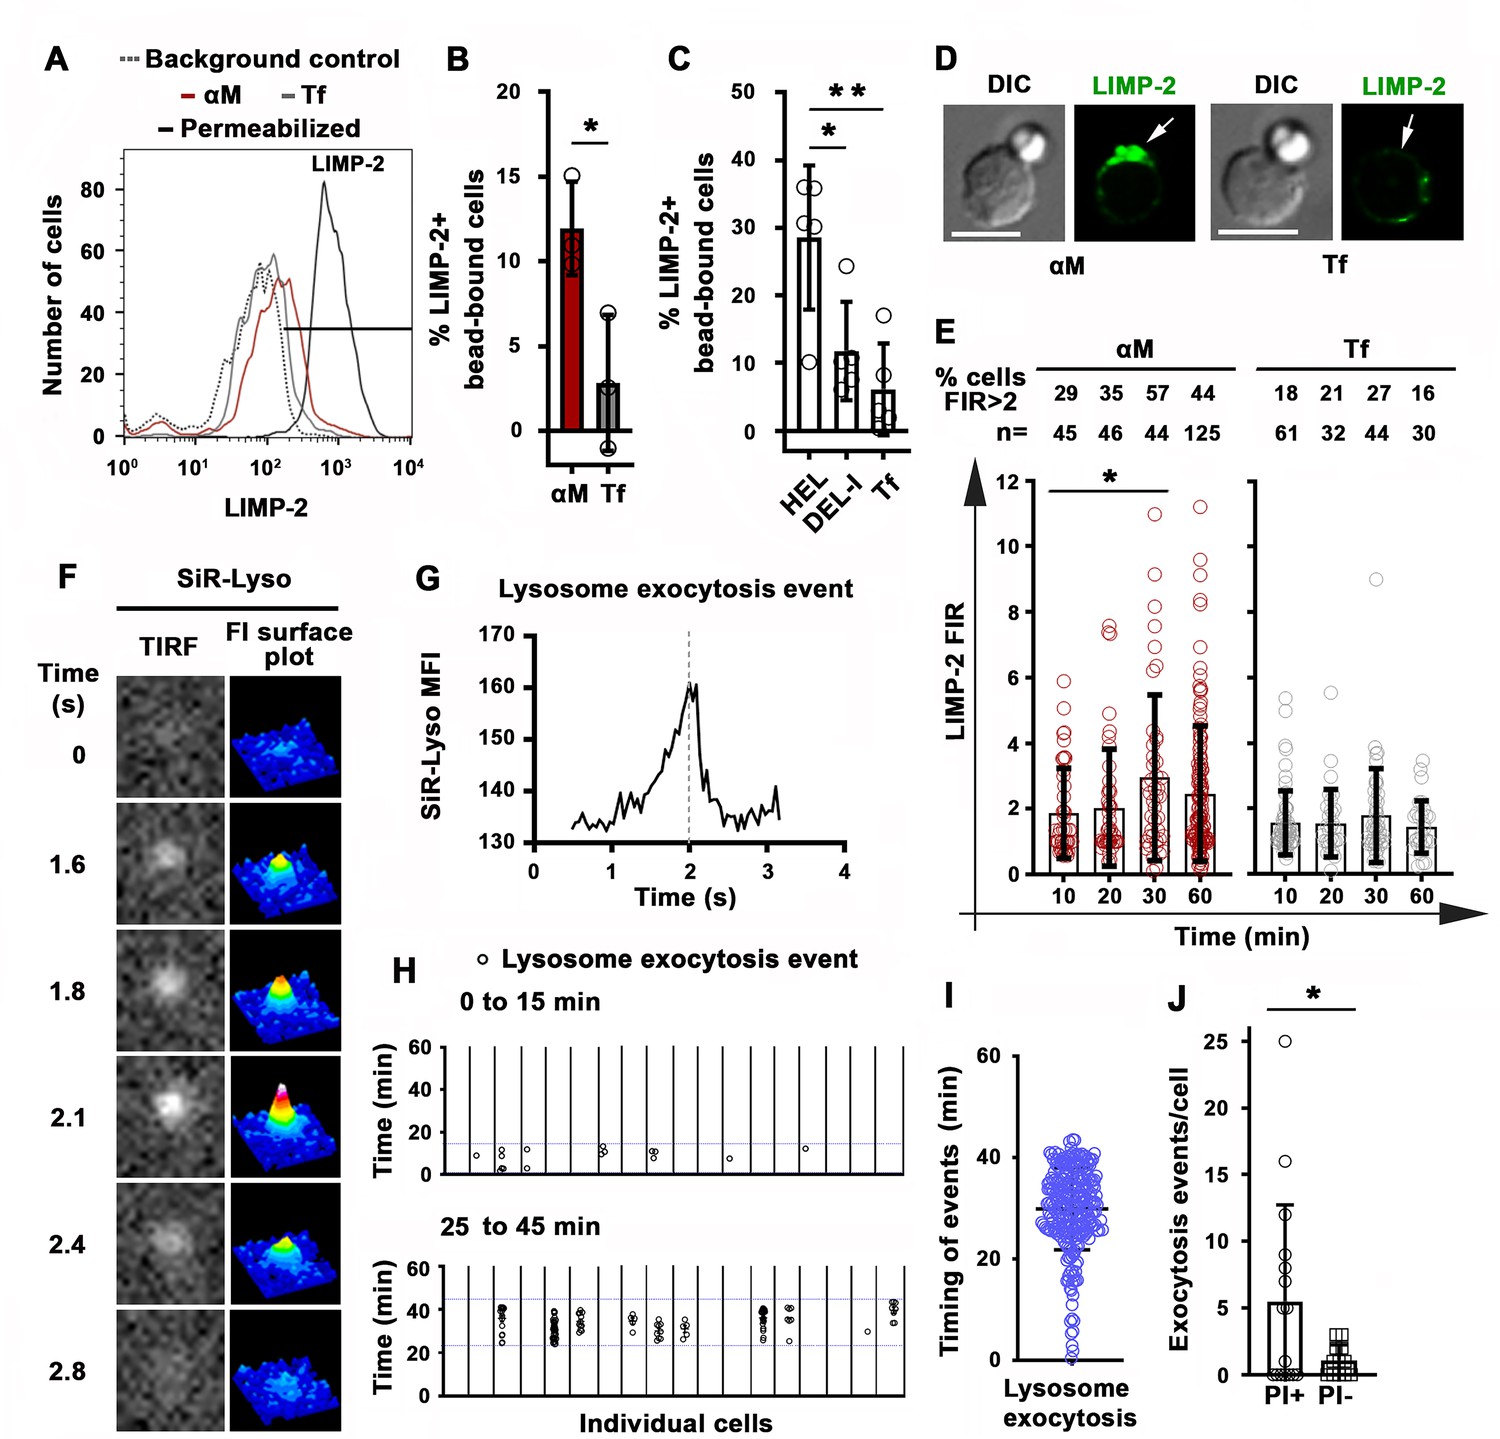
(A) Flow cytometry analysis of surface-exposed (no detergent permeabilization) and/or intracellular LIMP-2 (with detergent permeabilization) of bead-bound B-cells after incubation with αM- or Tf-beads for 30 min, showing 3000 cells per condition. (B and C) Percentages of cells with surface-exposed LIMP-2 (relative to values with secondary antibody alone) in bead-bound B-cells incubated with αM- or Tf-beads (B) or with HEL-, DEL-I- or Tf-beads (C) for 30 min. Data points represent independent experiments (mean ± SD). (D) Confocal images of surface-exposed LIMP-2 in B-cells incubated with αM- or Tf-beads (arrows, bead-binding sites). (E) FIR (bead-binding site:opposite PM) of surface-exposed LIMP-2 in individual cells over time. Data points represent individual cells (mean ± SD). (F) Total internal reflection microscopy (TIRF) images (left) and FI surface plots (right) of SiR-Lyso at the B-cell surface contacting αM-PLB (Video 10). (G) Representative MFI versus time plot of a SiR-Lyso-loaded lysosome undergoing exocytosis. (H) SiR-Lyso exocytosis events (circles) in individual B-cells during the first 0–15 min or 25–45 min of incubation with αM-PLB. (I) Timing of individual SiR-Lyso exocytosis events in B-cells incubated with αM-PLB for 45 min. Data points represent individual SiR-Lyso exocytosis events from three independent experiments (mean ± SD). (J) Numbers of SiR-Lyso exocytosis events per B-cell permeabilized (PI+) or not permeabilized (PI-) by αM-PLB during 45 min. Data points represent individual cells from three independent experiments (mean ± SD). *p ≤ 0.05, **p ≤ 0.01, unpaired Student’s t-test (B and J) or one-way ANOVA (C and E). Bars, 5 μm.
Figure 5—figure supplement 1
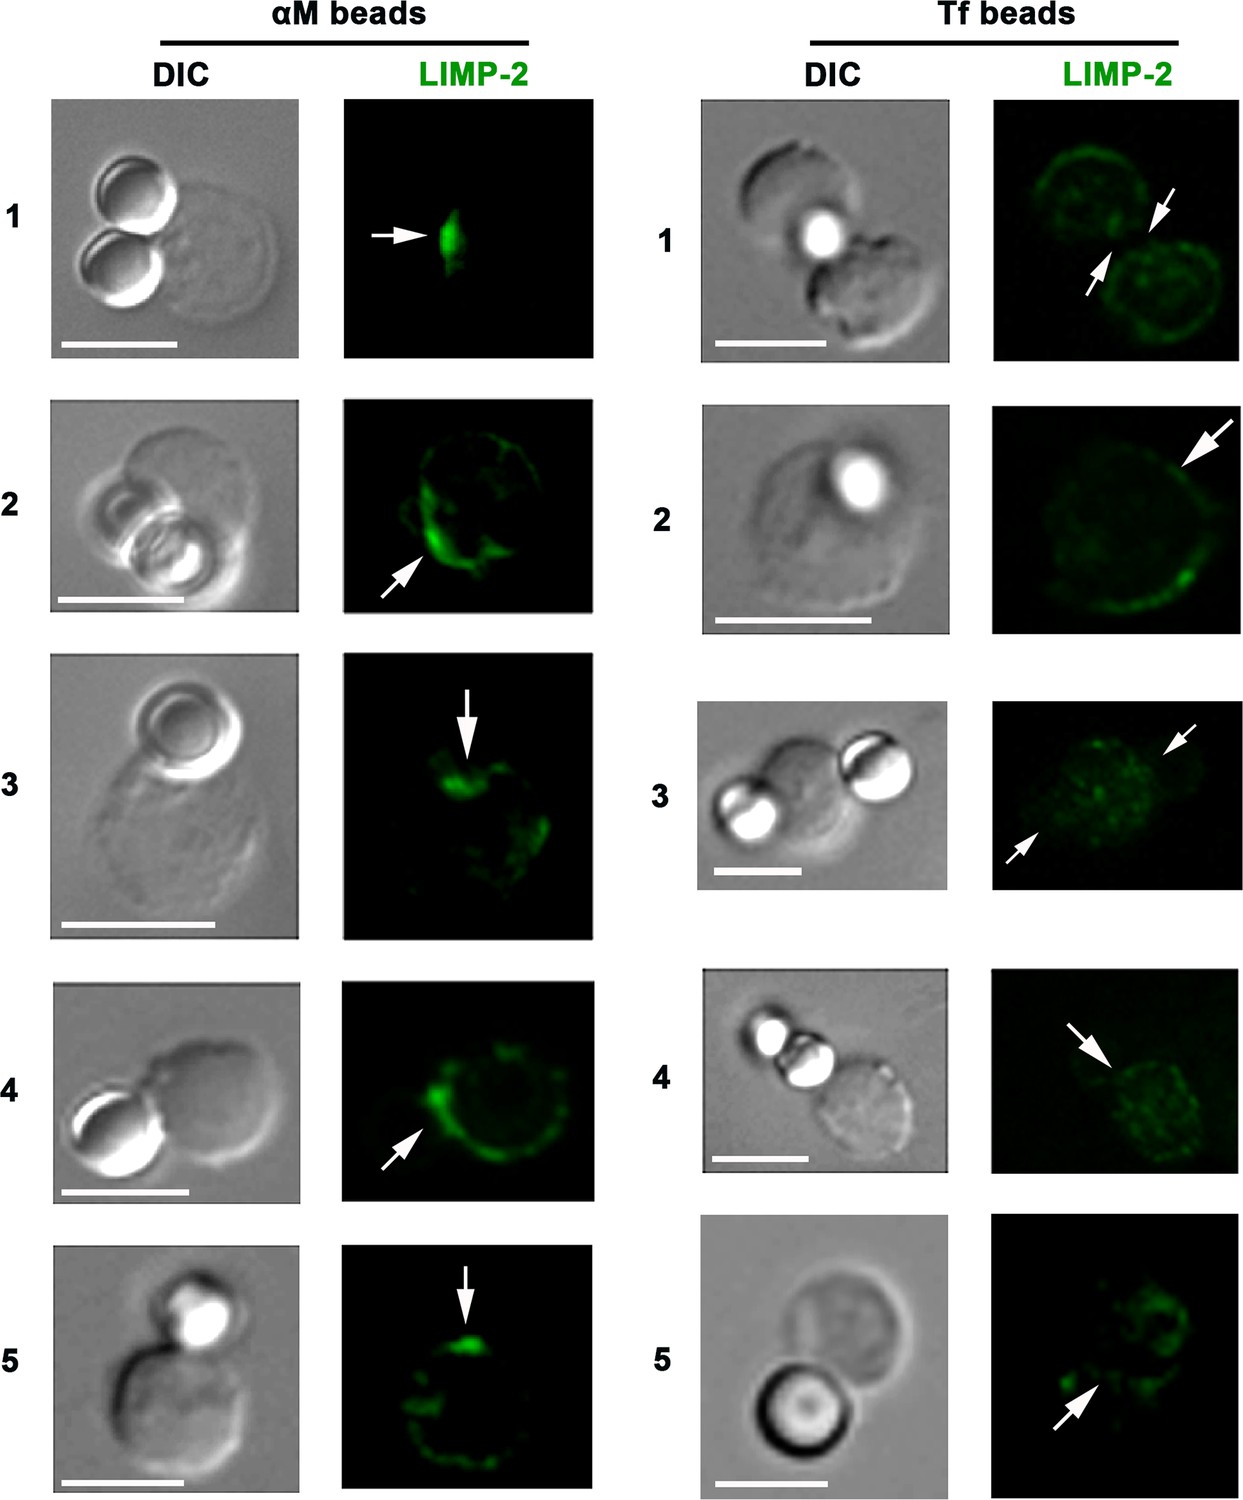
BCR-mediated binding of αM-beads induces surface exposure of the LIMP-2 luminal domain at bead contact sites.
The images show several examples of splenic B-cells incubated with αM (left)- or Tf (right)-beads for 30 min at 37 °C, stained with LIMP-2-specific antibodies (green) at 4 °C without detergent permeabilization, followed by fixation, staining with secondary antibodies, and analysis by confocal fluorescence microscopy. Arrows, sites of bead binding on B-cells. Bar, 5 μm.
Figure 5—figure supplement 2
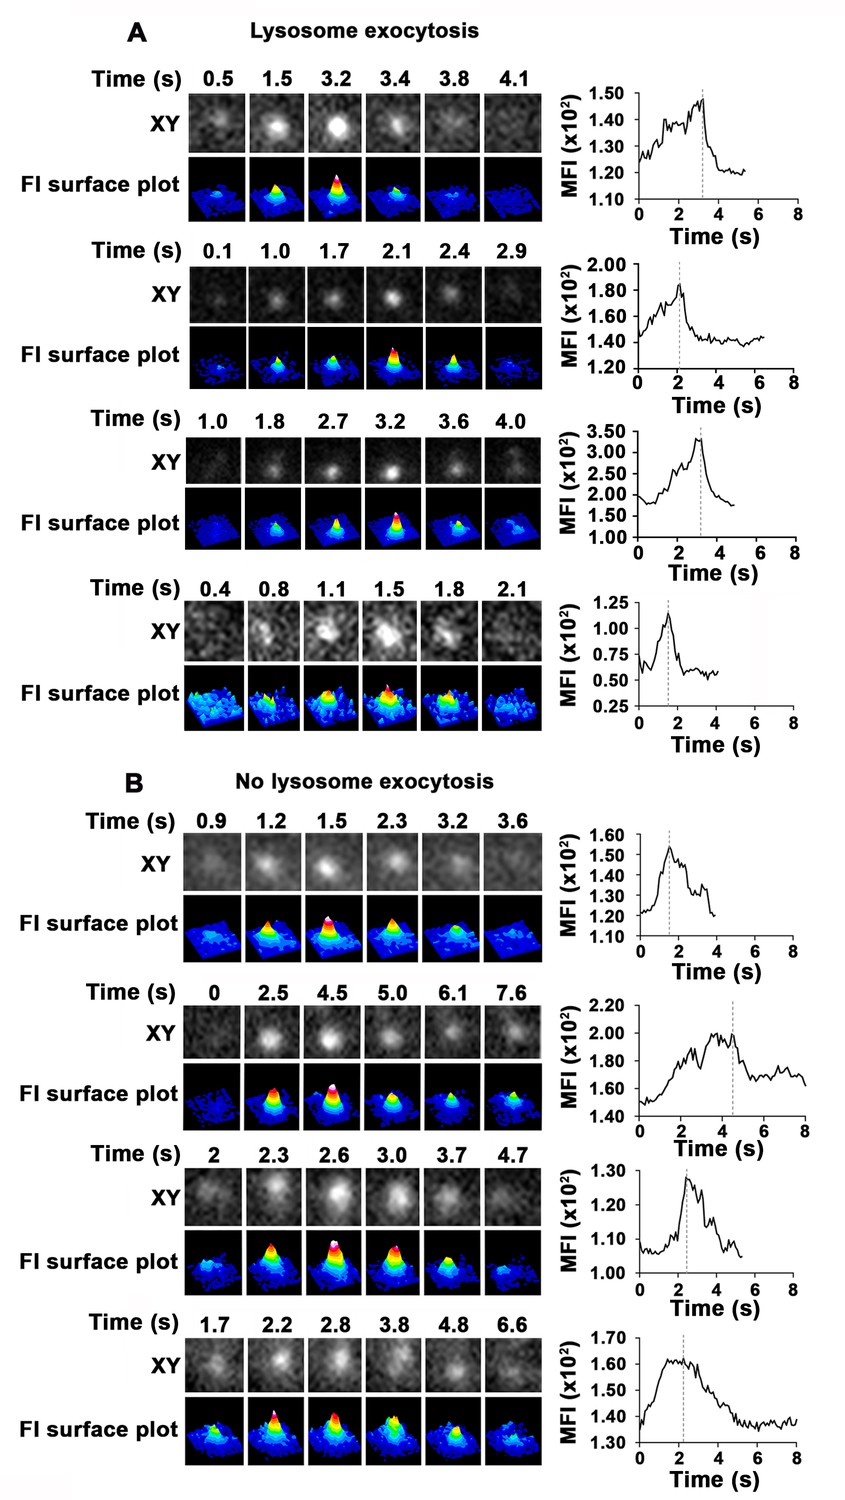
Detection of lysosomal exocytosis by TIRF microscopy.
Splenic B-cells were added to αM-PLB and imaged by TIRF at eight frames/s. Live time-lapse XY images of individual SiR-Lyso puncta (top rows), their FI surface plots (bottom rows), and MFI (plots on right) within the TIRF evanescent field over time are shown for four examples where lysosomal exocytosis occurred (A, rapid decrease in MFI, consistent with rapid dye loss upon PM fusion) or not (B, slow reduction in MFI, likely due to lysosome movement away from the PM).
Figure 6 with 2 supplements
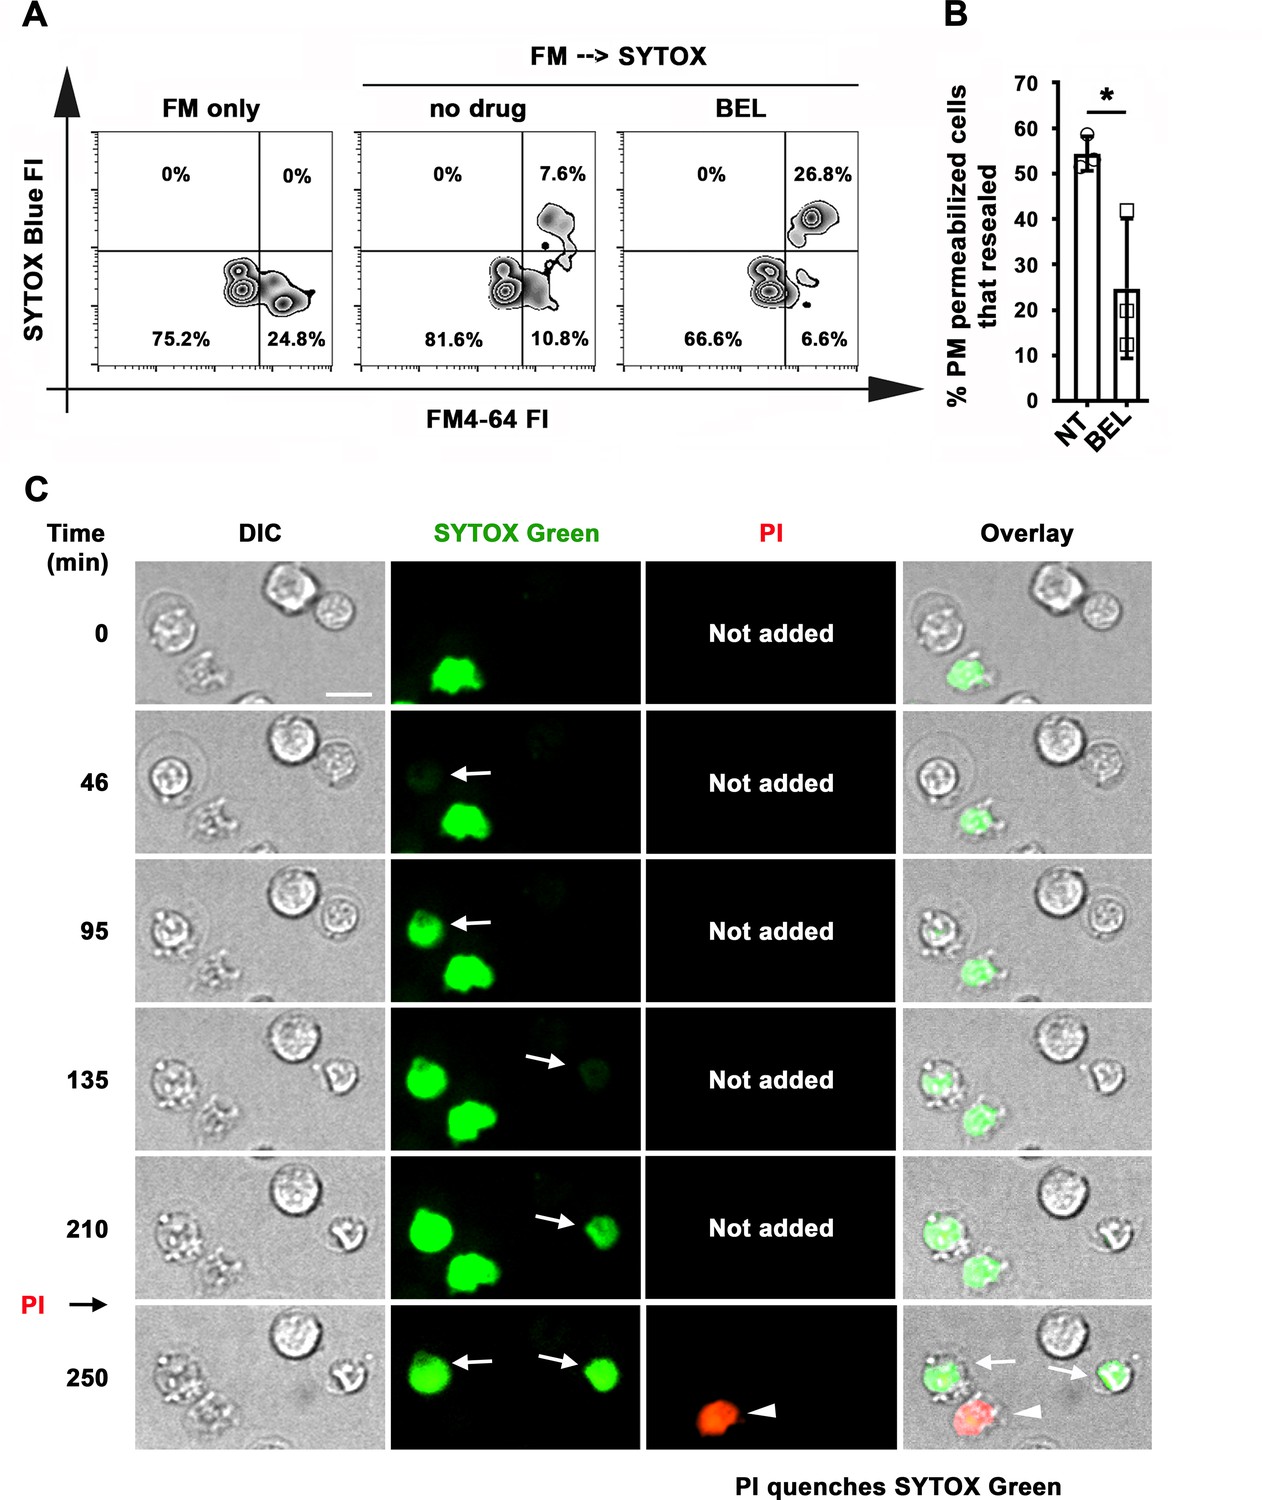
Antigen-permeabilized B-cells reseal their PM in a lysosomal exocytosis-dependent manner.
(A) B-cells were incubated with αM-beads and permeabilized/resealed cells were assessed by flow cytometry of FM4-64 (added from the start) and SYTOX Blue (added in the last 10 min) FI, in the presence or absence of BEL. (B) Percentages of permeabilized αM-bead-bound cells that resealed in the presence or absence of BEL. Data points represent independent experiments (mean ± SD). (C) Time-lapse images of splenic B-cells incubated with αM-PLB in the presence of SYTOX Green. PI was added for 10 min at the end (Video 11). Arrows, cells that became permeabilized after contacting the αM-PLB and later excluded PI; arrowhead, cell that was SYTOX + since the start of the video and did not exclude PI. *p ≤ 0.05, unpaired Student’s t-test (B). Bar, 5 μm.
Figure 6—figure supplement 1
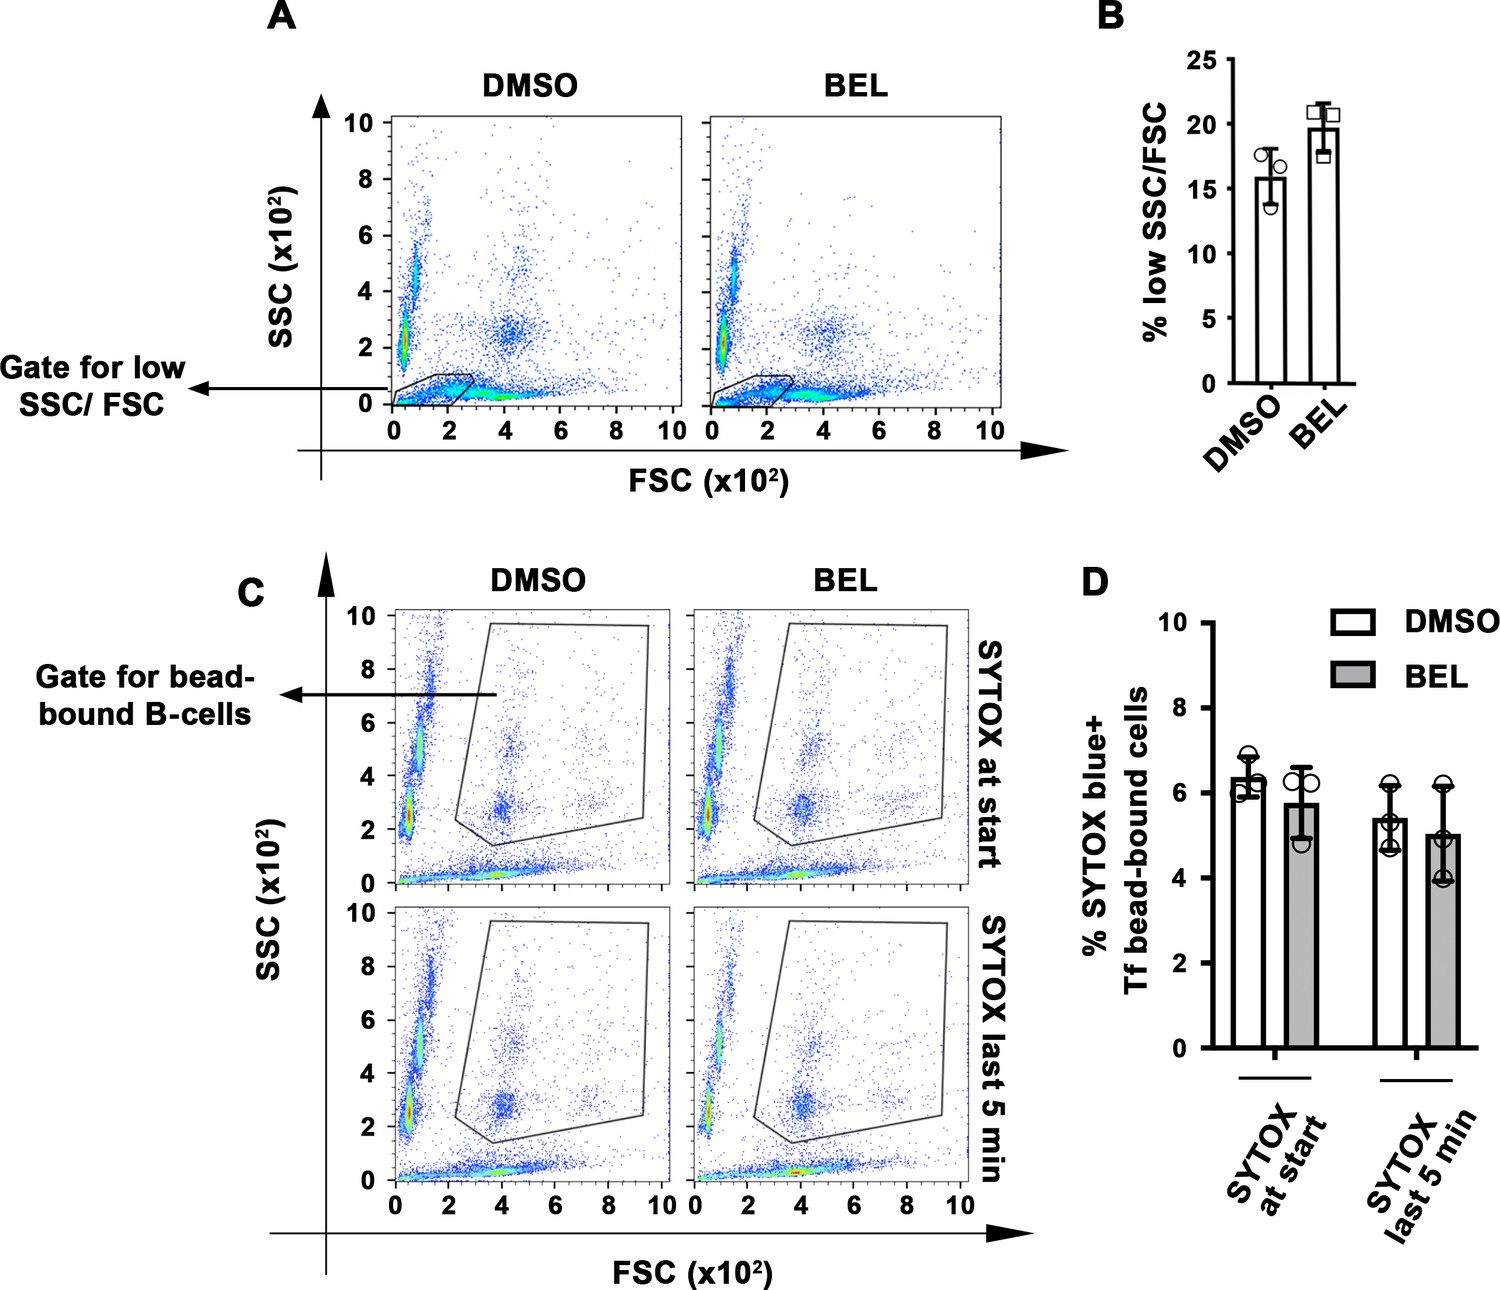
BEL does not affect the PM integrity and viability of B-cells.
Splenic B-cells were pretreated or not with BEL and incubated with αM-beads in the presence of FM4-64 and analyzed by flow cytometry. (A) Representative dot plots of side scatter (SSC) versus forward scatter (FSC) of B-cells incubated with αM-beads. Outlined areas indicate the low SSC/FSC populations that correspond to dead cells. (B) Percentage of low SSC/FSC B-cells incubated with αM-beads treated or not with BEL. Data points represent independent experiments (mean ± SD). (C) Representative dot plots of side scatter (SSC) versus forward scatter (FSC) of B-cells incubated with Tf-beads in the presence of SYTOX Blue throughout the experiment (30 min) or only in the last 5 min. Outlined areas indicate B-cell populations binding Tf beads. (D) Percentages of SYTOX Blue-positive (+) Tf-bead-bound cells. Data points represent independent experiments (mean ± SD). No statistically significant differences were detected (Student’s t-test).
Figure 6—figure supplement 2
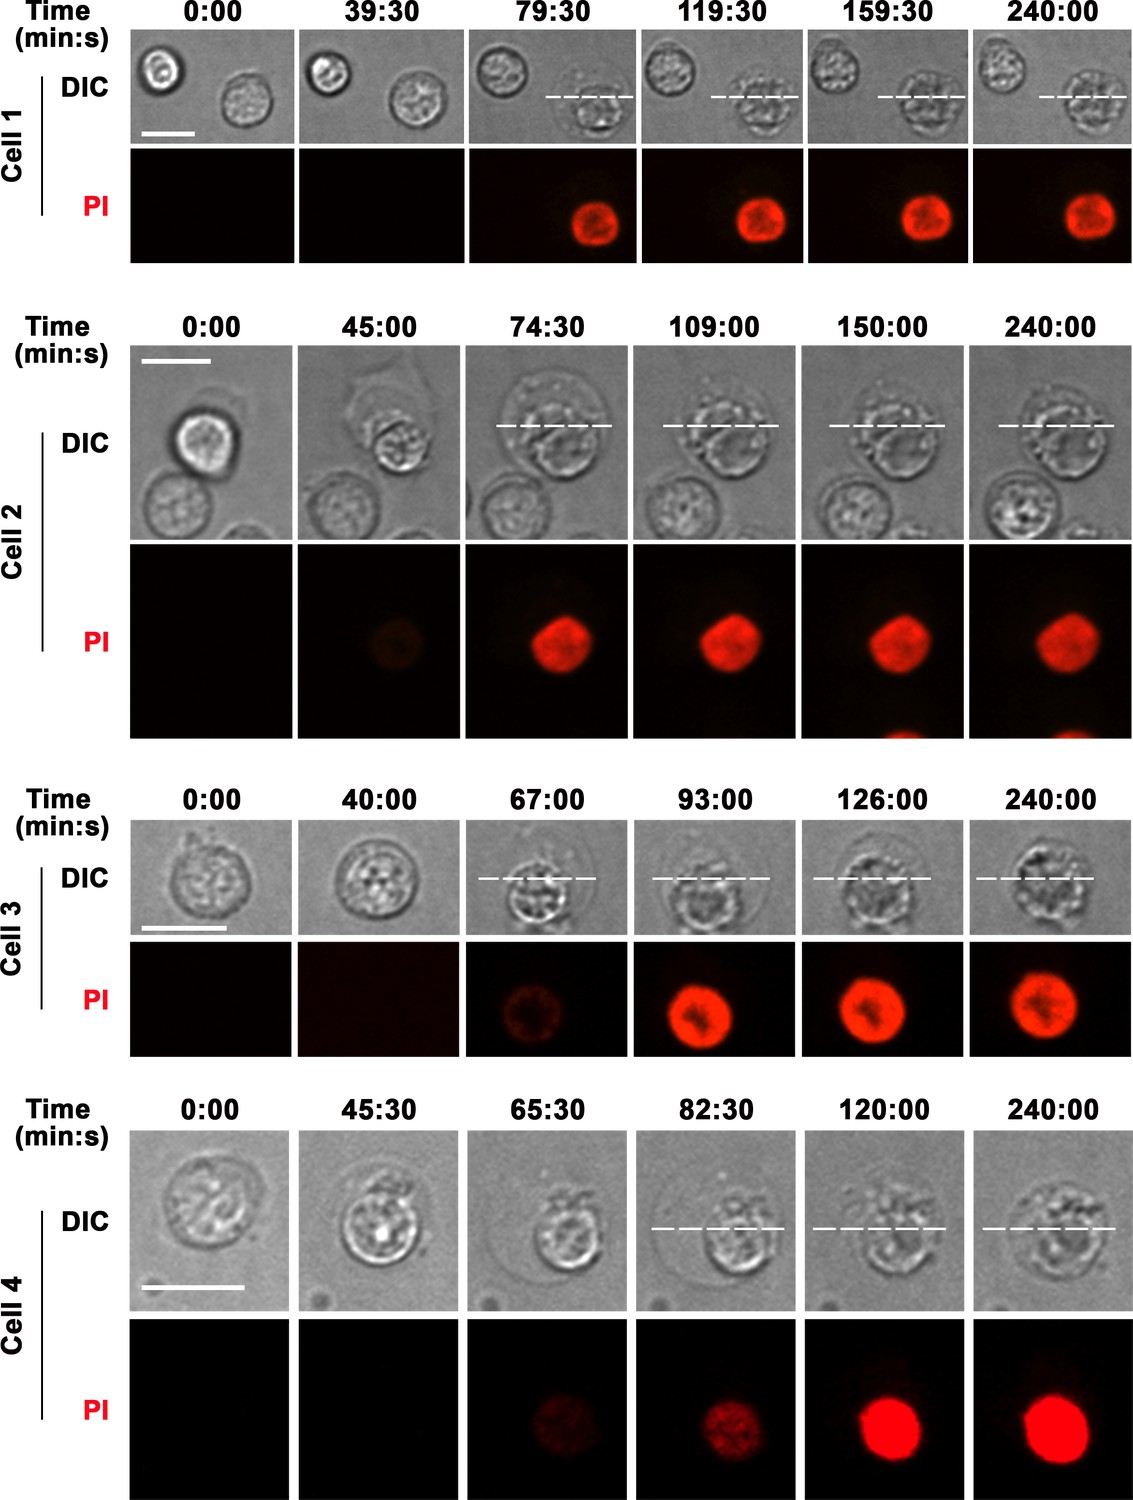
B-cell morphological changes occurring during permeabilization by surface-associated antigen are reversible.
Spinning disk time-lapse images of B-cells interacting with αM-PLB in the presence of PI (red). The dashed line indicates the maximum cell diameter initially reached by a B-cell that became permeabilized, allowing PI influx (Video 12). The later frames indicate that the cell gradually recovers its original morphology. Bars, 5 μm.
Figure 7
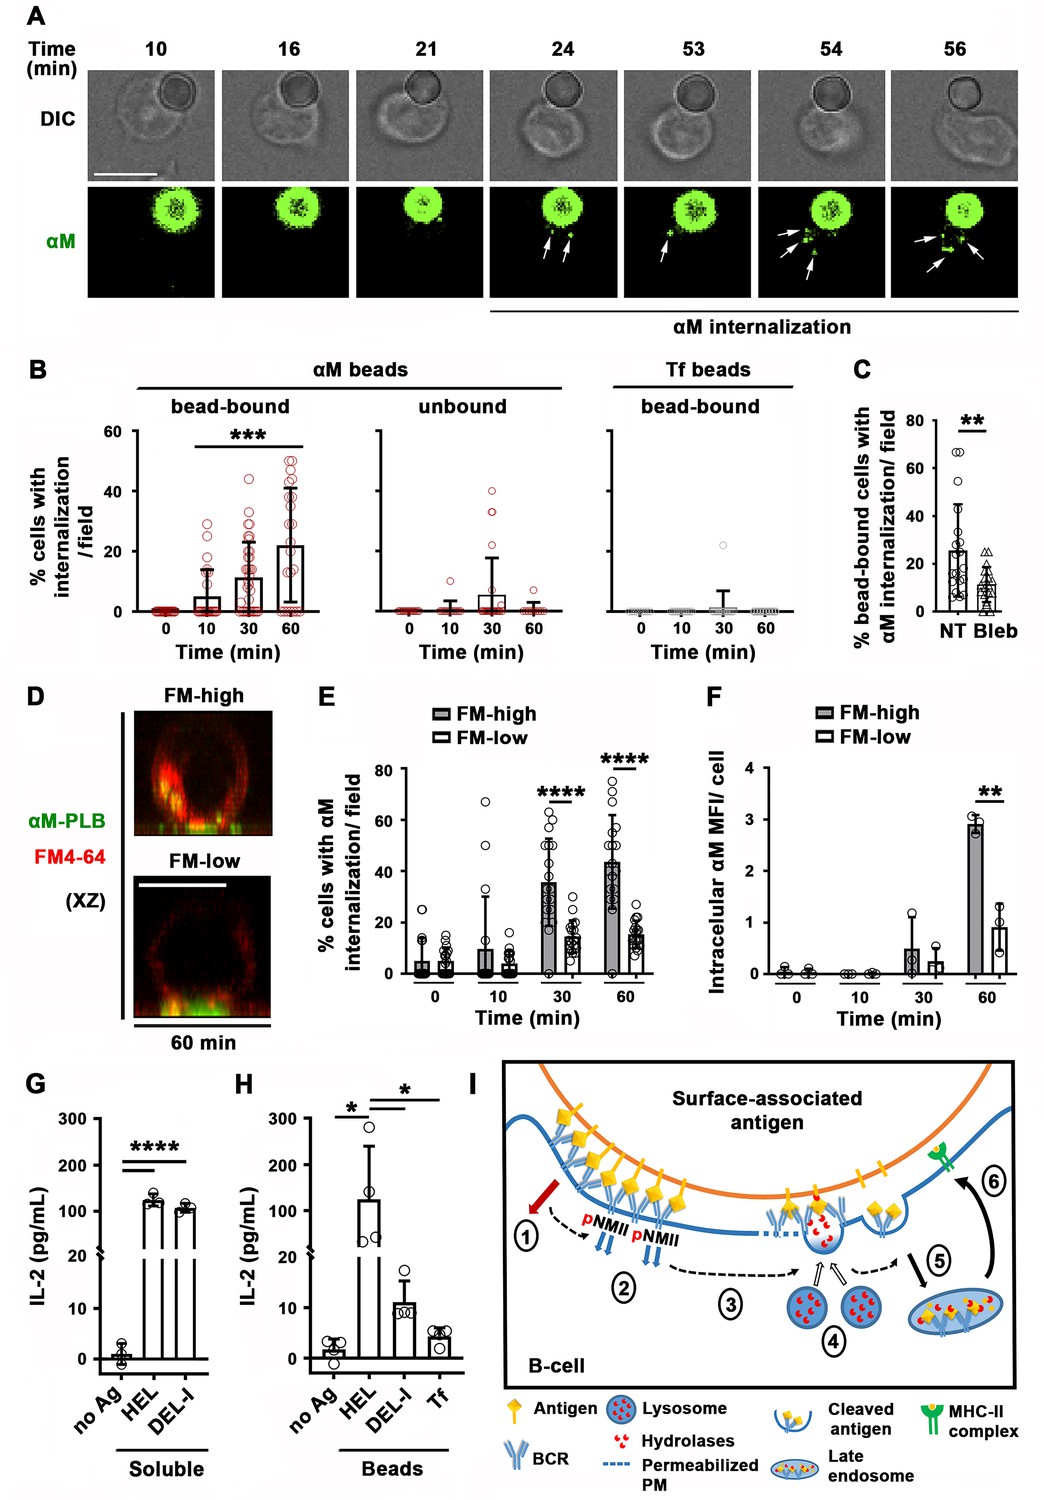
Antigen-induced PM permeabilization promotes antigen internalization and presentation.
(A) Confocal live imaging of a B-cell interacting with fluorescent αM-beads (arrows, internalized αM). (B) Percentages of cells containing internalized αM or Tf, bound or not to αM- or Tf-beads, over time. Data points represent individual fields in three independent experiments (mean ± SD). (C) Percentages of bead-bound B-cells with internalized αM in the presence or absence of Bleb after 60 min. Data points represent individual fields in four independent experiments (mean ± SD). (D) Confocal images (xz) of αM internalization in B-cells permeabilized (FM-high) or not permeabilized (FM-low) by αM-PLB after 60 min. (E) Percentages of B-cells, permeabilized (FM-high) or not permeabilized (FM-low) by αM-PLB, containing internalized αM over time. Data points represent individual fields in three independent experiments (mean ± SD). (F) MFI values of internalized αM in individual B-cells permeabilized (FM-high) or not (FM-low) by αM-PLB over time. Data points represent independent experiments (mean ± SD). (G) IL-2 secretion by 3A9 T-cells activated by B-cells incubated with or without (no Ag) soluble HEL or DEL-I (10 µg/ml) for 72 hr. Data points represent independent experiments (mean ± SD). (H) IL-2 secretion by 3A9 T-cells activated by B-cells incubated with or without HEL-, DEL-I- or Tf-beads (1:4 cell:bead ratio) for 72 hr. Bars, 5 μm. Data points represent independent experiments (mean ± SD). *p ≤ 0.05, **p ≤ 0.01, **p ≤ 0.005, ****p ≤ 0.0001, unpaired Student’s t-test (C, E, F), one-way ANOVA (G and H) or Kruskal-Wallis non-parametric test (B). (I) Cartoon depicting a working model for the spatiotemporal relationship of events initiated by the interaction of the BCR with surface-associated antigen. High-affinity binding stabilizes BCR-antigen interaction and induces strong BCR signaling (1) and NMII activation (2). Activated NMII generates local traction forces that permeabilize the PM (3), triggering a localized PM repair response mediated by lysosomal exocytosis. Lysosome exocytosis releases hydrolases that cleave antigen off surfaces (4), facilitating endocytosis (5) and presentation to T-cells (6).
Videos
Video 1
BCR binding to αM-beads permeabilizes the PM of splenic B-cells.
Splenic B-cells were incubated with αM-beads at 4 °C and warmed to 37 °C in a live imaging chamber with 5 % CO2 in DMEM-BSA. Time-lapse images were acquired for 60 min at one frame/15 s in the presence of PI (red) using a spinning disk fluorescence microscope (UltraVIEW VoX, PerkinElmer with a 63 × 1.4 N.A. oil objective). The arrow indicates the moment of PI entry. Time is displayed as hour: minutes: seconds. The video is displayed at 20 frames/s. Bar, 5 μm.
Video 2
BCR binding to αM-beads causes localized PM permeabilization in A20 B-cells (cell line).
A20 B-cells were incubated with αM-beads in a live imaging chamber at 37 °C with 5 % CO2 in DMEM/BSA. Time-lapse images were acquired for 65 min at one frame/20 s in the presence of PI using a spinning disk fluorescence microscope (UltraVIEW VoX, PerkinElmer with a 63 × 1.4 N.A. oil objective). The arrow points to the beads and the arrowhead points to the site of entry and subsequent flow of PI into the cell. Beads appear red as a result of autofluorescence. Time is displayed as hour: minutes: seconds. The video is displayed at 20 frames/s. Bar, 5 μm.
Video 3
Bead exchange between B-cells causes PM permeabilization.
Splenic B-cells were incubated with αM-beads in a live imaging chamber at 37 °C with 5 % CO2 in DMEM-BSA. Images were acquired for 60 min at one frame/30 s in the presence of PI using a spinning disk fluorescence microscope (UltraVIEW VoX, PerkinElmer with a 63 × 1.4 N.A. oil objective). The arrow points to the bead that was exchanged between cells (#1 and #2) and caused permeabilization of cell #2. Beads appear red as a result of autofluorescence. Time is displayed as hour: minutes: seconds. The video is displayed at 10 frames/s. Bar, 5 μm.
Video 4
Surface-associated ligand induces B-cell permeabilization and massive FM influx, while soluble ligand does not cause permeabilization but induces endocytosis, detected as puncta at the cell periphery.
Top: B-cells pre-labeled with FM1-43 (green) were added to αM-PLB (surface-associated ligand). Bottom: B-cells pre-labeled with FM1-43 (green) and anti-BCR antibodies followed by secondary fluorochrome-labeled crosslinking antibodies (magenta) (soluble ligand). Under both conditions, cells were imaged at 37 °C in the presence of FM1-43 (green), and PI (red) was added to detect PM permeabilization. Images were acquired for 60 min at one frame/30 s or 15 s using a spinning disk fluorescence microscope (UltraVIEW VoX, PerkinElmer with a 60 × 1.4 N.A. oil objective). Time is displayed as minutes: seconds after cells contacted αM-PLB. The white box indicates the intracellular area used to measure FI levels of intracellular FM1-43 (see Figure 1I and Figure 1—figure supplement 4). The arrow indicates the massive influx of FM1-43 in cells permeabilized during contact with αM-PLB. The arrowheads indicate areas where peripheral FM1-43 puncta (likely endosomes) were observed next to clusters of crosslinked BCR (magenta). The video is displayed at 20 frames/s. Bar, 5 μm.
Video 5
B-cell PM permeabilization during binding to αM-PLB enables membrane-impermeable Ponceau 4R to quench cytoplasmic CSFE fluorescence.
Splenic B cells pre-labeled with CFSE in the cytosol were added to αM-PLB in a live imaging chamber at 37 °C with 5 % CO2 in DMEM/BSA. Images were acquired for 60 min at one frame/10 s in the presence of Ponceau 4R using a spinning disk fluorescence microscope (UltraVIEW VoX, PerkinElmer with a 40 × 1.4 N.A. oil objective). The arrow indicates CFSE-labeled B-cells that lost their cytosolic fluorescence as a result of PM permeabilization and Ponceau 4R influx. Time is displayed as hour: minutes: seconds. The video is displayed at 30 frames/s. Bar, 5 μm.
Video 6
Binding of MD4 B-cells to COS-7 cells expressing surface mHEL-GFP induces antigen clustering and PM permeabilization at interaction sites.
MD4 splenic B-cells were incubated with mHEL-GFP-expressing COS-7 cells cultured on fibronectin-coated coverslips at 37 °C with 5 % CO2 in DMEM/BSA. Images were acquired for 120 min at one frame/20 s in the presence of PI using a spinning disk fluorescence microscope (UltraVIEW VoX, PerkinElmer with a 40 × 1.3 N.A. oil objective). Shown are representative videos of XY (top) and XZ (bottom) views showing clustering of mHEL-GFP (arrows) and the intracellular influx of PI (arrowheads) at cell interacting sites. Time is displayed as minutes: seconds after the cell contacted the mHEL-GFP expressing COS cell. The video is displayed at 15 frames/s. Bar, 5 μm.
Video 7
Binding of WT B-cells to COS-7 cells expressing surface mHEL-GFP does not induce antigen clustering and PM permeabilization at interaction sites.
WT splenic B-cells were incubated with mHEL-GFP-expressing COS-7 cells cultured on fibronectin-coated coverslips at 37 °C with 5 % CO2 in DMEM/BSA. Images were acquired for 120 min at one frame/20 s in the presence of PI using a spinning disk fluorescence microscope (UltraVIEW VoX, PerkinElmer with a 40 × 1.3 N.A. oil objective). Shown are representative videos of XY (top) and XZ (bottom) views. Time is displayed as minutes: seconds after the cell contacted the mHEL-GFP expressing COS cell. The video is displayed at 15 frames/s. Bar, 5 μm.
Video 8
The BCR polarizes towards antigen-binding sites before PM permeabilization.
Splenic B-cells stained with anti-BCR antibodies were added to αM-PLB and imaged in a live imaging chamber at 37 °C with 5 % CO2 in DMEM/BSA. Images were acquired for 60 min at one frame/20 s in the presence of FM4-64 using a spinning disk fluorescence microscope (UltraVIEW VoX, PerkinElmer with a 60 × 1.4 N.A. oil objective). Top: XZ view showing BCR (green) polarization towards the αM-PLB (white arrow). Bottom: XY view showing intracellular influx of FM4-64 (red, yellow arrow). Time is displayed as minutes: seconds after the cell contacted the αM-PLB. The video is displayed at 15 frames/s. Bar, 5 μm.
Video 9
BCR and phosphorylated non-muscle myosin II (pMLC) polarize towards αM-bead-binding sites on a B-cell.
Shown is a 3D representation of co-polarization of the BCR (red) and pMLC (green) towards the site of αM-bead (white) binding in a splenic B-cell. Z-stack images were acquired using a Zeiss LSM710 confocal fluorescence microscope (63 × 1.4 N.A. oil objective) and the 3D reconstruction was generated using Volocity software (PerkinElmer). Bar, 3 μm.
Video 10
A lysosomal exocytosis event detected by total internal reflection fluorescence (TIRF) microscopy.
Splenic B-cells preloaded with SiR-Lyso were incubated with αM-PLB in a coverslip chamber at 37 °C with 5 % CO2 in DMEM/BSA for 30 min. Time-lapse images were acquired for 20 min at eight frames/s using a TIRF microscope (NIKON Eclipse Ti-E TIRF, 63 × 1.49 NA oil objective). Top: TIRF images of a lysosome appearing in the TIRF evanescent field and then rapidly losing the SiR-Lyso signal due to fusion with the B-cell PM. Bottom: FI surface plot corresponding to the video on the top. Time is displayed in seconds. The video is displayed at 15 frames/s.
Video 11
B-cells exclude a second membrane-impermeable tracer after antigen-dependent permeabilization.
Splenic B-cells were added to αM-PLB and imaged in a live imaging chamber at 37 °C with 5 % CO2 in DMEM 2 % of FBS in the presence of SYTOX Green (green). Images were acquired for 4 hr at one frame/30 s using a spinning disk fluorescence microscope (UltraVIEW VoX, PerkinElmer with a 60 × 1.4 N.A. oil objective). PI (red) was added for 10 min at the end of the time-lapse image acquisition. The video is displayed as minutes: seconds after the cell contacted the αM-PLB. White arrows indicate cells that became permeabilized and later excluded PI. The yellow arrow indicates a cell that was stained by SYTOX Green since the beginning of the video and was not able to exclude PI. The video is displayed at 20 frames/s. Bar, 5 μm.
Video 12
B-cell morphological changes occurring during permeabilization by surface-associated antigen are reversible.
Splenic B-cells were added to αM-PLB and imaged in a live imaging chamber at 37 °C with 5 % CO2 in DMEM without phenol red containing 2 % FBS in the presence of PI (red). Images were acquired for 4 hr at one frame/30 s using a spinning disk fluorescence microscope (UltraVIEW VoX, PerkinElmer with a 60 × 1.4 N.A. oil objective). Time is displayed as minutes: seconds after the cells first contacted the αM-PLB. The arrow points to a cell that became permeabilized. The dashed line indicates the maximum diameter of the B-cell after permeabilization. The video is displayed at 20 frames/s. Bar, 5 μm.
Video 13
B-cell with polarized surface BCRs and containing fluorescent αM extracted from beads.
The surface BCRs of splenic B-cells were labeled with Cy3-Fab-donkey anti-mouse IgM+ G at 4 °C. Labeled B-cells were incubated with AF488-αM-beads at 37 °C with 5 % CO2 for 60 min and then fixed. Images were acquired using a Zeiss LSM710 (63 × 1.4 N.A. oil objective), and the 3D reconstruction was generated with Volocity software (PerkinElmer). The arrow points to internalized AF488-αM.
Tables
Key resources table
| Reagent type (species) or resource | Designation | Source or reference | Identifiers | Additional information |
|---|---|---|---|---|
| Cell line (Mus musculus) | A20 | ATCC | TIB-208 | B-cell lymphoma |
| Cell line (Mus musculus) | 3A9 | ATCC | CRL-3293 | T-cell hybridoma |
| Cell line (Cercopithecus aethiops) | COS-7 | ATCC | CRL-1651 | Kidney fibroblasts |
| Biological sample (Mus musculus) | WT (C57BL/6) | Jackson Laboratories | 000664 | Primary B-cells freshly isolated from C57BL/6’ spleen |
| Biological sample (Mus musculus) | MD4 (C57BL/6-Tg (IghelMD4)4Ccg/J) | Jackson Laboratories | 002595 | Primary B-cells freshly isolated from C57BL/6-Tg (IghelMD4)4Ccg/J’s spleen |
| Biological sample (Mus musculus) | B10.BR-H2K2 H2-T18a/ SgSnJJrep | Jackson Laboratories | 004804 | Primary B-cells freshly isolated from B10.BR-H2K2 H2-T18a/ SgSnJJrep’s spleen |
| Antibody | Anti-phosphotyrosine mAb 4G10 (mouse monoclonal) | Millipore | 05–321 | 1:500 |
| Antibody | AF488-anti-mouse IgG2b (goat polyclonal) | Thermo Fisher Scientific | A-21141 | 1:500 |
| Antibody | AF647-anti-goat IgG (H + L) (donkey polyclonal) | Invitrogen | A21447 | 10 µg/ml |
| Antibody | Anti-cleaved caspase-3 (Asp175) (rabbit polyclonal) | Cell Signaling | 9661T | 1:500 |
| Antibody | Cy5-Fab anti-mouse IgG (donkey polyclonal) | Jackson ImmunoResearch | 715-175-151 | 5 µg/ml |
| Antibody | AF488-anti-rabbit IgG (H + L) highly cross-adsorbed secondary antibody (donkey polyclonal) | Thermo FisherScientific | A-21206 | 1:200 |
| Antibody | Anti-BTK (rabbit monoclonal) | Cell Signaling | 8,547 | 1:1,000 |
| Antibody | Anti-phospho-BTK (rabbit monoclonal) | Abcam | 68,217 | 1:500 |
| Antibody | HRP-anti-rabbit (goat polyclonal) | Jackson Immune Research | 111-035-144 | 1:1,000 |
| Antibody | Cy3-Fab-anti– mouse IgM+ G (goat polyclonal) | Jackson Immune Research | 115-165-166 | 1:200 |
| Antibody | Anti-phosphorylated myosin light chain (pMLC) (rabbit polyclonal) | Cell Signaling | 3,671 S | 1:50 |
| Antibody | AF633-anti-rabbit IgG (goat polyclonal) | Invitrogen | A-21070 | 1:500 |
| Antibody | Anti-LIMP-2 (rabbit polyclonal) | Sigma-Aldrich | SAB3500449- 100UG | 1:200 |
| Antibody | AF488 donkey-anti-rabbit IgG (donkey polyclonal) | Life technology | A32790 | 1:200 |
| Antibody | Anti-CD90.2 (rat monoclonal) | Biolegend | 105,310 | 1 µl/ 2 × 10⁶ cells |
| Antibody | αM (F(ab’)2 goat-anti-mouse IgM+ G) (goat polyclonal) | Jackson Immune Research | 115-006-068 | Binds to BCR |
| Antibody | AF488-αMAffiniPure F(ab')₂ fragments of anti- mouse IgG (H + L) (goat polyclonal) | Jackson Immune Research | 115-546-003 | Binds to BCR |
| Antibody | Biotin-SP (long spacer)-conjugated Fab fragments of anti-mouse IgG (H + L) (goat polyclonal) | Jackson Immune Research | 115-067-003 | |
| Commercial assay or kit | SiR-Lysosome and Verapamil | Cytoskeleton | CY-SC012 | Lysosome probe1 µM and 10 µM |
| Commercial assay or kit | IL-2 ELISA kit | Biolegend | 431,804 | |
| Commercial assay or kit | BCA kit | Thermo Fisher Scientific | 23,235 | Protein measurement during bead preparation |
| Software, algorithm | Volocity Suite | PerkinElmer | https://ir.perkinelmer.com/news-releases/news-release details/perkinelmer- launches-volocityr- 60-high-performance- 3d-cellular | |
| Software, algorithm | NIH Image J | NIH | https://imagej.nih.gov/ij/ | |
| Software, algorithm | MATLAB | MathWorks | https://www.mathworks.com/products/matlab.html | |
| Software, algorithm | Prism | GraphPad | https://www.graphpad.com/scientific-software/prism/ | |
| Chemical compound, drug | Staurosporine | Abcam | 120,056 | Apoptosis induction(1 µM) |
| Chemical compound, drug | PP2 | Millipore-Sigma | 529,573 | Src kinase inhibitor(5 µM) |
| Chemical compound, drug | AVL-292 | Selleckchem | S7173 | BTK inhibitor(10 nM) |
| Chemical compound, drug | BEL (Bromoenol lactone) | Sigma-Aldrich | B1552 | 12 µM |
| Chemical compound, drug | Blebbistatin | Sigma-Aldrich | B0560 | 50 µM |
| Chemical compound, drug | Latex NH2-beads | Polysciences | 17145–5 | |
| Chemical compound, drug | HEL (hen egg lysozyme) | Sigma-Aldrich | L6876 | Binds to BCR from MD4 mice |
| Chemical compound, drug | DEL-1 (duck egg lysozyme) | David B. Langley and Daniel Christ laboratory | Binds to BCR from MD4 mice | |
| Chemical compound, drug | Tf (holo- transferrin) | Sigma-Aldrich | T0665-50MG | Binds to transferrin receptor |
| Chemical compound, drug | Biotinylated transferrin (Tf-PLB) | Sigma-Aldrich | T3915-5MG | |
| Chemical compound, drug | Streptavidin- conjugated Yellow- Green latex beads | Polysciences | 24159–1 | |
| Chemical compound, drug | Propidium iodide | Sigma-Aldrich | P4170-10MG | 50 µg/ml |
| Chemical compound, drug | FM1-43FX | Thermo Fisher Scientific | F35355 | 10 µg/ml |
| Chemical compound, drug | FM4-64FX | Thermo Fisher Scientific | F34653 | 10 µg/ml |
| Chemical compound, drug | SYTOX Blue | Invitrogen | S11348 | 300 nM |
| Chemical compound, drug | SYTOX Green | Invitrogen | S7020 | 300 nM |
| Chemical compound, drug | Guinea pig complement | Innovative Research | IGGPCSER | 100 µl/ 4 × 10⁷ cells |
| Chemical compound, drug | 1,2-dioleoyl-sn- glycero-3-phosphocholine | Avanti Polar Lipids | 850375 P | 5 mM (PLB) |
| Chemical compound, drug | 1,2-dioleoyl-sn-glycero-3- phospho ethanolamine-cap-biotin | Avanti Polar Lipids | 870273 C | 50 µM (PLB) |
| Chemical compound, drug | Ponceau 4R | Sigma-Aldrich | 18,137 | 1 mM |
| Chemical compound, drug | CFSE | Thermo Fisher Scientific | C34553 | 1 µM |
| Chemical compound, drug | Lipofectamine 3,000 | Thermo Fisher Scientific | L3000008 | |
| Chemical compound, drug | Bovine fibronectin | Millipore | 341,631 | 5 mg/ml |
| Chemical compound, drug | AF88-Tf (transferrin from human serum, Alexa Fluor 488 conjugate) | Thermo Fisher Scientifc | T13342 | Binds to transferrin receptor |
| Transfected construct (Cercopithecus aethiops) | mHEL-GFP | Michael R. Gold laboratory | Wang et al., 2018a (DOI: 10.1007/978-1-4939-7474-0_10) | Wild-type HEL protein, the complete EGFP protein, the transmembrane region of H-2Kb, and the 23-amino acid cytoplasmic domain of H-2Kb |
Additional files
-
Transparent reporting form
- https://cdn.elifesciences.org/articles/66984/elife-66984-transrepform1-v2.pdf
-
Source code 1
iBTK inhibits BTK phosphorylation in activated B-cells.
Western blot analysis of pBTK (A) and BTK (B, regular exposure image; C, overexposed image) in mouse splenic B-cells incubated with HEL-beads in the presence or absence of a BTK inhibitor (iBTK) for 30 min.
- https://cdn.elifesciences.org/articles/66984/elife-66984-supp1-v2.zip
-
Source code 2
iBTK inhibits BTK phosphorylation in activated B-cells.
Western blot analysis of pBTK (A) and BTK (B, regular exposure image; C, overexposed image) in mouse splenic B-cells incubated with HEL-beads in the presence or absence of a BTK inhibitor (iBTK) for 30 min.
- https://cdn.elifesciences.org/articles/66984/elife-66984-supp2-v2.zip
-
Source code 3
iBTK inhibits BTK phosphorylation in activated B-cells.
- https://cdn.elifesciences.org/articles/66984/elife-66984-supp3-v2.zip
Download links
A two-part list of links to download the article, or parts of the article, in various formats.
Downloads (link to download the article as PDF)
Open citations (links to open the citations from this article in various online reference manager services)
Cite this article (links to download the citations from this article in formats compatible with various reference manager tools)
Surface-associated antigen induces permeabilization of primary mouse B-cells and lysosome exocytosis facilitating antigen uptake and presentation to T-cells
eLife 10:e66984.
https://doi.org/10.7554/eLife.66984


