Developmental patterning function of GNOM ARF-GEF mediated from the cell periphery
- Institute of Science and Technology Austria, Austria
- Plant Breeding and Acclimatization Institute – National Research Institute, Poland
Figures
Figure 1 with 11 supplements
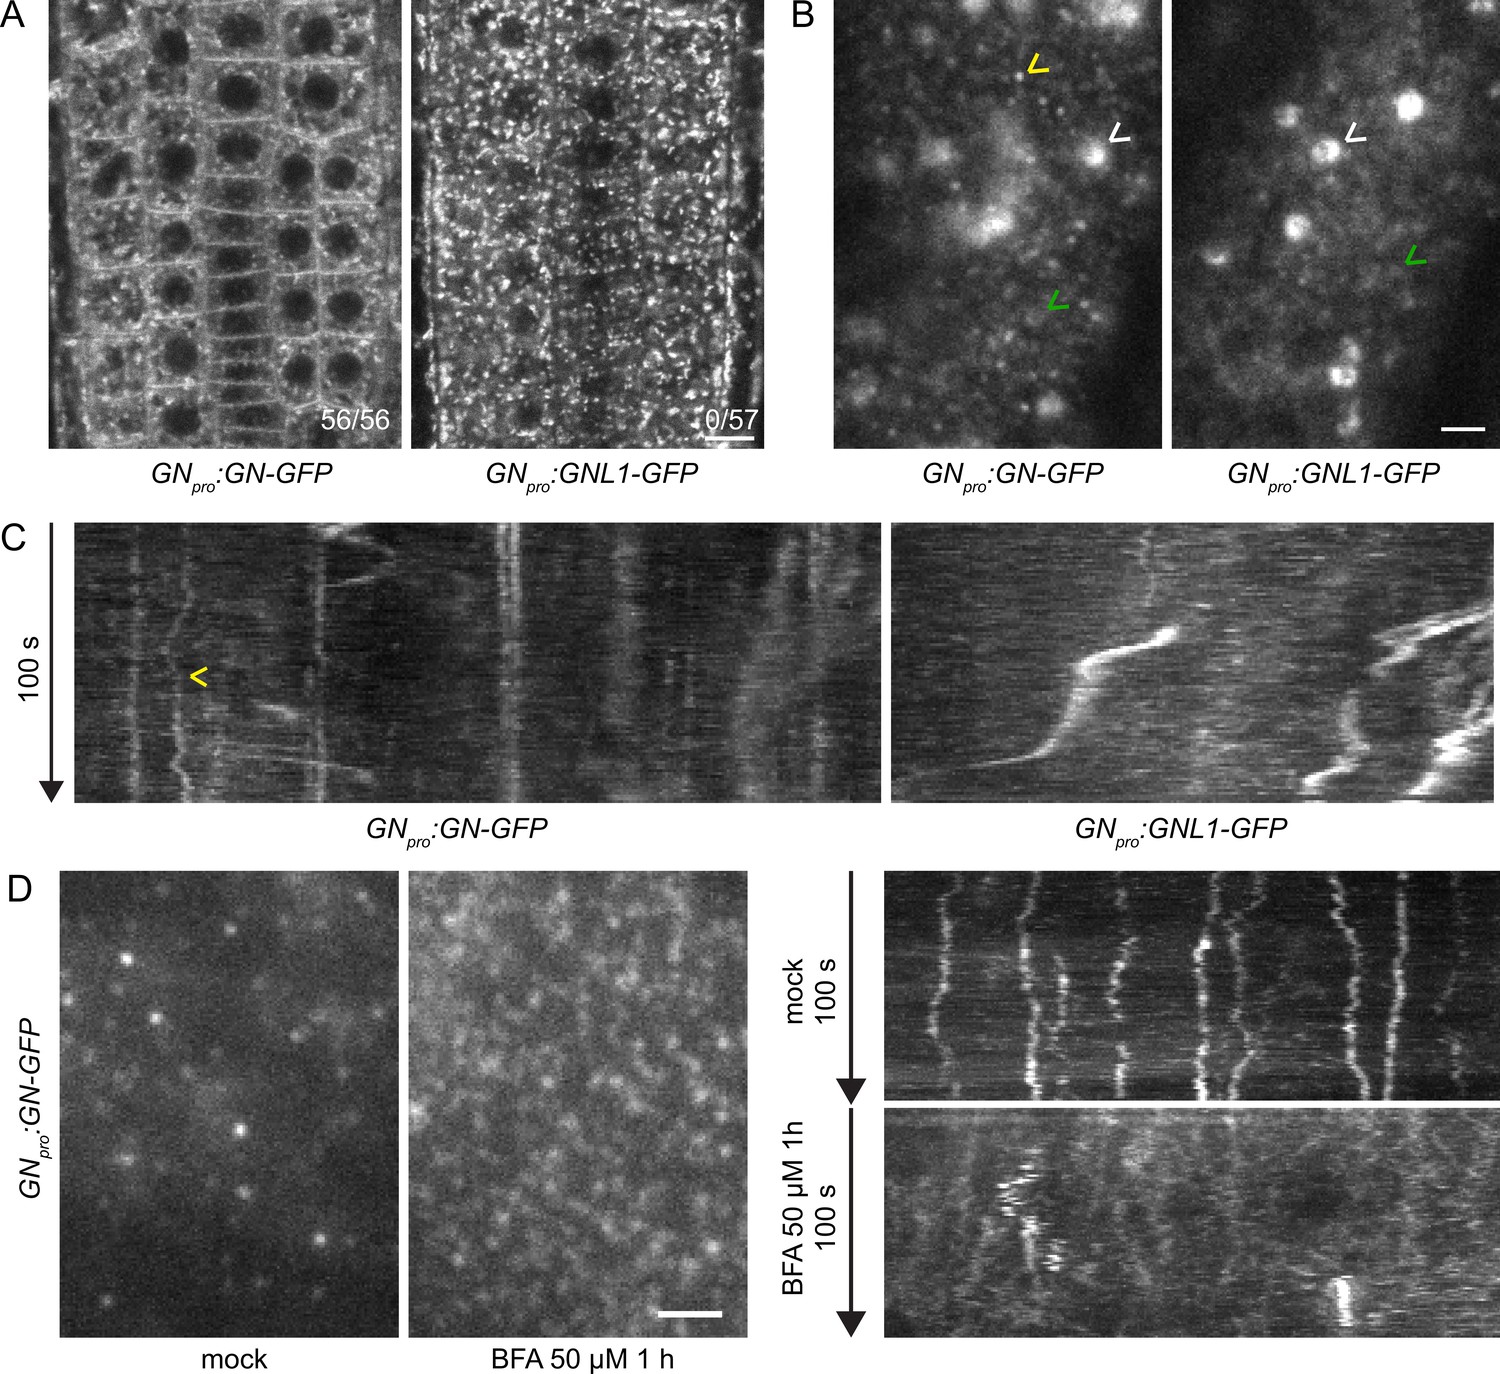
GN localizes to the cell periphery at often stable punctate structures.
(A) CLSM images of GN-GFP and GNL1-GFP in the epidermis of seedling RAMs. In contrast with GNL1-GFP, GN-GFP localizes to the PM. Numbers in bottom right indicate ratios of RAMs with PM signals. Images are representative of data from two independent transgenic lines. Scale bar – 10 µm. (B) TIRF images of GN-GFP and GNL1-GFP in the epidermis of early elongation zone of seedling roots. In contrast with GNL1-GFP, the PM signal of GN-GFP consists of relatively bright punctate structures (yellow arrowhead). Both GN-GFP and GNL1-GFP are seen at the GA (white arrowheads) and are present as dynamic, weakly labeled entities likely located in the cytoplasm (green arrowheads). Scale bar – 2 µm. (C) Kymograph maximum projections of 15 µm sections from TIRF movies of GN-GFP and GNL1-GFP, showing GN-GFP-positive punctate structures (arrowhead). The structures are typically characterized by high stability and tend to exhibit limited lateral movement in the plane of the PM. Presence of signals exhibiting any stability is rare in GNL1-GFP. Thick, irregular shapes in both movies are traces of GA moving in the cytoplasm. (D) TIRF images and kymograph maximum projections of 15 µm sections of TIRF movies of GN-GFP expressed in GNpro:GN-GFP VAN3pro:VAN3-mRFP, captured in etiolated hypocotyl epidermis following a treatment with BFA at 50 µM for 1 hr. After a treatment with BFA, the stable structures are mostly lost, and punctate signals of high density and typically brief lifetimes are observed. Scale bar - 2 µm.
Figure 1—figure supplement 1

gns mutant complementation data.
Seedlings (A) and adults (B) of gns complemented by GNpro:GN-GFP. No complementation of gns by GNpro:GNL1-GFP (C). (D) Root hair positioning in gns complemented by GNpro:GN-GFP, GNpro:GNfwr-GFP and GNpro:LGG-GFP. Graph shows collated data from two experiment repetitions, each data point representing one root hair. Numbers indicate means ± s.d. Scale bar – 20 µm. (E) Root lengths of 8 d old gns complemented by GNpro:GN-GFP and GNpro:GNfwr-GFP. Col-0: 3.82±0.99 cm, n=32; GNpro:GN-GFP L1: 3.85±0.74 cm, n=34, L2: 4.52±0.36 cm, n=32; GNpro:GNfwr-GFP L1: 4.03±1.07 cm, n=29, L2: 4.37±1.07 cm, n=29. Values were compared using One-way ANOVA (p=0.0038) with post-hoc Tukey HSD test, groups of significantly different values are indicated.
Figure 1—figure supplement 2

GN-GFP and GNL1-GFP subcellular localization data from two transgenic lines analyzed.
CLSM (A) and TIRF (B) images of GN-GFP and GNL1-GFP from two transgenic lines analyzed. Scale bars – (A) 10 µm, (B) 2 µm.
Figure 1—figure supplement 3

TIRF colocalization of GN-GFP and VAN3-mRFP following a BFA treatment.
TIRF colocalization of GN-GFP with VAN3-mRFP in etiolated hypocotyl epidermis, following a treatment with BFA at 50 µM for 1 hr. The BFA-induced, dense and dynamic punctate signals of GN-GFP do not evidently colocalize with VAN3-mRFP at the PM. Scale bar - 2 µm.
Figure 1—figure supplement 4
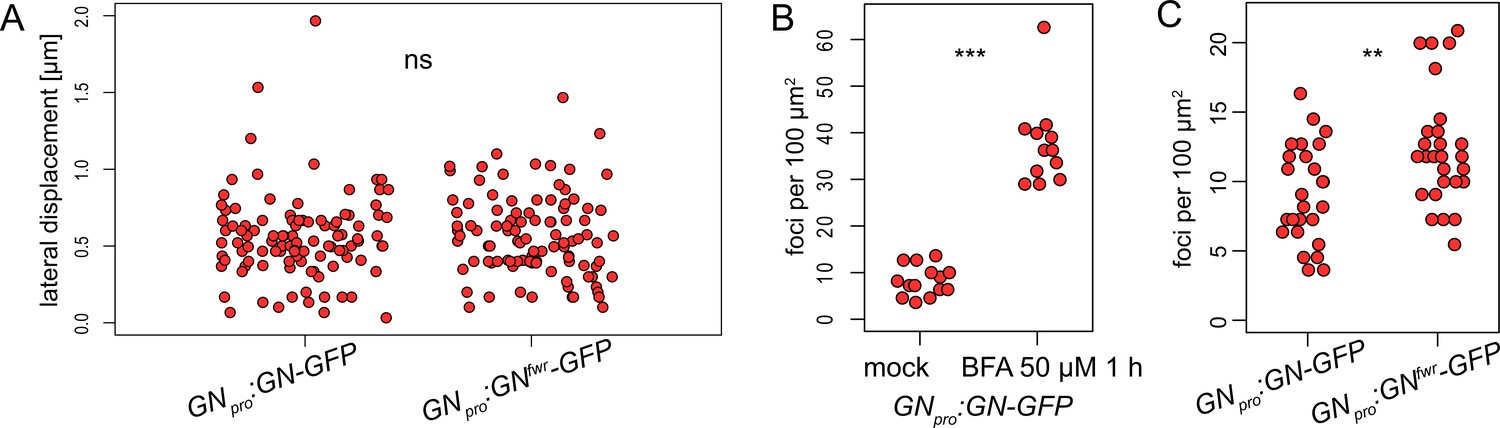
Quantitative data on GN-positive peripheral structures.
(A) Lateral displacement of individual GN-GFP and GNfwr-GFP structures estimated from kymograph maximum projections of TIRF movies. GN-GFP: 0.555±0.280 µm (mean ± s.d.), n=103; GNfwr-GFP: 0.566±0.264 µm, n=102. Values were compared using a t test, ns - not significant. (B) Density of GN-GFP signals in control conditions and following a treatment with BFA at 50 µM for 1 hr. Control: 8.29±3.20 foci per 100 µm2 (mean ± s.d.), n=14; BFA: 37.49±9.14 foci per 100 µm2, n=12. Values were compared using a t test, *** p<0.001. (C) Density of GN-GFP and GNfwr-GFP signals. GN-GFP: 9.11±3.51 foci per 100 µm2 (mean ± s.d.), n=26; GNfwr-GFP: 12.40±4.19 foci per 100 µm2, n=27. Values were compared using a t test, ** p<0.01.
Figure 1—video 1
TIRF time lapse of GN-GFP in seedling root epidermis.
Scale bar - 10 μm.
Figure 1—video 2
TIRF time lapse of GNL1-GFP in seedling root epidermis.
Scale bar - 10 μm.
Figure 1—video 3
TIRF time lapse of GN-GFP in hypocotyl epidermis following a mock treatment.
Scale bar - 10 μm.
Figure 1—video 4
TIRF time lapse of GN-GFP in hypocotyl epidermis following a treatment with BFA 50 µM for 1 hr.
Scale bar - 10 μm.
Figure 1—video 5
TIRF time lapse colocalization of GNOM-GFP and VAN3-mRFP in hypocotyl epidermis following a treatment with BFA 50 µM for 1 hr, green channel.
Scale bar - 10 μm.
Figure 1—video 6
TIRF time lapse colocalization of GNOM-GFP and VAN3-mRFP in hypocotyl epidermis following a treatment with BFA 50 µM for 1 hr, red channel.
Scale bar - 10 μm.
Figure 1—video 7
TIRF time lapse colocalization of GNOM-GFP and VAN3-mRFP in hypocotyl epidermis following a treatment with BFA 50 µM for 1 hr, merged channels.
Scale bar - 10 μm.
Figure 2 with 2 supplements
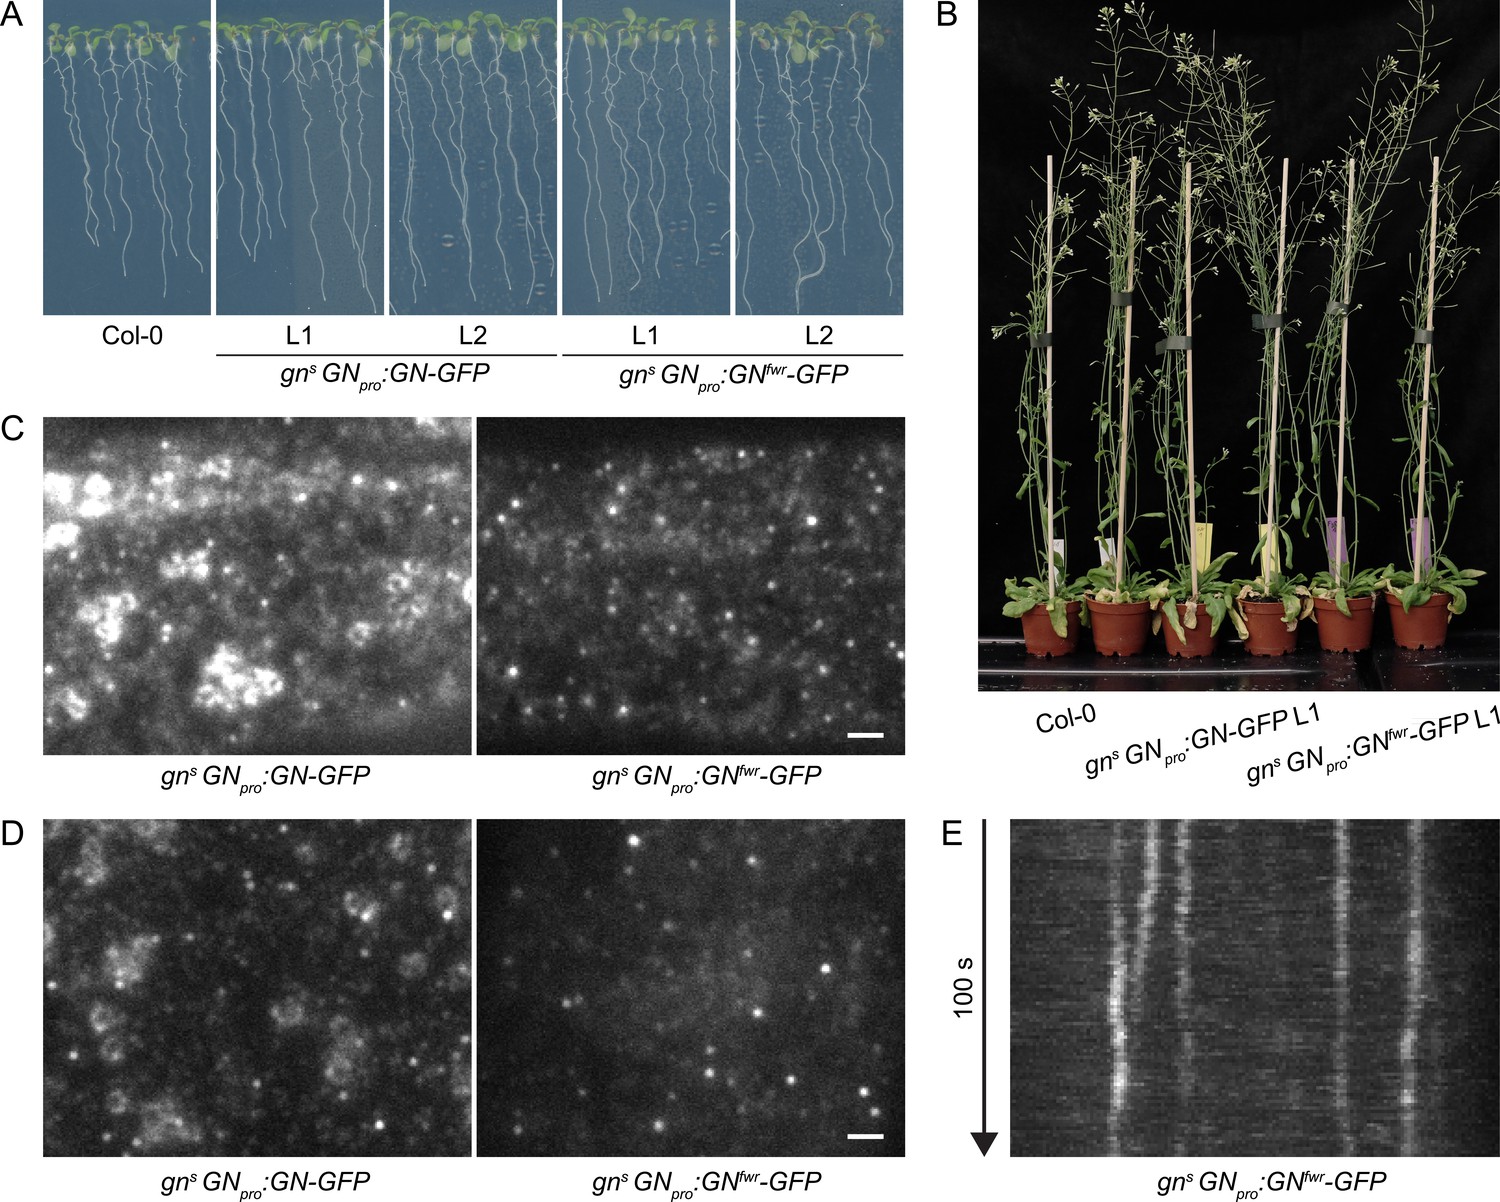
A functional GNfwr-GFP variant localizes to punctate structures at the cell periphery, but not to the GA.
(A) Eight-day-old seedlings of gns mutants complemented with GNpro:GN-GFP and GNpro:GNfwr-GFP transgenes. Two independent lines of each complemented mutant are shown. (B) Adult gns mutants complemented with GNpro:GN-GFP and GNpro:GNfwr-GFP transgenes. (C) and (D) TIRF images of GN-GFP and GNfwr-GFP expressed in complemented gns background in hypocotyls of etiolated seedlings (C) and in early elongation zone of seedling roots (D). GNfwr localizes to GN-specific structures at the PM, but not to the GA. Scale bars – 2 µm. (E) Kymograph maximum projection of a 15 µm section from a TIRF movie of GNfwr-GFP showing stable, PM-localized punctate structures.
Figure 2—figure supplement 1
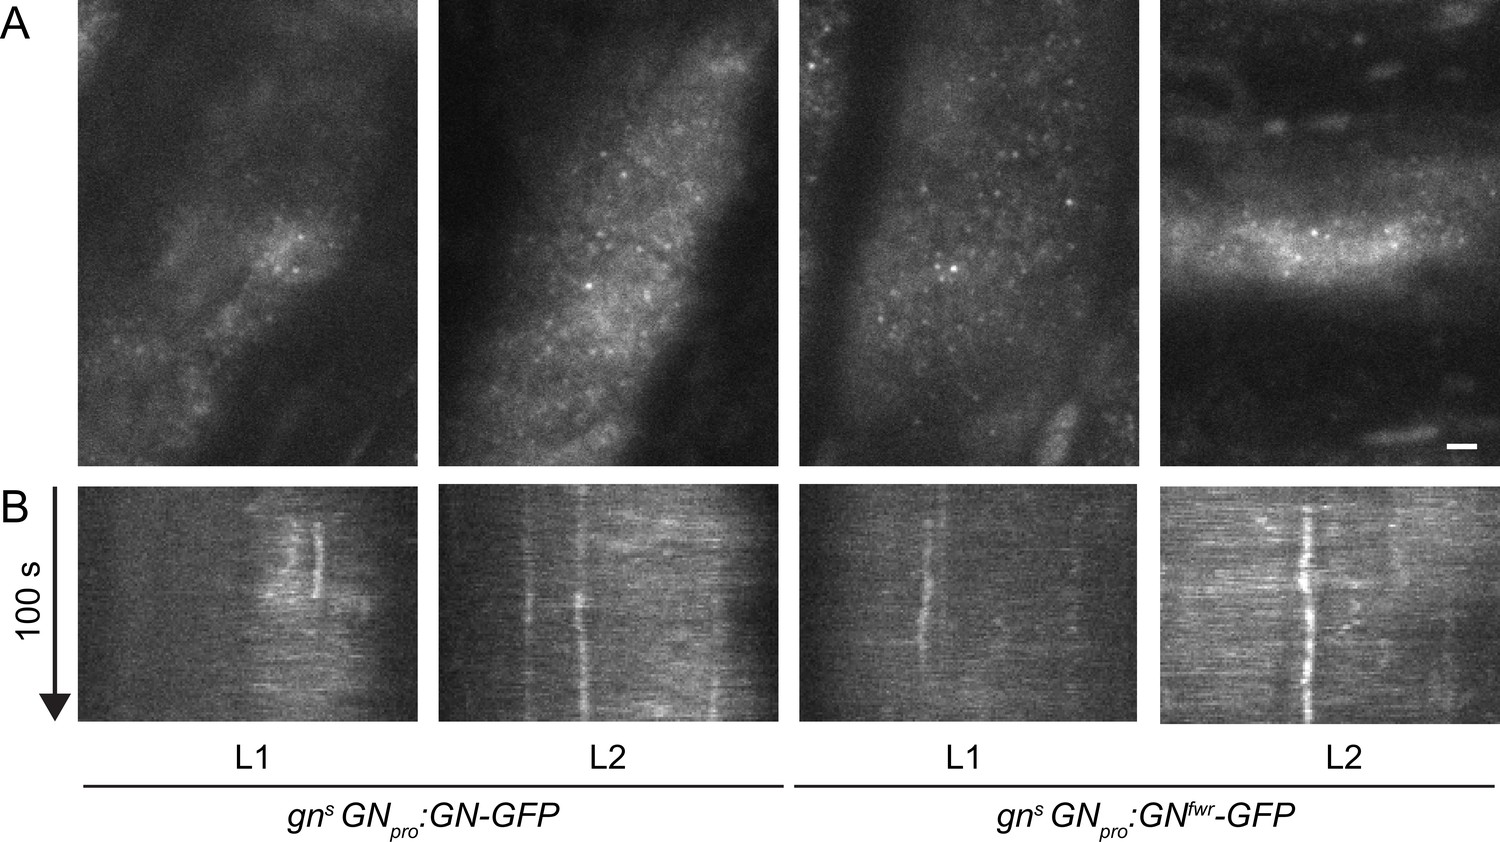
Subcellular localization of GN-GFP and GNfwr-GFP at basal end of young trichoblasts.
TIRF images (A) and kymographs (B) of GN-GFP and GNfwr-GFP expressed in complemented mutant backgrounds, at basal ends of young trichoblasts. Scale bar – 2 µm.
Figure 2—video 1
TIRF time lapse of GNfwr-GFP in gns seedling root epidermis.
Scale bar - 10 μm.
Figure 3 with 8 supplements
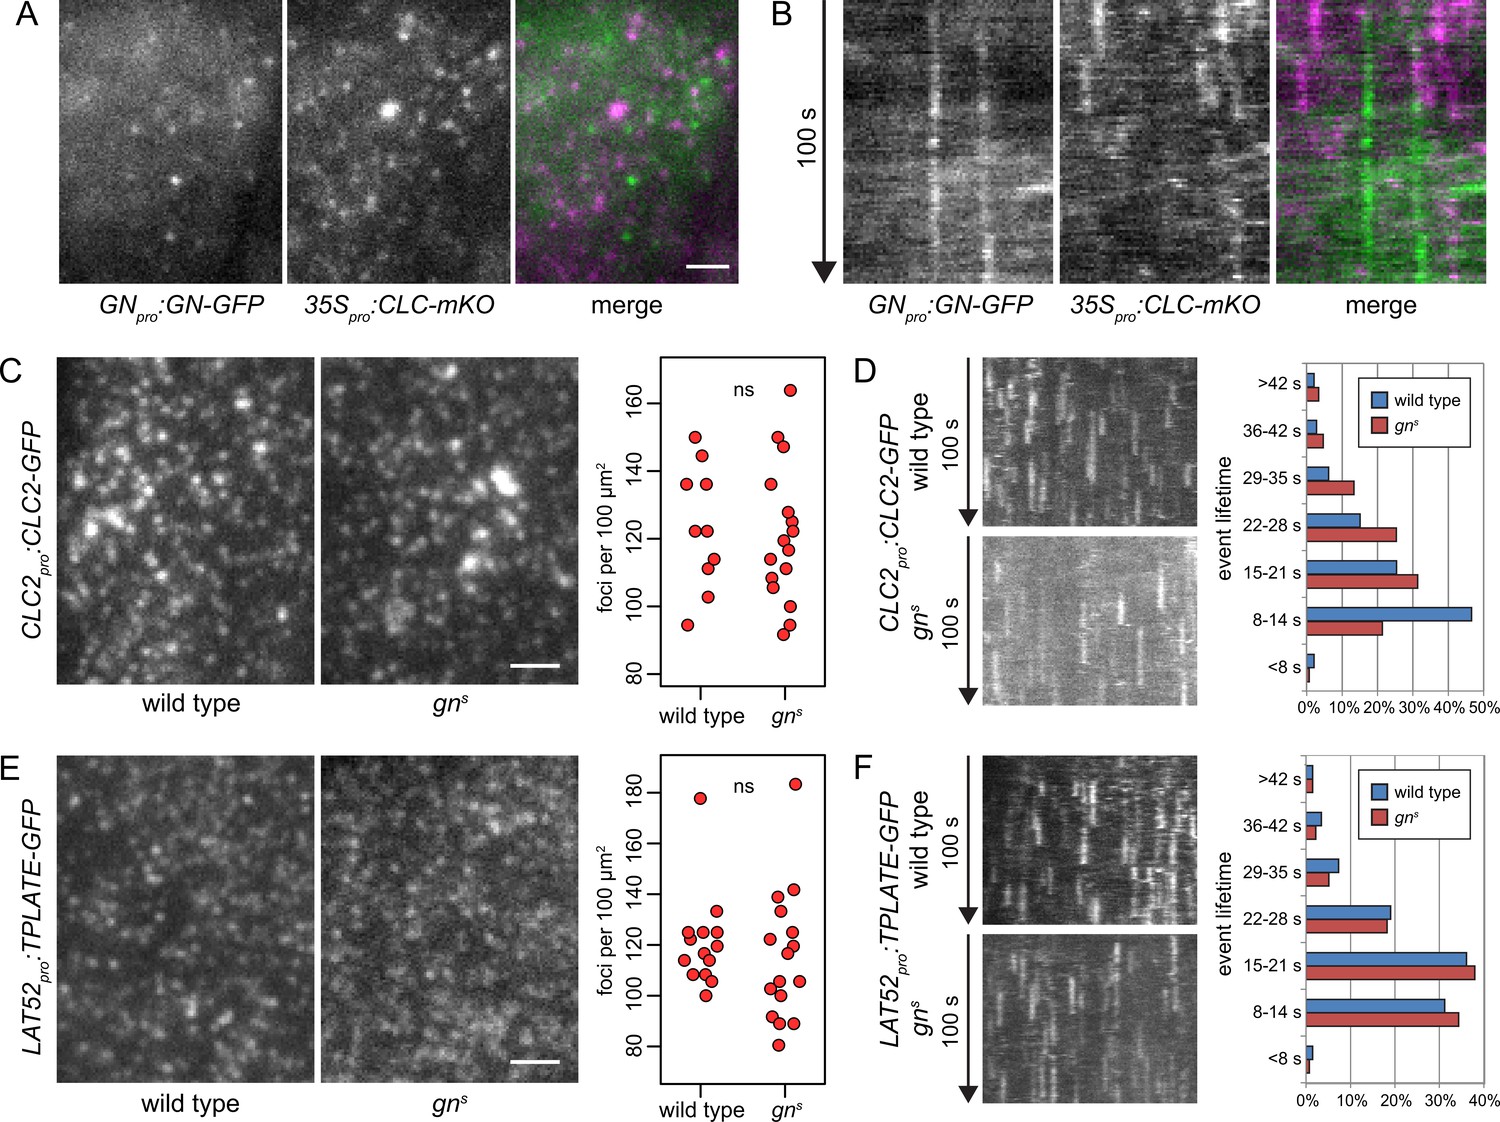
GN-positive structures do not contain clathrin, and CME is normal in gns.
TIRF images (A) and kymographs (B) of GN-GFP and CLC-mKO in the epidermis of early elongation zone of seedling roots. The GN-positive structures at the PM are distinct from CCPs. Scale bar – 2 µm. TIRF images of CLC2-GFP (C) and TPLATE-GFP (E) in middle regions of etiolated gns seedlings and in hypocotyls of etiolated wild-type controls. Scale bars – 2 µm. Graphs show quantifications of foci densities at the PM, each data point representing a measurement from a single movie. CLC2-GFP wild type: 123±17 foci per 100 µm2 (mean ± s.d.), n=10; gns: 121±20 foci per 100 µm2, n=16. TPLATE-GFP wild type: 121±18 foci per 100 µm2, n=14; gns: 115±25 foci per 100 µm2, n=16. Values were compared using t tests, ns – not significant. Kymographs from TIRF movies representing dynamics of CLC2-GFP (D) and TPLATE-GFP (F) in middle regions of etiolated gns seedlings and in hypocotyls of etiolated wild-type controls. Histograms show distributions of lifetimes of single endocytic events. CLC2-GFP wild type n=146, gns n=150; TPLATE-GFP wild type n=205, gns n=137.
Figure 3—figure supplement 1

Control TIRF co-localization of CME markers TPLATE-GFP and AP2A1-TagRFP.
TIRF images (A) and kymographs (B) of TPLATE-GFP and AP2A1-TagRFP in the epidermis of early elongation zone of seedling roots. Scale bar – 2 µm. Arrowheads in (A) indicate co-localizing punctae.
Figure 3—video 1
TIRF time lapse colocalization of GN-GFP and CLC-mKO in seedling root epidermis, green channel.
Scale bar - 2 μm.
Figure 3—video 2
TIRF time lapse colocalization of GN-GFP and CLC-mKO in seedling root epidermis, red channel.
Scale bar - 2 μm.
Figure 3—video 3
TIRF time lapse colocalization of GN-GFP and CLC-mKO in seedling root epidermis, merged channels.
Scale bar - 2 μm.
Figure 3—video 4
TIRF time lapse of CLC2-GFP in wild-type hypocotyl epidermis.
Scale bar - 10 μm.
Figure 3—video 5
TIRF time lapse of CLC2-GFP in gns hypocotyl epidermis.
Scale bar - 10 μm.
Figure 3—video 6
TIRF time lapse of TPLATE-GFP in wild-type hypocotyl epidermis.
Scale bar - 10 μm.
Figure 3—video 7
TIRF time lapse of TPLATE-GFP in gns hypocotyl epidermis.
Scale bar - 10 μm.
Figure 4 with 1 supplement
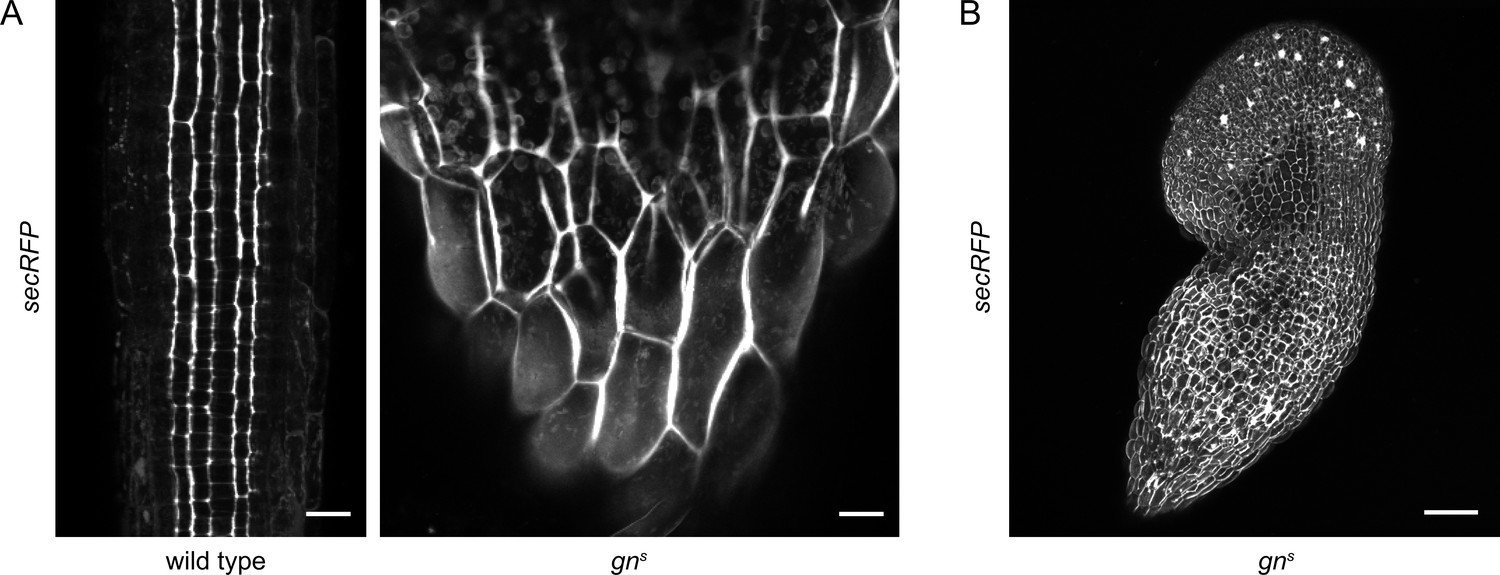
Bulk secretion is normal in gns.
(A) Maximum projections of z-stacks of CLSM images of secRFP in RAMs of wild-type seedlings and in basal ends of gns seedlings. Scale bars - 20 µm. (B) Maximum projection of a z-stack of CLSM images of secRFP in a whole gns seedling. Scale bar - 200 µm.
Figure 4—figure supplement 1

Additional controls for secRFP secretion.
(A) CLSM maximum projection of a z-stack of secRFP in RAMs of 2-day-old wild-type seedlings. (B) Maximum projections of z-stacks of CLSM images in gns basal ends with and without secRFP expression. Scale bars - 10 µm.
Figure 5 with 1 supplement
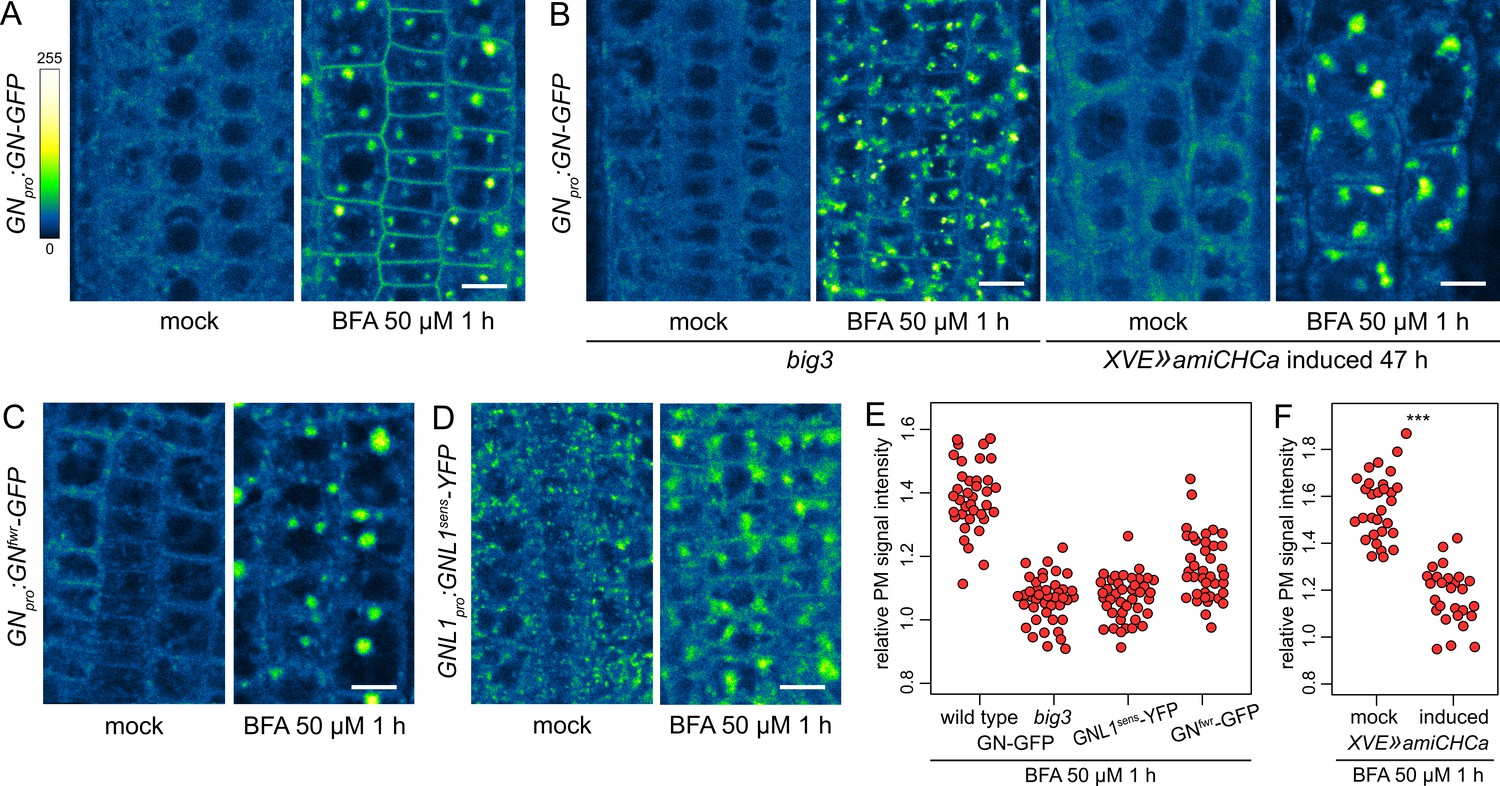
A BFA-induced, GN-specific exocytic event.
(A) CLSM images of GN-GFP in seedling RAM epidermis following a treatment with BFA at 50 µM for 1 hr. After a treatment with BFA, GN-GFP locates to the core of BFA bodies and strongly localizes to the PM. Scale bar - 10 µm. (B) CLSM images of GN-GFP in seedling RAM epidermis of big3 and of induced XVE»amiCHCa, following treatments with BFA at 50 µM for 1 hr. The relocation of GN-GFP to the PM is abolished to a large degree in big3 and completely in XVE»amiCHCa. Scale bars - 10 µm. Treatments of non-induced XVE»amiCHCa lines are shown in Figure 5—figure supplement 1B. (C) CLSM images of GNfwr-GFP in seedling RAM epidermis following a treatment with BFA at 50 µM for 1 hr. After a treatment with BFA, GNfwr-GFP binds to the core of BFA bodies but does not localize to the PM. Scale bar - 10 µm. (D) CLSM images of a BFA-sensitive variant of GNL1-YFP in seedling RAM epidermis following a treatment with BFA at 50 µM for 1 hr. The images show GNL1sens-YFP expressed in a wild-type background in gnl1 GNL1pro:GNL1sens-YFP x Col-0 F1. After a treatment with BFA, GNL1sens-YFP locates to the core of BFA bodies and weakly to the PM. Scale bar - 10 µm. (E) Graph showing quantifications of PM signal intensities relative to total RAM signals of GN-GFP in wild type and big3 mutants, of GNL1sens-YFP, and of GNfwr-GFP, following treatments with BFA at 50 µM for 1 h. GN-GFP wild type: 1.39±0.11 (mean ± s.d.), n=37; GN-GFP big3: 1.06±0.07, n=42; GNL1sens-YFP: 1.07±0.07, n=42; GNfwr-GFP: 1.16±0.10, n=40. The graph has an indicative purpose only, as comparison of quantified ratios does not reflect the visual observations precisely. This is due to differences in the samples such as the expression of different marker proteins, or alterations in BFA body structures in big3. (F) Graph showing quantifications of PM signal intensities relative to total RAM signals of GN-GFP following treatments with BFA at 50 µM for 1 h in control and induced XVE»amiCHCa lines. Mock: 1.56±0.07 (mean ± s.d.), n=30; induced: 1.18±0.12, n=27. Values were compared using a t test, p<0.0001.
Figure 5—figure supplement 1
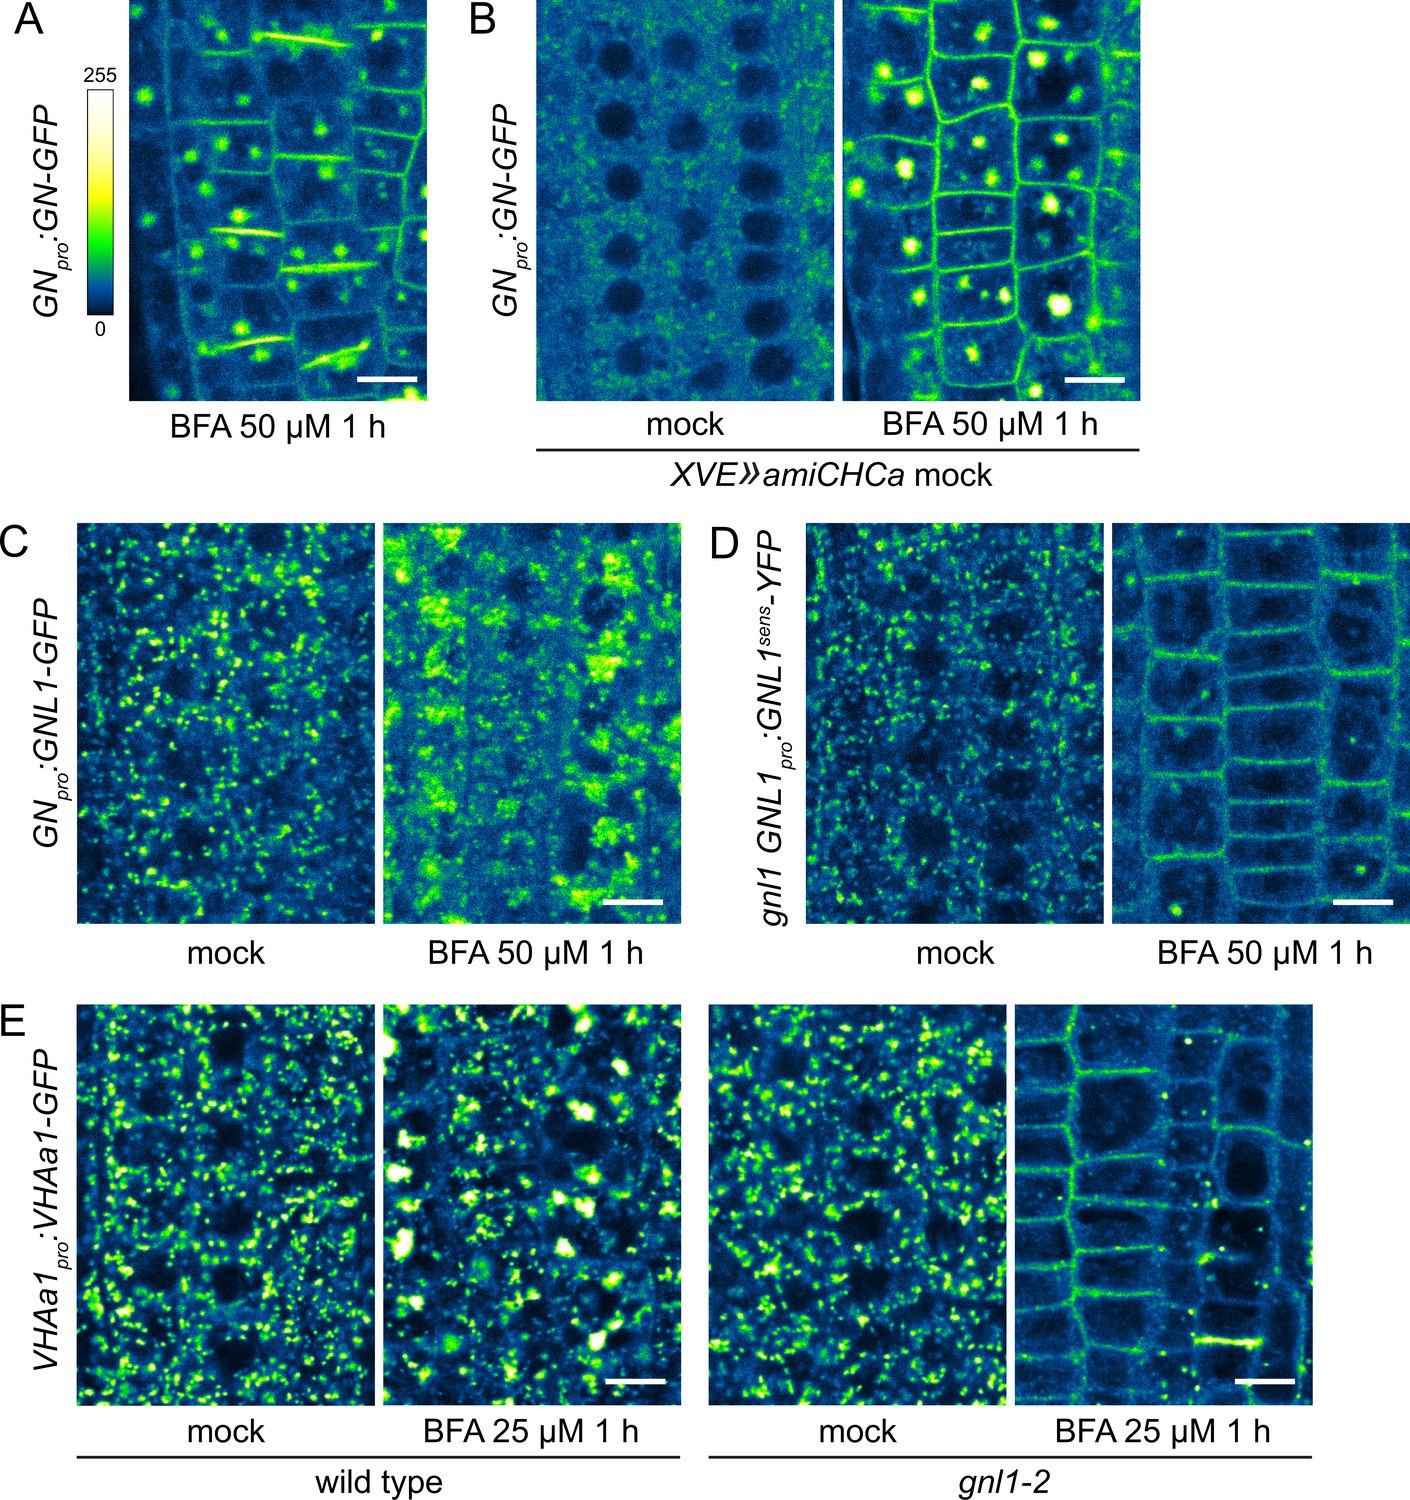
A BFA-induced, GN-specific exocytic event.
(A) A CLSM image of GN-GFP in seedling RAM epidermis following a treatment with BFA at 50 µM for 1 hr, demonstrating strong localization of GN-GFP to the cell plates. Scale bar - 10 µm. (B) Control CLSM images of GN-GFP in seedling RAM epidermis of non-induced XVE»amiCHCa line following treatments with BFA at 50 µM for 1 hr. Scale bar - 10 µm. (C) CLSM images of native GNL1-GFP in seedling RAM epidermis following a treatment with BFA at 50 µM for 1 hr. After a treatment with BFA, native GNL1-GFP remains at the GA at the periphery of BFA bodies. Scale bar - 10 µm. (D) CLSM images of a BFA-sensitive variant of GNL1-YFP in seedling RAM epidermis following a treatment with BFA at 50 µM for 1 h. The images show GNL1sens-YFP expressed in gnl1 background. After a treatment with BFA, typical BFA bodies are not formed, and GNL1sens-YFP relocates to the PM. Scale bar - 10 µm. (E) CLSM images of VHAa1-GFP in seedling RAM epidermis of wild type and gnl1-2 mutants following a treatment with BFA at 25 µM for 1 h. After a treatment with BFA, VHAa1-GFP is found at the core of BFA bodies in the wild type, but undergoes relocation to the PM in gnl1-2. Scale bar - 10 µm.
Figure 6 with 1 supplement
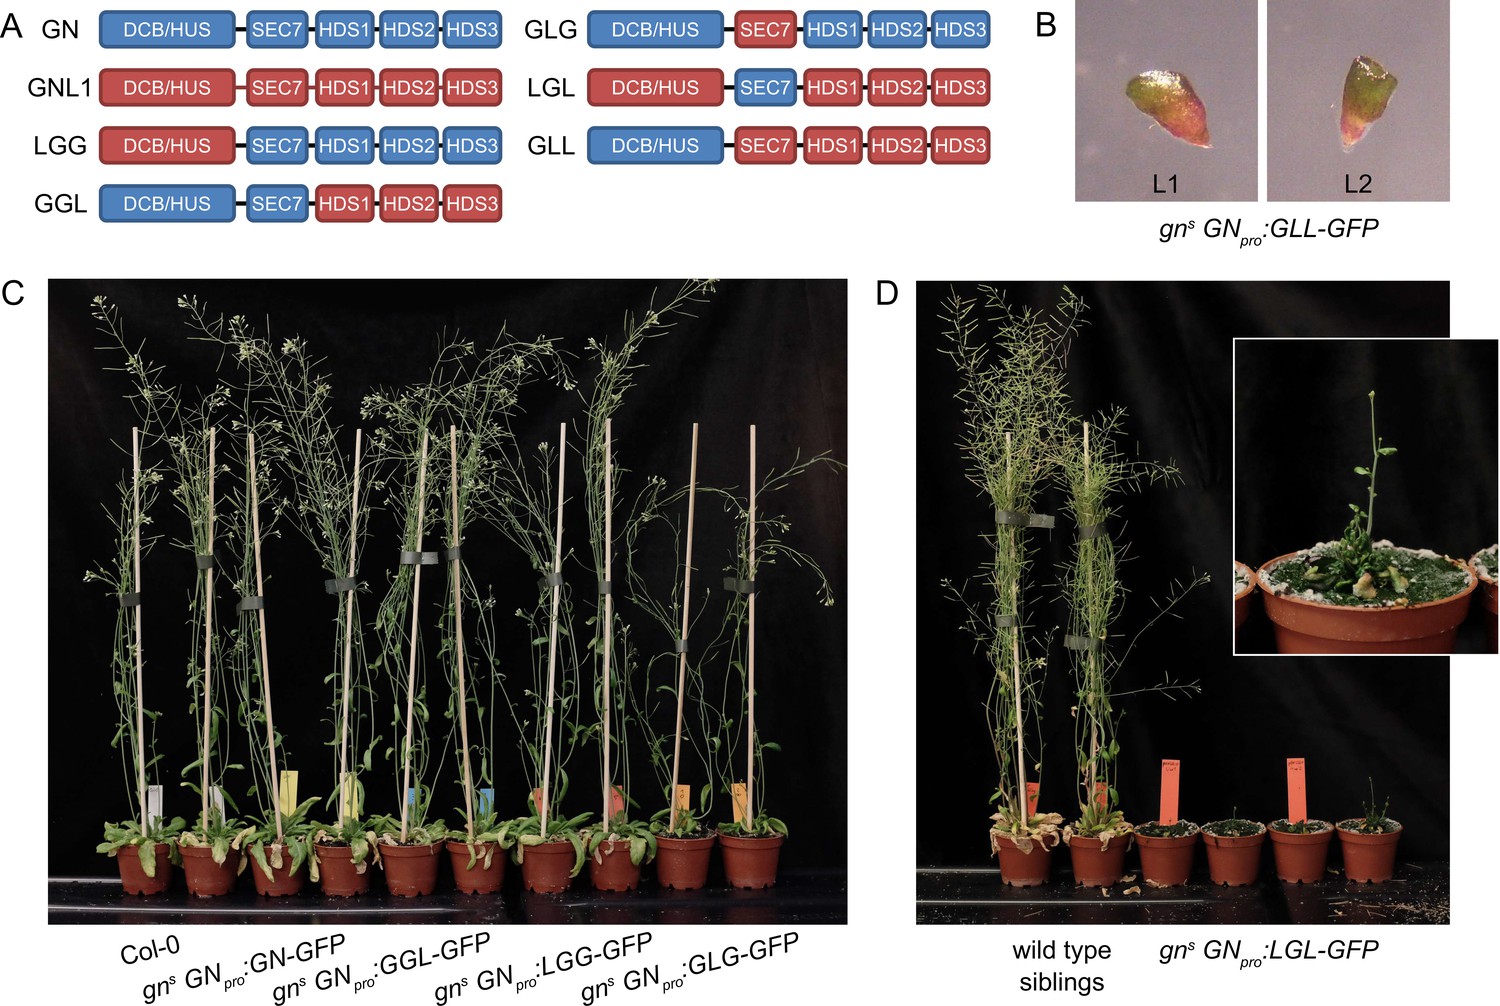
GNOM - GNOM-LIKE1 chimeric ARF-GEFs.
(A) Schematic representation of the domain composition of GN, GNL1, and chimeric GBF1-type ARF-GEFs. An LLG chimera was not cloned. (B) No complementation of gns by the expression of GLL-GFP. (C) Phenotypes of adult gns mutants complemented by the expression of GN-GFP, GGL-GFP, LGG-GFP, and GLG-GFP. Expression of GGL-GFP and LGG-GFP fully complements the mutant phenotype, while plants expressing GLG-GFP develop smaller rosettes, fewer branches, and have limited fertility. (D) Phenotypes of adult gns mutants complemented by the expression of LGL-GFP. Expression of LGL-GFP provides only a modest level of complementation. Adults are characterized by limited growth, a compact rosette, and if bolting, are completely infertile. Wild-type siblings from a population segregating for gns are shown as control. Photographs in (C) and (D) show two independent transgenic lines expressing each construct.
Figure 6—figure supplement 1
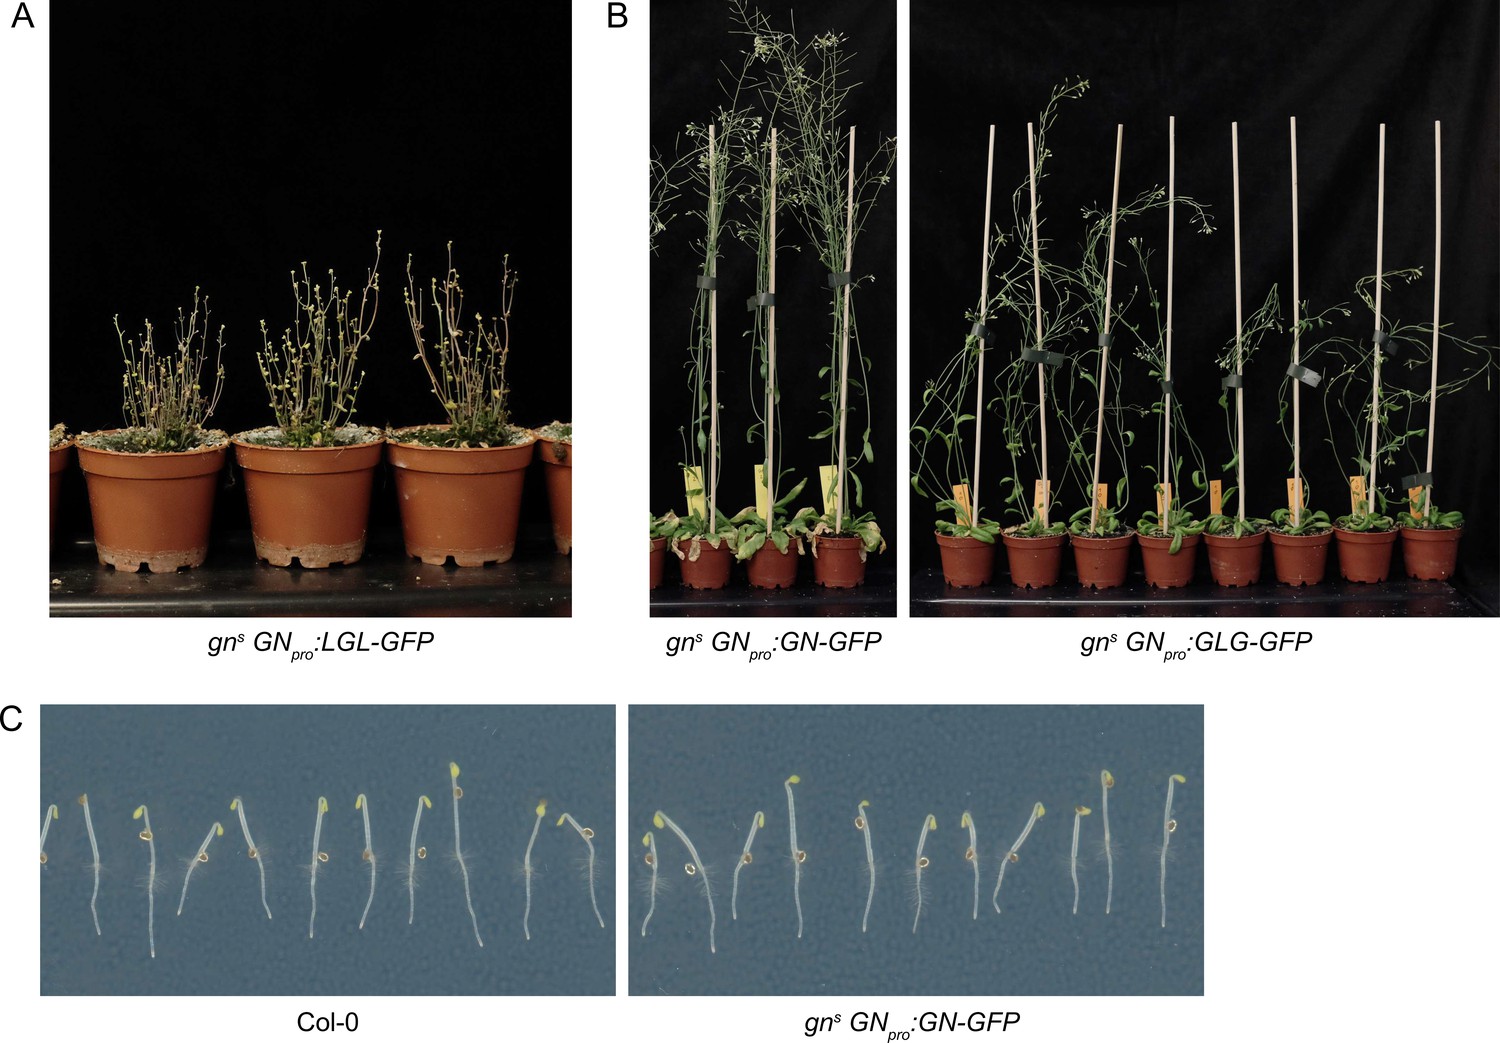
Additional data related to GNOM - GNOM-LIKE1 chimeras.
(A) Terminal phenotypes of gns mutants complemented by the expression of LGL-GFP. (B) An additional picture of adult gns mutants complemented by the expression of GLG-GFP. (C) Control images showing etiolated seedlings of wild-type plants and gns mutants complemented by the expression of GN-GFP.
Figure 7 with 2 supplements
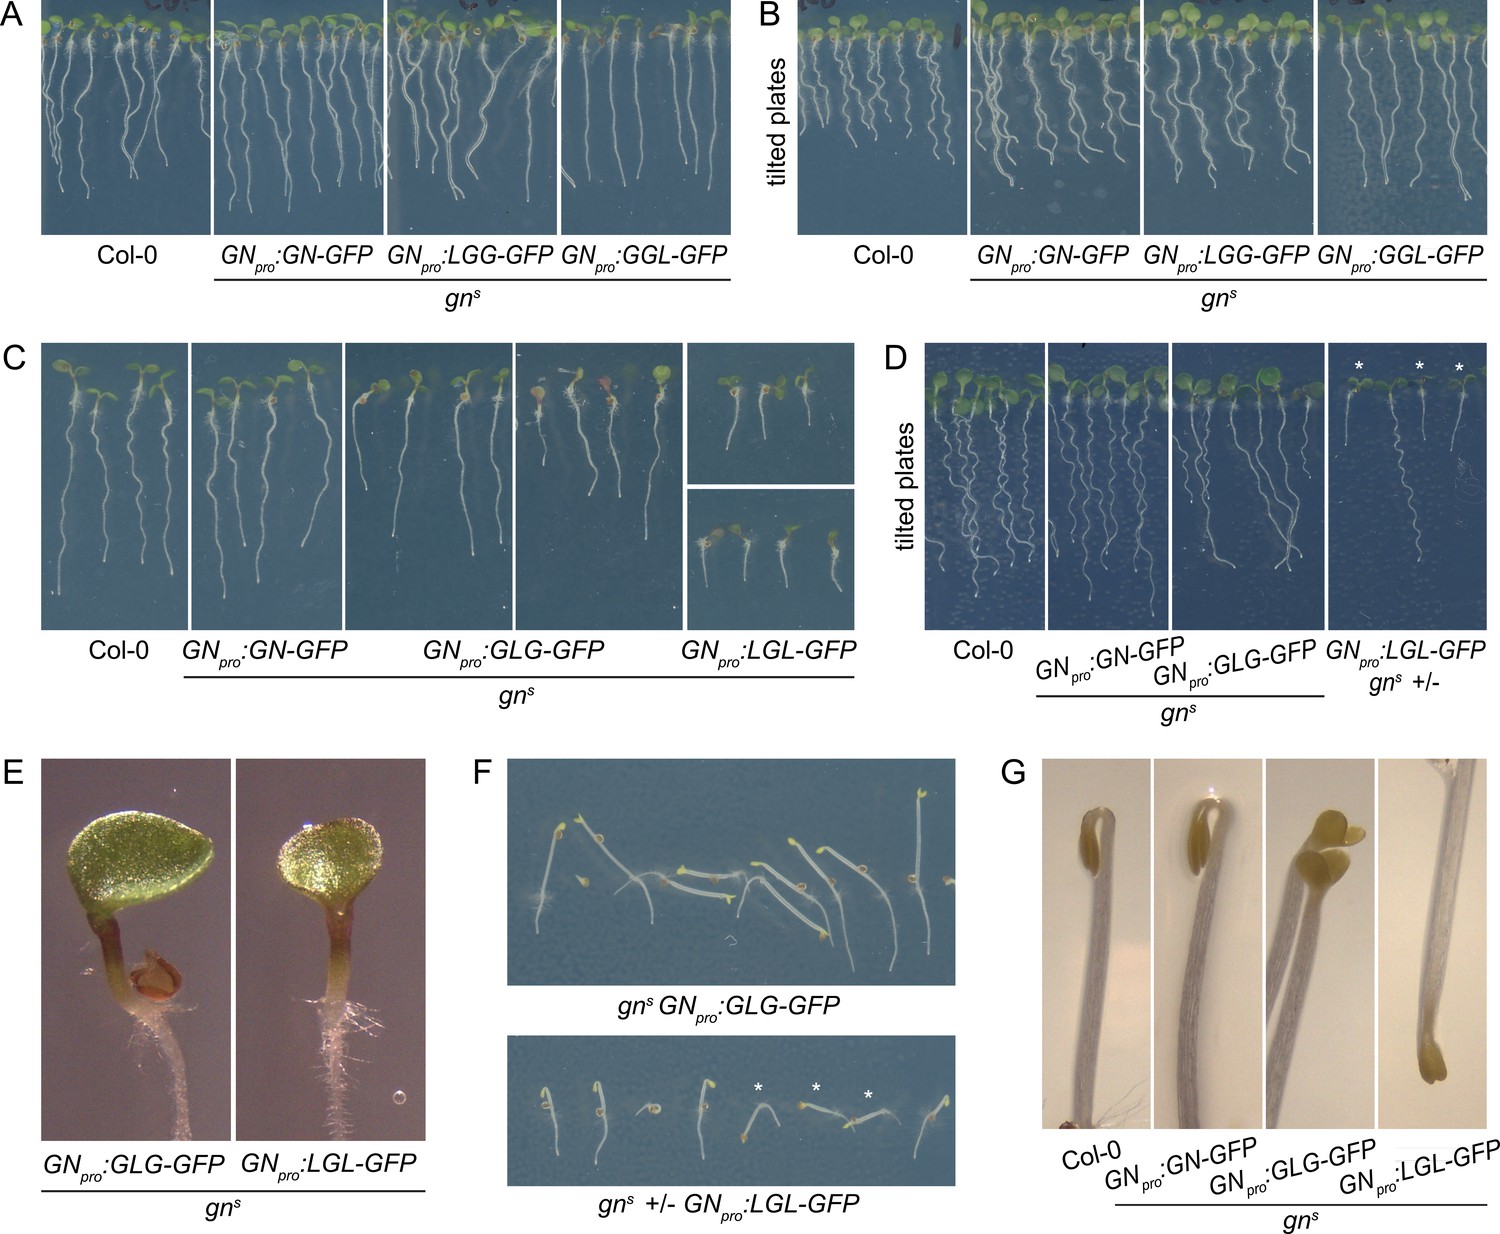
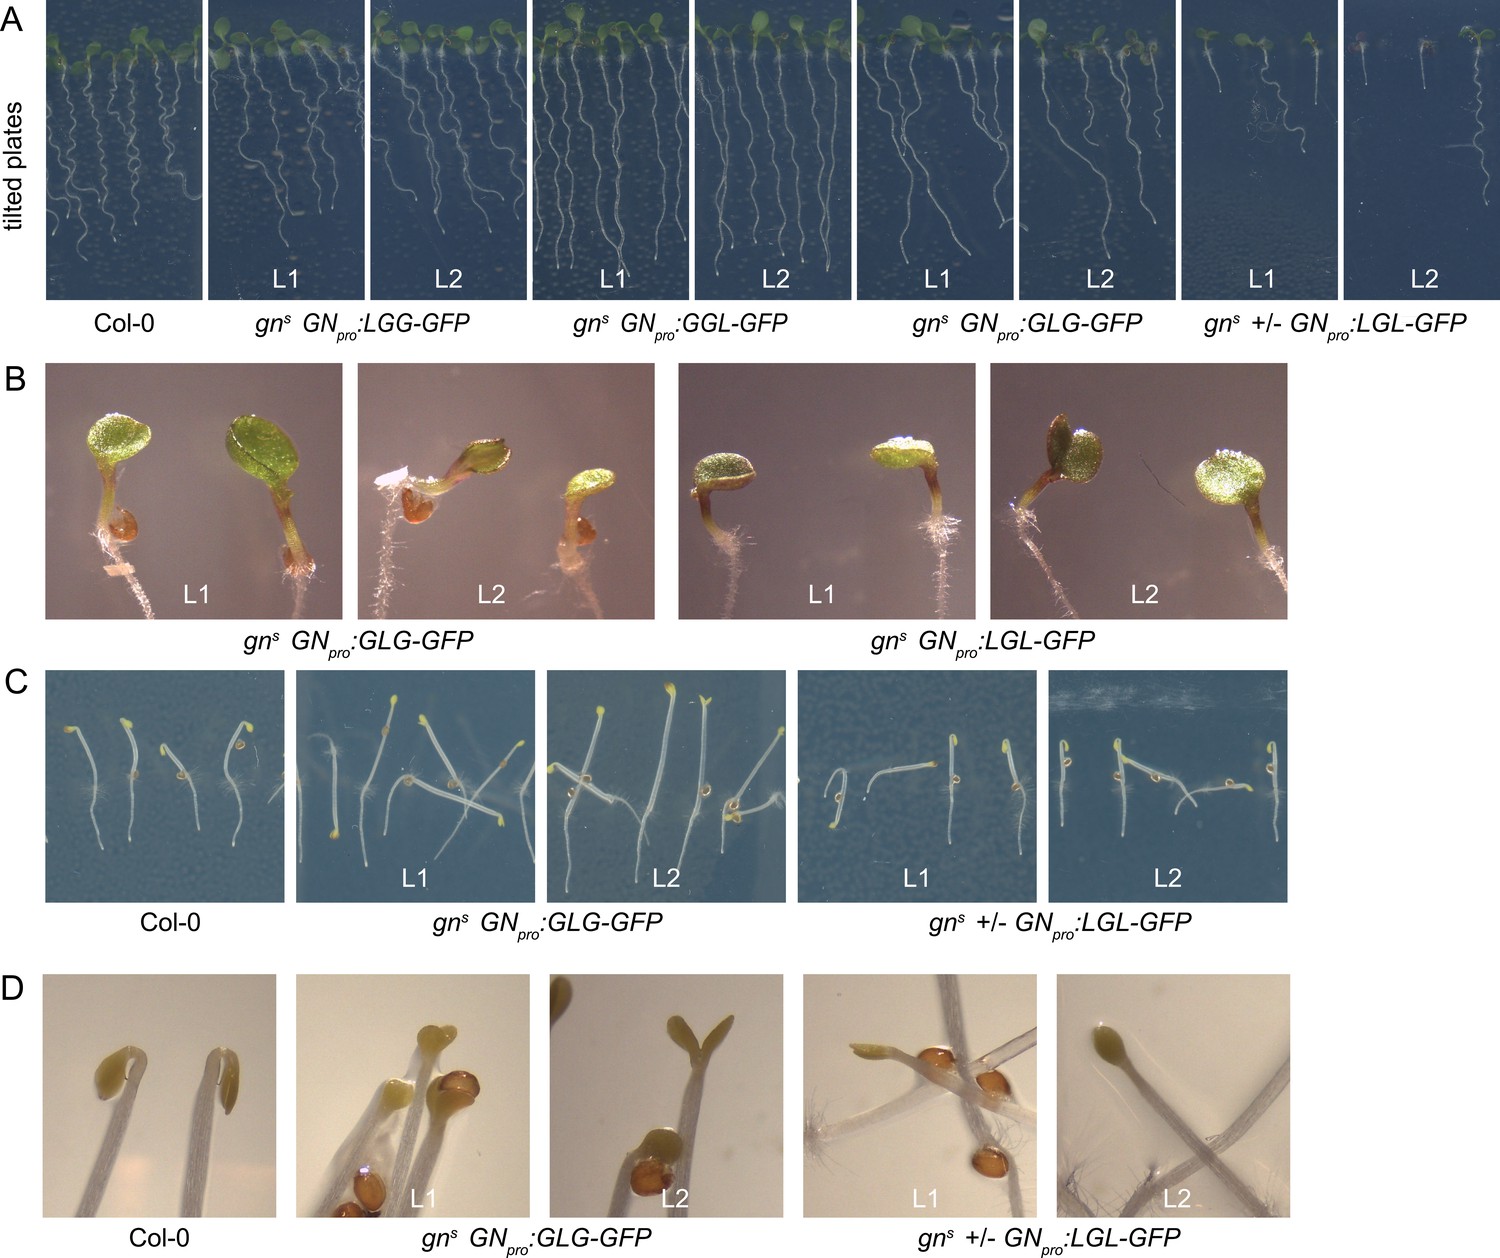
Seedling phenotypes of gns mutants complemented with GGL-GFP, LGG-GFP, GLG-GFP, and LGL-GFP.
(A) Seedlings of gns mutants expressing LGG-GFP and GGL-GFP. Expression of LGG-GFP fully complements the mutant phenotype, while seedlings expressing GGL-GFP are characterized by roots growing more straight than controls. (B) Seedlings of gns mutants expressing GGL-GFP and LGG-GFP growing on agar plates tilted back from the vertical position. The root waving phenotype is normal in seedlings expressing LGG-GFP, while seedlings expressing GGL-GFP exhibit decreased waving. (C) Seedlings of gns mutants expressing GLG-GFP and LGL-GFP. Seedlings expressing GLG-GFP have moderately and variably decreased root lengths, while seedlings expressing LGL-GFP have strongly decreased root lengths. Both lines exhibit single or partially fused cotyledons in up to 50% of seedlings (GLG-GFP: right panel; LGL-GFP: bottom panel). (D) Seedlings of gns mutants expressing GLG-GFP and LGL-GFP growing on agar plates tilted back from the vertical position. The root waving phenotype is less expressed in mutants complemented with GLG-GFP, and completely absent in mutants complemented with LGL-GFP. The rightmost panel shows a population segregating for gns, complemented homozygous mutants are marked by asterisks. (E) Detail of single cotyledon phenotypes of gns mutants complemented by the expression of GLG-GFP and LGL-GFP. (F) Etiolated seedlings of gns mutants expressing GLG-GFP and LGL-GFP exhibit agravitropic growth. The bottom panel shows a population segregating for gns, complemented homozygous mutants are marked by asterisks. (G) Etiolated seedlings of gns mutants expressing GLG-GFP and LGL-GFP exhibit open apical hooks at 75 hr of in vitro growth.
Figure 7—figure supplement 1
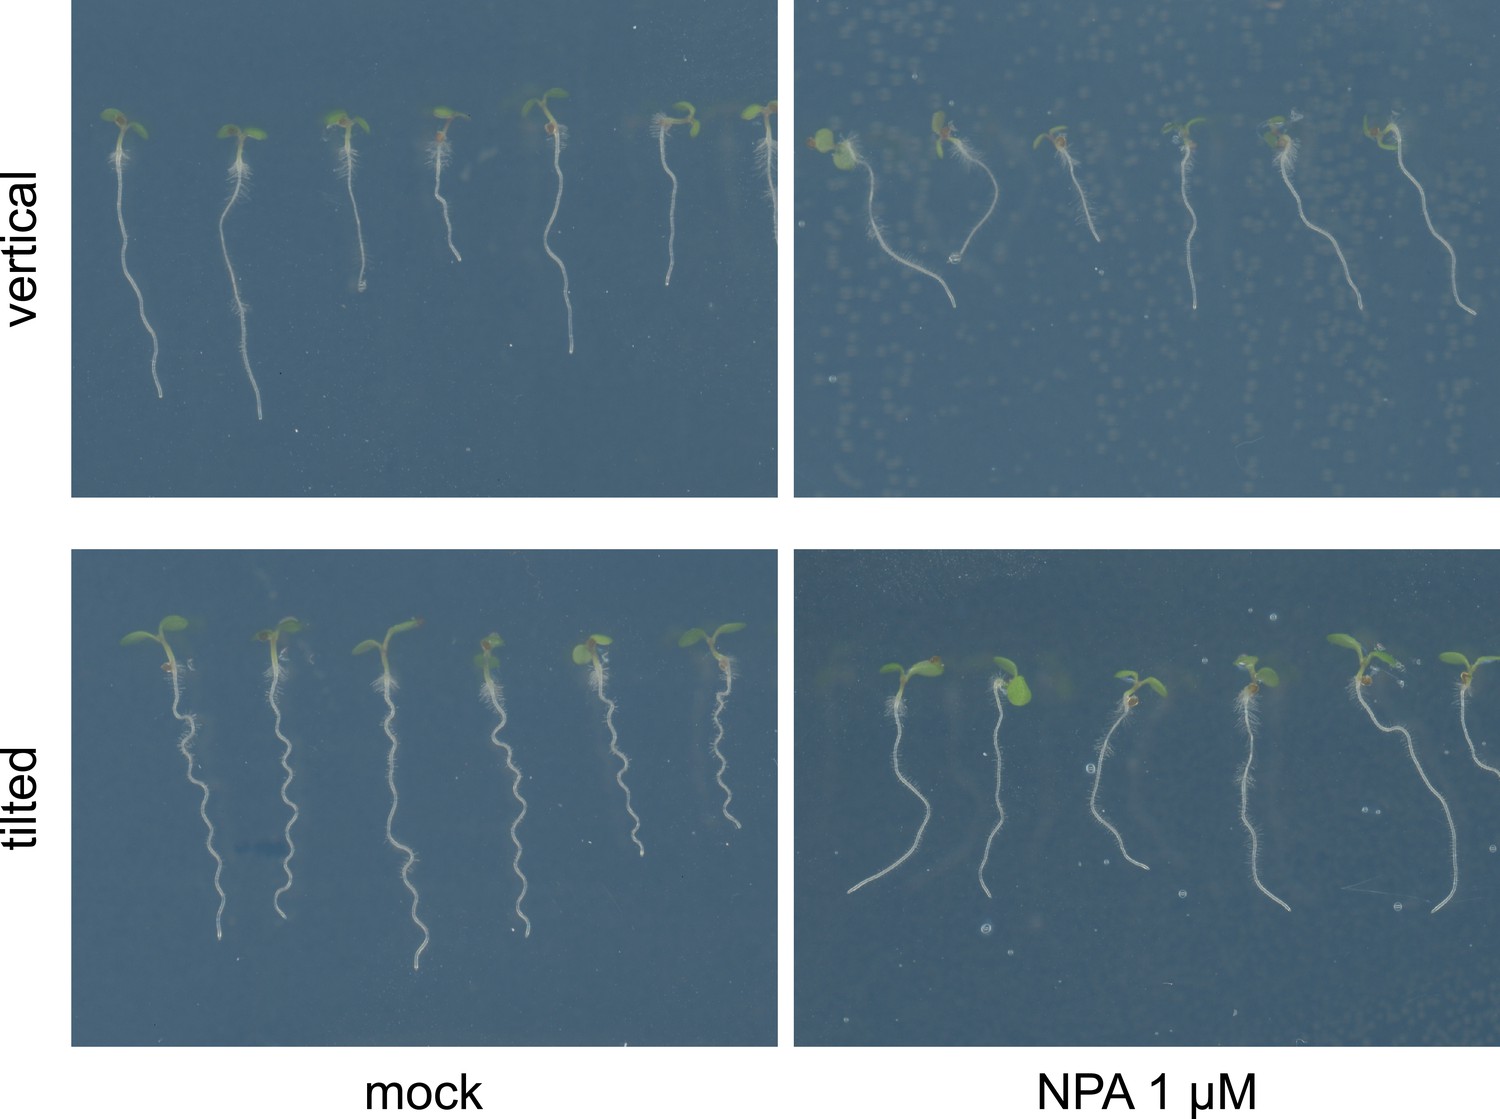
The effect of NPA on root waving.
Col-0 seedlings grown on media supplemented with 1 µM NPA on vertical and tilted plates. NPA causes loss of root waving as exhibited on plates tilted back from the vertical.
Figure 7—figure supplement 2
Additional data on seedling phenotypes of gns mutants complemented with GN-GNL1 chimeras.
Growth on tilted plates showing both general seedling morphology and root waving (A), single and fused cotyledons (B), dark-grown seedlings (C), and apical hooks (D) of indicated lines.
Figure 8 with 1 supplement
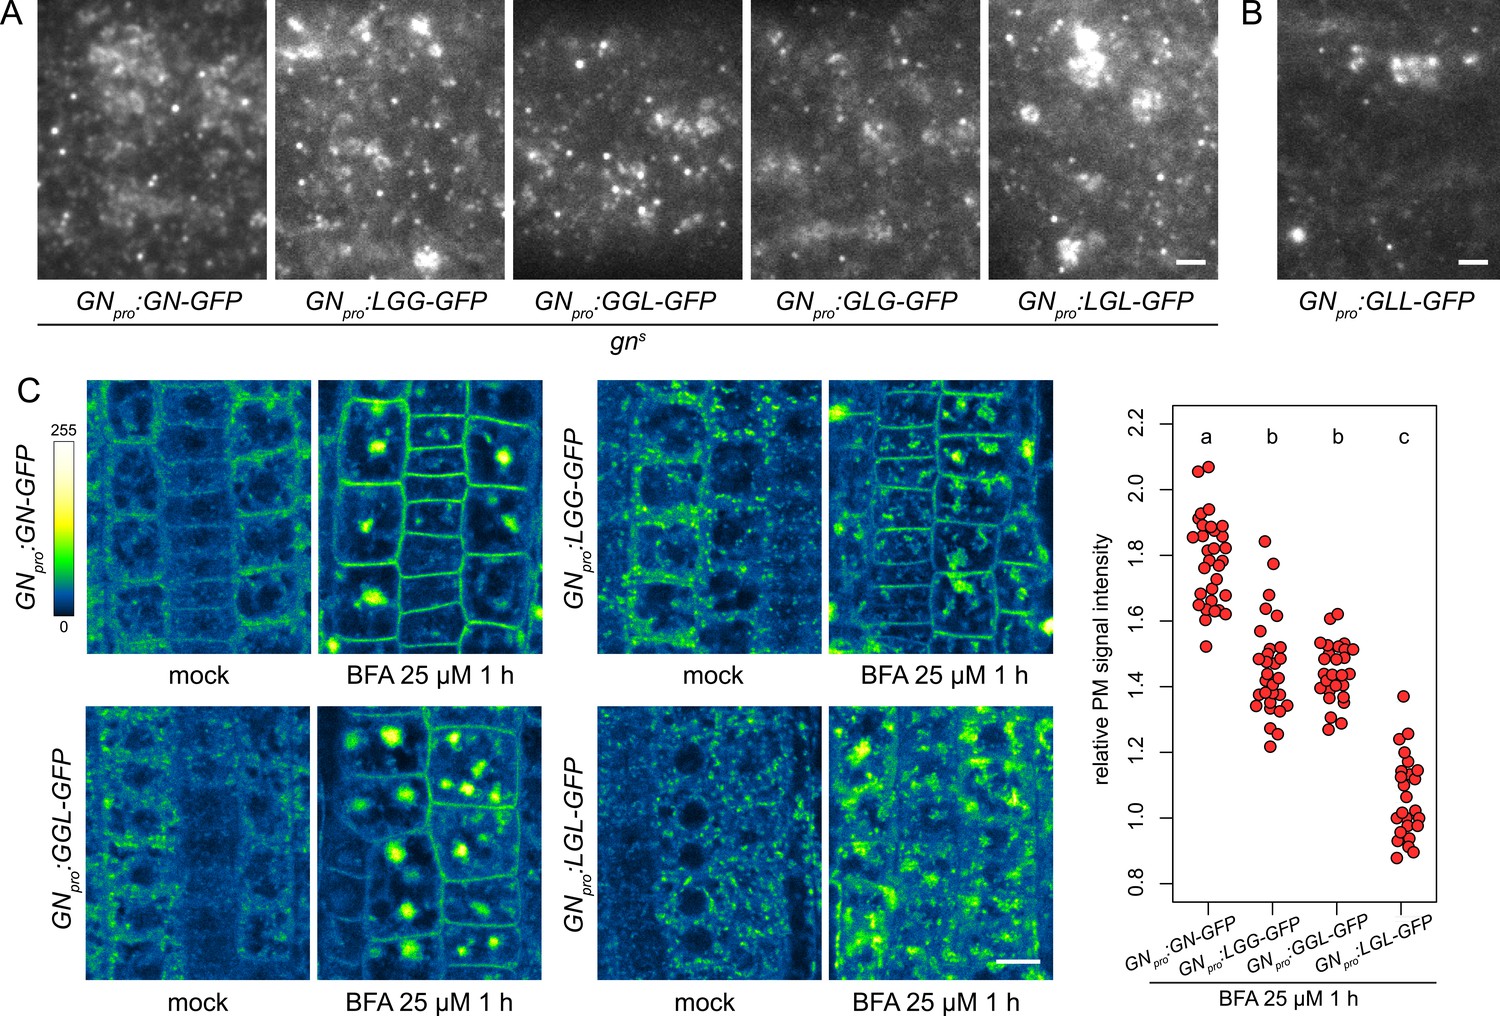
Subcellular localization and BFA-induced exocytosis of ARF-GEF chimeras.
(A) TIRF images of GN-GFP, LGG-GFP, GGL-GFP, GLG-GFP and LGL-GFP in hypocotyls of etiolated seedlings of complemented gns mutants. All complementing chimeras localize to the GN-specific structures at the PM, and to GA. Scale bar - 2 µm. (B) TIRF image of GLL-GFP in wild-type etiolated seedling hypocotyl. GLL-GFP can be identified at GN-specific structures at the PM, and the GA. Scale bar - 2 µm. (C) CLSM images of seedling RAM epidermis of GN-GFP and chimeras possessing the BFA-sensitive SEC7 domain of GN, expressed in wild-type background, following a treatment with BFA at 25 µM for 1 hr. LGG-GFP and GGL-GFP localize to the PM after a BFA treatment, while LGL-GFP does not. Scale bar - 10 µm. Graph shows a quantification of PM signal intensities relative to total RAM signals following treatments with BFA at 25 µM for 1 hr from a representative experiment. A sum of data from two transgenic lines expressing each fluorescent reporter is shown. GN-GFP: 1.79±0.13 (mean ± s.d.), n=32; LGG-GFP: 1.46±0.15, n=29; GGL-GFP: 1.46±0.09, n=27; LGL-GFP: 1.07±0.12, n=26. Values were compared using One-way ANOVA (p<0.0001) with post-hoc Tukey HSD test, groups of significantly different values are indicated.
Figure 8—figure supplement 1
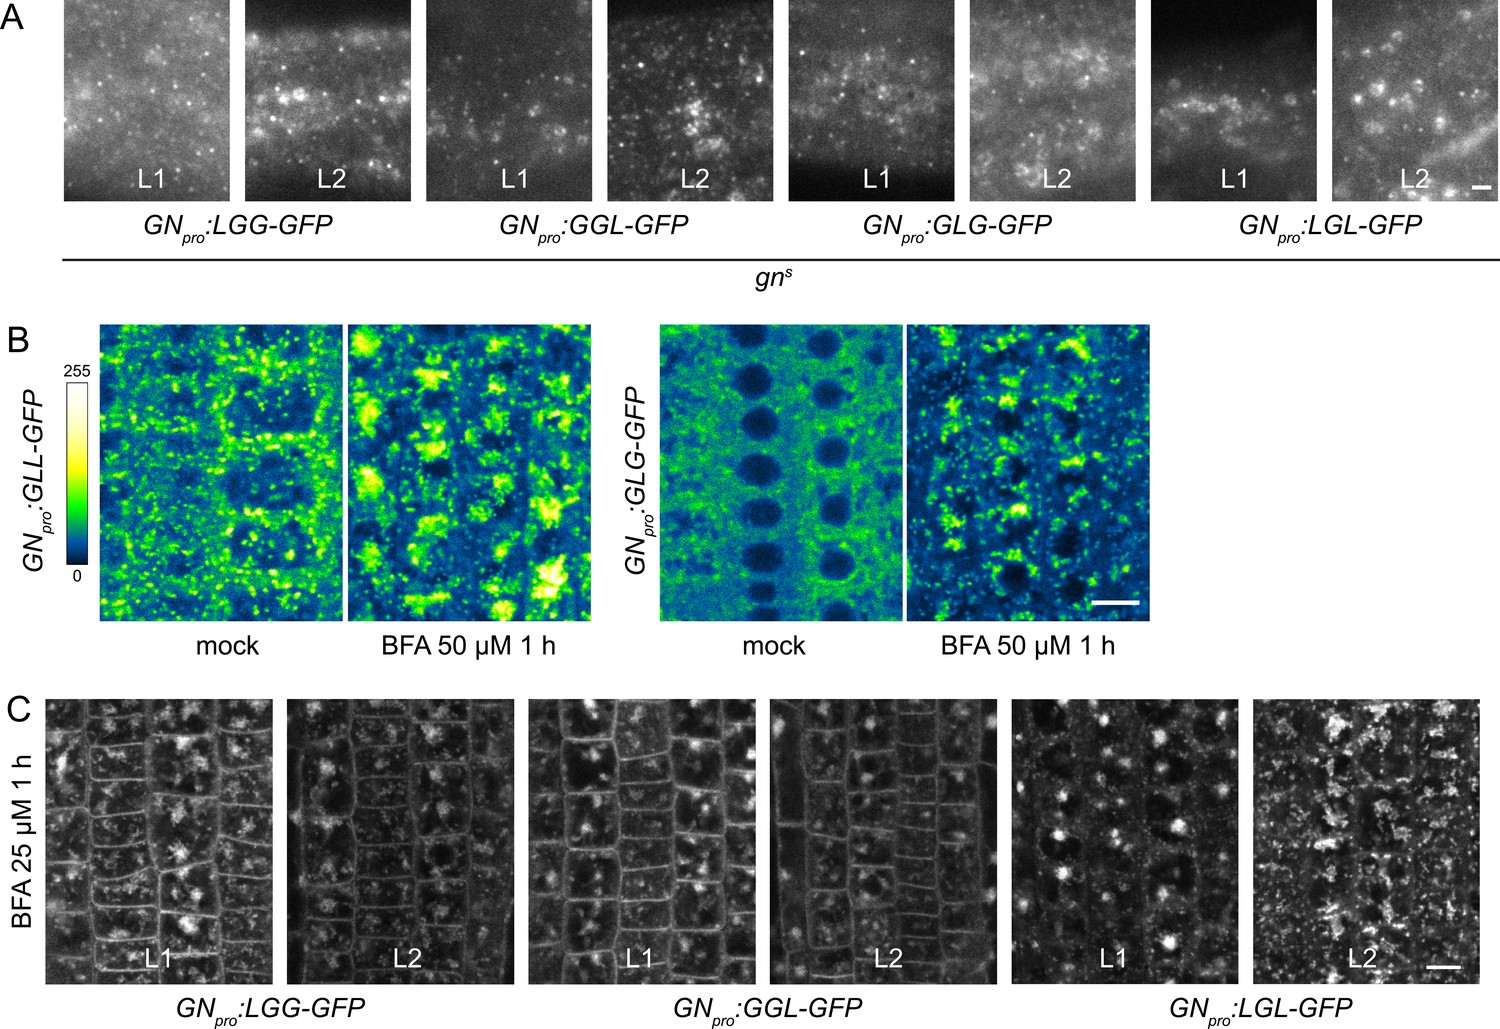
Additional data on subcellular localization and BFA-induced exocytosis of ARF-GEF chimeras.
(A) TIRF images of LGG-GFP, GGL-GFP, GLG-GFP and LGL-GFP in hypocotyls of etiolated seedlings of complemented gns mutants from two transgenic lines tested. Scale bar - 2 µm. (B) CLSM images of seedling RAM epidermis of GFP fusions of chimeras possessing the BFA-resistant SEC7 domain of GNL1, expressed in wild-type background, following a treatment with BFA at 25 µM for 1 hr. GLL-GFP and GLG-GFP are retained at the periphery of the BFA body. Scale bar - 10 µm. (C) CLSM images in seedling RAM epidermis of two transgenic lines of LGG-GFP, GGL-GFP, and LGL-GFP upon a treatment with BFA at 25 µM for 1 hr. Scale bar - 10 µm.
Tables
Table 1
Summary of phenotypes of gns expressing ARF-GEF variants.
| ARF-GEF | Overall degree of GN function | Adult phenotype | Seedling growth rate | Root waving | Root hair positioning | Apical patterning | Etiolated seedling tropism | Apical hooks |
|---|---|---|---|---|---|---|---|---|
| GN (GGG) | complete | normal | normal | normal | normal | normal | normal | normal |
| LGG | complete | normal | normal | normal | normal | normal | normal | normal |
| GGL | very high | normal | normal | decreased | not analyzed | normal | normal | normal |
| GLG | moderate | decreased growth and fertility | partially decreased | decreased | not analyzed | ~50% single or fused cotyledons | variable growth directions | pen apical hooks |
| LGL | moderate to low | very small, infertile | strongly decreased | absent | not analyzed | ~50% single or fused cotyledons | variable growth directions | pen apical hooks |
| GLL | none | - | identical to gn | - | - | identical to gn | - | - |
| GNL1 (LLL) | none | - | identical to gn | - | - | identical to gn | - | - |
| LLG | not cloned | |||||||
Key resources table
| Reagent type (species) or resource | Designation | Source or reference | Identifiers | Additional information |
|---|---|---|---|---|
| Biological sample (Arabidopsis thaliana) | Col-0 (Columbia) | Nottingham Arabidopsis Stock Centre (NASC) | N1092 | |
| Gene (Arabidopsis thaliana) | GNOM | The Arabidopsis Information Resource | AT1G13980 | |
| Gene (Arabidopsis thaliana) | GNOM-LIKE1 | The Arabidopsis Information Resource | AT5G39500 | |
| Genetic reagent (Arabidopsis thaliana) | gns | SALK T-DNA collection | SALK_103014 |
Additional files
-
Supplementary file 1
Additional materials and methods.
(a) Lines generated as part of this study. (b) Primers used in this study. (c) Constructs generated in this study.
- https://cdn.elifesciences.org/articles/68993/elife-68993-supp1-v1.docx
-
Transparent reporting form
- https://cdn.elifesciences.org/articles/68993/elife-68993-transrepform1-v1.docx
Download links
A two-part list of links to download the article, or parts of the article, in various formats.
Downloads (link to download the article as PDF)
Open citations (links to open the citations from this article in various online reference manager services)
Cite this article (links to download the citations from this article in formats compatible with various reference manager tools)
Developmental patterning function of GNOM ARF-GEF mediated from the cell periphery
eLife 13:e68993.
https://doi.org/10.7554/eLife.68993


