A sex-specific evolutionary interaction between ADCY9 and CETP
- Université de Montréal, Canada
- Montreal Heart Institute, Canada
- Université de Montréal Beaulieu-Saucier Pharmacogenomics Centre, Canada
- Center for Data Sciences, Brigham and Women’s Hospital, Harvard Medical School, United States
- Program in Medical and Population Genetics, Broad Institute of MIT and Harvard, United States
- Socios En Salud, Peru
- Harvard Medical School, United States
- Centre for Genetics and Genomics Versus Arthritis, Manchester Academic Health Science Centre, University of Manchester, United Kingdom
- Department of Biomedical Informatics, Harvard Medical School, United States
- Department of Medicine, Brigham and Women’s Hospital and Harvard Medical School, United States
Figures
Figure 1
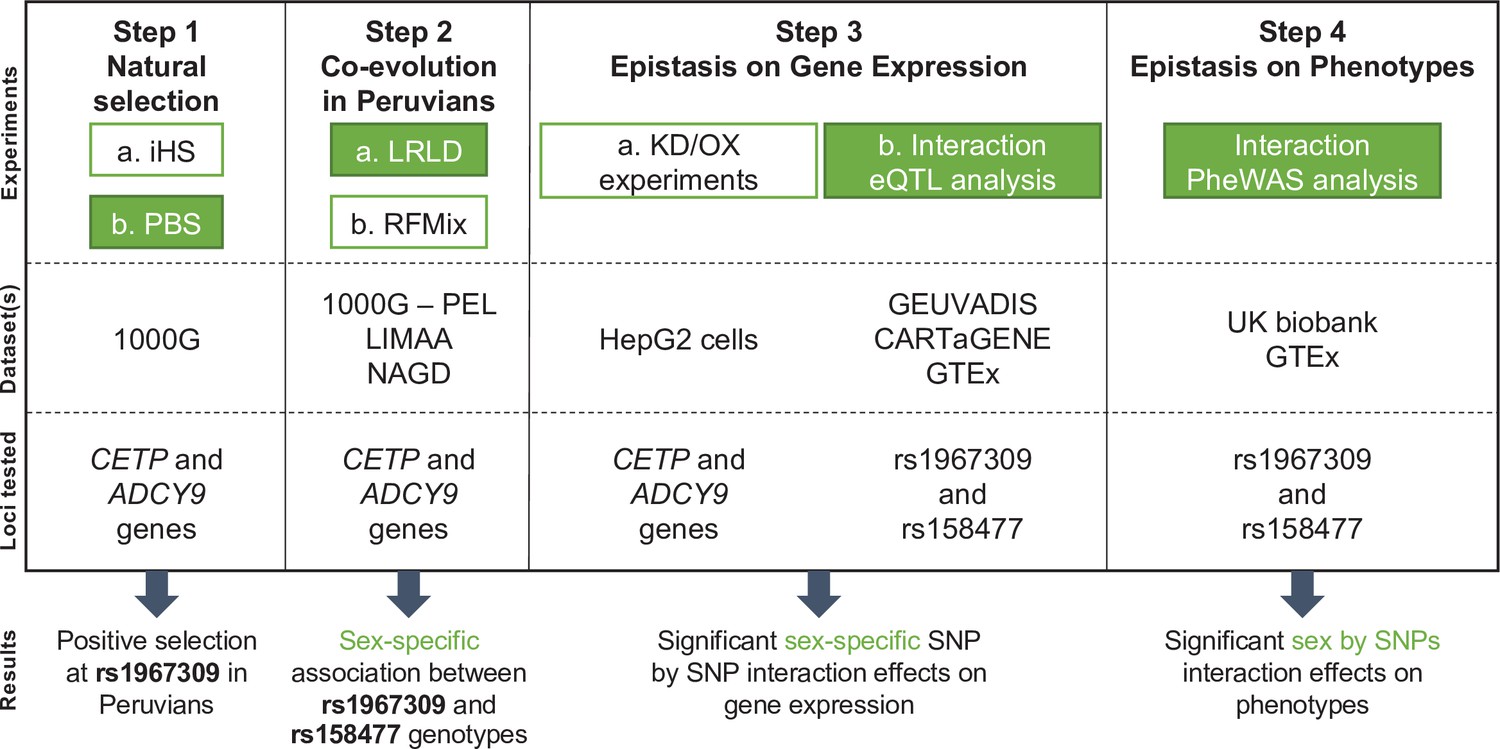
Flowchart of experimental design and main results.
The four main steps of the analyses conducted in this study are reported along with the datasets used for each step and the genetic loci on which the analyses are performed. Green colored boxes represent analyses for which sex is considered. Abbreviations: KD = Knock down; OX = Overexpression.
Figure 2

Natural selection signature at rs1967309 in ADCY9.
(a) Genotype frequency distribution of rs1967309 in populations from the 1000 Genomes (1000G) Project and in Native Americans (NAGD). (b) Significant iHS values (absolute values above 2) for 1000G continental populations and recombination rates from AMR-1000G population-specific genetic maps, in the ADCY9 gene. (c) PBS values in the ADCY9 gene, in CHB (outgroup, left panel), PEL (middle panel), and MXL (right panel). Horizontal lines represent the 95th percentile PBS value genome-wide for each population. Vertical dotted black lines define the LD block around rs1967309 (black circle) from 1000G population-specific genetic maps. Gene plots for ADCY9 showing location of its exons are presented in blue below each plot. Abbreviations: Altaic from Mongolia and Russia: ALT; Uralic Yukaghir from Russia: URY; Chukchi Kamchatkan from Russia: CHK; Northern American from Canada, Guatemala and Mexico: NOA; Central American from Costal Rica and Mexico: CEA; Chibchan Paezan from Argentina, Bolivia, Colombia, Costa Rica, and Mexico: CHP; Equatorial Tucanoan from Argentina, Brazil, Colombia, Gualana and Paraguay: EQT; Andean from Bolivia, Chile, Colombia and Peru: AND. For 1000G populations, abbreviations can be found here https://www.internationalgenome.org/category/population/.
-
Figure 2—source data 1
Source file for genotype frequency distribution of rs1967309.
This file contains the genotype frequency of rs1967309 for each subpopulation from 1000G and NAGD, with the number of individuals by subpopulation.
- https://cdn.elifesciences.org/articles/69198/elife-69198-fig2-data1-v2.txt
-
Figure 2—source data 2
Source file for iHS plot in the ADCY9 gene.
This file contains the iHS values for each position in the ADCY9 gene for each population of the 1000G dataset.
- https://cdn.elifesciences.org/articles/69198/elife-69198-fig2-data2-v2.txt
-
Figure 2—source data 3
Source file for PBS plots in the ADCY9 gene.
This file contains the PBS value for PEL, MXL, and CHB for each position in the ADCY9 gene.
- https://cdn.elifesciences.org/articles/69198/elife-69198-fig2-data3-v2.txt
Figure 3 with 2 supplements
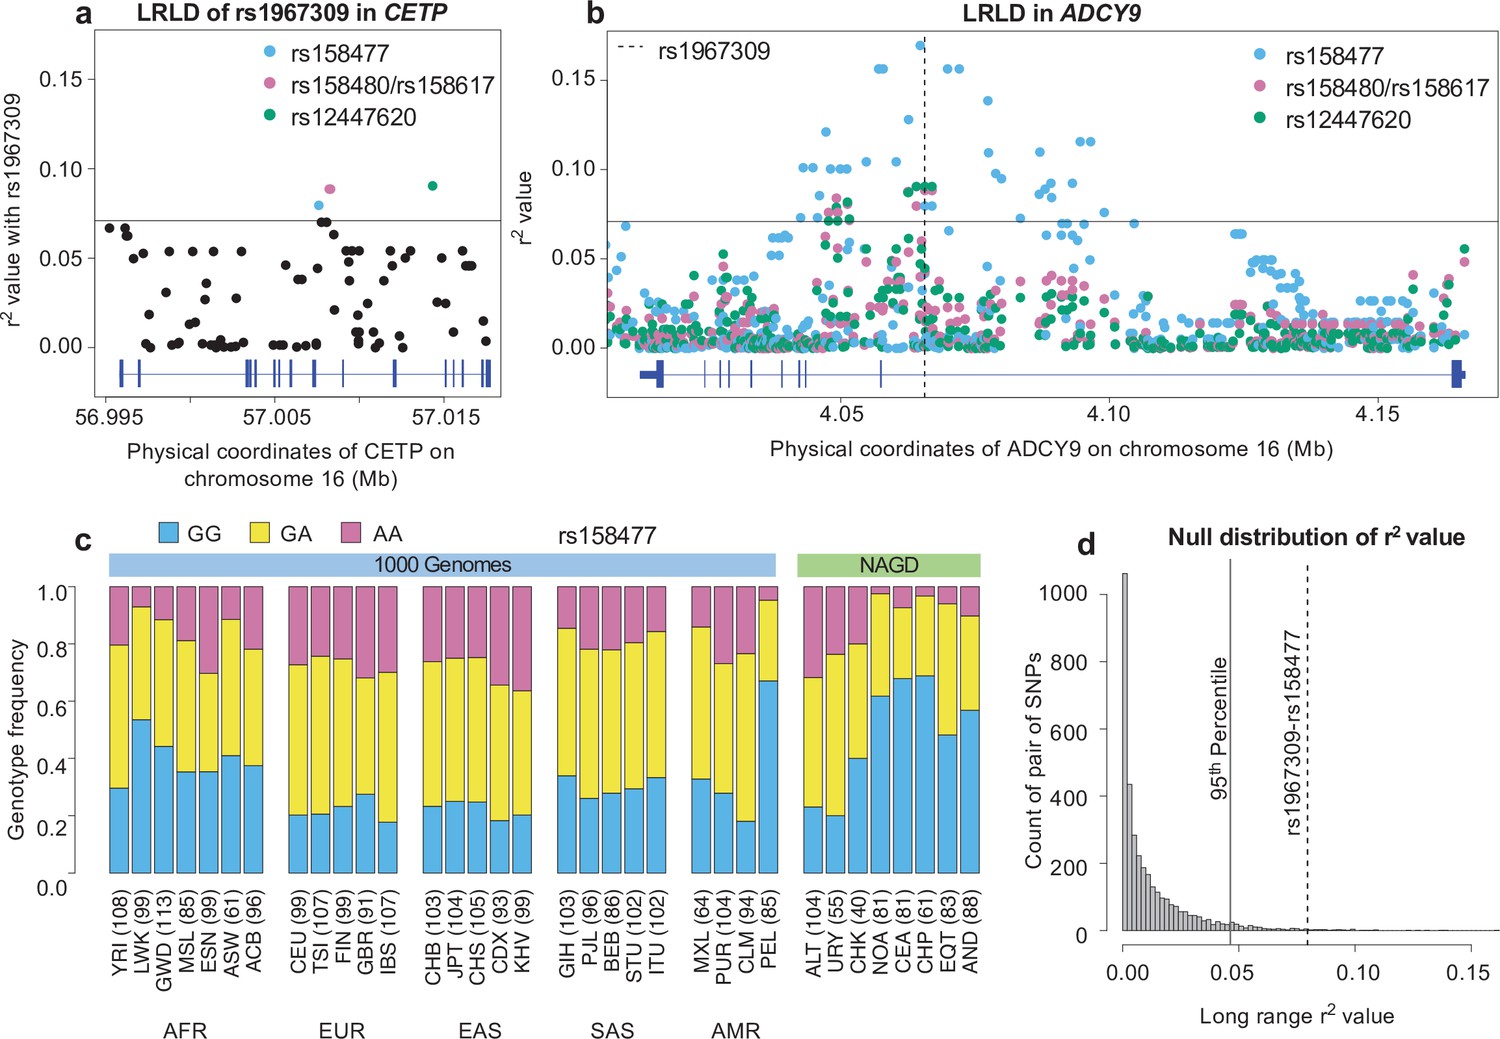
Long-range linkage disequilibrium between rs1967309 and rs158477 in Peruvians from Lima, Peru.
(a) Genotype correlation (r2) between rs1967309 and all SNPs with MAF >5% in CETP, for the PEL population. (b) Genotype correlation between the three loci identified in (a) to be in the 99th percentile and all SNPs with MAF >5% in ADCY9. The dotted line indicates the position of rs1967309. The horizontal lines in (a,b) represent the threshold for the 99th percentile of all comparisons of SNPs (MAF >5%) between ADCY9 and CETP. Figure 3—figure supplement 1 presents the same plots for Andeans and in the replication cohort (LIMAA) and Figure 3—figure supplement 2 compares the r2 values between PEL and LIMAA (c) Genotype frequency distribution of rs158477 in 1000G and Native American populations. (d) Genomic distribution of r2 values from 3,513 pairs of SNPs separated by between 50 and 60 Mb and 61 ± 10 cM away across all Peruvian chromosomes from the PEL sample, compared to the rs1967309-rs158477 r2 value (dotted gray line) (genome-wide empirical p-value = 0.01). The vertical black line shows the threshold for the 95th percentile threshold of all pairs. Gene plots showing location of exons for CETP (a) and ADCY9 (b) are presented in blue below each plot. Abbreviations: Altaic from Mongolia and Russia: ALT; Uralic Yukaghir from Russia: URY; Chukchi Kamchatkan from Russia: CHK; Northern American from Canada, Guatemala and Mexico: NOA; Central American from Costal Rica and Mexico: CEA; Chibchan Paezan from Argentina, Bolivia, Colombia, Costa Rica and Mexico: CHP; Equatorial Tucanoan from Argentina, Brazil, Colombia, Gualana and Paraguay: EQT; Andean from Bolivia, Chile, Colombia and Peru: AND. For 1000G populations, abbreviations can be found here https://www.internationalgenome.org/category/population/.
-
Figure 3—source data 1
R2 values of all SNPs between ADCY9 and CETP genes in the PEL population from 1000G.
This file contains the result from the geno-r2 command of the vcftools software for all SNPs (MAF >5%) of the PEL population between ADCY9 and CETP genes. The script to create Figure 3a and b can be found here .
- https://cdn.elifesciences.org/articles/69198/elife-69198-fig3-data1-v2.txt
-
Figure 3—source data 2
Source file for genotype frequency distribution of rs158477.
This file contains the genotype frequency of rs158477 for each subpopulation from 1000G and NAGD, with the number of individuals by subpopulation.
- https://cdn.elifesciences.org/articles/69198/elife-69198-fig3-data2-v2.txt
-
Figure 3—source data 3
R2 values used for the null distribution in the PEL population from 1000G.
3,513 pairs of SNPs on chromosome 1–18 with a MAF between 15% and 30%, separated by between 50 and 60 Mb and 51–71 cM based on the PEL genetic map from 1000G. R2 values were obtained from the geno-r2 command of the vcftools software.
- https://cdn.elifesciences.org/articles/69198/elife-69198-fig3-data3-v2.txt
Figure 3—figure supplement 1
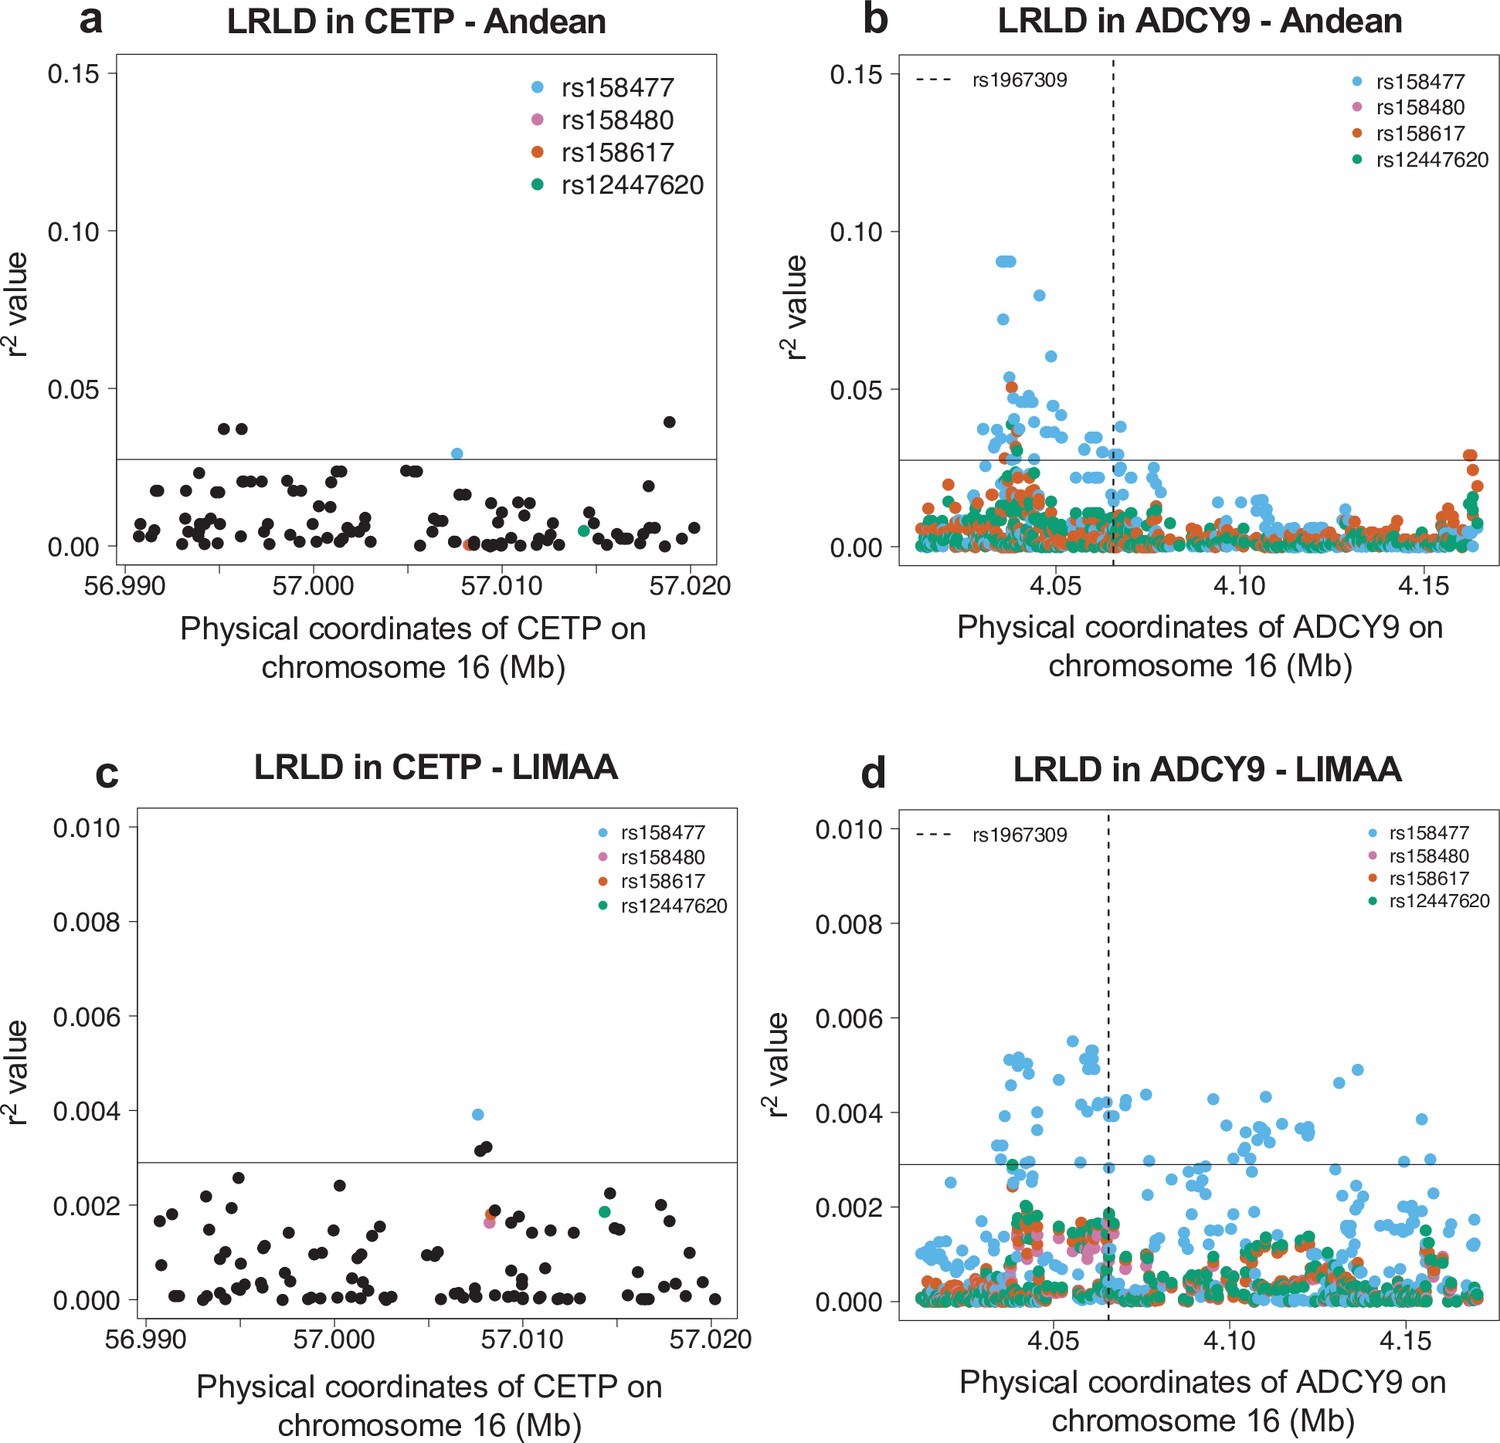
Long-range linkage disequilibrium in the Andean population from the Native Population (n = 88) (a,b) and in the LIMAA cohort (n = 3243) (c,d).
(a,c) Genotype correlation (r2) between rs1967309 and all SNPs with MAF >5% in CETP. (b,d) Genotype correlation between the three loci identified in Figure 3a to be in the 99th percentile and all SNPs with MAF >5% in ADCY9. The dotted line indicates the position of rs1967309. The horizontal lines represent the threshold for the 99th percentile of all comparisons of SNPs (MAF >5%) between ADCY9 and CETP.
Figure 3—figure supplement 2
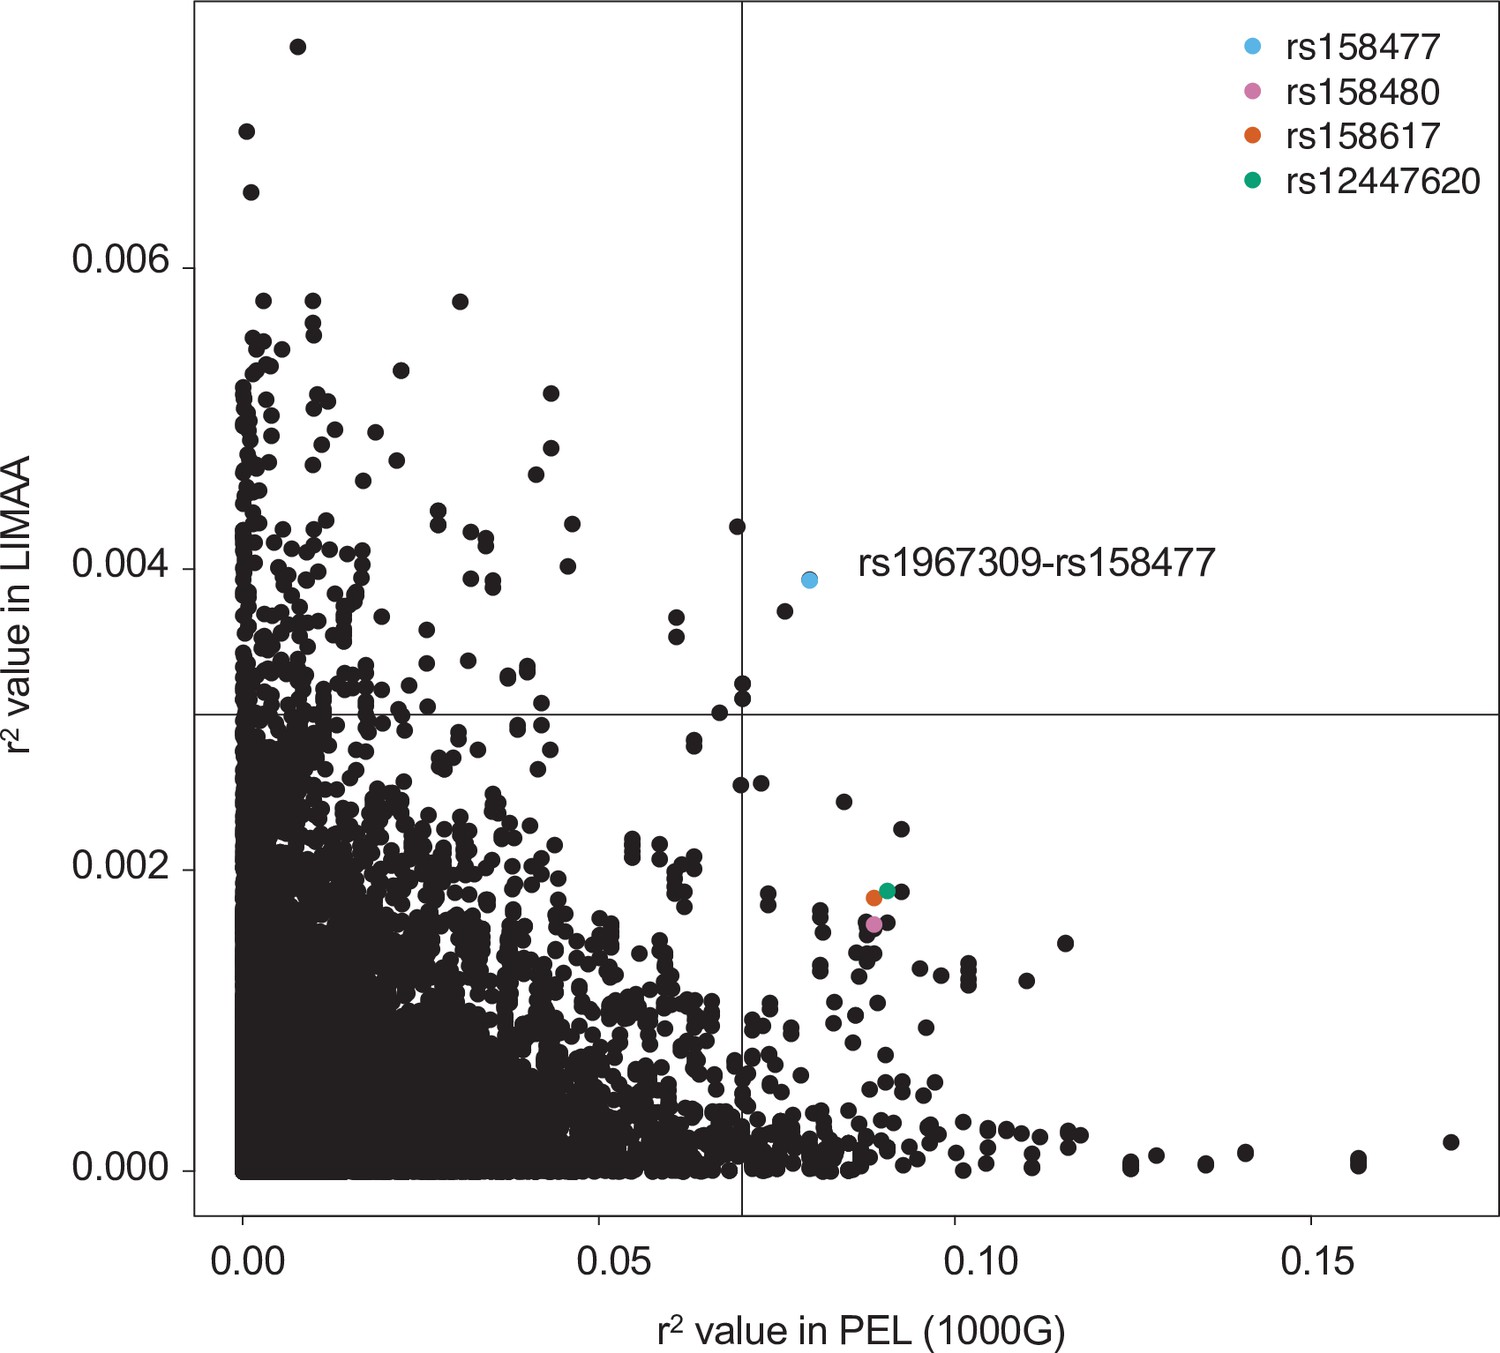
Comparison of genotype correlation between Peruvian from 1000G and from the LIMAA cohort.
Comparison of genotype correlation (r2) between all SNPs in ADCY9 and CETP with MAF >5% in the Peruvian population (PEL) in 1000G (x axis) and LIMAA cohort (y axis). Colored dots represent the value for SNPs higher than the 99th percentile with rs1967309 in PEL identified in Figure 3a. Black lines represent the 99th percentile in both populations.
Figure 4 with 3 supplements
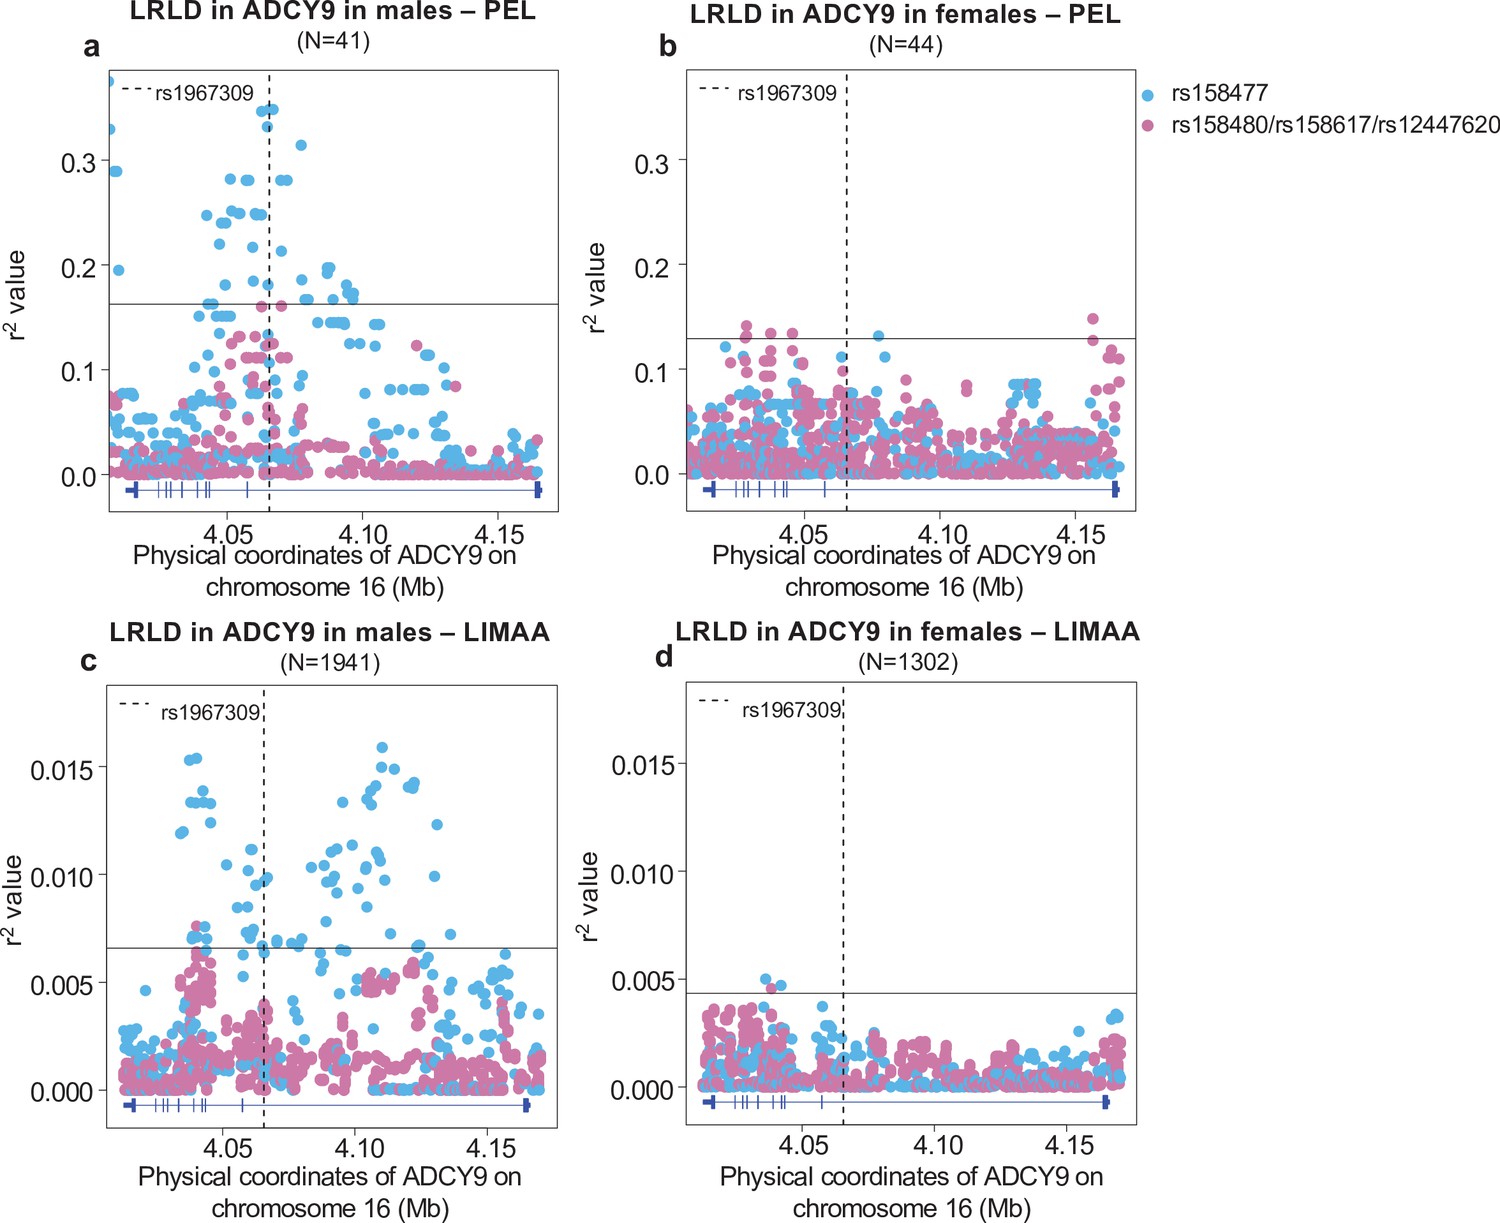
Sex-specific long-range linkage disequilibrium.
Genotype correlation between the loci identified in CETP in Figure 3a and all SNPs with MAF >5% in ADCY9 for (a,b) the PEL population and (c,d) LIMAA cohort in males (a,c) and in females (b,d). Genotype frequencies per sex are shown in Figure 4—figure supplement 1 and sex-specific PBS values in Figure 4—figure supplement 2. The horizontal line shows the threshold for the 99th percentile of all comparisons of SNPs (MAF >5%) between ADCY9 and CETP. The vertical dotted line represents the position of rs1967309. Blue dots represent the rs158477 SNPs and pink represents the other three SNPs identified in Figure 3a (rs158480, rs158617, and rs12447620), which are in near-perfect LD. Figure 4—figure supplement 3 shows the same analysis in Andeans from NAGD. Gene plots for ADCY9 showing location of its exons are presented in blue below each plot.
-
Figure 4—source data 1
R2 values of all SNPs between ADCY9 and CETP genes in the PEL population from 1000G and LIMAA cohort in male and female.
This zip archive contains all files of r2 values obtained from the geno-r2 command of the vcftools software for all SNPs (MAF >5%) of the PEL population (files beginning by F4a [male] and F4b [female]) and the LIMAA cohort (files beginning by F4c [male] and F4d [female]) between ADCY9 and CETP genes stratified by sex. Scripts to create those figures can be found here: Gamache, 2021.
- https://cdn.elifesciences.org/articles/69198/elife-69198-fig4-data1-v2.zip
Figure 4—figure supplement 1

Genotype frequency distribution per sex.
Genotype frequency distribution of rs1967309 in ADCY9 (a,b) and rs158477 in CETP (c,d) in populations from the 1000 Genomes (1000G) Project, in Native Americans (NAGD) and LIMAA cohorts, in females (a,c) and males (b,d). Abbreviations: Altaic from Mongolia and Russia: ALT; Uralic Yukaghir from Russia: URY; Chukchi Kamchatkan from Russia: CHK; Northern American from Canada, Guatemala and Mexico: NOA; Central American from Costal Rica and Mexico: CEA; Chibchan Paezan from Argentina, Bolivia, Colombia, Costa Rica and Mexico: CHP; Equatorial Tucanoan from Argentina, Brazil, Colombia, Gualana and Paraguay: EQT; Andean from Bolivia, Chile, Colombia and Peru: AND. For 1000G populations, abbreviations can be found here https://www.internationalgenome.org/category/population/.
Figure 4—figure supplement 2
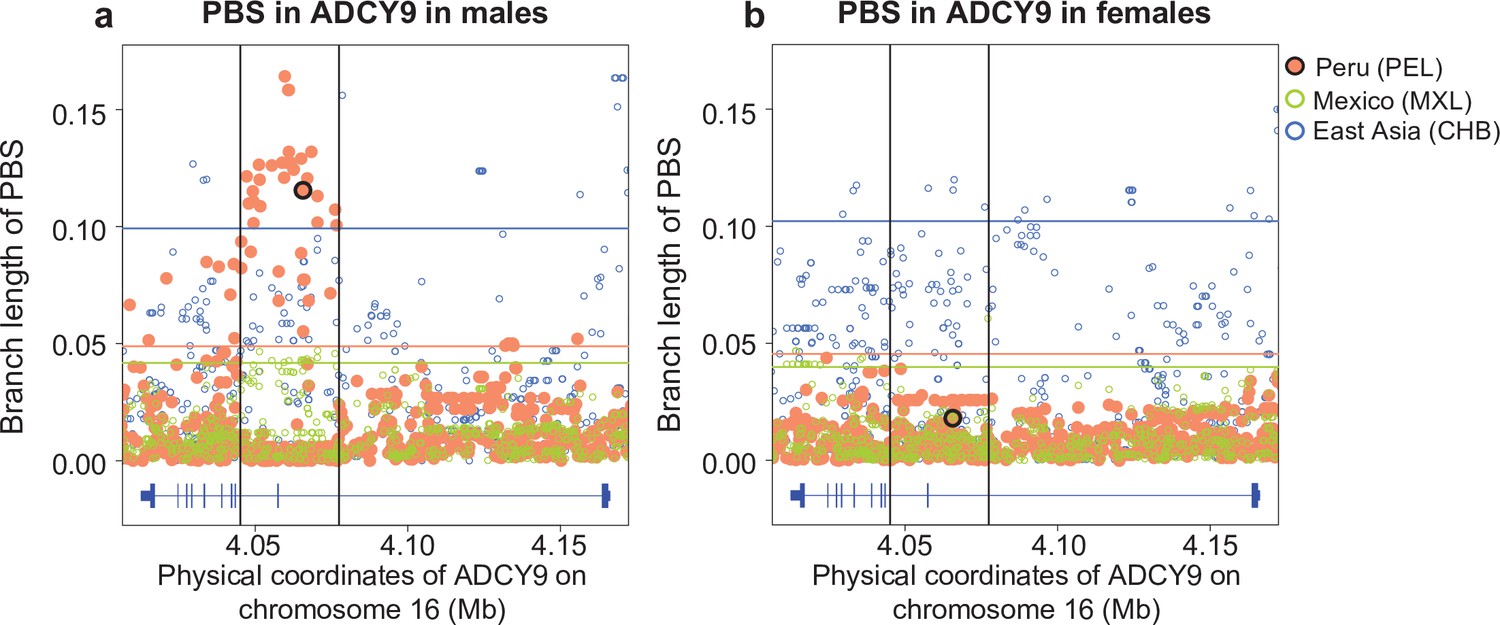
PBS values in the ADCY9 per sex, comparing the CHB (outgroup), MXL and PEL.
Horizontal lines represent the 95th percentile PBS value of the chromosome 16 for each population for each sex. Vertical black lines represent the LD block around rs1967309 (shown as a black circle for PEL). Gene plots for ADCY9 showing location of its exons are presented in blue below each plot.
Figure 4—figure supplement 3
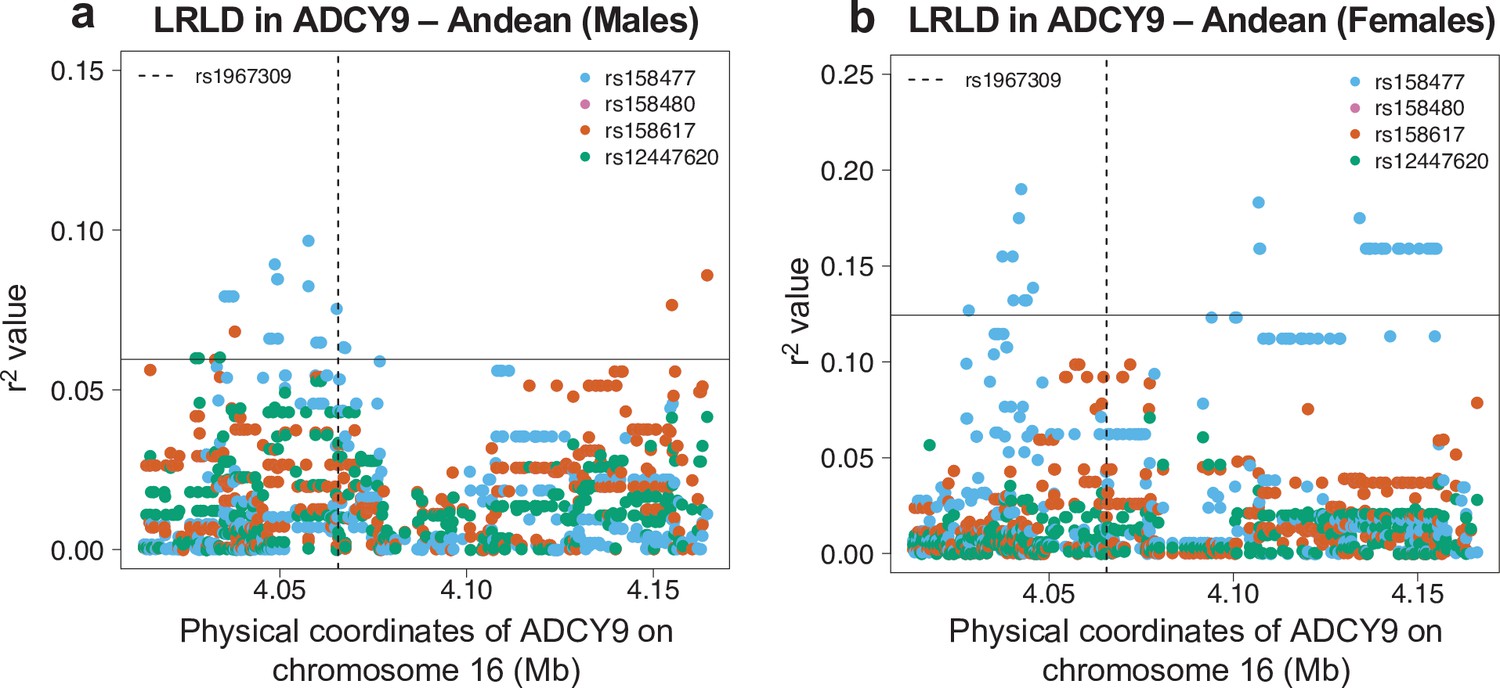
Sex-specific long-range linkage disequilibrium in the Andean population (NAGD).
Genotype correlation between the loci identified in CETP in Figure 3a and all SNPs with MAF >5% in ADCY9 for the Andean population, in males (N = 54) and in females (N = 34). The horizontal line shows the threshold for the 95th percentile of all comparisons of SNPs (MAF >5%) between ADCY9 and CETP. The vertical dotted line represents the position of rs1967309.
Figure 5 with 2 supplements

Effect of ADCY9 on CETP expression.
(a) Normalized expression of ADCY9 or CETP genes depending on wild type (WT) and ADCY9-KD in HepG2 cells from RNA sequencing on five biological replicates in each group. p-Values were obtained from a two-sided Wilcoxon paired test. qPCR and western blot results in HepG2 are presented in Figure 5—figure supplement 1. (b,c,d)CETP expression depending on the combination of rs1967309 and rs158477 genotypes in (b) GEUVADIS (p-value = 0.03, ß = –0.22, N = 287), (c) GTEx-Skin Sun Exposed in males (p-value = 0.0017, ß = –0.32, N = 330) and in (d) GTEx-tibial artery in females (p-value = 0.026, ß = 0.38, N = 156), for individuals of European descent according to principal component analysis. p-Values reported were obtained from a two-way interaction of a linear regression model for the maximum number of PEER/sPEER factors considered. Figure 5—figure supplement 2 show the interaction p-values depending on number of PEER/sPEER factors included in the linear models.
-
Figure 5—source data 1
Normalized expression of ADCY9 and CETP genes HepG2 cells.
This file contains the normalized expression of ADCY9 (ENSG00000162104) and CETP (ENSG00000087237) for the WT (samples beginning by ‘Scr’) and ADCY9-KD (samples beginning by si-1039) in the HepG2 cell line. Each sample from the WT experiment is paired with the sample in the ADCY9-KD experiment finishing by the same number (from 1 to 5).
- https://cdn.elifesciences.org/articles/69198/elife-69198-fig5-data1-v2.txt
-
Figure 5—source data 2
Residual of CETP expression by genotype.
This zip archive contains all files of CETP expression for correction of all covariables (Materials and methods) in the GEUVADIS (file beginning by F5b) and GTEx (Skin-male: file beginning by F5c; Artery-female: file beginning by F5d) datasets. The number of PEER factors added in the linear regression is written in the title of the file. In each file, the first column represents residual values of CETP expression after correcting for each covariable. The second column is the genotype of rs1967309 (0 = AA, 1 = AG, 2 = GG). The third column is the genotype combination of the rs1967309 (first number, same coding that the second column) and rs158477 (second number, 0 = GG, 1 = GA, 2 = AA).
- https://cdn.elifesciences.org/articles/69198/elife-69198-fig5-data2-v2.zip
Figure 5—figure supplement 1
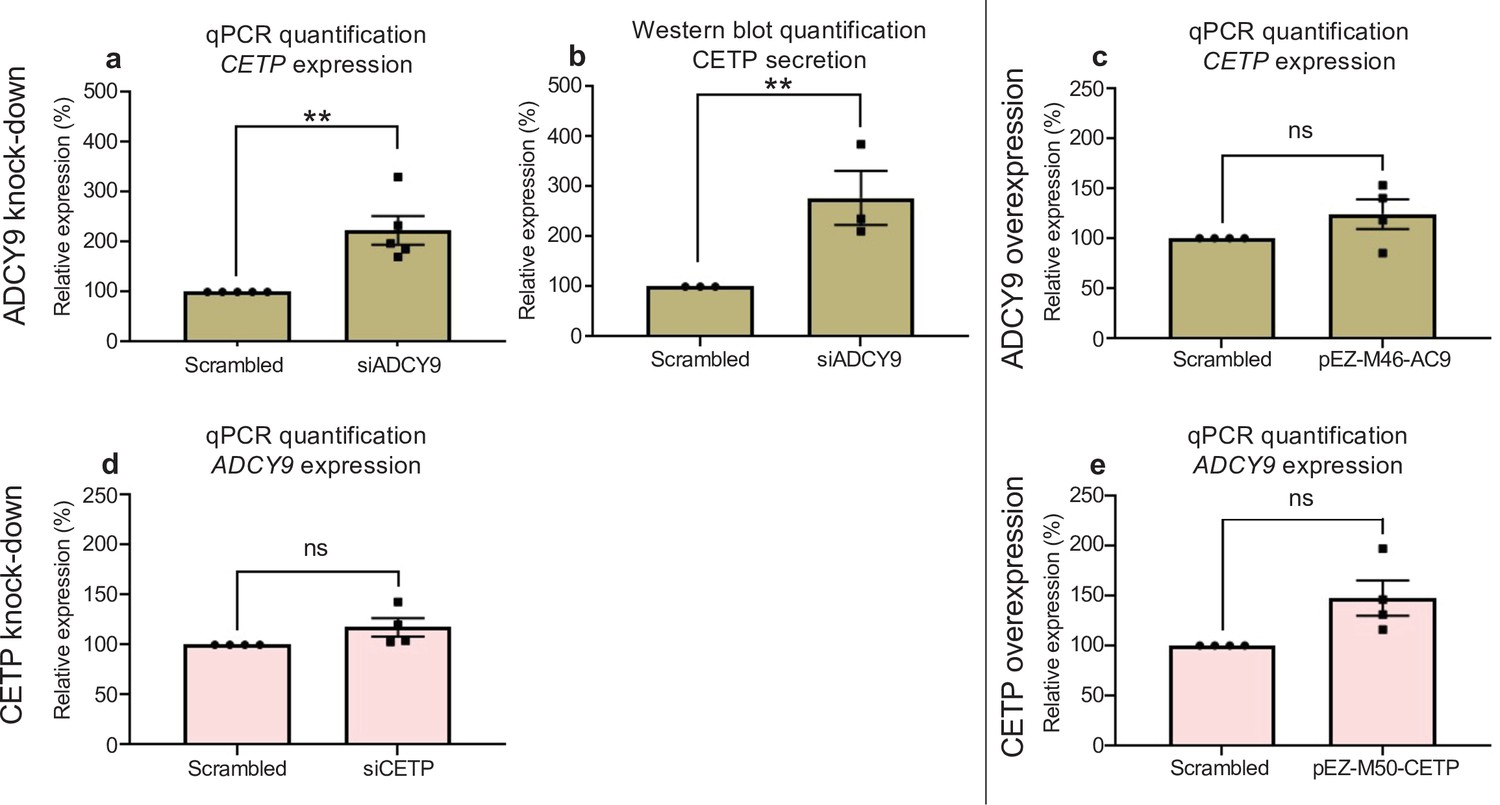
ADCY9/CETP interaction in HepG2 cells.
(a) Relative mRNA expression of CETP of HepG2 cells 72 hr post-transfection with siRNA against human ADCY9 (si1039). qPCR assay was normalized with PGK1 and HBS1L genes, n = 5 independent experiments, (p-value = 0.0026 from t-test). (b) Quantification of CETP protein by Western blot assay, 200 ml of cell media (concentrated with Amicon ultra 0.5 ml 10 kDA units) from cells transfected with siRNA against human ADCY9 (si1039), were separated on 10 % TGX-acrylamide gel and transferred to PVDF membrane. CETP protein expression was determined using a primary antibody rabbit monoclonal anti-CETP (Abcam, ab157183) 1:1000 (3 % BSA, TBS, Tween 20 0.5%) O/N 4 °C, followed by HRP-conjugated secondary antibody goat anti-rabbit 1:10,000 (3% BSA) 1 hr RT. Figure b represents densitometry analysis of n = 3 experiments, p-value = 0.0029 from t-test. (c,e) Relative mRNA expression of (c) CETP and (e) ADCY9 genes in HepG2 cells post-transfection with pEZ-M50-CETP (overexpression of CETP) or pEZ-M46-ADCY9 (overexpression of ADCY9) plasmids. qPCR assay was normalized with PGK1 and HBS1L genes, n = 4 independent experiments. (d) Relative mRNA expression of ADCY9 of HepG2 cells 72 hr post-transfection with siRNA against human CETP. qPCR assay was normalized with PGK1 and HBS1L genes, n = 4 independent experiments.
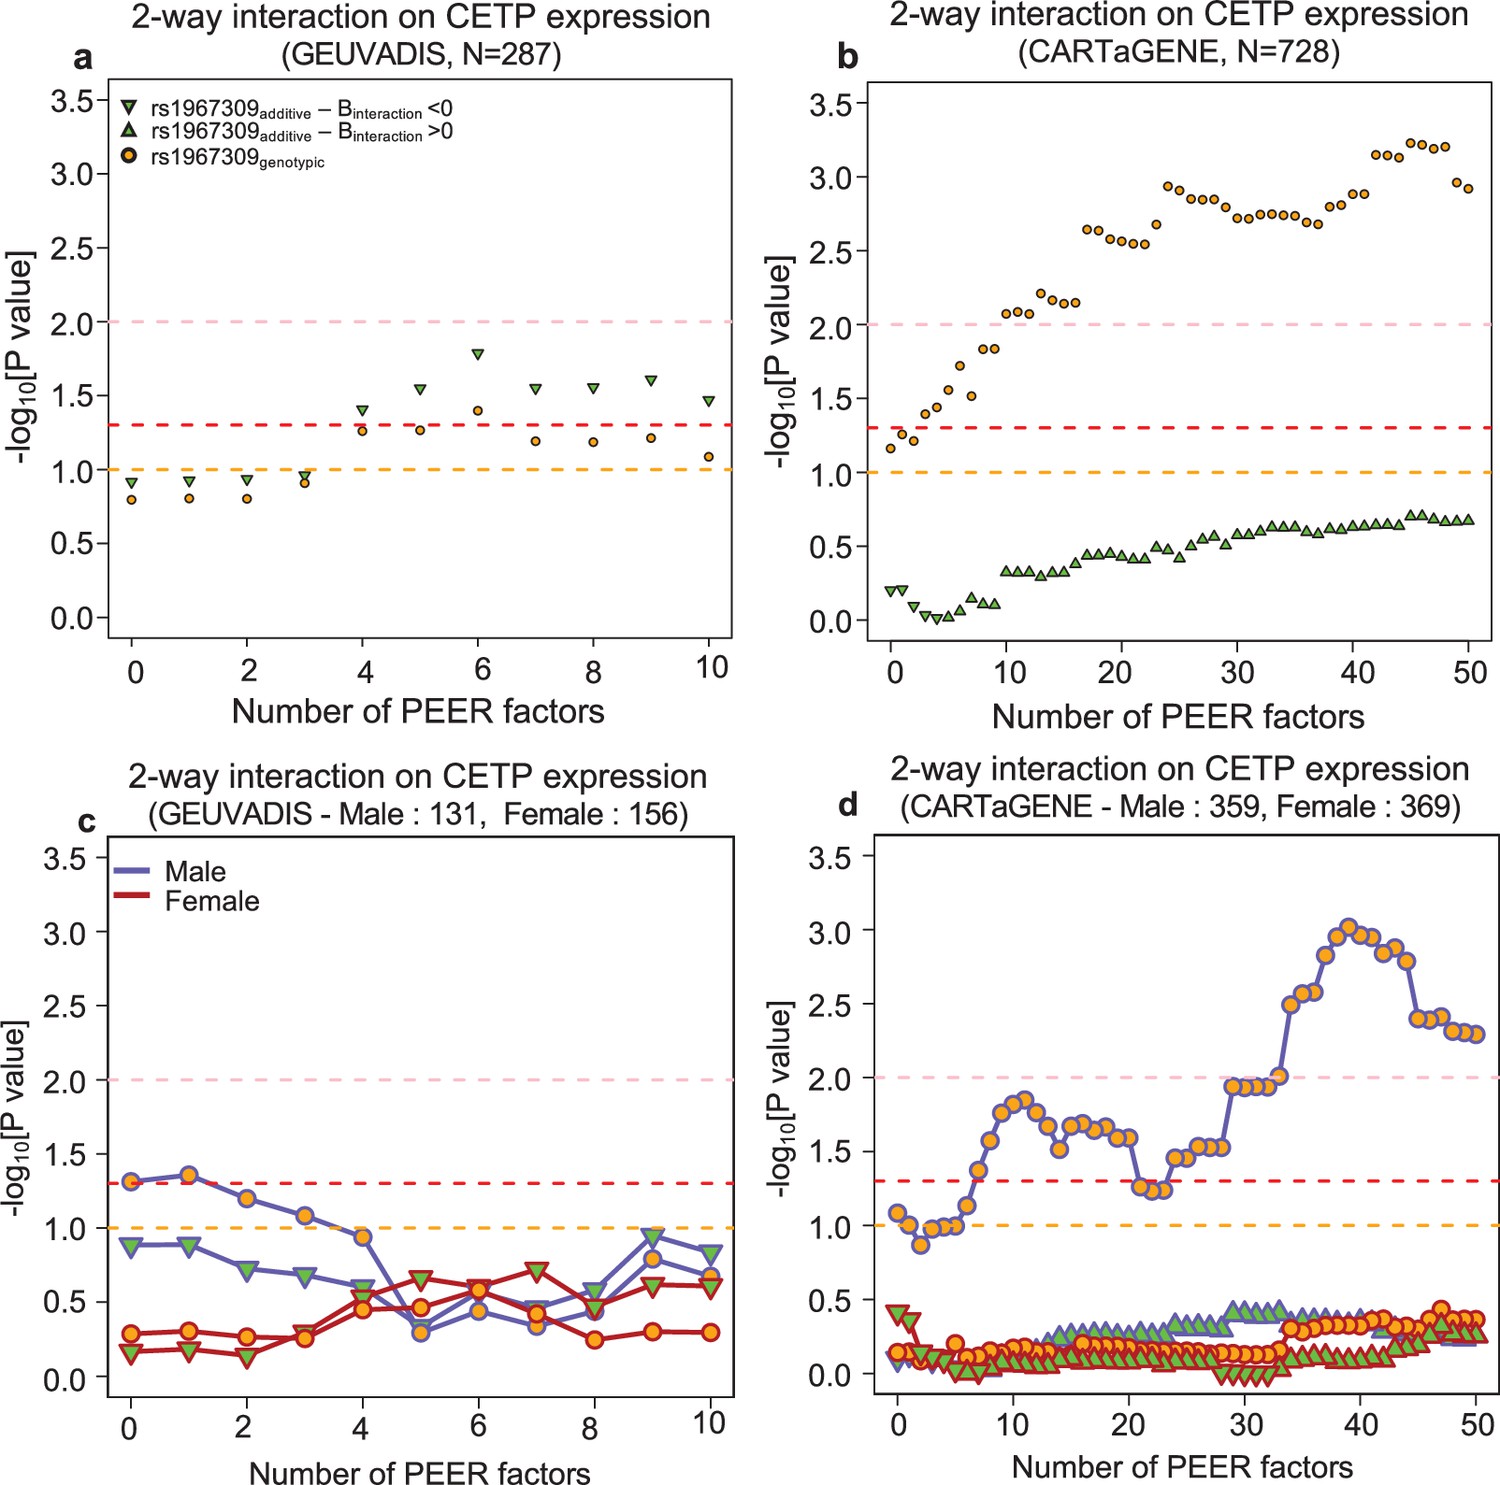
Figure 5—figure supplement 2
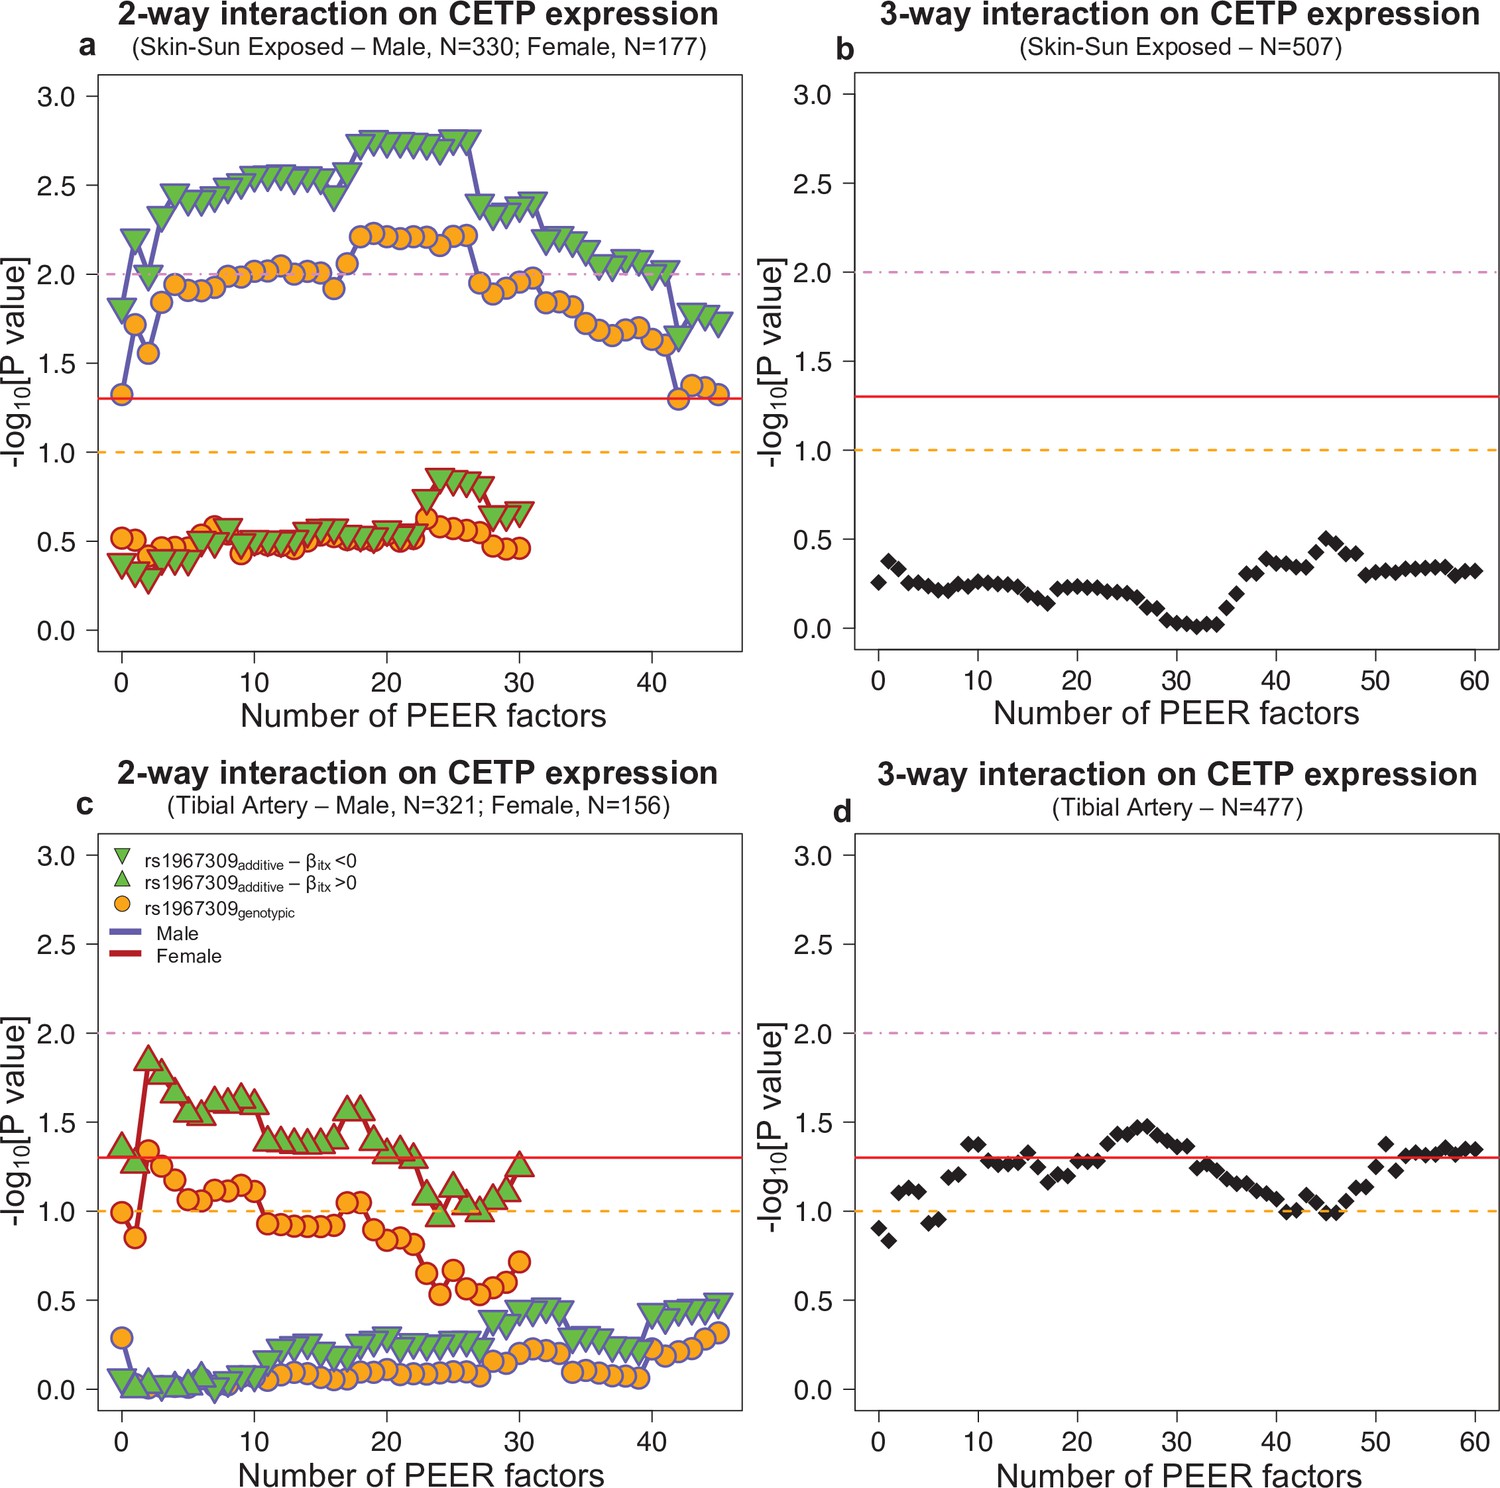
Interaction effect p-values on CETP expression depending by the number of PEER factors in Skin-sun exposed (a,b) and Tibial artery (c,d) in GTEx.
For the two-way interaction (rs1967309*rs158477) (a,c), rs158477 is codded as additive (GG = 0, GA = 1, AA = 2). In the additive model (green triangle), rs1967309 is codded as additive (AA = 0, AG = 1, GG = 2). For the genotypic model (orange circle), rs1967309 was codded as a genotypic variable and p-values were obtained from a likelihood ratio test comparing models with and without the interaction term between the SNPs. The color of lines linking each value represents the sex. For the three-way interaction (rs1967309*rs158477*sex), both SNPs were codded as additive, and p-values were obtained from a linear regression model in R. P-values are presented on a -log10 scale. The orange, red and pink lines represent p-values of 0.1, 0.05, and 0.01, respectively.
Figure 6 with 2 supplements
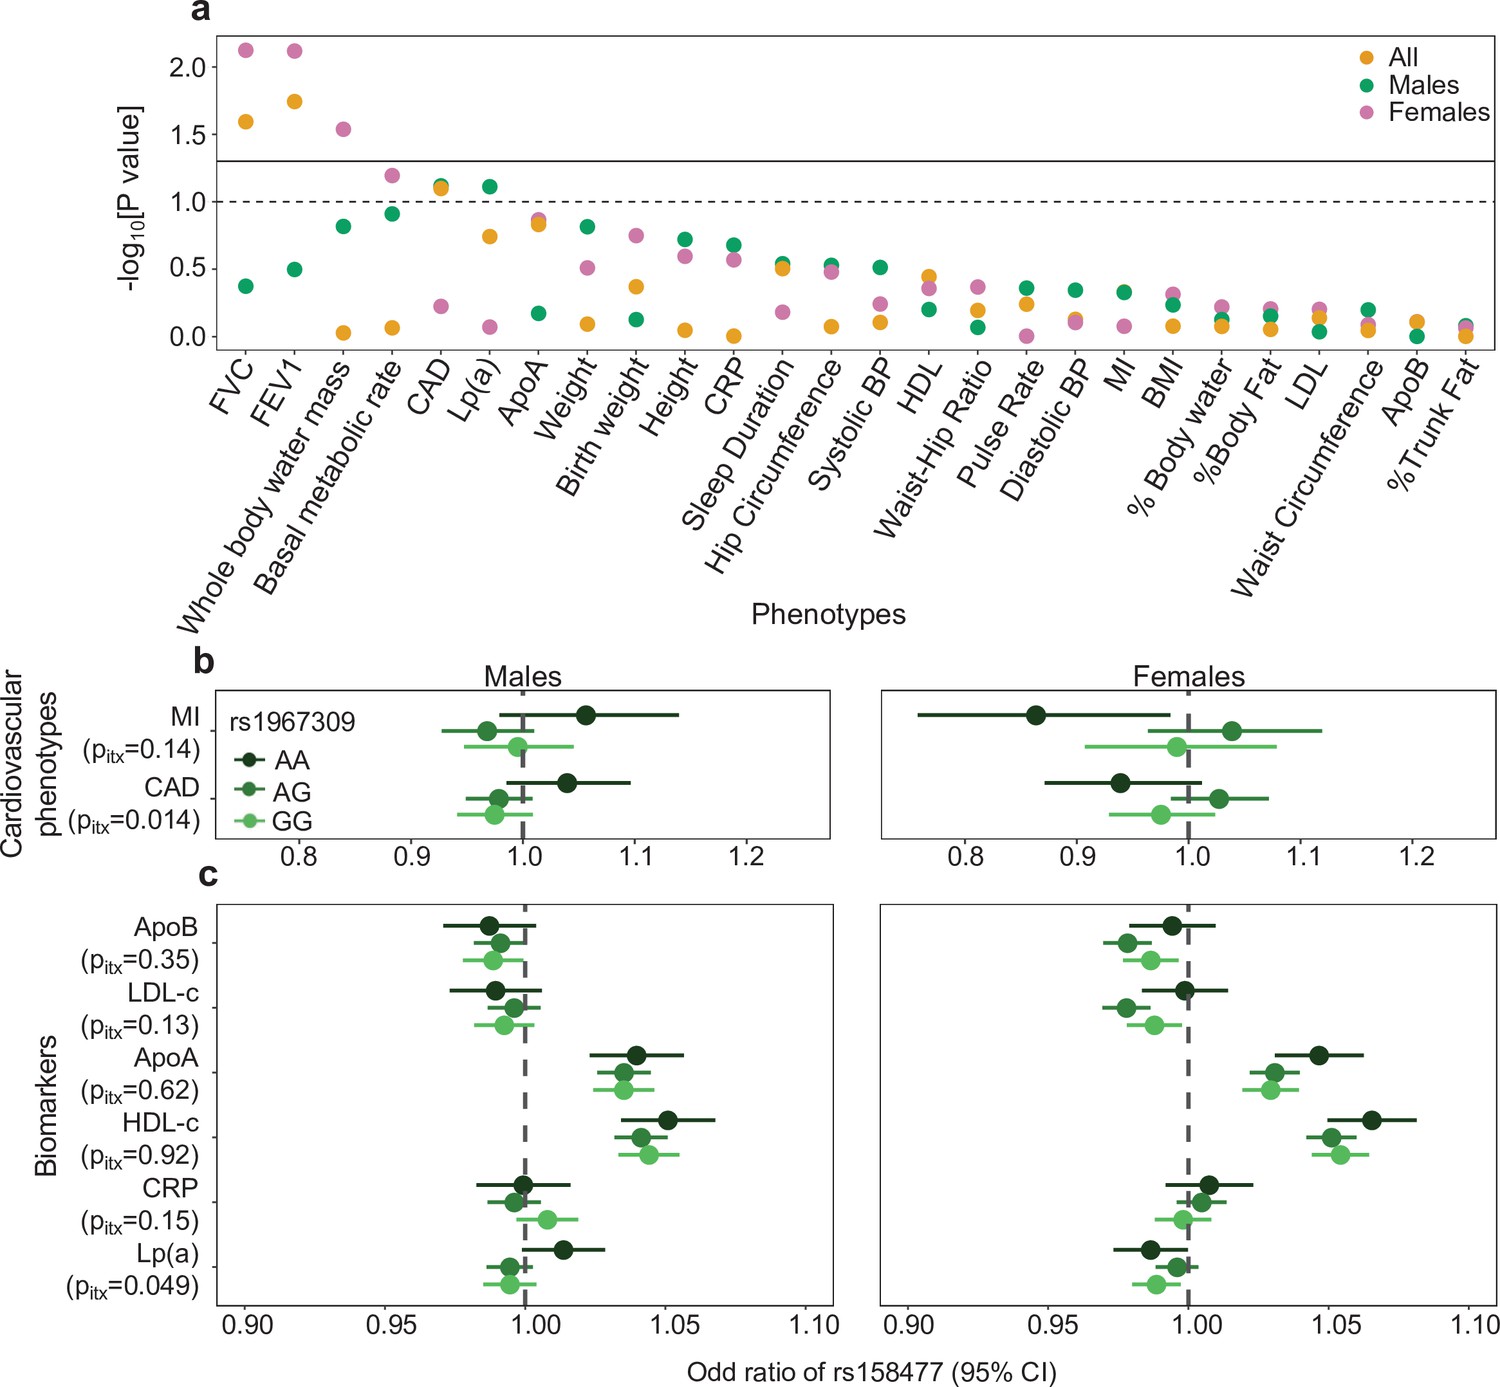
Epistatic association of rs1967309 and rs158477 on phenotypes in the UK biobank.
(a) Significance of the interaction effect between rs1967309 and rs158477 on several physiological traits, energy metabolism and cardiovascular outcomes overall and stratified by sex in the UK biobank. Horizontal lines represent the p-value thresholds at 0.05 (plain) and 0.10 (dotted). Single-SNP p-values are shown in Figure 6—figure supplement 1. (b,c) Sex-stratified effects of rs158477 on (b) cardiovascular phenotypes and (c) biomarkers depending on the genotype of rs1967309 (genotypic encoding). The p-values pitx reported come from a likelihood ratio test comparing models with and without the three-way interaction term between the two SNPs and sex. Sex-combined results using GTEx cardiovascular phenotype data are shown in Figure 6—figure supplement 2. See Appendix 1—table 2 for the list of abbreviations.
-
Figure 6—source data 1
Results of the interaction between rs1967309 and rs158477 on phenotypes in the UK biobank.
This file contains the results of the PheWAS for each phenotype in the Figure 6a for the sex-combined and stratified by sex analyses. p-Value are already converted to a -log10(p) scale and sorted by the most significant to the less significant results. Covariables used for the linear or logistic regressions are mentioned in Materials and methods. See Appendix 1—table 2 for the list of abbreviations.
- https://cdn.elifesciences.org/articles/69198/elife-69198-fig6-data1-v2.txt
-
Figure 6—source data 2
Results for the cardiovascular phenotypes and biomarkers by sex and by rs1967309 genotypes in the UK biobank.
This zip archive contains the results for the cardiovascular phenotypes (file beginning by F6b) and biomarkers (file beginning by F6c) analyses. Those files contain the p-value, the estimate (AME) and standard error (SE, to multiply by 1.959964 to get the confidence interval for α = 0.05/2) of the association of rs158477 for each genotype of rs1967309 in male or female. The covariable used are mentioned in the Materials and methods. See Appendix 1—table 2 for the list of abbreviations.
- https://cdn.elifesciences.org/articles/69198/elife-69198-fig6-data2-v2.zip
Figure 6—figure supplement 1
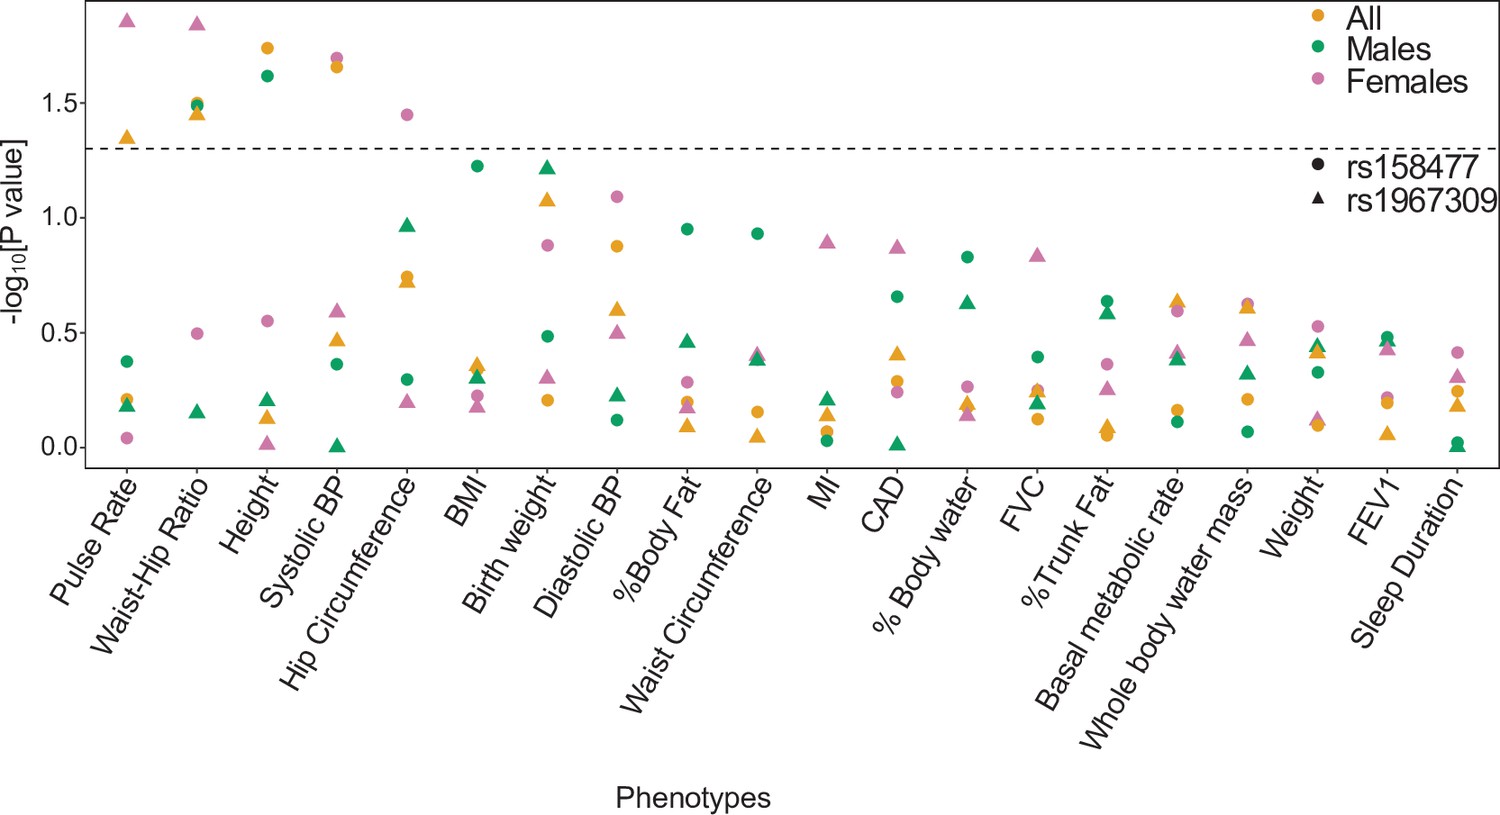
Single SNP effects of rs1967309 and rs158477 on phenotypes in the UK biobank.
Significance of the marginal effect of rs1967309 and rs158477, both codded as additive, on several physiological traits, energy metabolism and cardiovascular outcomes, overall and stratified by sex in the UK biobank. The dotted line represents the p-value at 0.05. See Appendix 1—table 2 for the list of abbreviations.
Figure 6—figure supplement 2
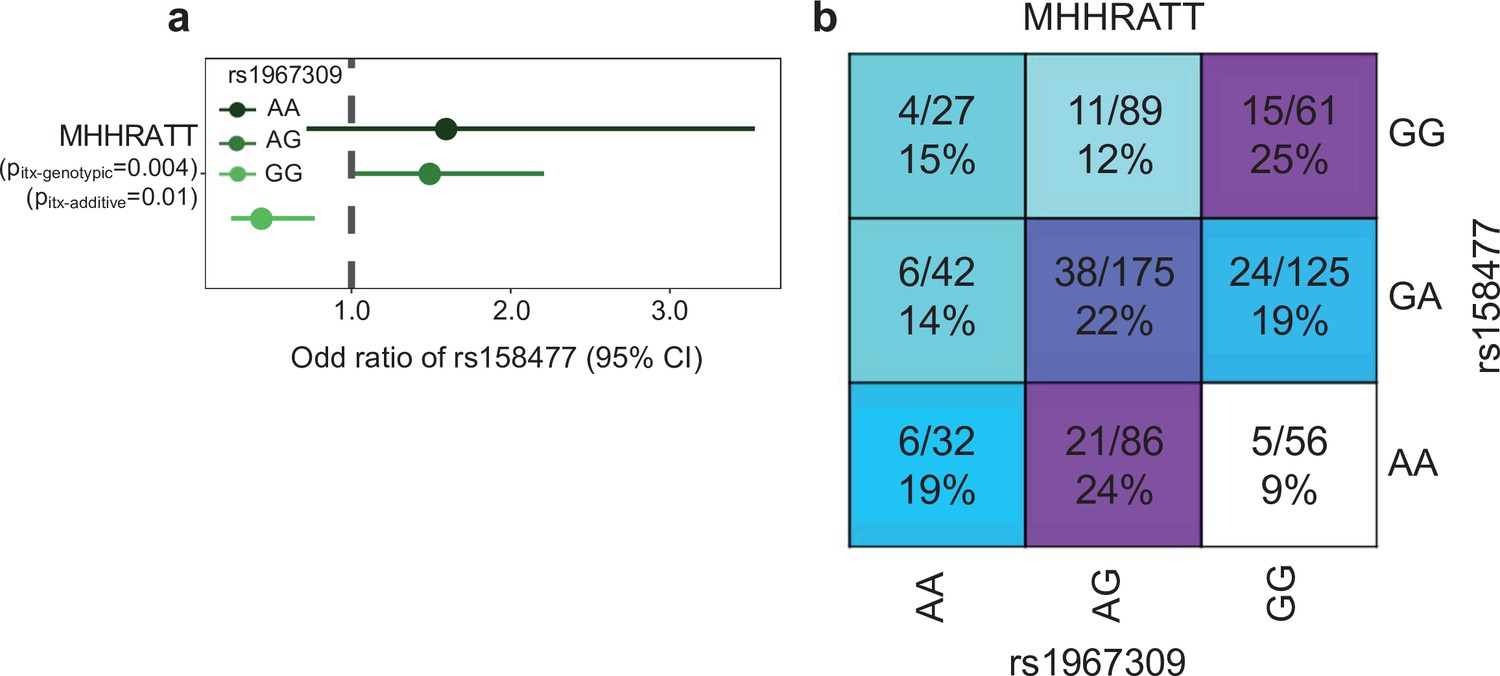
Epistatic association of rs1967309 and rs158477 on cardiovascular disease in GTEx.
(a) Effect of the rs158477 SNP on the cardiovascular phenotype (n = 693, cas = 120, control = 563) depending on the genotype of rs1967309 in GTEx. For both models, rs158477 was codded as additive (GG = 0, GA = 1, AA = 2). For the additive model, rs1967309 was codded as additive (AA = 0, AG = 1, GG = 2). p-Value of the interaction (pitx) was obtained using a linear regression in R. For the genotypic model, rs1967309 was codded as a genotypic variable and p-values were obtained from a likelihood ratio test comparing models with and without the interaction term between the SNPs. (b) Proportion of cases for each genotype combinations between rs1967309 and rs158477. The numerator indicates the number of cases and the denominator the number total of individuals (cases + controls). Darker colors show higher proportions of cases.
Appendix 1—figure 1
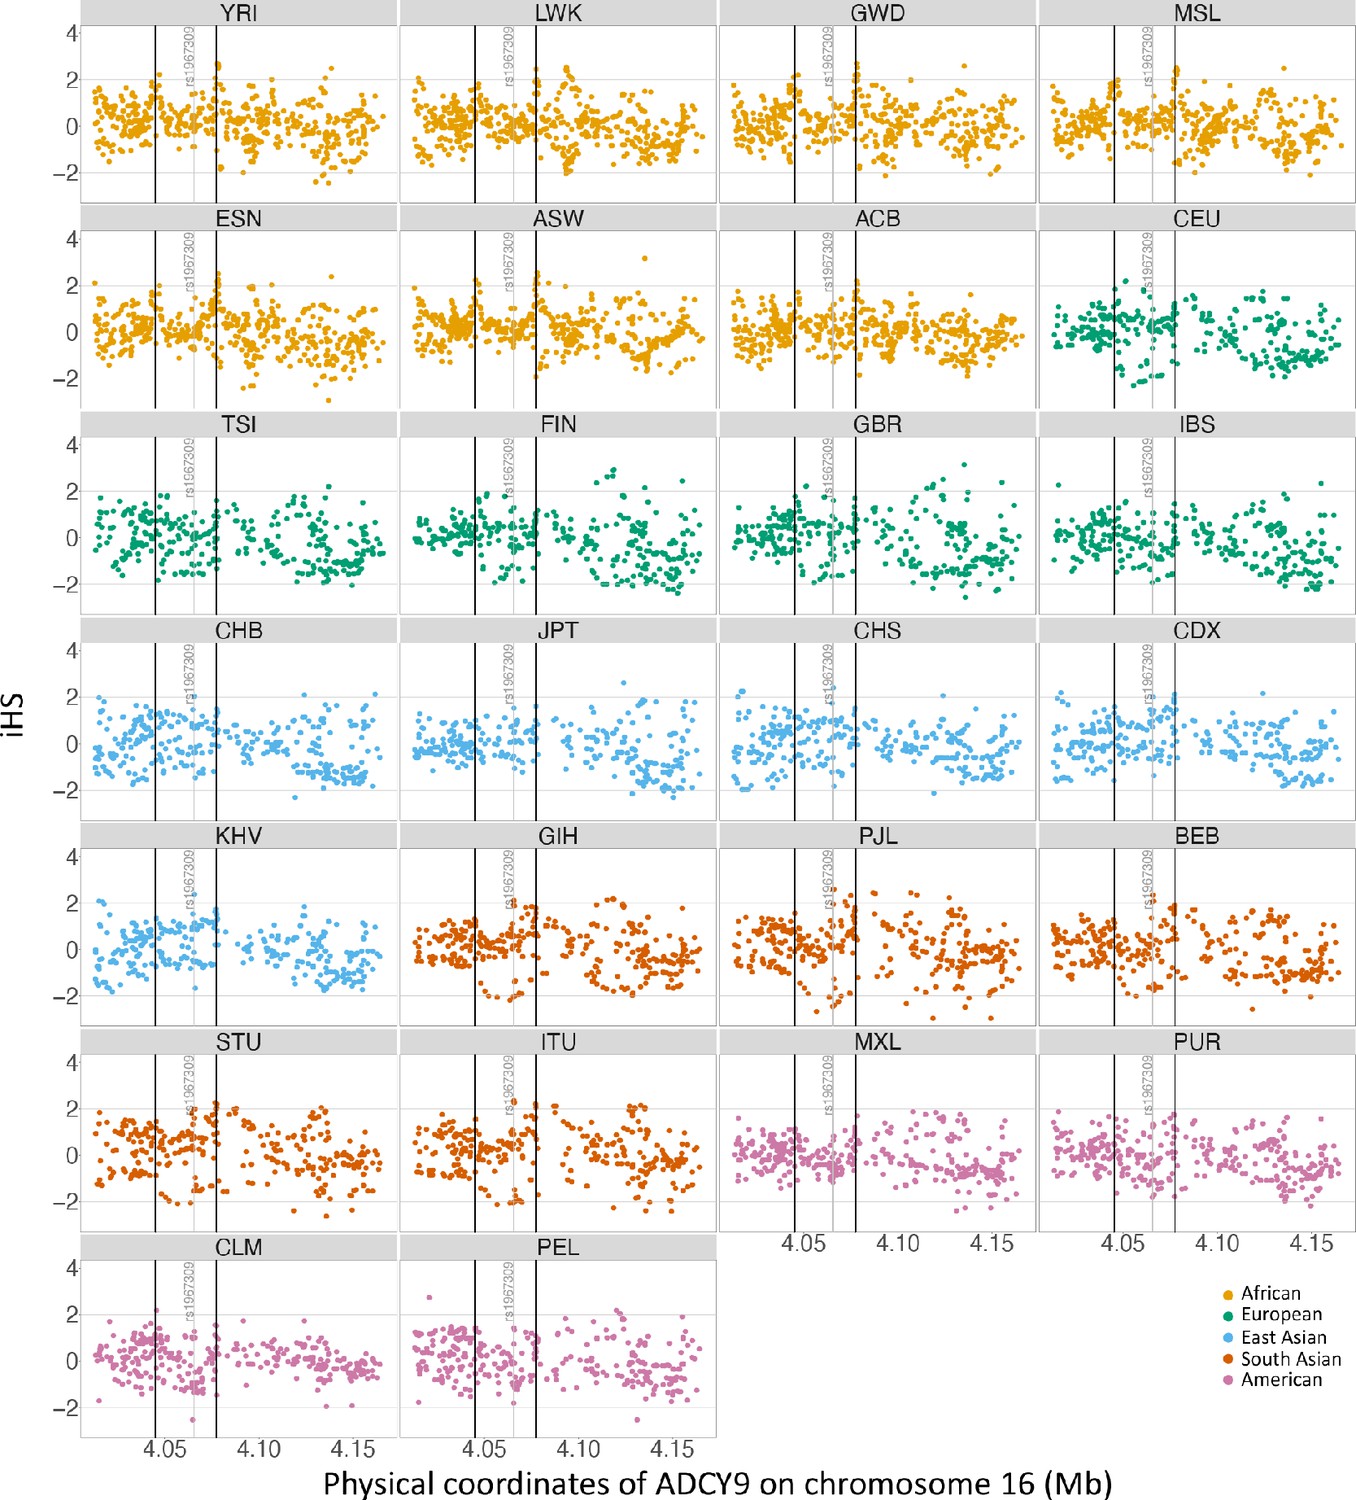
Selection signature in ADCY9.
iHS values and recombination for all populations in the ADCY9 gene. Vertical black lines represent the highest recombination rates around rs1967309 from 1000G population-specific genetic maps. Horizontal line represents the value at 2 and –2. Different colors represent one super population. In order of color: African, European, East Asia, South Asia and America. Abbreviations for the subpopulation of 1000G can be found here https://www.internationalgenome.org/category/population/.
Appendix 1—figure 2
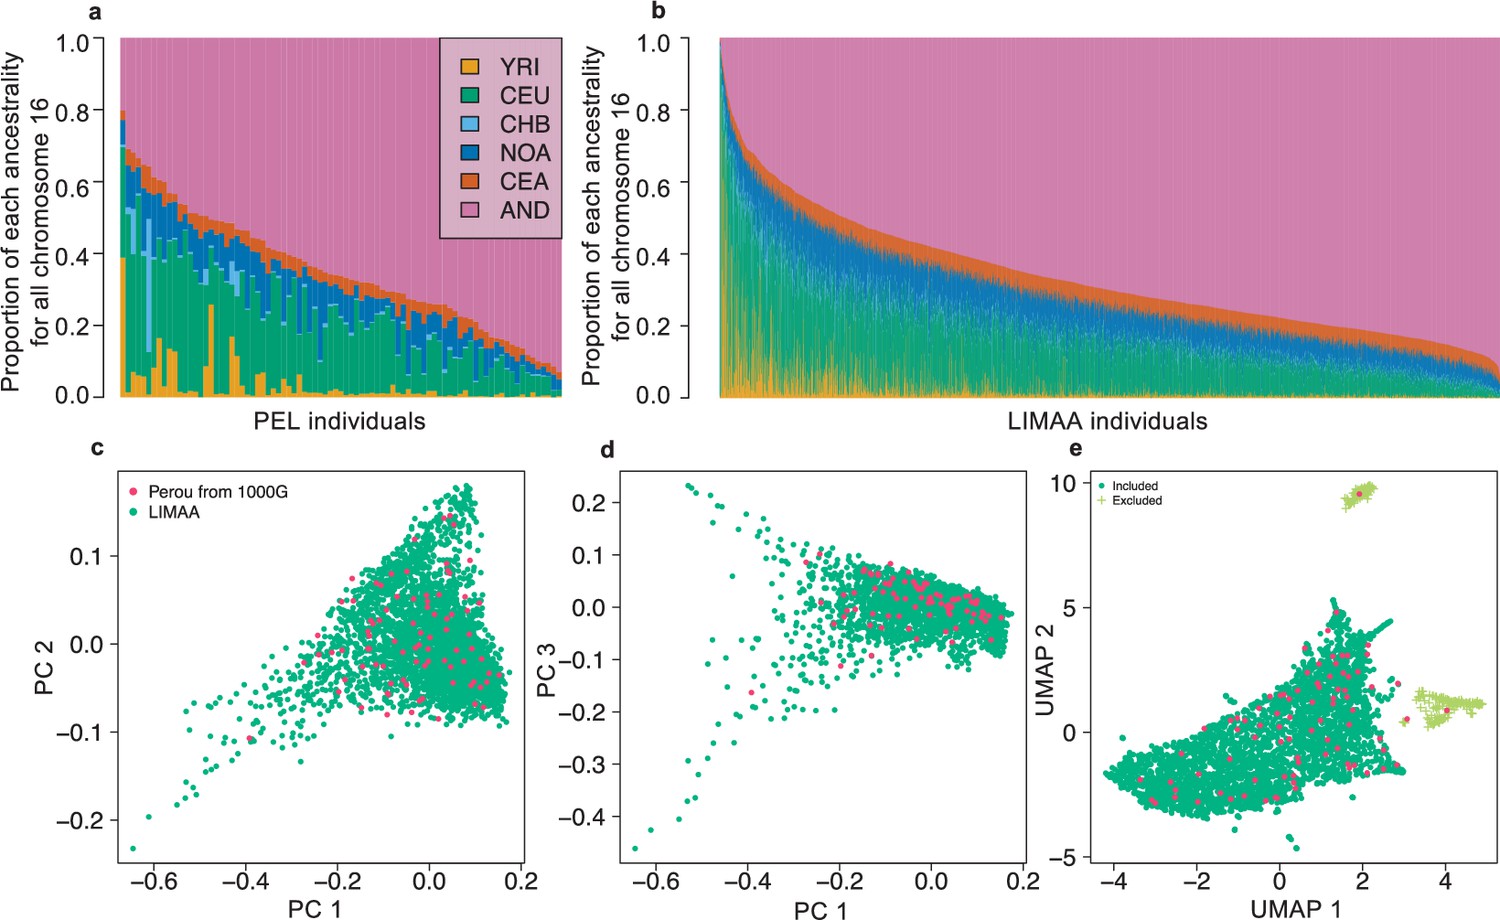
Population structure of Peruvian from LIMAA and Peruvian from 1000G.
Ancestry distribution on all chromosomes in the Peruvian from 1000G (a) and LIMAA cohort (b). Overall weighted proportion given by RFMix using reference populations from 1000G and Native American Genetic Dataset (NAGD) for the Peruvian population from 1000G (a) and from LIMAA cohort (b). 1000G populations YRI, CEU, and CHB were chosen to represent African, European, and Asian ancestry, respectively. (c,d) Principal Component Analysis using flashPCA on Peruvian from 1000G and LIMAA cohort. The top three PCs is shown. (e) UMAP analysis on the top 50 PCs. To limit confounders due to population structure, we excluded individuals in LIMAA coming from the two small groups identified by the UMAP (cross shaped light green symbols in (e)). Abbreviations for 1000G can be found here: https://www.internationalgenome.org/category/population/. Abbreviations for the Native American (NAGD): NOA: northern American; CEA: central American; AND: Andean.
Appendix 1—figure 3

Populational differentiation of CETP gene using PBS statistic.
PBS values in the CETP gene, comparing the CHB (outgroup), MXL and PEL identified by different colors, overall (a), in males (b) and in females (c). Horizontal lines represent the 95th percentile PBS value genome-wide (a) or the chromosome 16 (b,c) for each population. Position with r2 higher than the 99th percentile in the Peruvian population from the 1000G are represented by colored shape.
Appendix 1—figure 4
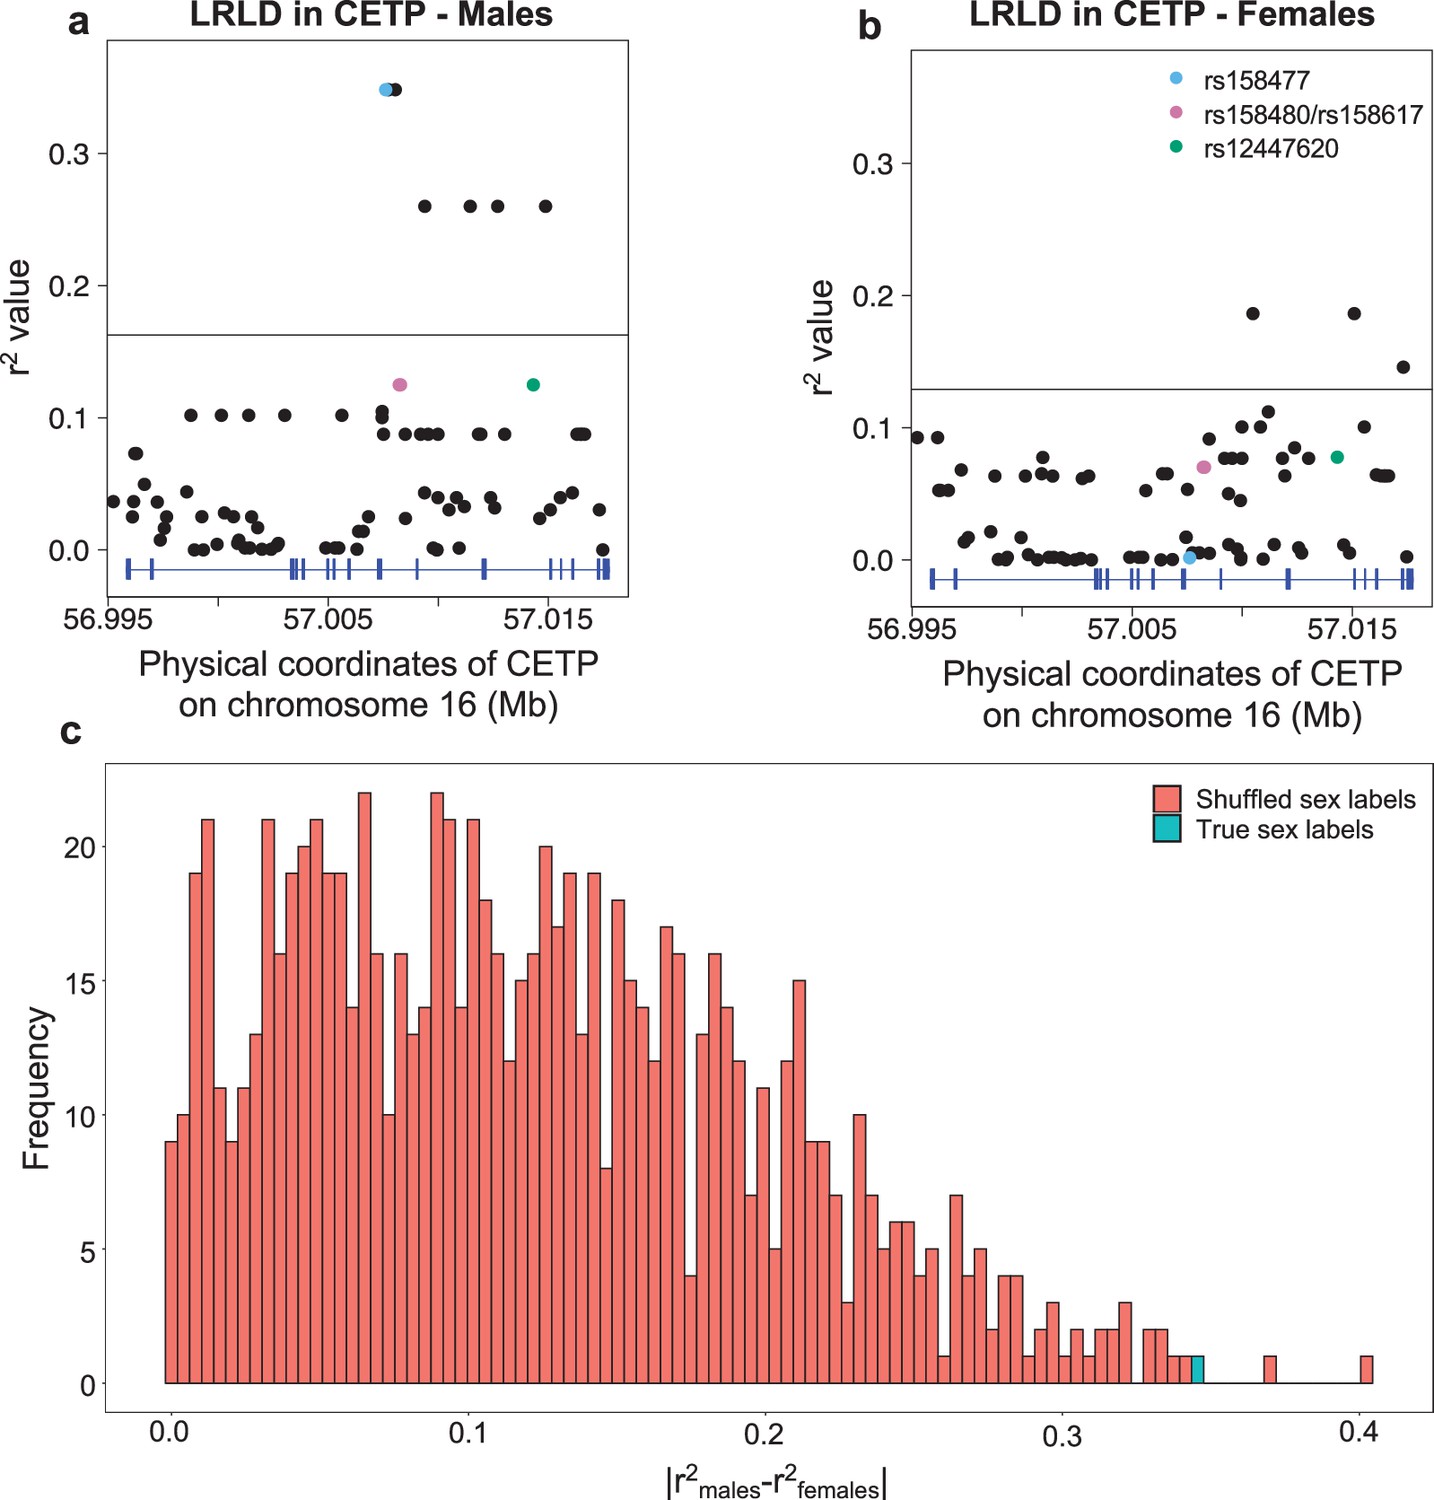
Long-range linkage disequilibrium shown in CETP for the PEL population from 1000G, stratified by sex.
Genotype correlation (r2) between the three loci identified in CETP (see Figure 2a) to be higher than the 99th percentile and all SNPs with MAF >5% in ADCY9, in males (a) and females (b). The horizontal black line is the 99th of all those comparisons between ADCY9 and CETP by sex. (c) Distribution of absolute difference of genotype correlation values obtained during the permutation analysis that shuffled the sex label for rs1967309 and rs158477 (red), compared to the value obtain with the real sex labels (blue).
Appendix 1—figure 5
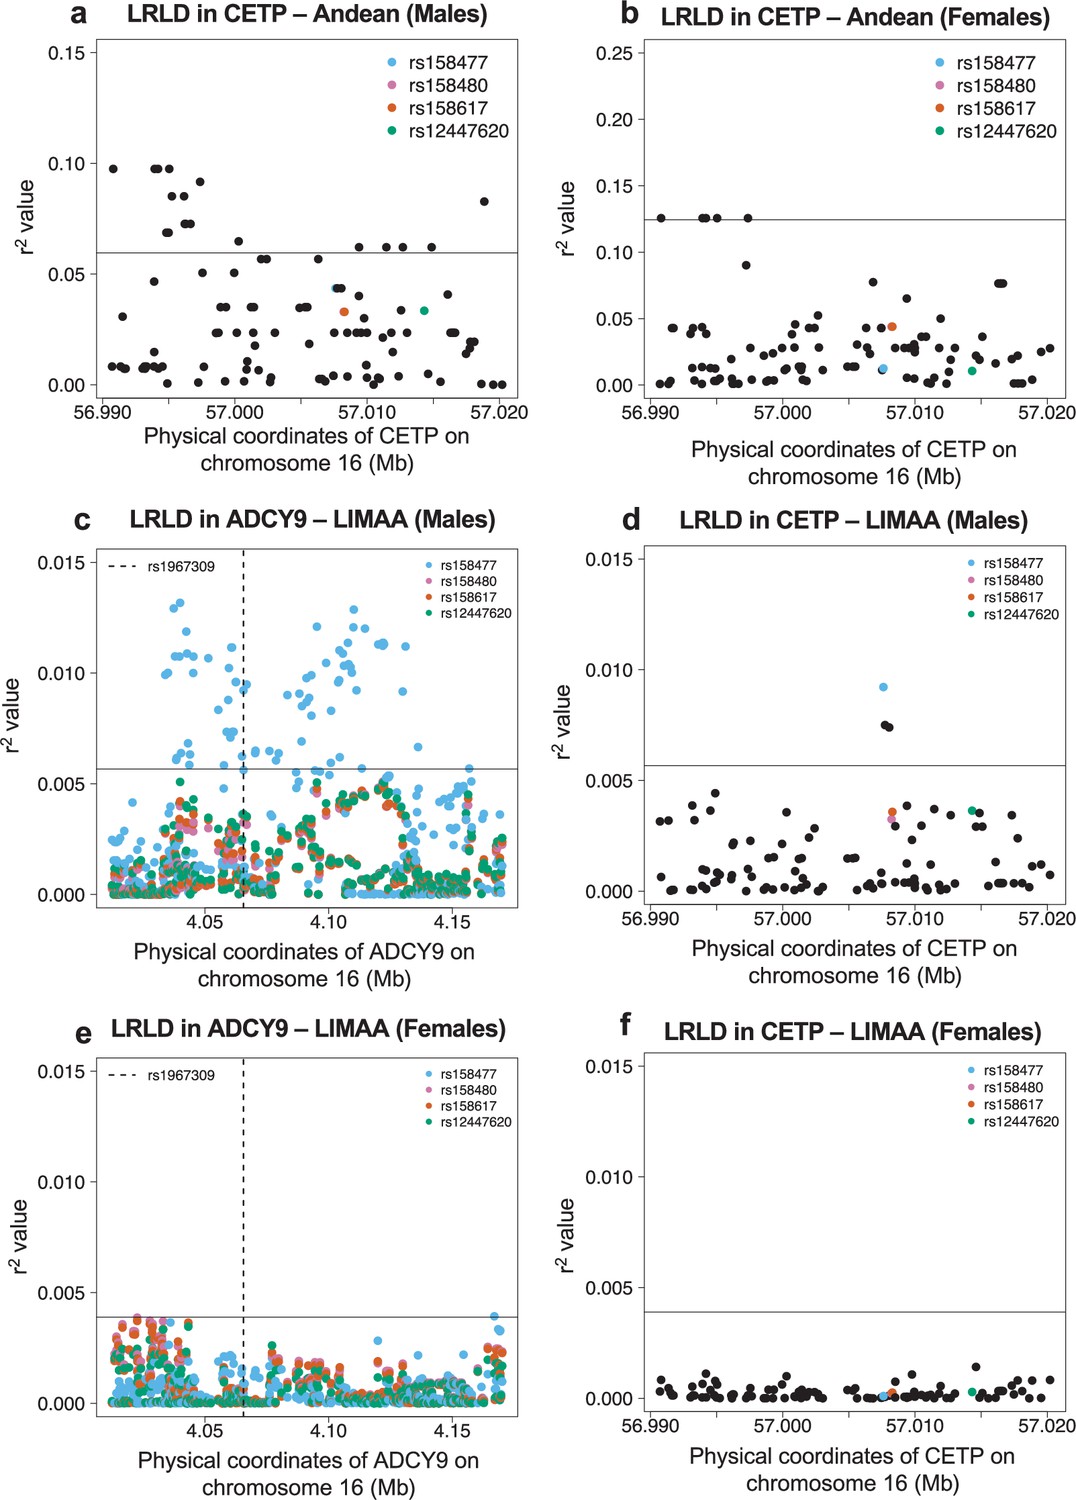
Long-range linkage disequilibrium in the Andean population from NAGD (a,b) and LIMAA cohort (c–f).
(a,b,d,f) Genotype correlation (r2) between rs1967309 and all SNPs with MAF >5% in CETP, for the Andean population from NAGD (a,b) and the LIMAA cohort (d,f). (c,e) Genotype correlation between the three loci identified in Figure 3a to be higher than the 99th percentile and all SNPs with MAF >5% in ADCY9 in LIMAA. Males (NAndean = 54, NLIMAA = 1941) (a,c,d) and females (NAndean = 34, NLIMAA = 1302) (b,e,f) are shown separately. The horizontal line is the 95th (a,b) and 99th (c–f) percentile of all comparisons between ADCY9 and CETP genes.
Appendix 1—figure 6
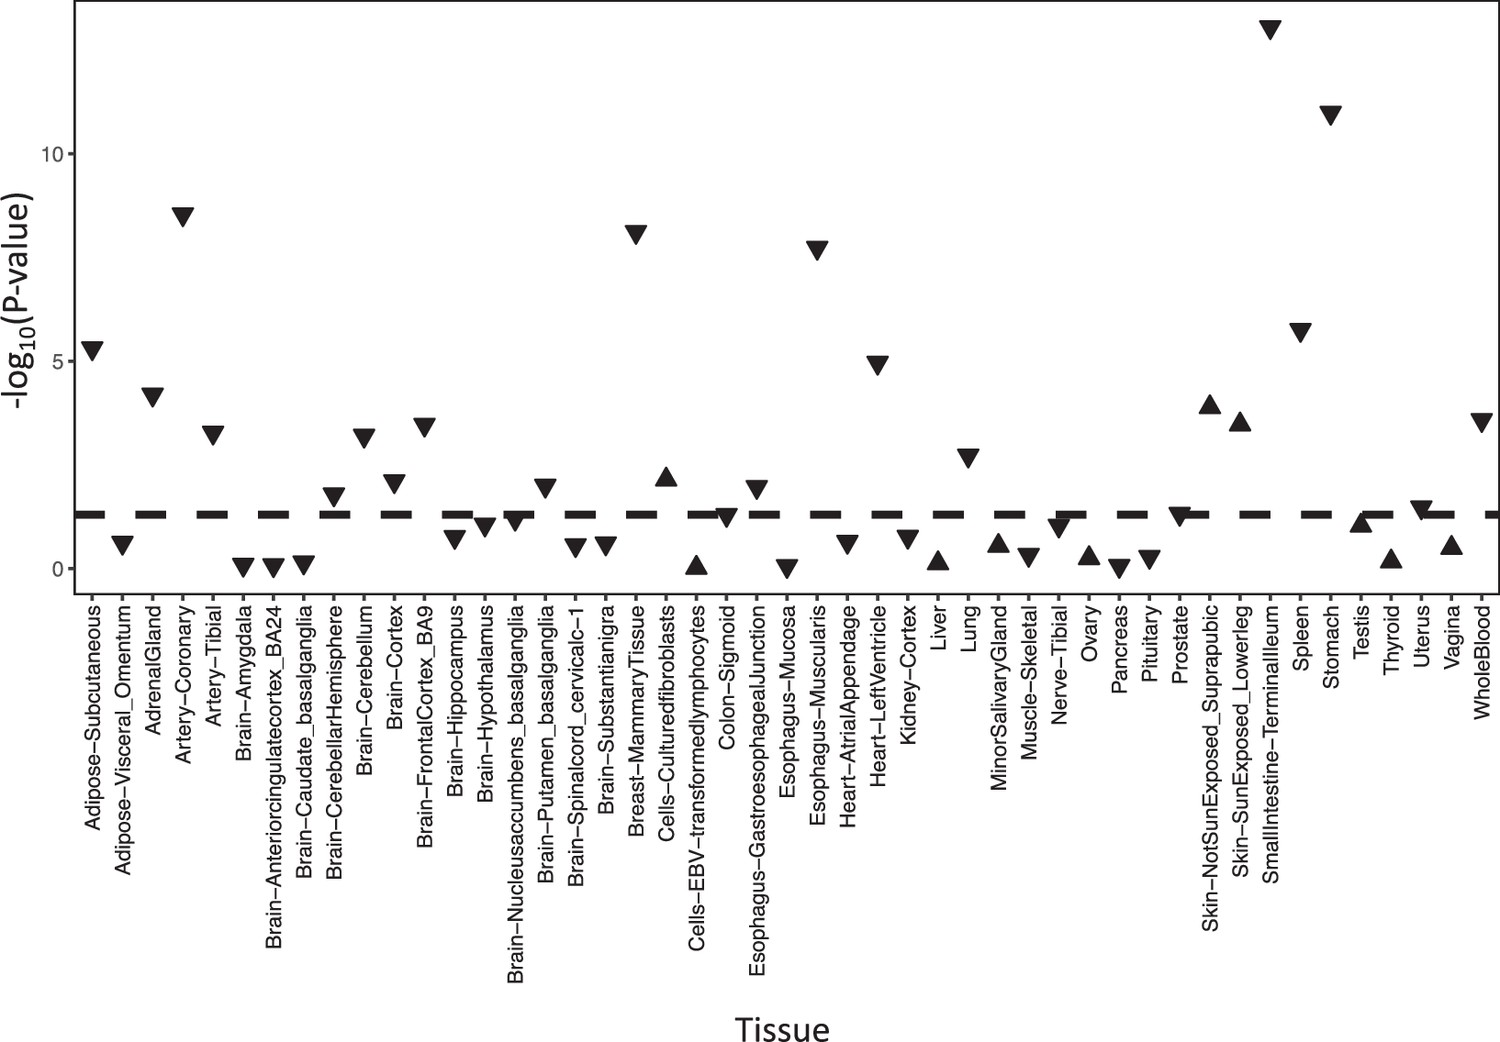
Significance of the correlation between ADCY9 and CETP expression across GTEx tissues.
P-values are presented on a -log10 scale and are obtained from a linear regression on normalized expression with correction for age, sex, top 5 PCs, ischemic time death, sequencing platform, and sequencing center. Regular triangles mean that both gene expression levels are positively correlated, inverted triangles mean that both gene expression levels are inversely correlated. The dashed line represents the p-value at 0.05.
Appendix 1—figure 7
Epistatic effects between rs1967309 and rs158477 on CETP expression in GEUVADIS (LCL, N = 287) and CARTaGENE (Whole blood samples, N = 728).
P-values are presented on a -log10 scale and are reported in function of the number of PEER/sPEER factors in GEUVADIS (LCL) (a,c) and CARTaGENE (b,d) in sex-combined (a,b) and sex-stratified (c,d) analyses. For all models, rs158477 is coded as additive (GG = 0, GA = 1, AA = 2). In the additive model (green triangle), rs1967309 is coded as additive (AA = 0, AG = 1, GG = 2), p-values are obtained using a linear regression in R. In the genotypic model (orange circle), rs1967309 is coded as a genotypic variable and p-values are obtained from a likelihood ratio test comparing models with and without the interaction term between the SNPs. The orange, red, and pink lines represent p-values of 0.1, 0.05, and 0.01 respectively. The sample sizes reported are the number of individuals left after removing participants with missing genotypes for rs1967309 and/or rs158477. In (c,d) the color of the lines represents the sex label.
Appendix 1—figure 8
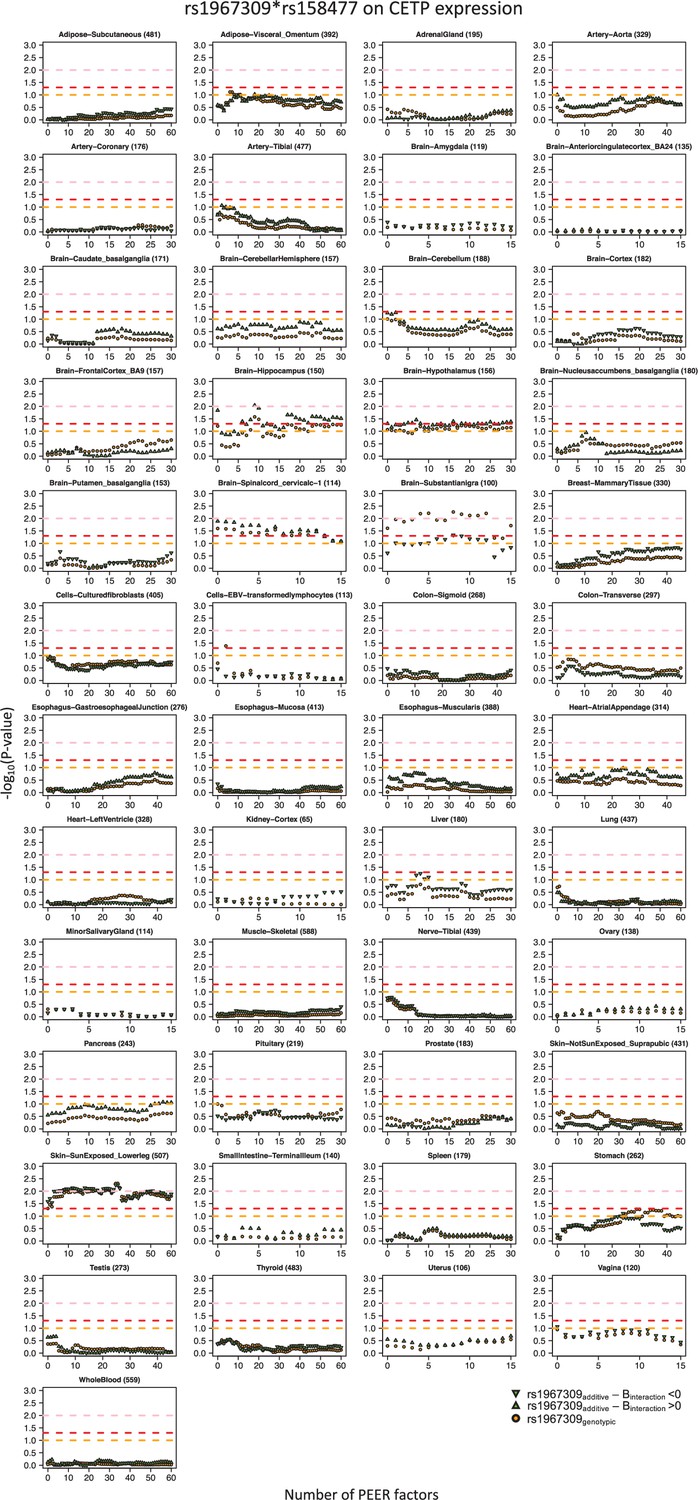
Sex-combined epistatic effect p-values for the interaction between rs1967309 and rs158477 on CETP expression depending on the number of PEER factors in GTEx by tissue.
P-values are presented on a -log10 scale. For all models, rs158477 is coded as additive (GG = 0, GA = 1, AA = 2). In the additive model (green triangle), rs1967309 is coded as additive (AA = 0, AG = 1, GG = 2), p-values are obtained using a linear regression in R. In the genotypic model (orange circle), rs1967309 is coded as a genotypic variable and p-values are obtained from a likelihood ratio test comparing models with and without the interaction term between the SNPs. The orange, red and pink lines represent p-values of 0.1, 0.05 and 0.01 respectively. The tissue type and the number of samples for each, used in the analysis, are reported in the titles of the subgraphs.
Appendix 1—figure 9
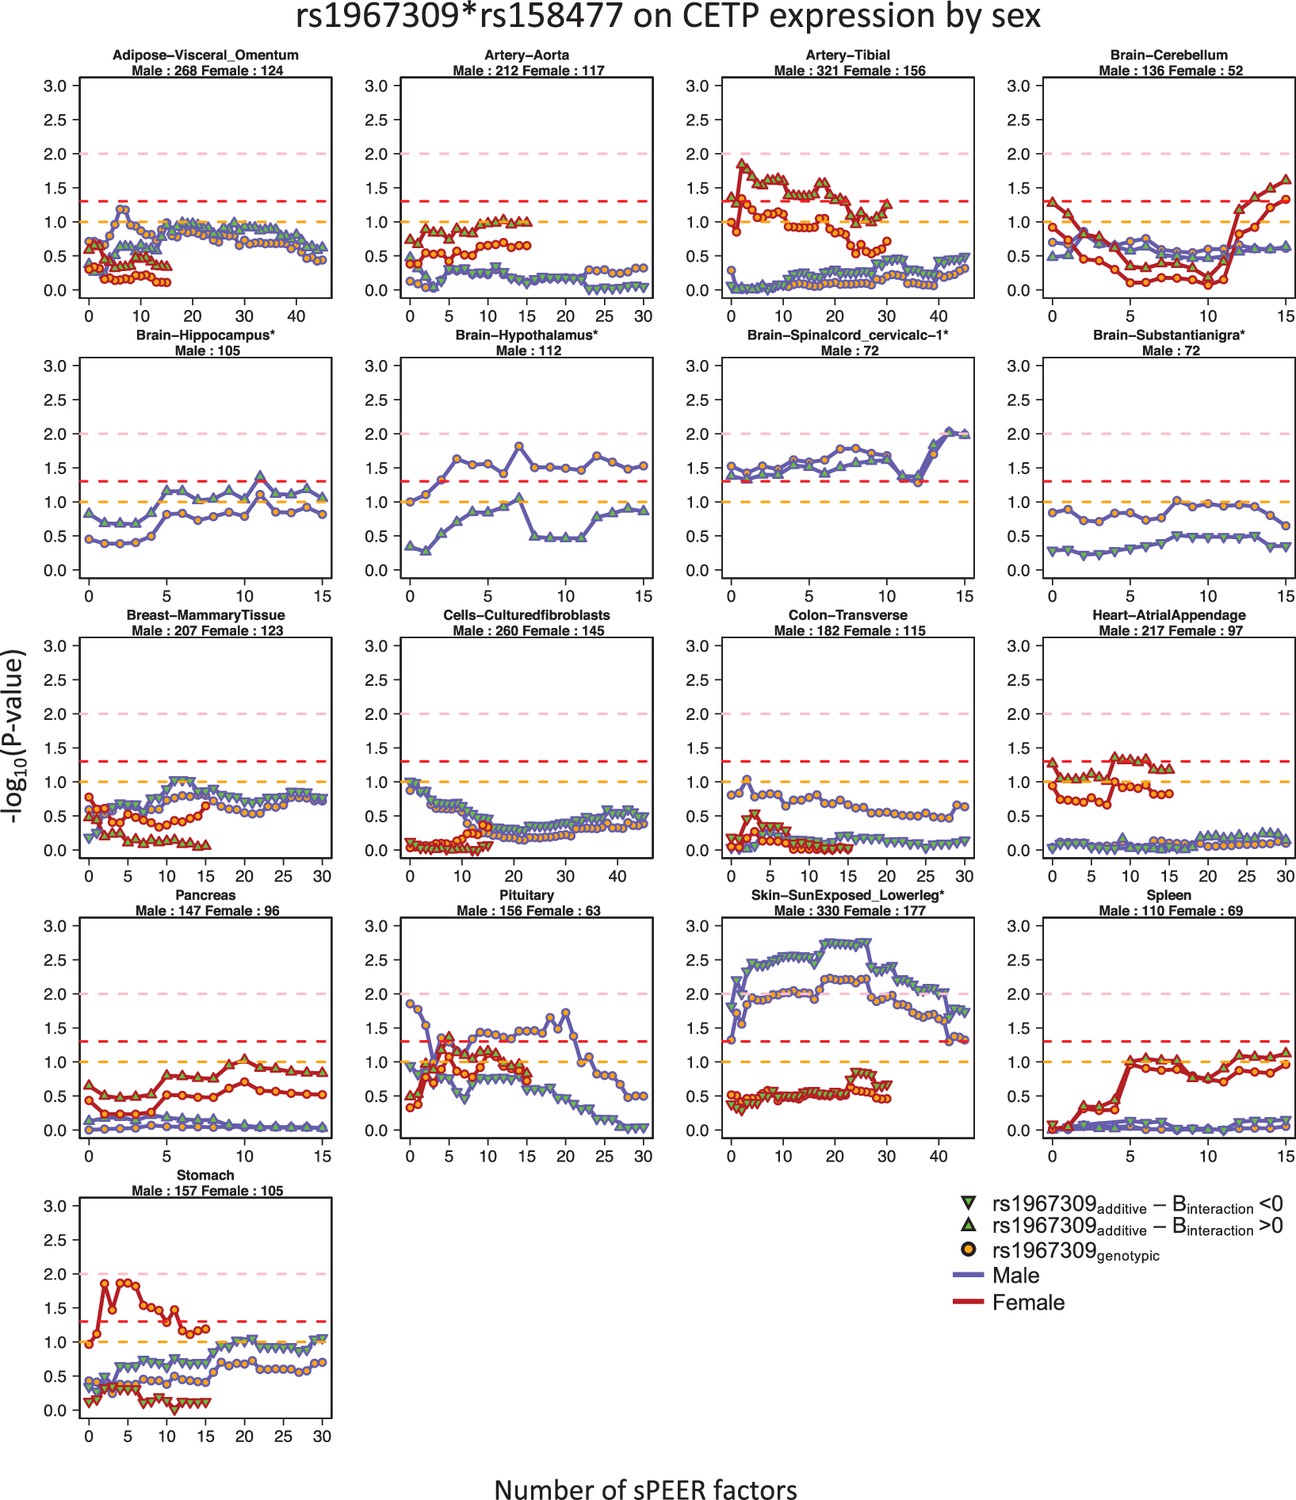
Sex-specific epistatic effects between rs1967309 and rs158477 on CETP expression depending on the number of sPEER factors in GTEx by tissue.
P-values are presented on a -log10 scale. For all models, rs158477 is coded as additive (GG = 0, GA = 1, AA = 2). In the additive model (green triangle), rs1967309 is coded as additive (AA = 0, AG = 1, GG = 2), p-values are obtained using a linear regression in R. In the genotypic model (orange circle), rs1967309 is coded as a genotypic variable and p-values are obtained from a likelihood ratio test comparing models with and without the interaction term between the SNPs. The orange, red and pink lines represent p-values of 0.1, 0.05 and 0.01 respectively. The tissue type and the number of samples for each, used in the analysis, are reported in the titles of the subgraphs. The color of lines represents the sex label. Only tissues with at least one value under 0.10 are showed. Tissues with an asterisk (*) next to their title are tissues showing a the suggestive/significant effect in the sex-combined analysis.
Appendix 1—figure 10

Population structure in datasets analysed.
We estimate population structure using UMAP on the top 10 PCs generated with flashPCA2 on (a) GTEx (N = 699) and (b) CARTaGENE (N = 12,056) biobanks. The self-reported white non-Latino individuals were selected for further analyses.
Author response image 1
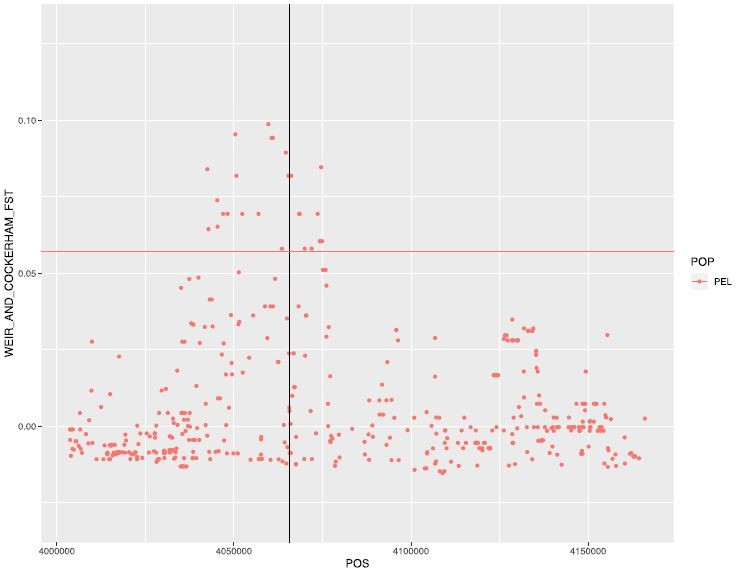
Weir and Cockerham FST between males and females in PEL.
Horizontal line represents the 99th percentile value for this population (for chromosome 16).
Author response image 2

LRLD of rs1967309 with CETP gene and rs158477 in ADCY9 gene in UKB for SNPs with a MAF>5%.
The horizontal line is the 99th percentile of all pairs of SNPs between ADCY9 and CETP genes.
Author response image 3
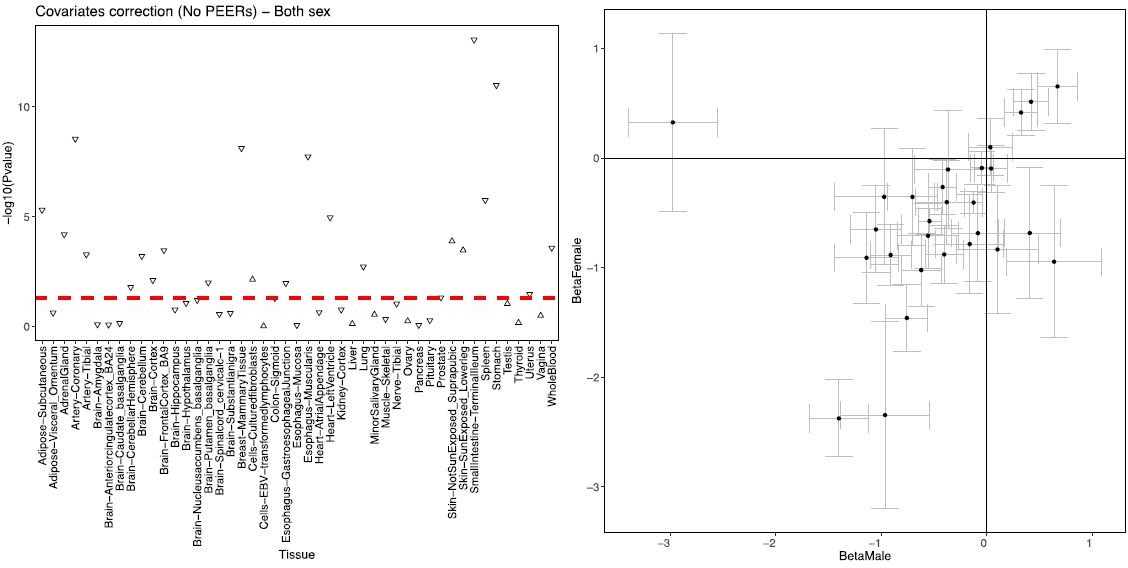
Correlation between ADCY9 and CETP genes across tissues of GTEx.
(left) sex-combined, the shape represents the direction of the correlation. (right) Comparison of β of the correlation between both genes between male and female. Bars represent the standard error obtained from the summary of the lm() in R.
Author response image 4
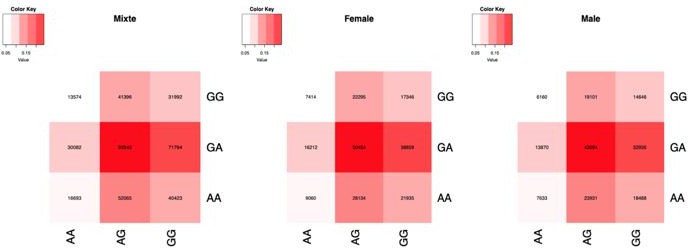
Number of samples by genotype combination, in sex-combined and stratified by sex.
Author response image 5
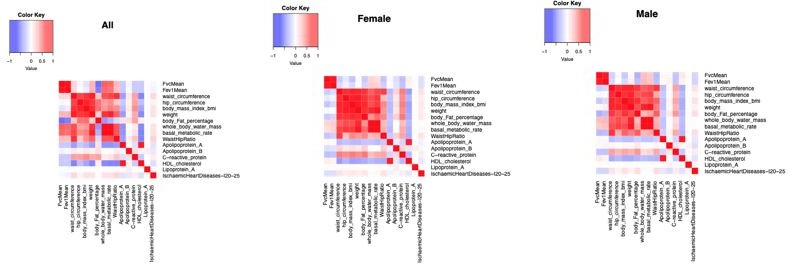
Correlation between phenotypes in the UKB in sex-combined and stratified by sex.
Tables
Key resources table
| Reagent type (species) or resource | Designation | Source or reference | Identifiers | Additional information |
|---|---|---|---|---|
| Gene (Homo sapiens) | CETP | GenBank | HGNC:1,869 | |
| Gene (Homo sapiens) | ADCY9 | GenBank | HGNC:240 | |
| Cell line (Homo sapiens) | HepG2 | ATCC | RRID:CVCL_0027 | Hepatoblastoma |
| Recombinant DNA reagent | pEZ-M46-AC9 plasmid | GeneCopoeia | EX-H0609-M46 | Methods section |
| Recombinant DNA reagent | pEZ-M50-CETP plasmid | GeneCopoeia | EX-C0070-M50 | Methods section |
| Antibody | Anti-CETP (rabbit monoclonal) | Abcam | #ab157183 | (1:1000) in 3 % BSA, TBS, tween 20 0.5%, O/N 4 °C |
| Antibody | Goat anti-rabbit antibody (goat polyclonal) | Abcam | RRID:AB_955447 | (1:10 000) in 3 % BSA 1 h at room temperature |
| Sequence-based reagent | Human CETP_F | IDT Technologies | PCR primers | CTACCTGT CTTTCCATAA |
| Sequence-based reagent | Human CETP_R | IDT Technologies | PCR primers | CATGATGT TAGAGATGAC |
| Sequence-based reagent | Human ADCY9_F | IDT Technologies | PCR primers | CTGAGGTT CAAGAACATCC |
| Sequence-based reagent | Human ADCY9_R | IDT Technologies | PCR primers | TGATTAATG GGCGGCTTA |
| Sequence-based reagent | Silencer Select siRNA against human ADCY9 | Ambion | Cat. #4390826 ID 1039 | CCUGAUGA AAGAUUACUU Utt |
| Sequence-based reagent | Silencer Select siRNA against human CETP | Ambion | Cat. #4392420 ID 2933 | GGACAGAUC UGCAAAGAGAtt |
| Sequence-based reagent | Negative Control siRNA | Ambion | Cat. #4390844 | |
| Commercial assay or kit | Lipofectamine RNAiMAX reagent | Invitrogen | Cat. #13,778 | |
| Commercial assay or kit | Lipofectamine 2000 reagent | Invitrogen | Cat. #11668–019 | |
| Commercial assay or kit | RNeasy Plus Mini Kit | Qiagen | Cat. #74,136 | |
| Commercial assay or kit | High-Capacity cDNA Reverse Transcription Kit | Applied Biosystems | Cat. #4368814 | |
| Commercial assay or kit | Agilent RNA 6000 Nano Kit for Bioanalyzer 2,100 System | Agilent Technologies | Cat. #5067–1511 | |
| Commercial assay or kit | SYBR-Green reaction mix | BioRad | Cat. #1725274 | |
| Commercial assay or kit | Amicon Ultra 0.5 ml 10 kDa cutoff units | Millipore Sigma | Cat. #UFC501096 | |
| Commercial assay or kit | Western Lightning ECL Pro | Perkin Elmer | Cat. #NEL122001EA | |
| Commercial assay or kit | TGX Stain-Free FastCast Acrylamide 10% | BioRad | Cat# 1610183 | |
| Software, algorithm | TrimGalore! | DOI:10.14806/ej.17.1.200 | RRID:SCR_011847 | |
| Software, algorithm | STAR (v.2.6.1a) | DOI:10.1093/bioinformatics/bts635 | RRID:SCR_019993 | |
| Software, algorithm | RSEM (v.1.3.1) | DOI:10.1186/1471-2105-12-323 | RRID:SCR_013027 | |
| Software, algorithm | R statistical software (v.3.6.0/v.3.6.1) | https://www.r-project.org/ | RRID:SCR_001905 | |
| Software, algorithm | FlashPCA2 | DOI:10.1093/bioinformatics/btx299 | RRID:SCR_021680 | |
| Software, algorithm | Vcftools (v.0.1.17) | DOI:10.1093/bioinformatics/btr330 | RRID:SCR_001235 | |
| Software, algorithm | RFMix (v.2.03) | DOI:10.1016 /j.ajhg.2013.06.020 | ||
| Software, algorithm | PEER | DOI:10.1038/nprot.2011.457 | RRID:SCR_009326 | |
| Software, algorithm | pyGenClean (v.1.8.3) | DOI:10.1093/bioinformatics/btt261 | ||
| Software, algorithm | SAS (v.9.4) | https://www.sas.com/en_us/software/stat.html | RRID:SCR_008567 | |
| Software, algorithm | EPO pipeline (version e59) | DOI:10.1093/database/bav096 | ||
| Software, algorithm | Bcftools (v.1.9) | DOI:10.1093/bioinformatics/btr509 | RRID:SCR_005227 | |
| Software, algorithm | Genotype Harmonizer (v.1.4.20) | DOI:10.1186/1756-0500-7-901 | ||
| Software, algorithm | Hapbin (v.1.3.0) | DOI:10.1093/molbev/msv172 | ||
| Software, algorithm | SHAPEIT2 (r.837) | DOI:10.1038/nmeth.1785 | ||
| Software, algorithm | PBWT | DOI:10.1093/bioinformatics/btu014 | ||
| Software, algorithm | Beacon designer software (v.8) (Premier Biosoft) | http://www.premierbiosoft.com/qOligo/Oligo.jsp?PID=1 | ||
| Other | 1000 Genomes project | DOI:10.1038/nature15393 | RRID:SCR_006828 | |
| Other | LIMAA | DOI:10.1038 /s41467-019-11664-1 | dbGAP:phs002025. v1.p1 | dbgap project #26,882 |
| Other | Native American genetic dataset | DOI:10.1038/nature11258 | ||
| Other | GEUVADIS | DOI:10.1038/nature12531 | RRID:SCR_000684 | |
| Other | GTEx (v8) | DOI:10.1038 /ng.2653 | RRID:SCR_013042 | dbgap project #19,088 |
| Other | CARTaGENE biobank | DOI:10.1093/ije/dys160 | RRID:SCR_010614 | CAG project number 406,713 |
| Other | UK biobank | DOI:10.1371/journal.pmed.1001779 | RRID:SCR_012815 | UKB project #15,357 and #20,168 |
| Other | Sanger Imputation Server | DOI:10.3389/fgene.2019.00034 |
Table 1
Cohort information.
Sample sizes are reported after quality control steps.
| Cohort/Subpopulation | Abbreviation | Ethnicity | Sample size(% female) | Age | Reference |
|---|---|---|---|---|---|
| 1000 G – Peruvian | PEL* | Peruvian | 85 (52%) | NA | Auton et al., 2015 |
| LIMAA/Peruvian | LIMAA | Peruvian | 3,243 (40%) | 29.6 ± 13.8 | Asgari et al., 2020; Luo et al., 2019 |
| Native Amerind/Andean | NAGD/AND | Amerind/Peruvian | 88 (40%) | NA | Reich et al., 2012 |
| GEUVADIS | GEUVADIS* | European descent | 287 (54%) | NA | Lappalainen et al., 2013 |
| CARTaGENE | CaG | European descent | 728 (51%) | 53.6 ± 8.7 | Awadalla et al., 2013 |
| GTEx | GTEx | European descent | 699 (34%) | 52.6 ± 13.1 | GTEx Consortium, 2013 |
| UK biobank | Ukb* | European descent | 413,138 (54%) | 56.8 ± 8.0 | Sudlow et al., 2015 |
-
*
indicates a discovery cohort.
-
NA: not available.
Appendix 1—table 1
Long-range linkage disequilibrium analysis in three datasets, and in subsets of the cohorts.
Number of individuals (N) in each subset is reported. P-values correspond to the ADCY9/CETP empirical p-values computed as described in Section Long-range linkage disequilibrium in Methods. r2 were obtained from the geno-r2 option of vcftools software. For 1000G populations, abbreviations can be found here https://www.internationalgenome.org/category/population/.
| Cohort | Population | Sex | Number | r2 | p-value ADCY9-CETP |
|---|---|---|---|---|---|
| 1000G | YRI | All | 108 | 0.0236 | 0.11 |
| CEU | All | 99 | 0.0003 | 0.86 | |
| GBR | All | 91 | 0.0117 | 0.28 | |
| CHB | All | 103 | 0.004 | 0.53 | |
| MXL | All | 64 | 0.0007 | 0.83 | |
| PEL* | All | 85 | 0.0796 | 5.42 × 10⁻³ | |
| Male | 41 | 0.3483 | 8.23 × 10⁻⁵ | ||
| Female | 44 | 0.0016 | 0.78 | ||
| LIMAA | LIMAA | All | 3,243 | 0.0046 | 3.24 × 10⁻³ |
| Male | 1941 | 0.0097 | 3.71 × 10⁻³ | ||
| Female | 1,302 | 0.0003 | 0.52 | ||
| NAGD | Northern Amerind(NOA) | All | 81 | 0.0084 | 0.44 |
| Male | 27 | 0.0634 | 0.16 | ||
| Female | 54 | 0.0699 | 0.07 | ||
| Central Amerind(CEA) | All | 81 | 0.0281 | 0.12 | |
| Male | 34 | 0.0316 | 0.28 | ||
| Female | 47 | 0.0257 | 0.24 | ||
| Andean(AND) | All | 88 | 0.0293 | 0.04 | |
| Male | 54 | 0.0436 | 0.09 | ||
| Female | 34 | 0.0125 | 0.55 |
-
*
Discovery cohort.
Appendix 1—table 2
Details on metabolic and clinical variables extracted from the UK Biobank.
| Variable ID | UK biobank variable location | Number of samples used for interaction |
|---|---|---|
| Category 100011 - Blood pressure - Physical measures - UK Biobank Assessment Centre | ||
| Pulse rate at baseline(Pulse rate)Units: bpm | Data-Field 102 (automatic entry) or Data-Field 95 (manual entry), to be derived as follows:
| All = 395,319Male = 182,279Female = 213,040 |
| Diastolic blood pressure at baseline(Diastolic BP)Units: mmHg | Data-Field 4,079 (automatic entry) or Data-Field 94 (manual entry), as follow:
| All = 395,384Male = 182,326Female = 213,058 |
| Systolic blood pressure at baseline(Systolic BP)Units: mmHg | Data-Field 4,080 (automatic entry) or Data-Field 93 (manual entry), as follow:
| All = 395,353Male = 182,316Female = 213,037 |
| Category 100010 - Body size measures - Anthropometry - Physical measures - UK Biobank Assessment Centre | ||
| Waist circumference at baseline (Waist circumference)Units: cm | Data field 48, use mean of available measures for instance 0 (baseline) only. | All = 395,006Male = 182,089Female = 212,917 |
| Hip circumference at baseline (Hip circumference)Units: cm | Data field 49, use mean of available measures for instance 0 (baseline) only. | All = 394,651Male = 181,988Female = 212,663 |
| Waist-hip ratio | Compute waist/hip | All = 394,944Male = 182,056Female = 212,888 |
| WeightUnits: Kg | Data-Field 21,002 (automatic entry) or Data-Field 3,160 (manual entry), as follow:(3) Weight: Data-Field 21002,, use mean of available measures for instance 0 (baseline) only.Only if unavailable, then use:(4) Weight, manual reading: Data-Field 3160,, use mean of available measures for instance 0 (baseline) only. | All = 394,377Male = 181,732Female = 212,645 |
| HeightUnits: cm | Data-Field 50 or 12,144.(5) Standing height: Data Field 50, used mean of available measures for instance 0 (baseline) only.Only if unavailable, then use:(6) Height: Data-Field 12144,, used mean of available measures, as this is a singular instance field | All = 394,871Male = 181,969Female = 212,902 |
| UK Biobank BMI(BMI)Units: Kg/m2 | Data field 21001,, used mean of available measures for instance 0 (baseline) only. | All = 394,173Male = 181,705Female = 212,468 |
| Category 100009 - Impedance measures - Anthropometry - Physical measures - UK Biobank Assessment Centre | ||
| Trunk fat percentage(% Trunk fat)Units: % | Data field 23127,, use mean of available measures for instance 0 (baseline) only. | All = 388,569Male = 178,837Female = 209,732 |
| Body fat percentage(% Body fat)Units: % | Data field 23099,, use mean of available measures for instance 0 (baseline) only. | All = 388,600Male = 178,752Female = 209,848 |
| Basal metabolic rateUnits: KJ | Data field 23105,, use mean of available measures for instance 0 (baseline) only. | All = 388,585Male = 178,758Female = 209,827 |
| Whole body water massUnites: Kg | Data field 23102,, use mean of available measures for instance 0 (baseline) only. | All = 388,719Male = 178,881Female = 209.838 |
| Category 100020 - Spirometry - Physical measures - UK Biobank Assessment Centre | ||
| Forced vital capacity(FVC)Units: L | Data field 20151,, use mean if more than one measure. | All = 297,461Male = 138,909Female = 158,552 |
| Forced expiratory volume in 1 second(FEV1)Units: L | Data field 20150,, use mean if more than one measure. | All = 297,499Male = 138,937Female = 158,562 |
| Category 100057 - Sleep - Lifestyle and environment - Touchscreen - UK Biobank Assessment Centre | ||
| Sleep durationUnits: hours/day | Data field 1160,, use mean of available measures for instance 0 (baseline) only. | All = 393,133Male = 181,452Female = 211,681 |
| Category 100072 - Early life factors - Verbal interview - UK Biobank Assessment Centre | ||
| Birth weightUnits: Kg | Data field 20022,, use mean if more than one measure. | All = 227,244Male = 89,715Female = 137,529 |
| Category 717 - Biomarkers | ||
| Apolipoprotein A1(ApoA)Units: g/L | Data field 30630, use mean of available measures for instance 0 (baseline) only.Standardized using the mean: (x-mean)/sd | All = 413,138Male = 190,454Female = 222,684 |
| High Density Lipoprotein(HDL-c)Units: mmol/L | Data field 30760, use mean of available measures for instance 0 (baseline) only.Standardized using the mean: (x-mean)/sd | |
| Lipoprotein (a)(Lp(a))Units: nmol/L | Data field 30780, use mean of available measures for instance 0 (baseline) only.Standardized using the mean: (x-mean)/sd | |
| C-Reactive Protein(CRP)Units: mmol/L | Data field 30710, use mean of available measures for instance 0 (baseline) only.Ln transformation, then standardized using the mean: (x-mean)/sd | |
| Low Density Lipoprotein(LDL-c)Units: mmol/L | Data field 30790, use mean of available measures for instance 0 (baseline) only.Standardized using the mean: (x-mean)/sd | |
| Apolipoprotein B(ApoB)Units: g/L | Data field 30640, use mean of available measures for instance 0 (baseline) only.Standardized using the mean: (x-mean)/sd | |
| Category of operation procedure codes (OPCS) and hospitalization or death record codes(ICD9/ICD10) | ||
| Coronary artery disease(CAD) | Prevalent or incident | (cases/controls)All = 413,138 (44,713/368,425)Male = 190,454 (29,910/160,544)Female = 222,684 (14,803/207,881) |
| Myocardial Infarction(MI) | Prevalent or incident | (cases/controls)All = 413,138 (18,559/394,579)Male = 190,454 (13,812/176,642)Female = 222,684 (4,747/217,937) |
Appendix 1—table 3
Primers sequence for real-time PCR quantification in HepG2 cells for the KD-ADCY9 and KD-CETP experimentations.
| Species | Gene | Strain | Sequence |
|---|---|---|---|
| Human | ADCY9 | Forward | 5’ CTGAGGTTCAAGAACATCC 3’ |
| Reverse | 5’ TGATTAATGGGCGGCTTA 3’ | ||
| CETP | Forward | 5’ CTACCTGTCTTTCCATAA 3’ | |
| Reverse | 5’ CATGATGTTAGAGATGAC 3’ | ||
| HBS1L | Forward | 5’ ACAAGAATGAGGCAACAG 3’ | |
| Reverse | 5’ AGATACTCCAGGCACTTC 3’ | ||
| PGK1 | Forward | 5’ GTGGAGGAAGAAGGGAAG 3’ | |
| Reverse | 5’ AAGCATCATTGACATAGACAT 3’ |
Author response table 1
| Organ | Sex | Number of samples |
|---|---|---|
| Brain-Amygdala | Female | 34 |
| Brain-Anterior Cingulate Cortex (BA24) | Female | 39 |
| Brain-Caudate basal ganglia | Female | 45 |
| Brain-Cerebellar Hemisphere | Female | 46 |
| Brain-Frontal Cortex (BA9) | Female | 44 |
| Brain-Hippocampus | Female | 45 |
| Brain-Hypothalamus | Female | 44 |
| Brain-Nucleus accumbens basal ganglia | Female | 49 |
| Brain-Putamen (basal ganglia) | Female | 38 |
| Brain-Spinal cord cervical c-1 | Female | 42 |
| Brain-Substantia nigra | Female | 28 |
| Cells-EBV-transformed lymphocytes | Female | 43 |
| Kidney-Cortex | Male/Female | 48/17 |
| Minor Salivary Gland | Female | 32 |
Author response table 2
| Database | SNP - Variant | TOPMED imputation | Sanger Imputation Server - Haplotype Reference Consortium (in manuscript) |
|---|---|---|---|
| LIMAA | rs1967309 A | 77% | 76% |
| rs158477 G | 79% | 79% | |
| NAGD-Andean | rs1967309 A | 77% | 77% |
| rs158477 G | 74% | 73% |
Author response table 3
| All | Male | Female | |
|---|---|---|---|
| rs1967309-A | 0.392818 | 0.392935 | 0.392719 |
| rs158477-G | 0.471628 | 0.471797 | 0.471484 |
Additional files
Download links
A two-part list of links to download the article, or parts of the article, in various formats.
Downloads (link to download the article as PDF)
Open citations (links to open the citations from this article in various online reference manager services)
Cite this article (links to download the citations from this article in formats compatible with various reference manager tools)
A sex-specific evolutionary interaction between ADCY9 and CETP
eLife 10:e69198.
https://doi.org/10.7554/eLife.69198


