Haploinsufficiency of the essential gene Rps12 causes defects in erythropoiesis and hematopoietic stem cell maintenance
- Department of Genetics, Albert Einstein College of Medicine, United States
- Department of Medical Oncology, Albert Einstein College of Medicine, United States
- Department of Cell Biology, Albert Einstein College of Medicine, United States
Figures
Figure 1 with 1 supplement
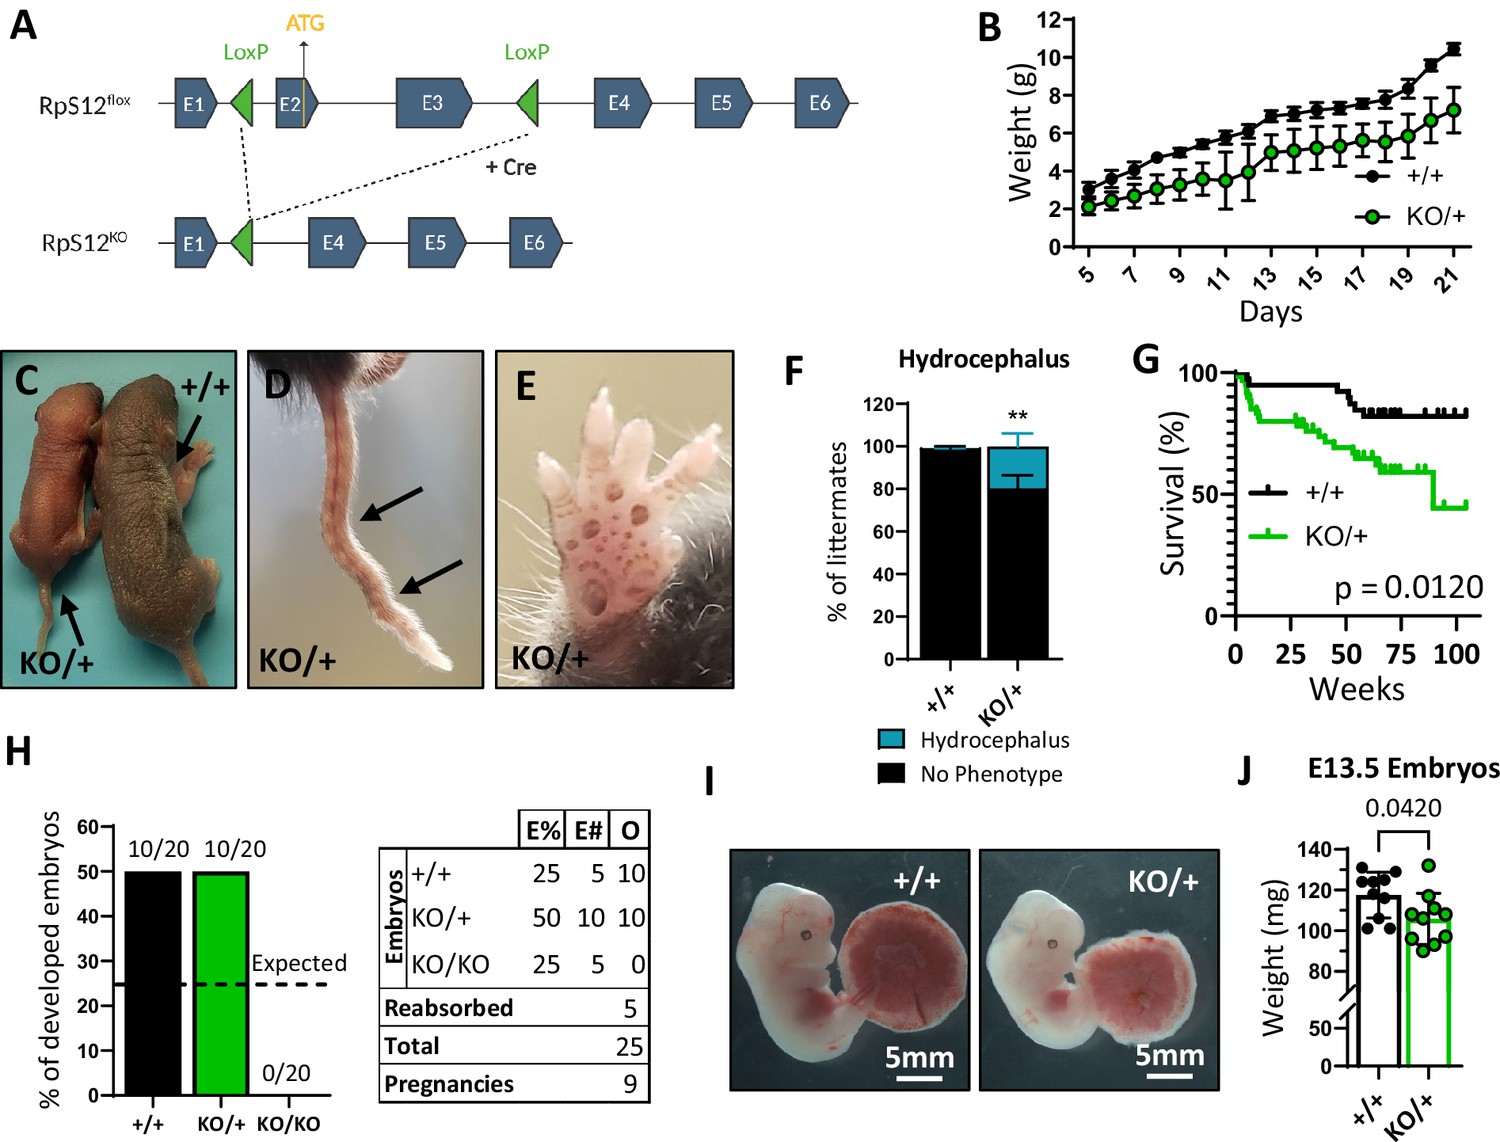
Loss of one copy of Rps12 results in delayed growth, morphologic defects, and reduced viability.
(A) Conditional Rps12flox transgenic knock-in has two loxP sites flanking exons 2 and 3, that are removed by Cre-ERT recombinase activity to generate Rps12KO. (B) Post-natal growth curve of Rps12KO/+ and Rps12+/+ littermates (+/+ n=8 and KO/+ n=11 pups). (C) Picture of 5-day-old Rps12KO/+ and Rps12+/+ littermates. (D) Representative picture of ’kinked’ tail in Rps12KO/+ mouse. (E) Representative picture of the anterior footpad hyperpigmentation in Rps12KO/+. (F) Quantification of the percentage of mice presenting hydrocephalus per litter (n=27 litters, two-way ANOVA p=0.0035). (G) Kaplan-Meier survival curves of Rps12KO/+ and Rps12+/+ littermates starting at day 5 of age (+/+ n=39 and KO/+ n=60, log-rank Mantel-Cox test p=0.012). (H) Embryo genotype segregation from crosses between Rps12KO/+ male and female. Graph represents the percentage of developed embryos and the table shows the total numbers (E%=expected percentages, E#=expected numbers, O=observed numbers). (I) Representative pictures of E13.5 embryos with their placentas. (J) E13.5 embryo weights (n=10 on each genotype, unpaired t-test p=0.0420). Statistical analysis: quantifications represent mean +/− SEM, shown as the error bars.
-
Figure 1—source data 1
Growth and embryo development.
- https://cdn.elifesciences.org/articles/69322/elife-69322-fig1-data1-v2.xlsx
Figure 1—figure supplement 1
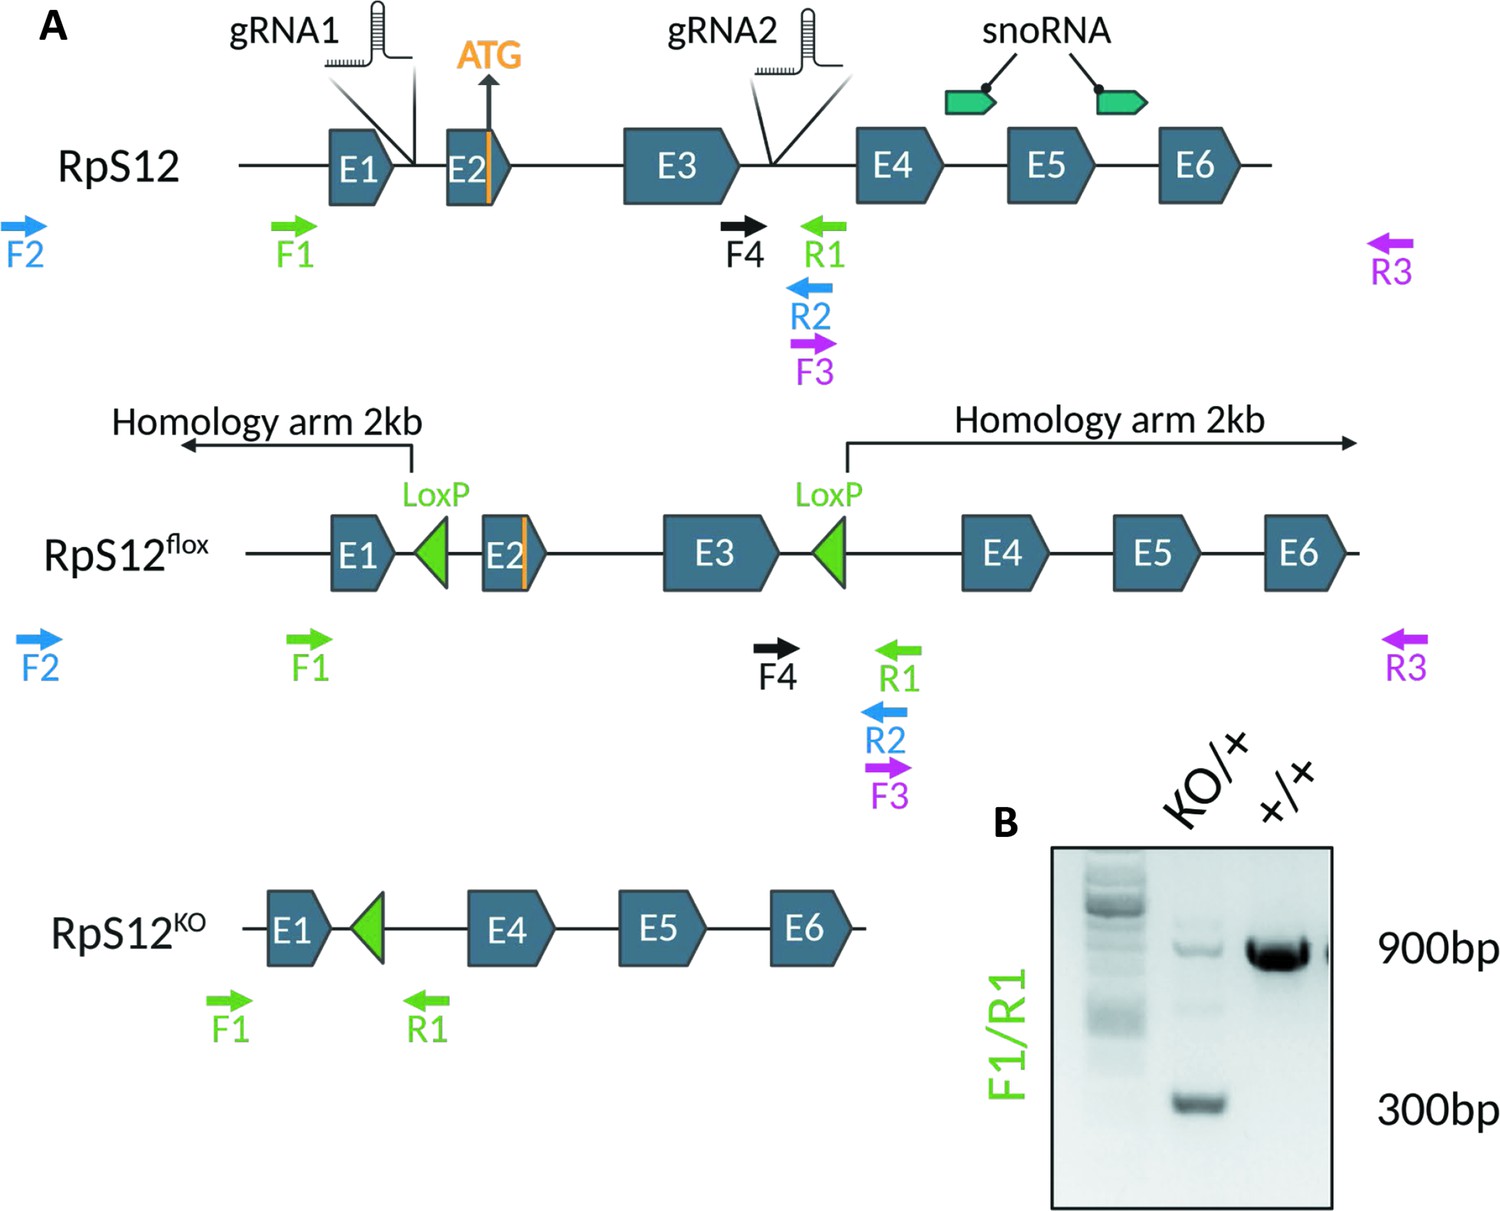
CRISPR gene editing and genotyping strategy for the generation of Rps12flox and Rps12KO.
(A) Diagram of the WT, Flox, and KO alleles of Rps12 generated in this study indicating the position of Snord100 and Snora33 (snoRNA),Cas9 gRNAs target locations, and primers used for genotyping. The homology arms starting sites are indicated and the ends fall outside of the Rps12 locus. To identify the first transformants, two pair of primers were used for PCR amplification: F2/R2 and F3/R3. F2 and R3 fall outside of the sequence covered by the homology arms, to ensure the inserts are on the correct location. The presence of LoxP sites was confirmed by Sanger sequencing using primers F1 and F4 for F2/R2 fragments, and with F3 and R3 for F3/R3 fragments. To determine excision of exons 2 and 3 by Cre-ERT recombination primers F1 and R1 were used, which generate a 900 bp fragment in Rps12+ and a 300 bp fragment in RpS12KO (B).
-
Figure 1—figure supplement 1—source data 1
Blot for Figure 1—figure supplement 1B.
The complete blot from which Figure 1—figure supplement 1B was derived is shown on the left. The 900 bp and 300 bp bands are marked on the right, as is the portion cropped for Figure 1—figure supplement 1B.
- https://cdn.elifesciences.org/articles/69322/elife-69322-fig1-figsupp1-data1-v2.zip
Figure 2
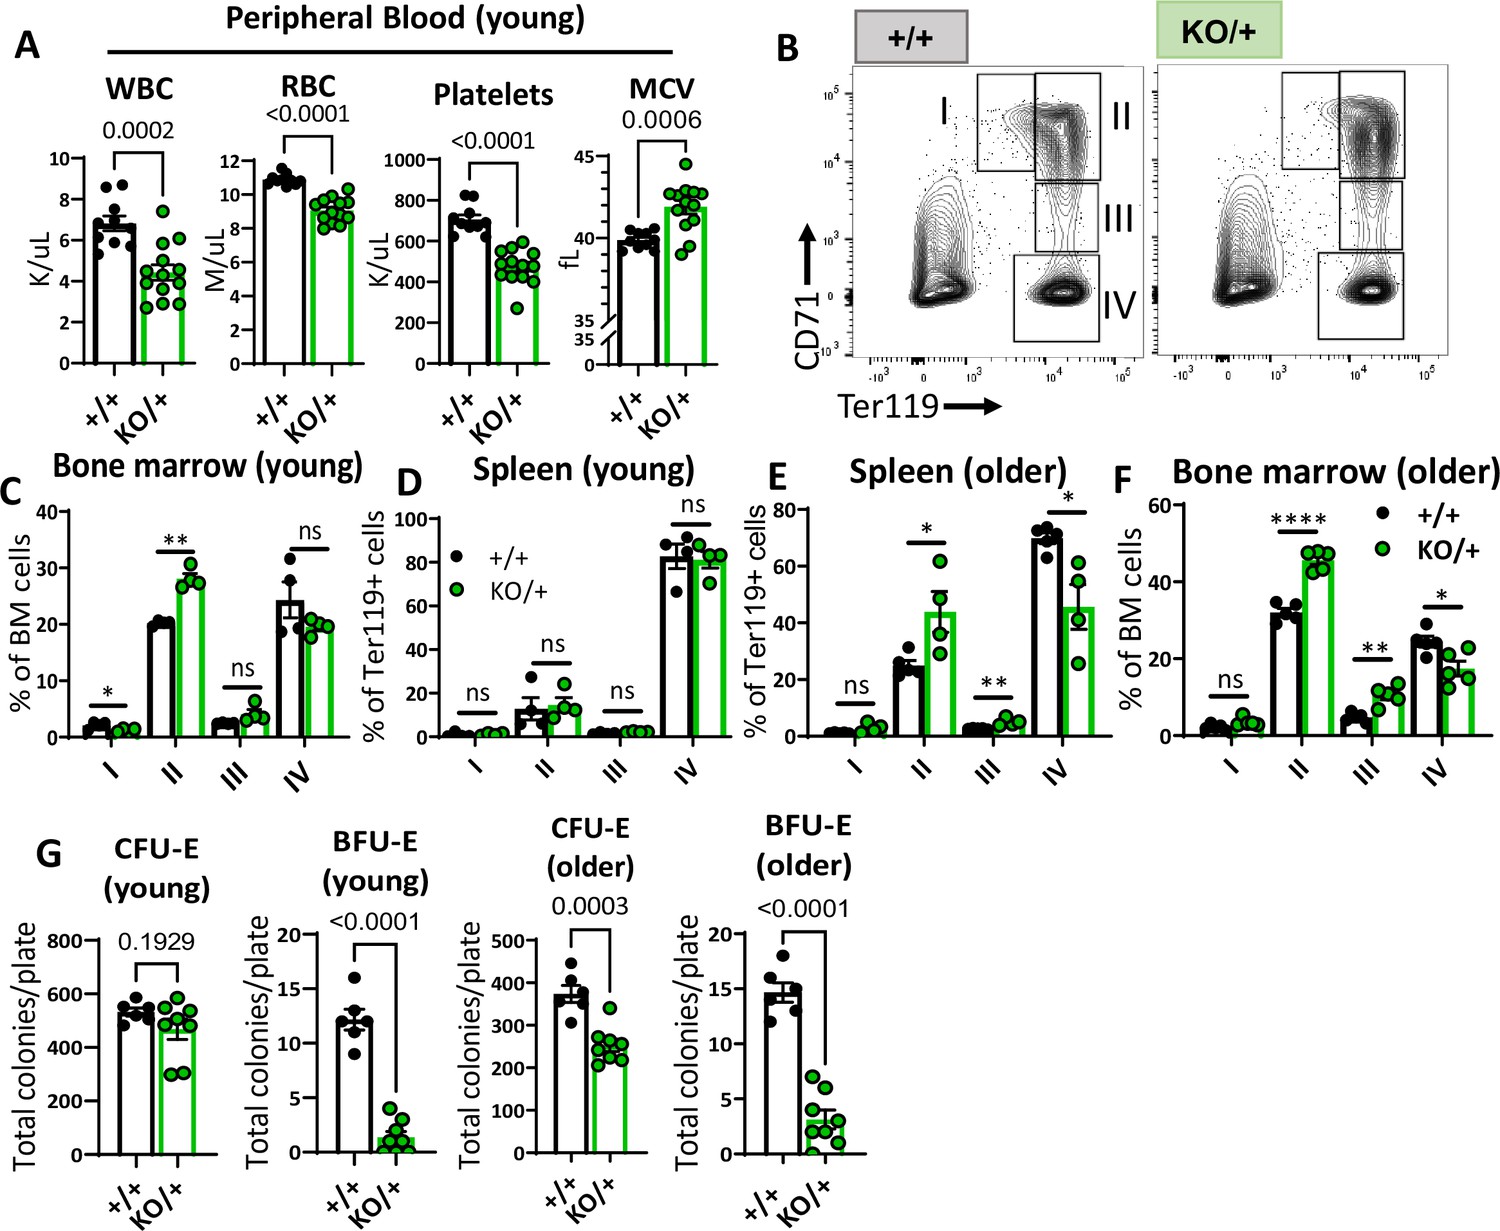
Haploinsufficiency of Rps12 results in erythropoiesis defects that worsen with age.
(A) Quantification of peripheral blood counts from young (6–8 weeks) littermates (+/+ n=10 and KO/+ n=13) (WBC=white blood cells, RBC=red blood cell, MCV=mean corpuscular volume). (B) Representative flow cytometry gating of bone marrow cells from 6- to 8-weeks-old mice of erythropoietic populations using Ter119 and CD71 markers. (C, D, E, F) Frequencies of erythroid progenitors in the bone marrow and spleen of young (6- to 7-weeks-old, +/+ n=4 and KO/+ n=4) and older (6- to 7-months-old, +/+ n=5 and KO/+ n=5) mice. (G) Total number of CFU-E and BFU-E colonies per plate (5 x 10⁵ bone marrow (BM) cells plated) in methylcellulose media supplemented with EPO (M3434) from young mice (6- to 7-weeks-old, +/+ n=4 and KO/+ n=4, each biological sample had two replicates) and older mice (6- to 7-months-old, +/+ n=4, and KO/+ n=4, each biological sample had two replicates). Statistical analysis: quantifications represent mean +/− SEM, shown as the error bars, when only two groups were being compared, unpaired t-test was performed, and for multiple comparisons one-way ANOVA analysis was used. *p<0.05, **p<0.01, ***p<0.001, ****p<0.0001.
-
Figure 2—source data 1
Erythropoiesis in younger and older mice.
- https://cdn.elifesciences.org/articles/69322/elife-69322-fig2-data1-v2.xlsx
Figure 3 with 2 supplements
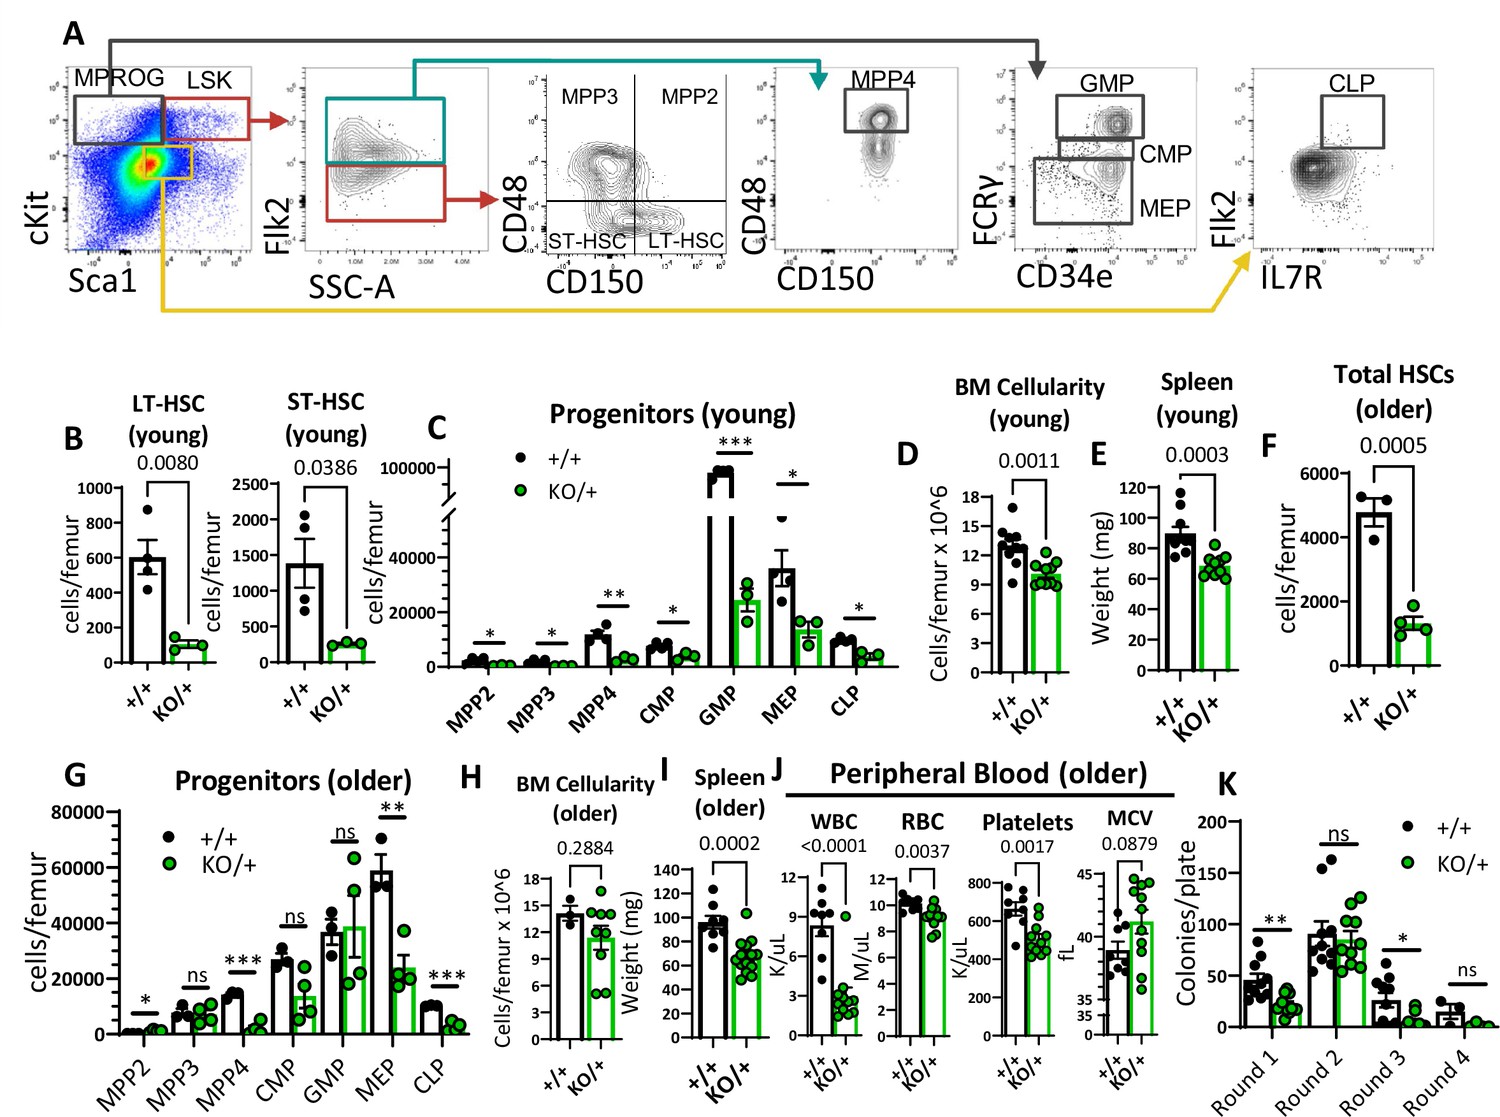
Reduced hematopoietic stem cells (HSCs) and other hematopoietic progenitor numbers in Rps12KO/+ mice.
(A) Representative gating strategy used to identify bone marrow populations of LSKs: long-term HSC (LT- HSC), short-term HSC (ST-HSC), multi-potent progenitors (MPP2, MPP3, MPP4), and myeloid progenitors (MPROG): common myeloid progenitor (CMP), granulocyte-monocyte progenitor (GMP), megakaryocyte-erythrocyte (MEP), and common lymphoid progenitor (CLP). (B) Total LT-HSCs and ST-HSCs per femur of young mice (6- to 8-weeks-old littermates, +/+ n=4, and KO/+ n=3). (C) Total number of cells per femur of indicated hematopoietic progenitor populations in young mice (6- to 8-weeks-old littermates, +/+ n=4, and KO/+ n=3). (D) Bone marrow cellularity is represented as cells per femur ×106 from young mice (6- to 7-weeks-old littermates, +/+ n=10, and KO/+ n=10). (E) Spleen weights of young (6- to 7-weeks-old, +/+ n=10, and KO/+ n=10) mice. (F) Total HSCs per femur of older mice (6- to 7-month-old, +/+ n=3, and KO/+ n=4). (G) Total number of cells per femur of indicated hematopoietic progenitor populations in older mice (6- to 7-month-old, +/+ n=3, and KO+ n=4). (H) Bone marrow cellularity is represented as cells per femur ×106 from older mice (older: 6- to 7-months-old, +/+ n=3, and KO/+ n=9). (I) Spleen weights of older (6- to 7-months-old, +/+ n=8, and KO/+ n=14) mice. (J) Quantification of peripheral blood counts from older mice (6- to 7 months old, +/+ n=8, and KO/+ n=11). (K) Total number of colonies per plate (1 × 10⁴ bone marrow (BM) cells from 6- to 7-month-old mice plated in round 1 and 1 × 10⁴ cells plated from the previous plate on each re-plating round) on each round of re-plating in complete methylcellulose media (+/+ n=5 and KO/+ n=5, 2 replicates per biological sample). Statistical analysis: quantifications represent mean +/− SEM, shown as the error bars, unpaired t-tests were performed to establish significance among populations between genotypes *p<0.05, **p<0.01, ***p<0.001, ****p<0.0001.
-
Figure 3—source data 1
HSCs and progenitor population distributions.
- https://cdn.elifesciences.org/articles/69322/elife-69322-fig3-data1-v2.xlsx
Figure 3—figure supplement 1
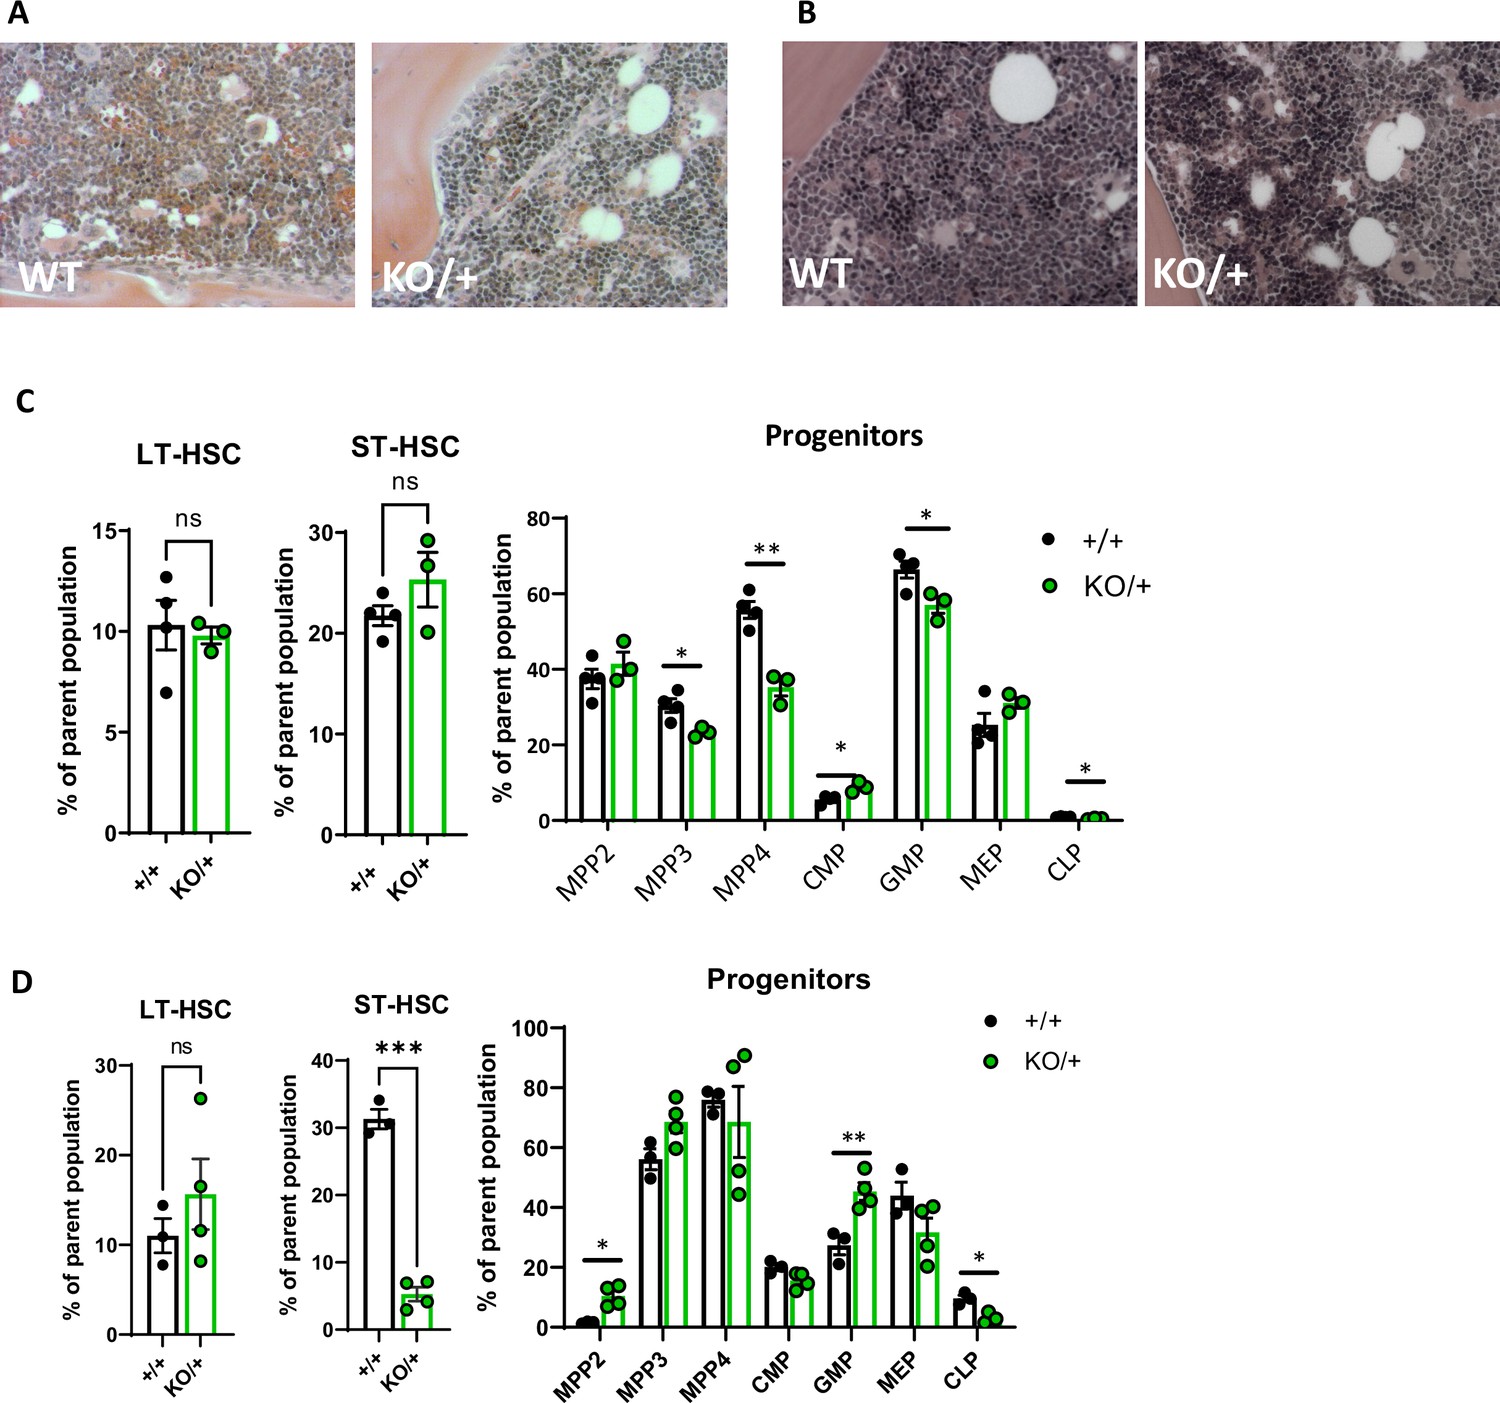
Heterozygous loss of Rps12 in the hematopoietic cells.
(A, B) Photomicrographs of H&E-stained sections of the bone marrow from a wild-type (WT) and Rps12KO/+ at (A) 8 weeks and (B) 6-month-old animals. Images are taken at 20 x magnification. (C, D) Frequency of the LT-HSCs, ST-HSCs, and progenitor populations (C) in young mice (6–8 weeks old littermates, +/+ n=4, and KO/+ n=3) and in (D) older mice (6- to 7-month-old, +/+ n=3, and KO/+ n=4). Statistical analysis: quantifications represent mean +/− SEM, shown as the error bars. Significance was determined using the Welch’s t-test ns ≥0.05, *p<0.05, **p<0.01, ***p<0.001, ****p<0.0001.
-
Figure 3—figure supplement 1—source data 1
Frequency of hematopoietic progenitors.
- https://cdn.elifesciences.org/articles/69322/elife-69322-fig3-figsupp1-data1-v2.xlsx
Figure 3—figure supplement 2
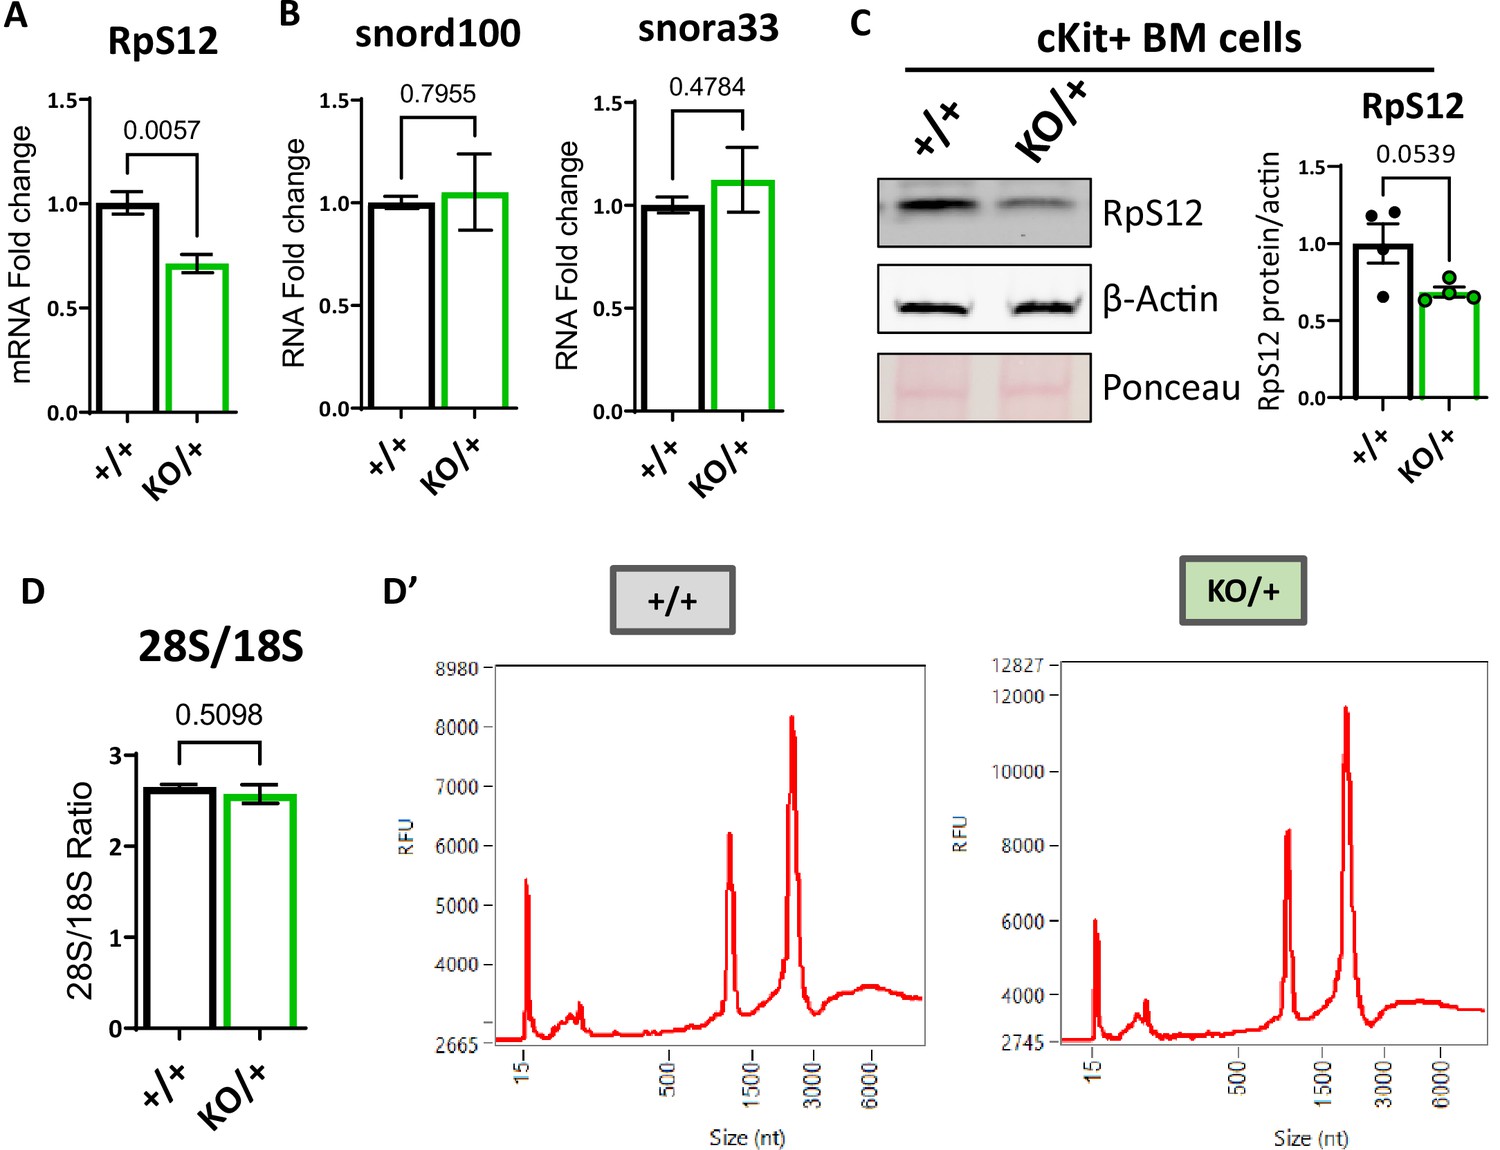
Decreased Rps12 and unaffected snoRNA expression levels in Rps12KO/+ mice.
(A) Comparison of total Rps12 mRNA levels measured by qPCR in cKit +bone marrow cells normalized to housekeeping genes GAPDH, RER1, and HPRT1, between Rps12+/+ and Rps12KO/+ mice. (B) Comparison of total Snord100 and Snora33 small RNAs levels measured by qPCR normalized to housekeeping small RNAs U6, Sno22, and Sno234. (C) Quantification by western blot of the relative levels of Rps12 protein in cKit + bone marrow cells normalized to housekeeping gene ACTB between Rps12+/+ and Rps12KO/+ mice. (D) Comparison on the 28 S and 18 S ribosomal subunits ratio between Rps12+/+ and Rps12KO/+ mice provided by RNA analysis in Agilent 2100 Bioanalyzer (D’) Representative RNA profiles from Rps12+/+ and Rps12KO/+ mice ckit + bone marrow samples. (A, B, C, D) Biological samples are +/+ n=4 and KO/+ n=4. Statistical analysis: quantifications represent mean +/− SEM,shown as the error bars, unpaired t-tests were performed to establish significance among populations between genotypes *p<0.05, **p<0.01, ***p<0.001, ****p<0.0001.
-
Figure 3—figure supplement 2—source data 1
Blots of cKit + bone marrow cells.
(A) Complete blot corresponding to Figure 3—figure supplement 2C labeled with Ponceau S. The labeled blot is shown below including the region cropped for Figure 3—figure supplement 2C. (B) Complete blot corresponding to Figure 3—figure supplement 2C after western blotting with actin- and Rps12-specific antibodies (blot was cut in two). (C) Blots from panel B with labels, including regions cropped for Figure 3—figure supplement 2C.
- https://cdn.elifesciences.org/articles/69322/elife-69322-fig3-figsupp2-data1-v2.zip
-
Figure 3—figure supplement 2—source data 2
RNA levels in ckit BM cells.
- https://cdn.elifesciences.org/articles/69322/elife-69322-fig3-figsupp2-data2-v2.xlsx
Figure 4
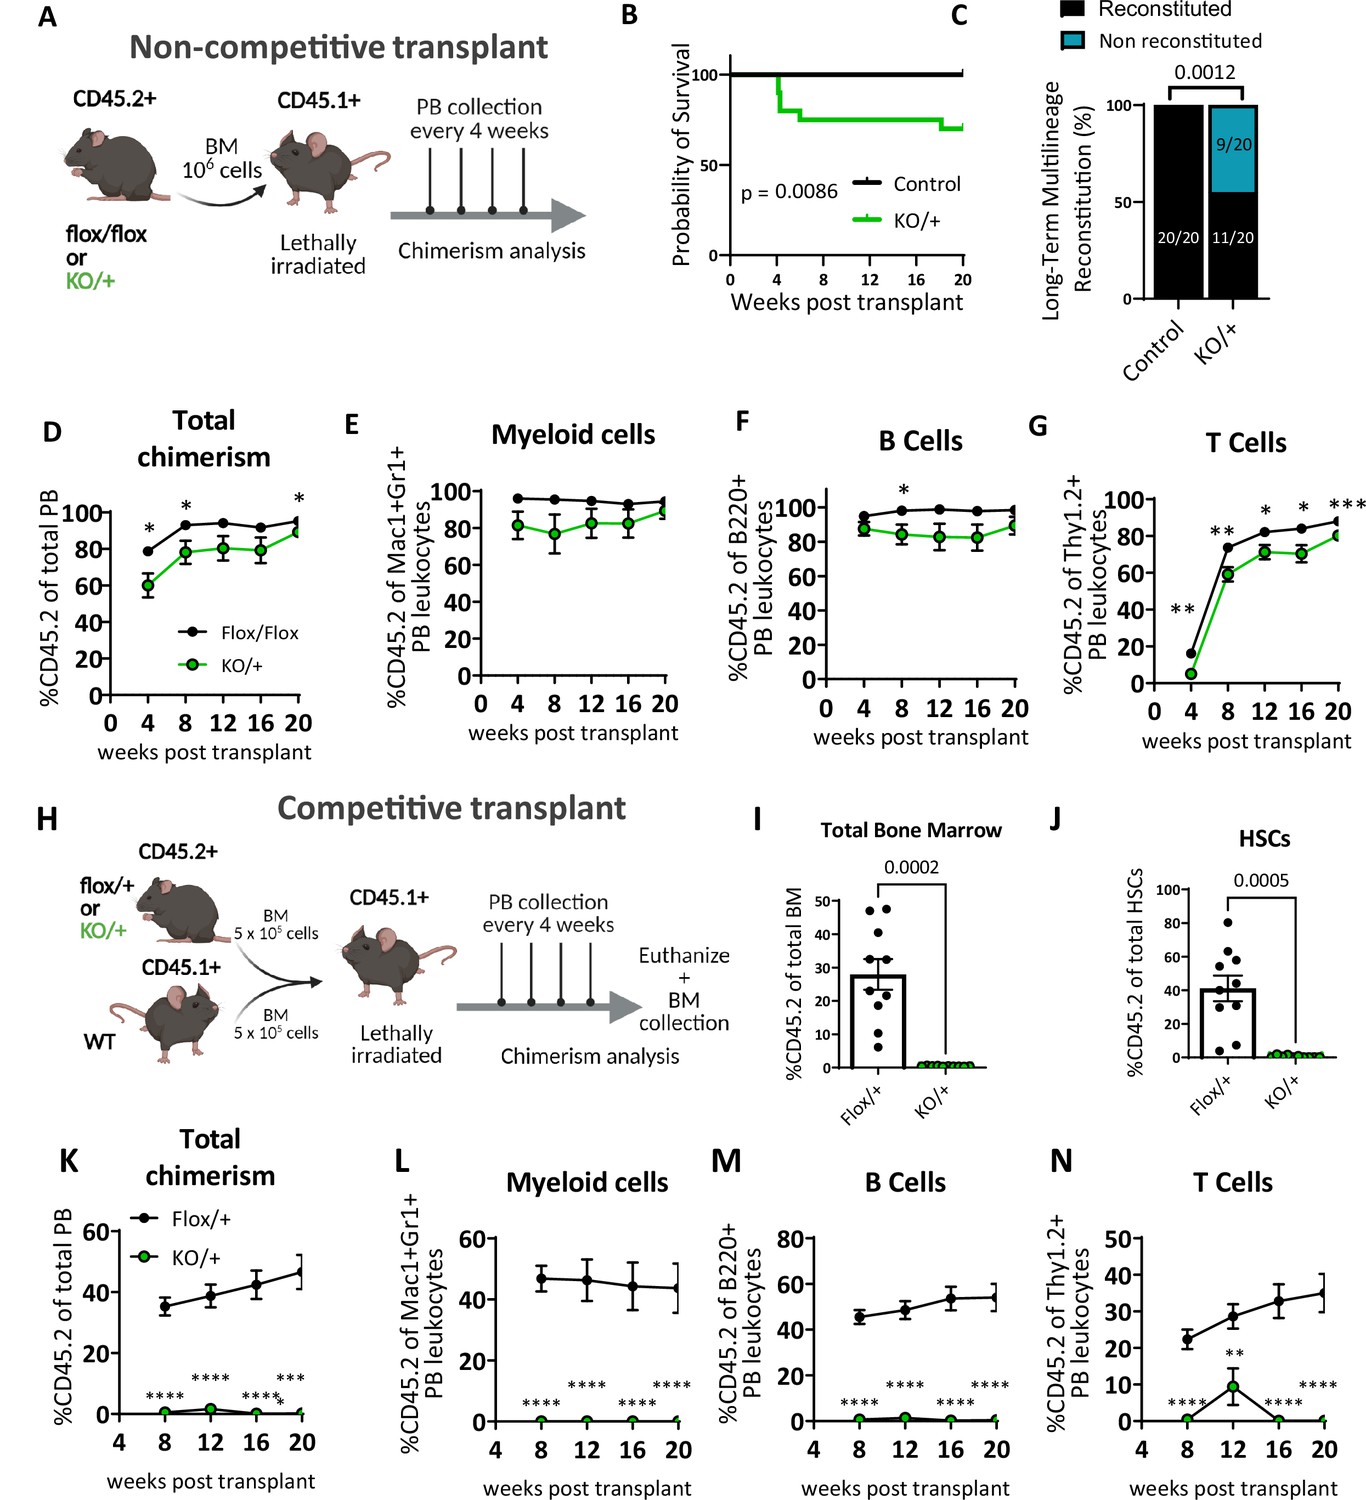
Heterozygous loss of Rps12 impairs hematopoietic stem cells (HSCs) ability to reconstitute peripheral blood.
(A) Non-competitive bone marrow (BM) transplant strategy testing the long-term reconstituting activity of Rps12KO/+ HSCs. 106 bone marrow cells from Rps12KO/+ or Rps12flox/flox samples (CD45.2+) were transplanted into lethally irradiated B6.SJL (CD45.1+) mice, peripheral blood chimerism was determined every 4 weeks. (B) Kaplan-Meier survival curves of mice transplanted with BM cells from Rps12KO/+ and control Rps12flox/+ or Rps12flox/flox mice (control n=20 and KO/+ n=20 transplanted mice, the combination of two independent non-competitive transplants with 1 donor per genotype transplanted into 10 host mice each). (C) Frequency of recipient mice with long-term (20 weeks) multi-lineage reconstitution (≥0.5% in all three macrophages, B, and T cells) (control n=20 and KO/+ n=20 transplanted mice, the combination of two independent non-competitive transplants). (D–G) Peripheral blood donor-derived (D) total chimerism and (E–G) multi-lineage chimerism in non-competitively transplanted whole bone marrow (CD45.2+) recipients (flox/flox n=10 and KO/+ n=10). (H) Schematic representation of the competitive bone marrow transplant. 5 × 10⁵ cells from Rps12KO/+ or Rps12flox/+ donor bone marrow (CD45.2+) mixed with 5 × 10⁵ competitor bone marrow cells from B6.SJL (CD45.1+) mice were injected into lethally irradiated B6.SJL (CD45.1+) mice. Chimerism in peripheral blood was determined every 4 weeks and bone marrow chimerism was analyzed at 20 weeks after transplant. (I) Total bone marrow chimerism and (J) HSCs donor-derived (CD45.2+) chimerism in the recipient bone marrow (flox/+ n=10 and KO/+ n=10 competitive-transplanted mice). (K–N) Donor-derived peripheral blood chimerism of competitively transplanted Rps12KO/+ or Rps12flox/+ bone marrow cells as described in (H). Non- competitive transplants were performed twice, using different controls: Rps12flox/+ or Rps12flox/flox. The competitive transplant was performed once, using Rps12flox/+ mice as a control group. Statistical analysis: data represent mean +/− SEM, shown as the error bars, unpaired t-tests were performed to assess significance among populations between genotypes *p<0.05, **p<0.01, ***p<0.001, ****p<0.0001.
-
Figure 4—source data 1
Bone marrow transplants.
- https://cdn.elifesciences.org/articles/69322/elife-69322-fig4-data1-v2.xlsx
Figure 5
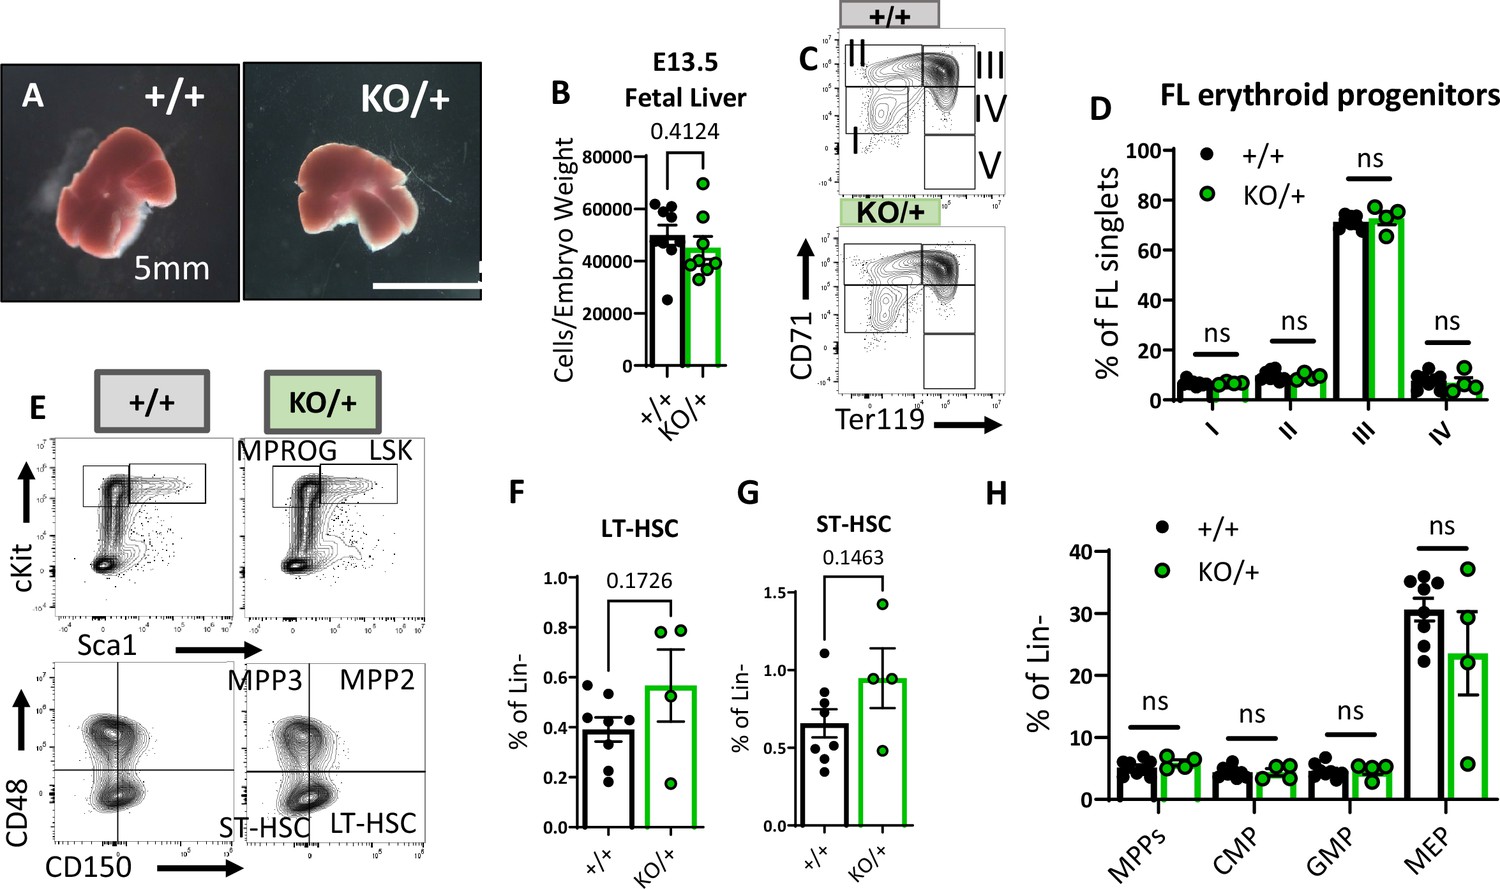
Embryonic hematopoietic system is largely unaffected in Rps12KO/+ animals.
(A) Representative images of Rps12+/- and littermate E13.5 fetal livers. (B) Quantification of the total number of cells per liver, normalized to embryo weight (+/+ n=9 and KO/+ n = 8). (C) Representative flow cytometry gating of erythropoietic populations using Ter119 and CD71 markers of fetal liver samples from E13.5 embryos. (E) Representative flow cytometry gating of Lin- (top) and LSK (bottom) populations in E13.5 fetal livers. (F, G, H) LT-HSCs, ST-HSCs, and indicated progenitor populations represented as percentages of the Lin- population in E13.5 fetal livers. (D, F, G, H) Biological samples are +/+ n=8 and KO/+ n=4. Statistical analysis: quantifications represent mean +/− SEM, shown as the error bars, unpaired t-tests were performed to establish significance among populations between genotypes *p<0.05, **p<0.01, ***p<0.001, ****p<0.0001.
-
Figure 5—source data 1
Fetal liver hematopoietic populations.
- https://cdn.elifesciences.org/articles/69322/elife-69322-fig5-data1-v2.xlsx
Figure 6

Hematopoietic stem cells (HSCs) and other hematopoietic progenitors have altered cycling, global translation levels, and apoptosis in Rps12KO/+ bone marrow.
(A) Representative flow cytometry gating of HSCs (Flk2−CD48−LSK) cell cycle stages (G0, G1, S/G2/M) distribution determined by DNA (Hoechst) and Ki67 levels. (B) Cell cycle stages distribution in HSCs and in indicated progenitor populations. Asterisks correspond to p values assessing significant differences in each cell cycle stage between Rps12KO/+ and Rps12+/+ mice (6- to 8-week-old littermates, +/+ n=4, and KO/+ n=3). (C) Representative flow cytometry histogram showing OPP intensity in RpS12KO/+ (green) and Rps12+/+ (gray) HSCs. (D, E) Median o-propargyl puromycin (OPP) intensity of the indicated bone marrow populations (6- to 8-week-old littermates, +/+ n=4, and KO/+ n=3). This analysis was repeated in 6- to 7-month-old mice with similar results. (F) Representative images of bone marrow cytospins showing the high number of apoptotic cells (arrows) in Rps12KO/+ samples. (G) Representative flow cytometry gating of LIN- population showing apoptotic populations as determined by AnexinV and PI staining. (H, I) Percentage of apoptotic (AnnexinV+) cells in LSK (Lin−cKit+Sca1+) and Myeloid progenitor (MPROG; Lin−cKit+Sca1−) populations (6- to 8-weeks-old littermates, +/+ n=4, and KO/+ n=3). Statistical analysis: quantifications represent mean +/− SEM, shown as the error bars, two-way ANOVA (B–F), and unpaired t-tests were performed to establish significance among populations between genotypes *p<0.05, **p<0.01, ***p<0.001, ****p<0.0001.
-
Figure 6—source data 1
Hematopoietic population cycling, apoptosis, and translation.
- https://cdn.elifesciences.org/articles/69322/elife-69322-fig6-data1-v2.xlsx
Figure 7
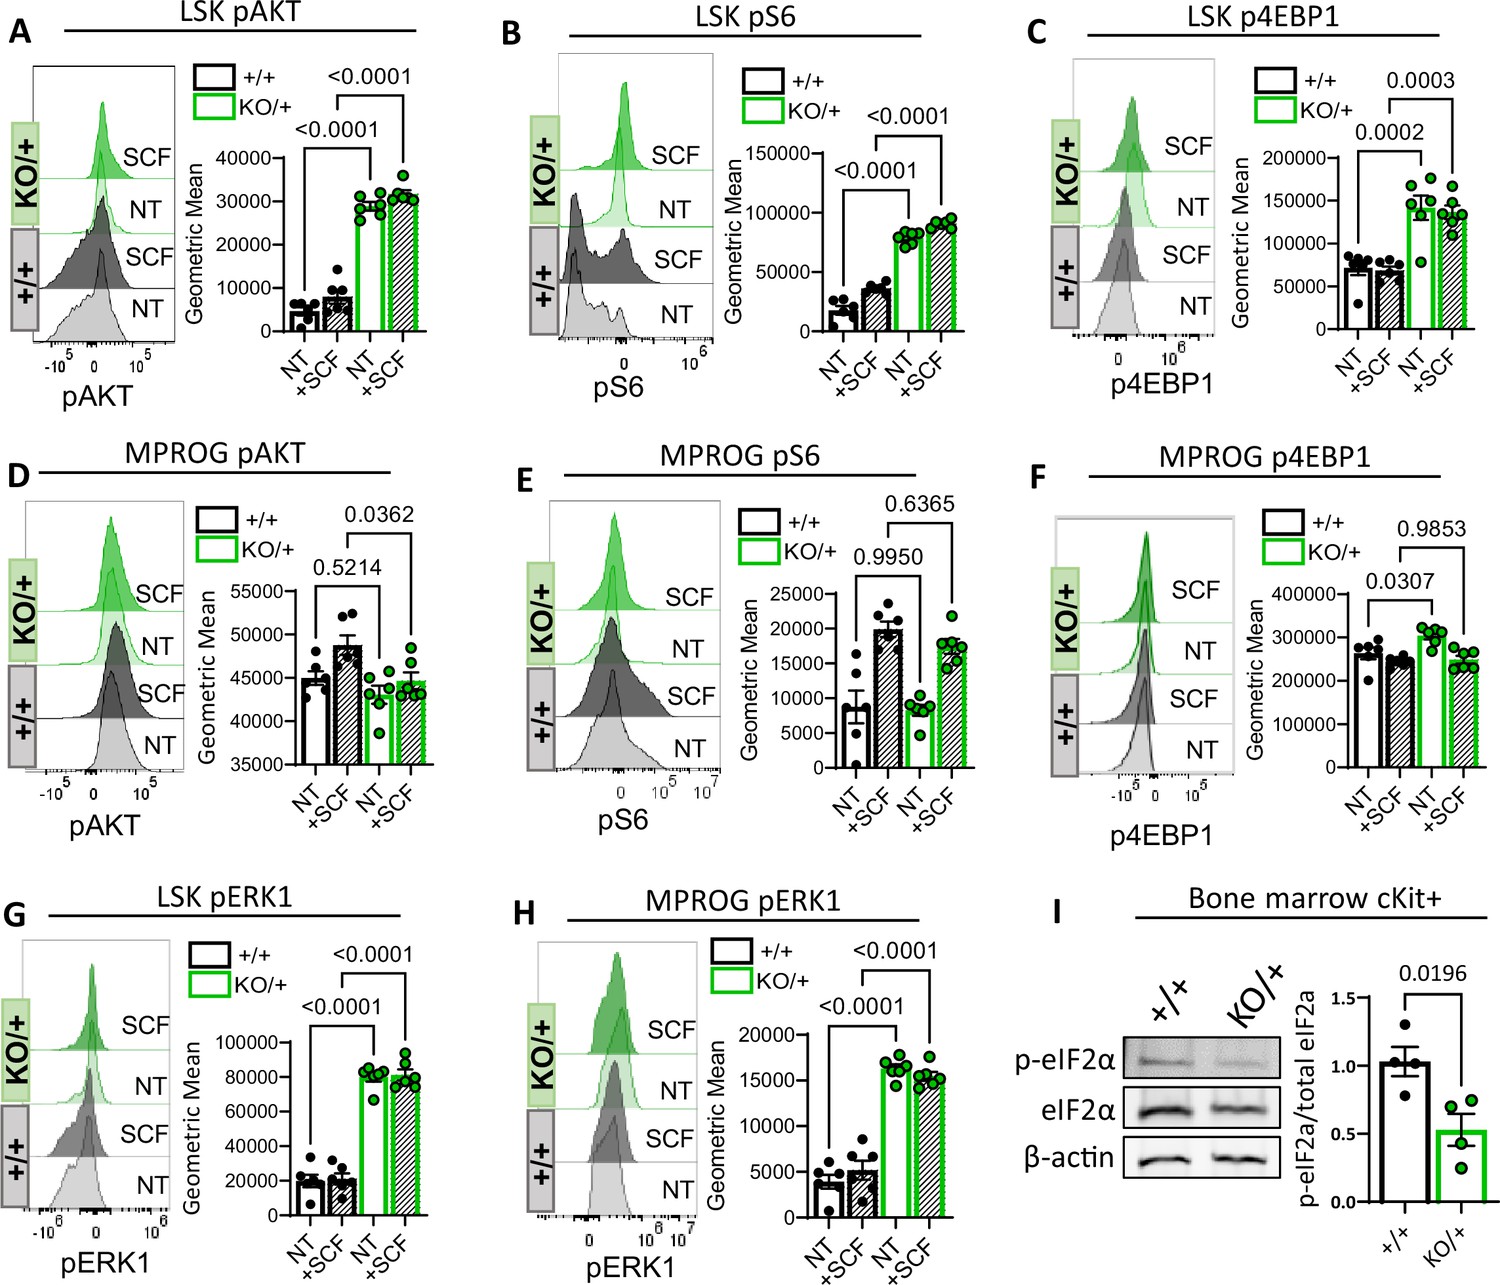
Decreased Rps12 levels lead to the excessive activation of the AKT/MTOR and ERK signaling pathways.
(A–H) Representative phospho-flow cytometry histograms and quantification of the normalized geometric mean fluorescent intensity of pAKT (Ser 473) (A, D), pS6 (Ser235/236) (B, E), p4EBP1 (Thr37/46) (C, F), and pERK1(Thr202/Tyr204) (D, H) signal in the LSK (A, B, C, G) and MPROG (D, E, F, H) bone marrow cell populations. Baseline signal was determined in the none treated (NT) serum-starved cells, stimulation was done with the stem cell factor (SCF) ex vivo for 5 min. Immunophenotypic populations were defined as follows: LSK: Lin−cKit+Sca1+, MPROG: Lin−cKit+Sca1−. (I) Representative images of western blot analysis and quantification of phospho-eIF2α normalized to the total eIF2α protein in cKit-enriched BM samples (6- to 8-weeks-old littermates, +/+ n=4, and KO/+ n=4) (A–H) 7-weeks-old littermates, +/+ n=6, and KO/+ n=6 biological samples were used. Statistical analysis: quantifications represent mean +/− SEM, shown as the error bars, one-way ANOVA Tukey’s multiple comparison tests were performed to establish significance among samples between genotypes.
-
Figure 7—source data 1
Blots of cKit + bone marrow cells.
(A) Complete blot shown in Figure 7I, after blotting with anti-βactin. On the right the blot is shown with labels and with the section cropped for Figure 7I indicated. (B) Complete blot showed after blotting with anti-IF2α. On the right the blot is shown with labels and with the section cropped for Figure 7I indicated. (C) Complete blot showed after blotting with anti-pIF2α. On the right the blot is shown with labels and with the section cropped for Figure 7I indicated.
- https://cdn.elifesciences.org/articles/69322/elife-69322-fig7-data1-v2.zip
-
Figure 7—source data 2
pAKT, pS6, and pERK1 levels in hematopoietic progenitors.
- https://cdn.elifesciences.org/articles/69322/elife-69322-fig7-data2-v2.xlsx
Figure 8 with 1 supplement
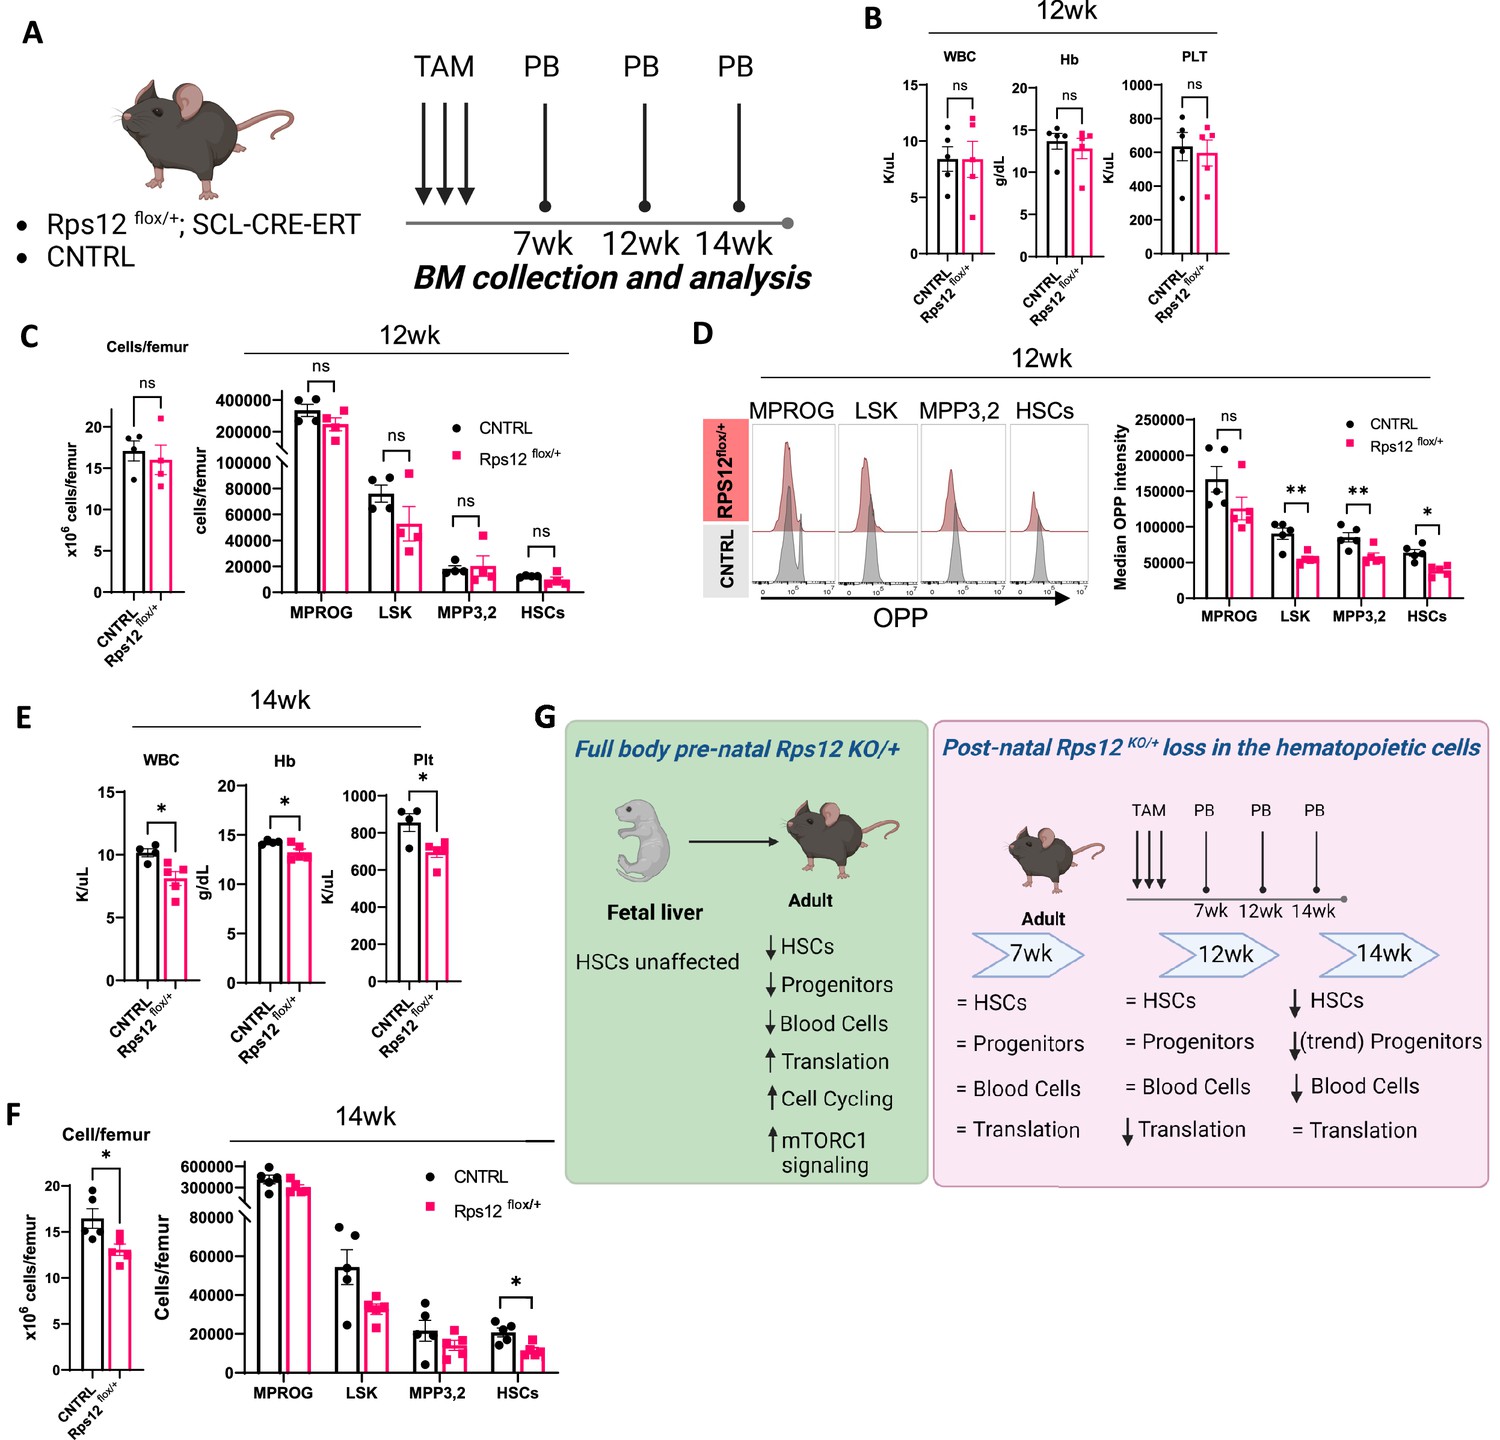
Heterozygous loss of Rps12 in the hematopoietic cells impairs translation in the hematopoietic stem and progenitor cells and leads to pancytopenia.
(A) Schematic representation of the time-course analysis testing the effect of the heterozygous loss of Rps12 activity in hematopoietic stem cells (HSCs). (B–D) Analysis of Rps12flox/+; Tal1-Cre-ERT (Rps12flox/+) and Rps12flox/+(CNTRL) at 12 weeks post tamoxifen treatment (TAM): (B) Peripheral blood cell analysis, (C) quantification of bone marrow cellularity and absolute cell count of bone marrow populations per femur, (D) representative flow histograms, and quantification of the median OPP intensity in bone marrow populations. (E) Peripheral blood cell analysis at 14 weeks and (F) quantification of bone marrow cellularity and absolute cell count of bone marrow populations per femur. (G) Schematic summary of the phenotypic analysis of mouse models. Immunophenotypic populations were defined as follows: MPROG: Lin−cKit+Sca1−, LSK: Lin−cKit+Sca1+; MPP3,2: Lin−cKit+Sca1+Flk2−CD48+, HSCs: Lin−cKit+Sca1+Flk2−CD48−. Statistical analysis: quantifications represent mean +/− SEM, shown as the error bars. Significance was determined using the Welch’s t-test *p≤0.05, **p≤0.01. At each time point n (Rps12flox/+)=5 and n (CNTRL)=5. Schematics created with BioRender.
-
Figure 8—source data 1
Conditional KO hematopoietic populations.
- https://cdn.elifesciences.org/articles/69322/elife-69322-fig8-data1-v2.xlsx
Figure 8—figure supplement 1
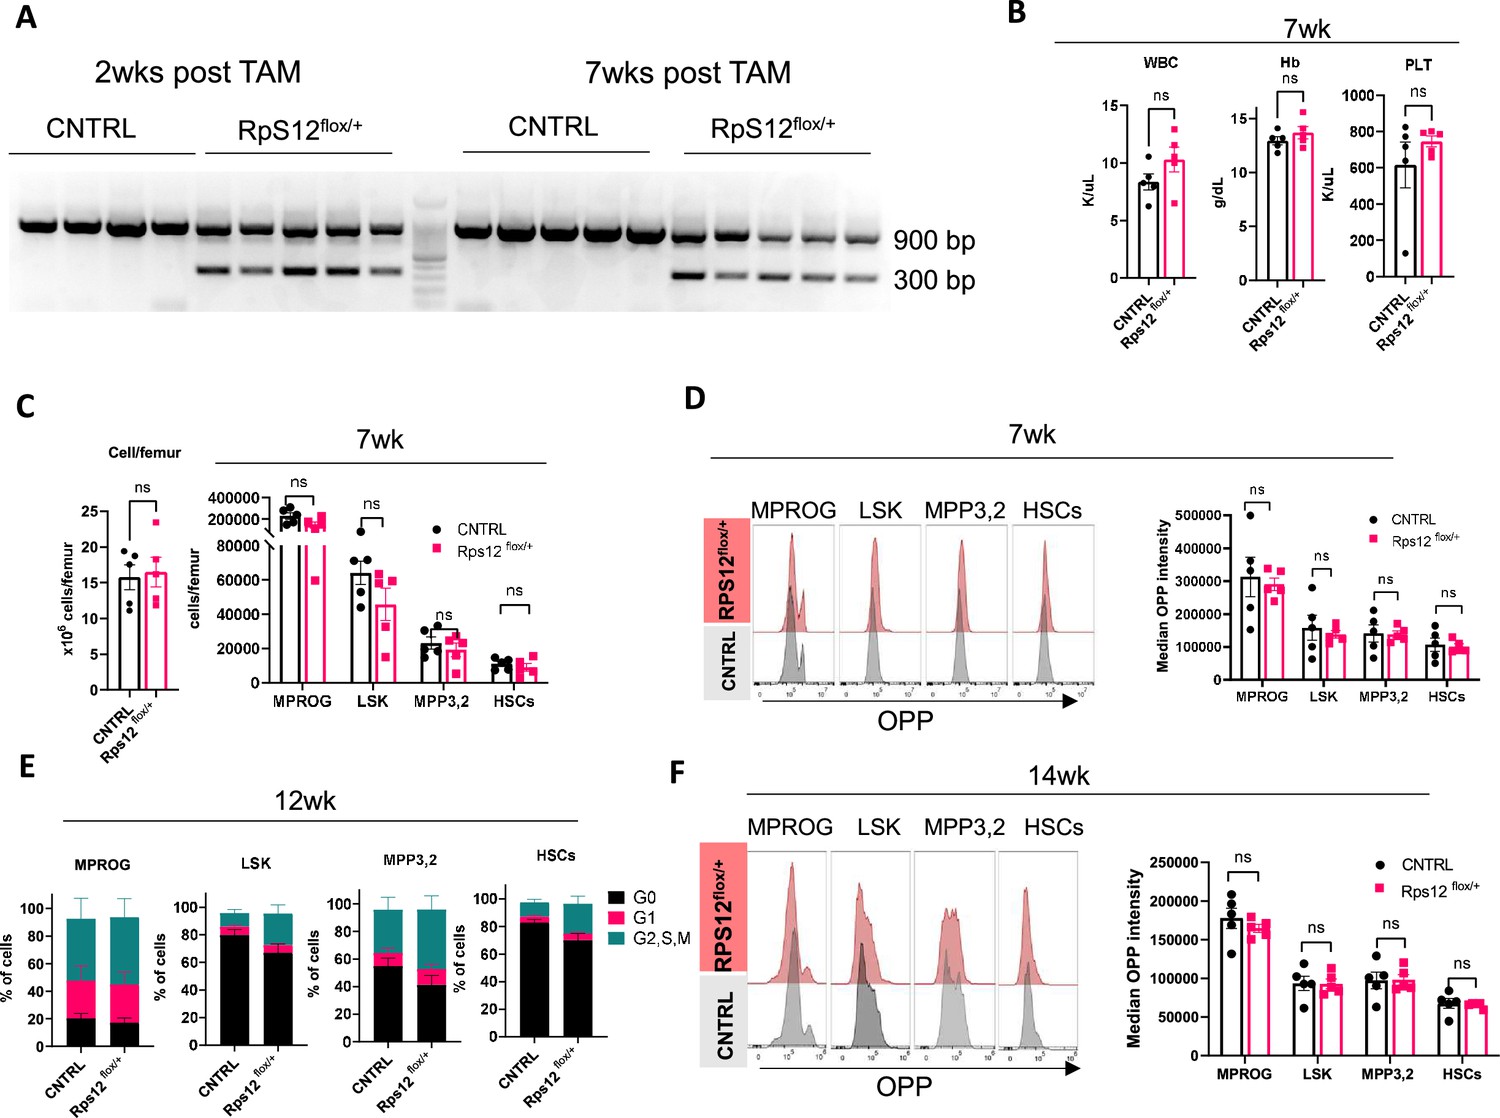
Heterozygous loss of Rps12 in the hematopoietic cells.
(A–D) Analysis of Rps12flox/+; Tal1-Cre-ERT (Rps12flox/+) and Rps12flox/+ (CNTRL) at 7 weeks post heterozygous Rps12 excision with tamoxifen (TAM): (A) Peripheral blood excision analysis at 2 and 7 weeks post TAM treatment. (B) Peripheral blood cell analysis, (C) quantification of bone marrow cellularity and absolute cell count of bone marrow populations per femur, (D) representative flow histograms and quantification of the median o-propargyl puromycin (OPP) intensity in bone marrow populations. (E) Cell cycle analysis of bone marrow populations at 12 weeks post TAM treatment. (F) Representative flow histograms and quantification of the median OPP intensity in bone marrow populations at 14 weeks post TAM treatment. Immunophenotypic populations were defined as follows: MPROG: Lin−cKit+Sca1−, LSK: Lin−cKit+Sca1+; MPP3,2: Lin−cKit+Sca1+Flk2−CD48+, HSCs: Lin−cKit+Sca1+Flk2−CD48−. Significance was determined using the Welch’s t-test ns ≥0.05. At each time point n=5 for both cohorts Rps12flox/+ and CNTRL.
-
Figure 8—figure supplement 1—source data 1
Analysis of Rps12 SCL-CRE excised hematopoietic progenitors.
- https://cdn.elifesciences.org/articles/69322/elife-69322-fig8-figsupp1-data1-v2.xlsx
Tables
Key resources table
| Reagent type (species) or resource | Designation | Source or reference | Identifiers | Additional information |
|---|---|---|---|---|
| Genetic reagent (Mus musculus) | C57BL/6 J | The Jackson Laboratory | RRID:IMSR_JAX:000664 | |
| Genetic reagent (Mus musculus) | EIIa-Cre (FVB/N-Tg(EIIa-cre)C5379Lmgd/J) | The Jackson Laboratory | RRID:IMSR_JAX:003724 | |
| Genetic reagent (Mus musculus) | B6.SJL-Ptprca/ BoyAiTac (CD45.1) | The Jackson Laboratory | RRID:IMSR_JAX:002014 | |
| Genetic reagent (Mus musculus) | RpS12flox/flox | This study | Rps12em1Nbakr MGI:6388411 | Generated for this study |
| Genetic reagent (Mus musculus) | Scl-Cre-ER | The Jackson Laboratory | RRID:IMSR_JAX:037466 | |
| Genetic reagent (Mus musculus) | RpS12flox/+; Scl-Cre-ER | This study | Generated for this study | |
| Antibody | Rat monoclonal CD16/CD32 | BD biosciences | Cat # 553142 | Clone: 2.4G2 (1 µl per 107 cells) |
| Antibody | APC-Cy7 Rat anti-mouse monoclonal Gr1 | BD biosciences | Cat # 557661 | Clone: RB6-8C5 (1 µl per 107 cells) |
| Antibody | PE rat anti-mouse monoclonal Mac1 | BioLegend | Cat # 101208 | Clone: M1/70 (1 µl per 107 cells) |
| Antibody | Alexa Fluor 700 Rat anti-Mouse monoclonal B220 | BD biosciences | Cat # 557957 | Clone: RA3-6B2 (1 µl per 107 cells) |
| Antibody | APC Rat Anti-Mouse monoclonal Thy1.2 | BD biosciences | Cat # 553007 | Clone: 53–2.1 (1 µl per 107 cells) |
| Antibody | FITC Mouse Anti-Mouse monoclonal CD45.1 | BD biosciences | Cat # 553775 | Clone: A20 (1 µl per 107 cells) |
| Antibody | PE/Dazzle 594 mouse anti-mouse monoclonal CD45.2 | BioLegend | Cat # 109845 | Clone:104 (1 µl per 107 cells) |
| Antibody | CD3e hamster monoclonal, Biotin, | eBioscience | Cat # 13003182 | Clone: 145–2 C11 (1 µl per 107 cells) |
| Antibody | CD4 rat Monoclonal, Biotin, | eBioscience | Cat #13004182 | Clone: GK1.5 (1 µl per 107 cells) |
| Antibody | CD8a rat Monoclonal, Biotin, | eBioscience | Cat # 13008182 | Clone: 53–6.7 (1 µl per 107 cells) |
| Antibody | Gr1 rat Monoclonal, Biotin, | eBioscience | Cat # 13593182 | Clone: RB68C5 (1 µl per 107 cells) |
| Antibody | B220 rat Monoclonal, Biotin, | eBioscience | Cat # 13045282 | Clone: RA3-6B2 (1 µl per 107 cells) |
| Antibody | CD19 mouse Monoclonal, Biotin, | eBioscience | Cat # 13019182 | Clone: MB 19–1 (1 µl per 107 cells) |
| Antibody | Ter119 rat Monoclonal, Biotin, | eBioscience | Cat # 13592182 | Clone: TER119 (1 µl per 107 cells) |
| Antibody | PE/Cyanine7 rat anti-mouse monoclonal Sca-1 | BioLegend | Cat #108114 | Clone: D7 (1 µl per 107 cells) |
| Antibody | APC Rat Anti-Mouse monoclonal cKit | BD Biosciences | Cat #553356 | Clone:2B8 (1 µl per 107 cells) |
| Antibody | PE Rat Anti-Mouse monoclonal FCRg | Thermo Fisher | Cat # 12-0161-82 | Clone: 93 (1 µl per 107 cells) |
| Antibody | eFluor 450 Rat Anti-Mouse monoclonal CD34 | Thermo Fisher | Cat #48-0341-80 | Clone:RAM34 (1 µl per 107 cells) |
| Antibody | Brilliant Violet 421 Rat anti-Mouse monoclonal CD150 | BD Biosciences | Cat #562811 | Clone: Q38-480 (1 µl per 107 cells) |
| Antibody | Alexa Fluor 700 hamster anti-mouse monoclonal CD48 | BioLegend | Cat #103426 | Clone: HM48-1 (1 µl per 107 cells) |
| Antibody | PE/Cyanine5 Rat anti-mouse monoclonal Flk-2 | BioLegend | Cat #135312 | Clone: A2F10 (1 µl per 107 cells) |
| Antibody | Brilliant Violet 605 mouse anti-mouse monoclonal CD45.2 | BioLegend | Cat #109841 | Clone: 104 (1 µl per 107 cells) |
| Antibody | PerCP/Cyanine5.5 rat anti-mouse monoclonal IL-7Rα | BioLegend | Cat #135021 | Clone: A7R34 (1 µl per 107 cells) |
| Other | Streptavidin-APC-Cy7 | BD Biosciences | Cat # 554063 | second-step reagent for cells stained with biotinylated primary antibodies |
| Antibody | PE anti-mouse monoclonal Flk-2 | BioLegend | Cat # 135306 | Clone: A2F10 (1 µl per 107 cells) |
| Commercial assay, kit | FITC Annexin V | BD Biosciences | Cat # 560931 | Apoptosis detection: Phosphatidylserine probe |
| Commercial assay, kit | Propidium Iodide | BD Biosciences | Cat # 556463 | Apoptosis detection: Staining Solution |
| Antibody | pS6 (Ser235/236) Alexa 488 rabbit monoclonal | Cell Signaling | Cat # 4803 S | Clone: D57.2.2E ICFC (1:50) |
| Antibody | pERK1 (T202/Y204) Alexa 488 mouse monoclonal | Cell Signaling | Cat # 4374 | Clone: E10 ICFC (1:20) |
| Antibody | pAkt (Ser473) AF647 rabbit monoclonal | Cell Signaling | Cat # 2337 | Clone: 193H12 ICFC (1:20) |
| Antibody | p4E-BP1 (Thr37/46) rabbit monoclonal AF647 | Cell Signaling | Cat # 5123 | Clone: 236B4 ICFC (1:20) |
| Antibody | FITC Mouse monoclonal Anti-Ki-67 | BD Biosciences | Cat # 556026 RRID: AB_396302 | Clone: B56 (1 µl per 107 cells) |
| other | Hoechst 33342 Solution | BD Biosciences | Cat # 561908 | See legend to Figure 6 |
| Commercial assay, kit | Click-iT Plus OPP Alexa Fluor 488 | Thermo Fisher | Cat # C10456 | Protein Synthesis Assay Kit |
| Antibody | APC rat anti-mouse monoclonal TER-119 | BioLegend | Cat # 116211 | Clone: TER119 (1 µl per 107 cells) |
| Antibody | PE rat anti-Mouse monoclonal CD71 | BD biosciences | Cat # 561937 | Clone: C2 (1 µl per 107 cells) |
| Sequence-based reagent | gRNA 1 | This study | PCR primer | CGCAGTAGACACGCTATCGCCGG |
| Sequence-based reagent | gRNA 2 | This study | PCR primer | GTGGGTTGCTGTGTGGATCGGGG |
| Sequence- based reagent | F1 | This study | PCR primer | GCACATGCGCACAGAAGT |
| Sequence- based reagent | R1 | This study | PCR primer | CGGACTATCTATCCCCACGA |
| Sequence-based reagent | F2 | This study | PCR primer | GTACAGCTATCTGCCAGGAA |
| Sequence- based reagent | R2 | This study | PCR primer | CGAGGTCGACGGTATCG |
| Sequence- based reagent | F3 | This study | PCR primer | CGATACCGTCGACCTCG |
| Sequence- based reagent | R3 | This study | PCR primer | GTGCTAGCAACAGAAGGTTC |
| Sequence- based reagent | F4 | This study | PCR primer | GTCTCAATACTGTGGGGTGT |
| Commercial assay, kit | Cytofix/Cytoperm | BD biosciences | Cat # BDB554714 | Fixation/Permeabilization Solution Kit |
| Commercial assay, kit | DNeasy kit | Qiagen | Cat #69504 | DNA extraction kit |
| Chemical compound, drug | mSCF | Peprotech | Cat # 250–03 | Cytokine |
| Other | MethoCult GF M3434 | Stem Cell Technologies | Cat # 03434 | Methylcellulose media |
| Other | MethoCult M3334 | Stem Cell Technologies | Cat # 03334 | Methylcellulose media |
| Other | CD117 MicroBeads, mouse | Miltenyi Biotec | Cat #130-091-224 | See ‘Western blot analysis’ in methods section |
| Other | LS Column | Miltenyi Biotec | Cat # 130-042-401 | Separation column |
| Antibody | RpS12, rabbit polyclonal | Proteintech | Cat # 16490–1-AP | 1:1000 |
| Antibody | β-Actin (13E5) Rabbit monoclonal mAb | Cell Signaling | Cat # 4970 | 1:1000 |
| Antibody | eIF2α (D7D3) Rabbit monoclonal mAb | Cell Signaling | Cat # 5324 | 1:1000 |
| Antibody | phospho-eIF2α (Ser52) rabbit polyclonal | Thermo Scientific | Cat # BS-4842R | 1:1000 |
| Commercial assay, kit | miRNA First- Strand Synthesis Kit | Takara Bio | Cat # 638313 | |
| Commercial assay, kit | mirVana miRNA Isolation Kit | Thermo Fisher | Cat # AM1560 | |
| Other | Power SYBR Green Master Mix | Applied Biosystems | Cat # 4367659 | PCR reaction mix |
Additional files
-
Supplementary file 1
Antibodies used for flow cytometry panels of peripheral blood and bone marrow samples.
This file contains a list of all the biotinylated and fluorochrome-conjugated antibodies used in both live and fixed cell samples used in the experiments described in this paper. The antibodies are grouped by flow cytometry panel and include clone name as well as the manufacturer and catalog number information for ease of use and reproducibility. Additional information on antibody concentration used for staining can be found in the ‘Key Resources Table.’
- https://cdn.elifesciences.org/articles/69322/elife-69322-supp1-v2.xlsx
-
Transparent reporting form
- https://cdn.elifesciences.org/articles/69322/elife-69322-transrepform1-v2.pdf
Download links
A two-part list of links to download the article, or parts of the article, in various formats.
Downloads (link to download the article as PDF)
Open citations (links to open the citations from this article in various online reference manager services)
Cite this article (links to download the citations from this article in formats compatible with various reference manager tools)
Haploinsufficiency of the essential gene Rps12 causes defects in erythropoiesis and hematopoietic stem cell maintenance
eLife 12:e69322.
https://doi.org/10.7554/eLife.69322


