Reexamination of N-terminal domains of syntaxin-1 in vesicle fusion from central murine synapses
- Universität Berlin, Humboldt-Universität zu Berlin, Germany
- Berlin Institute of Health, Germany
- Einstein Center for Neurosciences Berlin, Germany
Figures
Figure 1 with 1 supplement
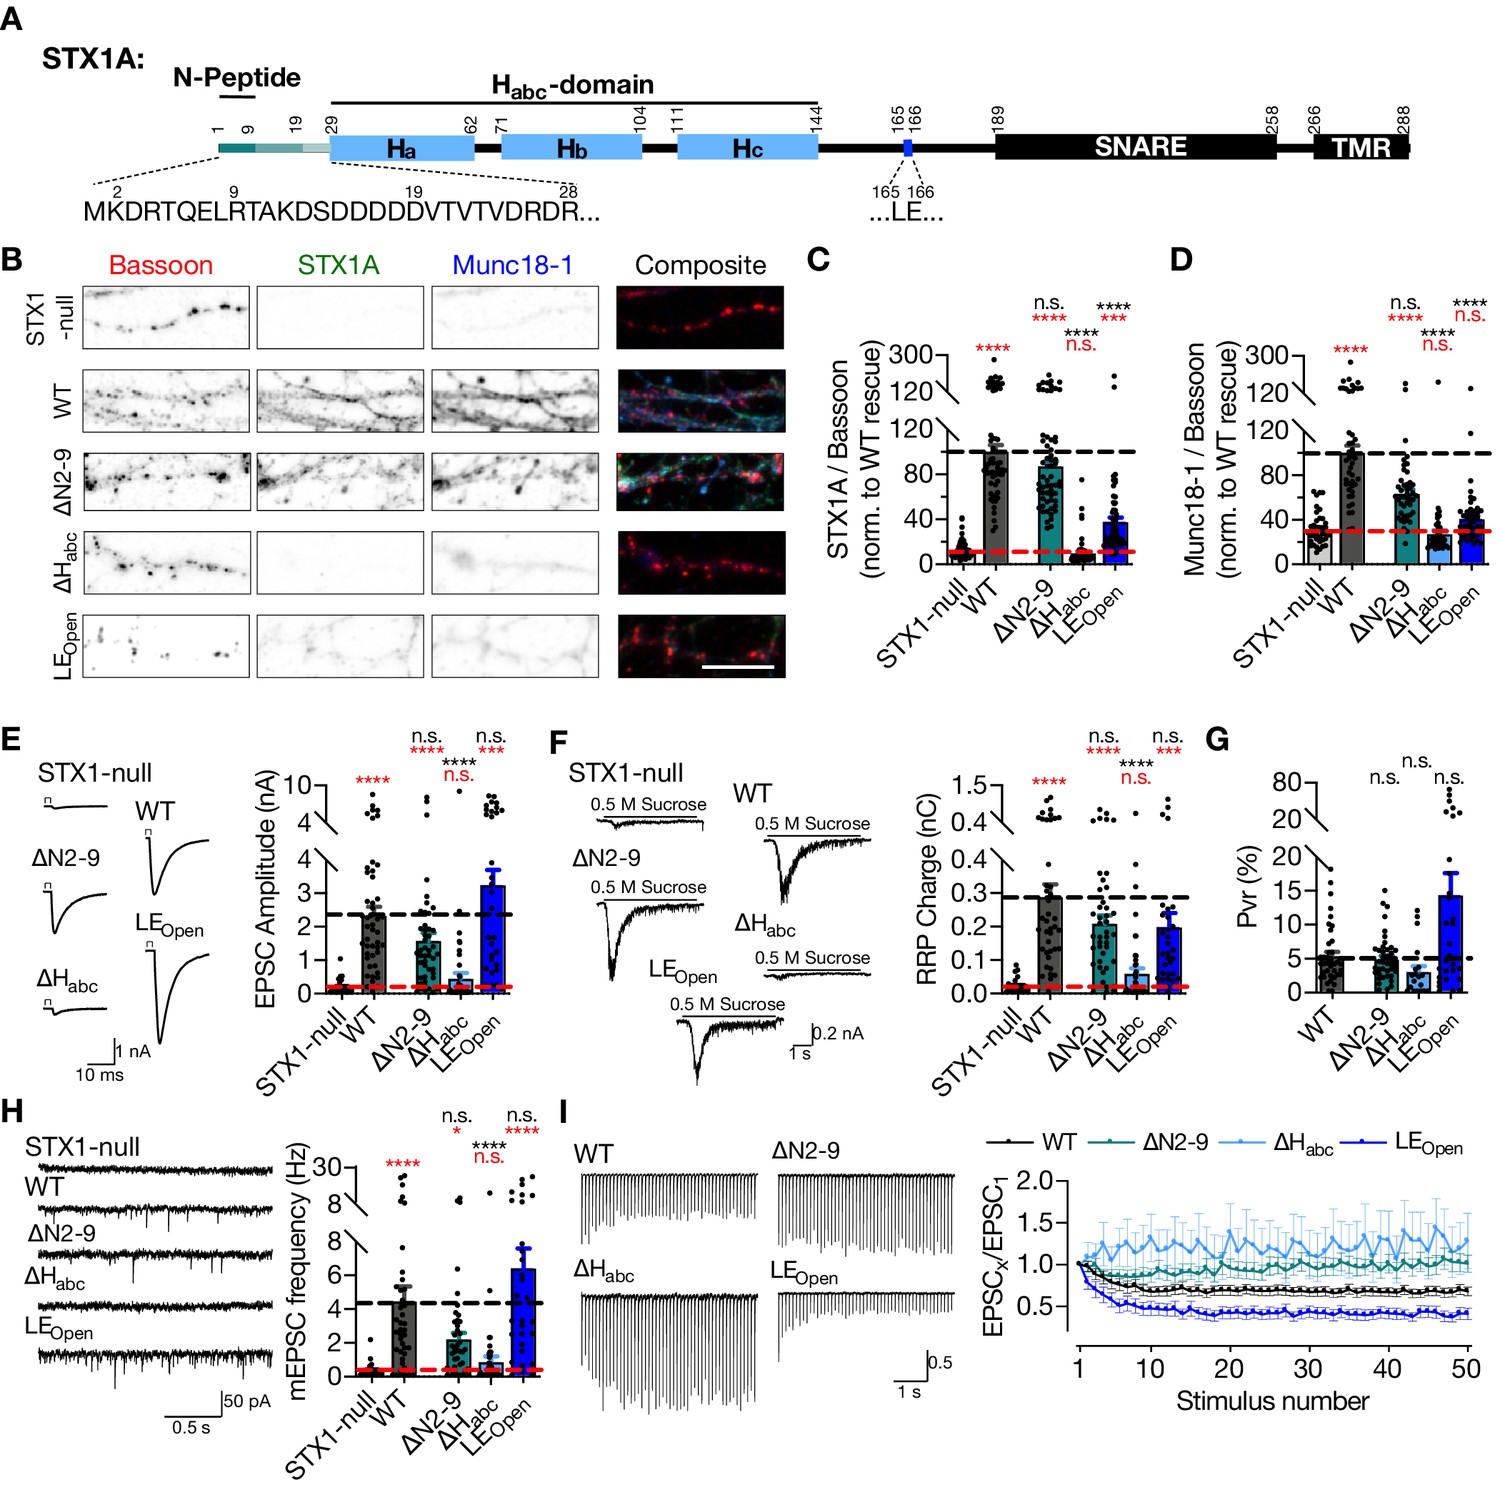
STX1A’s Habc-domain is essential and N-peptide is dispensable for neurotransmitter release.
(A) Domain structure of STX1A. The protein consists of a short N-peptide (aa 1–9 or 1–28), Habc domain (aa 29–144) formed by three helices, Ha, Hb, and Hc, followed by the H3 helix (aa 189–259; SNARE domain) and a transmembrane region (aa 266–288; TMR). (B) Example images of immunofluorescence labeling for Bassoon, STX1A, and Munc18-1 shown as red, green, and blue, respectively, in the corresponding composite pseudocolored images obtained from high-density cultures of STX1-null hippocampal neurons either not rescued or rescued with STX1AWT, or STX1A∆2-9; STX1ALEOpen; or STX1A∆Habc. Scale bar: 10 µm (C, D) Quantification of the immunofluorescence intensity of STX1A and Munc18-1 as normalized to the immunofluorescence intensity of Bassoon in the same ROIs as shown in (B). The values were then normalized to the values obtained from STX1AWT neurons. (E) Example traces (left) and quantification of the amplitude (right) of EPSCs obtained from hippocampal autaptic STX1-null neurons either not rescued or rescued with STX1AWT, STX1B∆2-9, STX1ALEOpen, or STX1A∆Habc. (F) Example traces (left) and quantification of the charge transfer (right) of 500 mM sucrose-elicited readily releasable pools (RRPs) obtained from the same neurons as in (E). (G) Quantification of probability of vesicular release (Pvr) determined as the percentage of the RRP released upon one AP. (H) Example traces (left) and quantification of the frequency (right) of mEPSCs recorded at –70 mV. (I) Example traces (left) and quantification (right) of short-term plasticity (STP) determined by high-frequency stimulation at 10 Hz and normalized to the EPSC1 from the same neuron. Data information: the artifacts are blanked in example traces in (D) and (H). The example traces in (G) were filtered at 1 kHz. In (C–H), data points represent single observations, the bars represent the mean ± SEM. In (I), data points represent mean ± SEM. Red and black annotations (stars and n.s.) on the graphs show the significance comparisons to STX1-null and to STX1AWT rescue, respectively (nonparametric Kruskal–Wallis test followed by Dunn’s post hoc test, *p≤0.05, ***p≤0.001, ****p≤0.0001). Two-way ANOVA was applied for data in (I). The numerical values are summarized in Figure 1—source data 1.
-
Figure 1—source data 1
Quantification of the STX1AWT and mutant STX1A expression induced by lentiviral transduction of STX1-null neurons and the consequent neurotransmitter release properties.
- https://cdn.elifesciences.org/articles/69498/elife-69498-fig1-data1-v4.xlsx
Figure 1—figure supplement 1
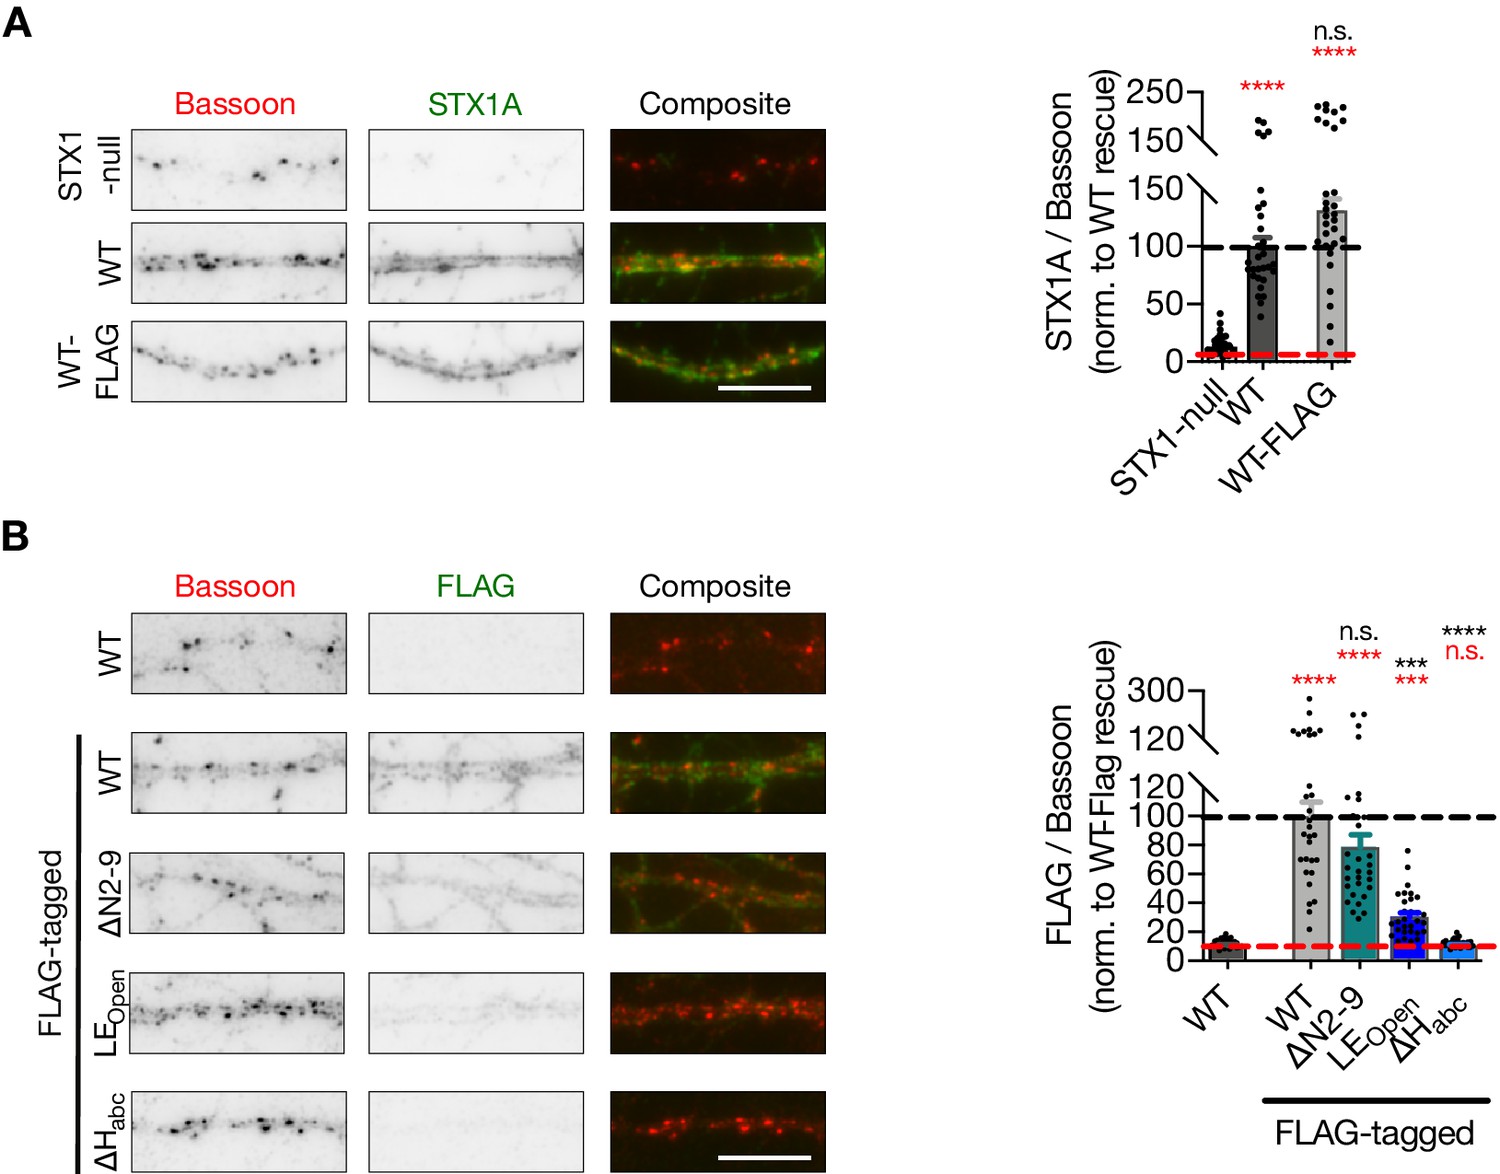
STX1A∆Habc expression cannot be detected.
(A) Example images (left) and quantification of immunofluorescence labeling for Bassoon and STX1A shown as red and green, respectively, in the corresponding composite pseudocolored images obtained from high-density cultures of STX1-null hippocampal neurons either not rescued or rescued with STX1AWT or STX1AWT-FLAG. The data were normalized to the STX1A fluorescence/Bassoon fluorescence value obtained from STX1AWT neurons. Scale bar: 10 µm (B) Example images (left) and quantification of immunofluorescence labeling for Bassoon and FLAG shown as red and green, respectively, in the corresponding composite pseudocolored images obtained from high-density cultures of STX1-null hippocampal neurons rescued with either STX1AWT, STX1AWT-FLAG, STX1A∆N2-9-FLAG, STX1ALEOpen-FLAG, or STX1A∆Habc-FLAG. The data were normalized to the STX1A fluorescence/Bassoon fluorescence value obtained from STX1AWT-FLAG neurons. Scale bar: 10 µm Data information: data points in graphs represent single observations, and the bars represent the mean ± SEM. In (A), black and red annotations on the graphs show the significance comparisons to STX1-null and STX1AWT, respectively. In (B), black and red annotations on the graphs show the significance comparisons to STX1WT and STX1AWT-FLAG, respectively (nonparametric Kruskal–Wallis test followed by Dunn’s post hoc test, *p≤0.05, **p≤0.01, ***p≤0.001, ****p≤0.0001). The numerical values are summarized in Figure 1—figure supplement 1—source data 1.
-
Figure 1—figure supplement 1—source data 1
Quantification of the expression of FLAG-tagged WT and mutant STX1A.
- https://cdn.elifesciences.org/articles/69498/elife-69498-fig1-figsupp1-data1-v4.xlsx
Figure 2
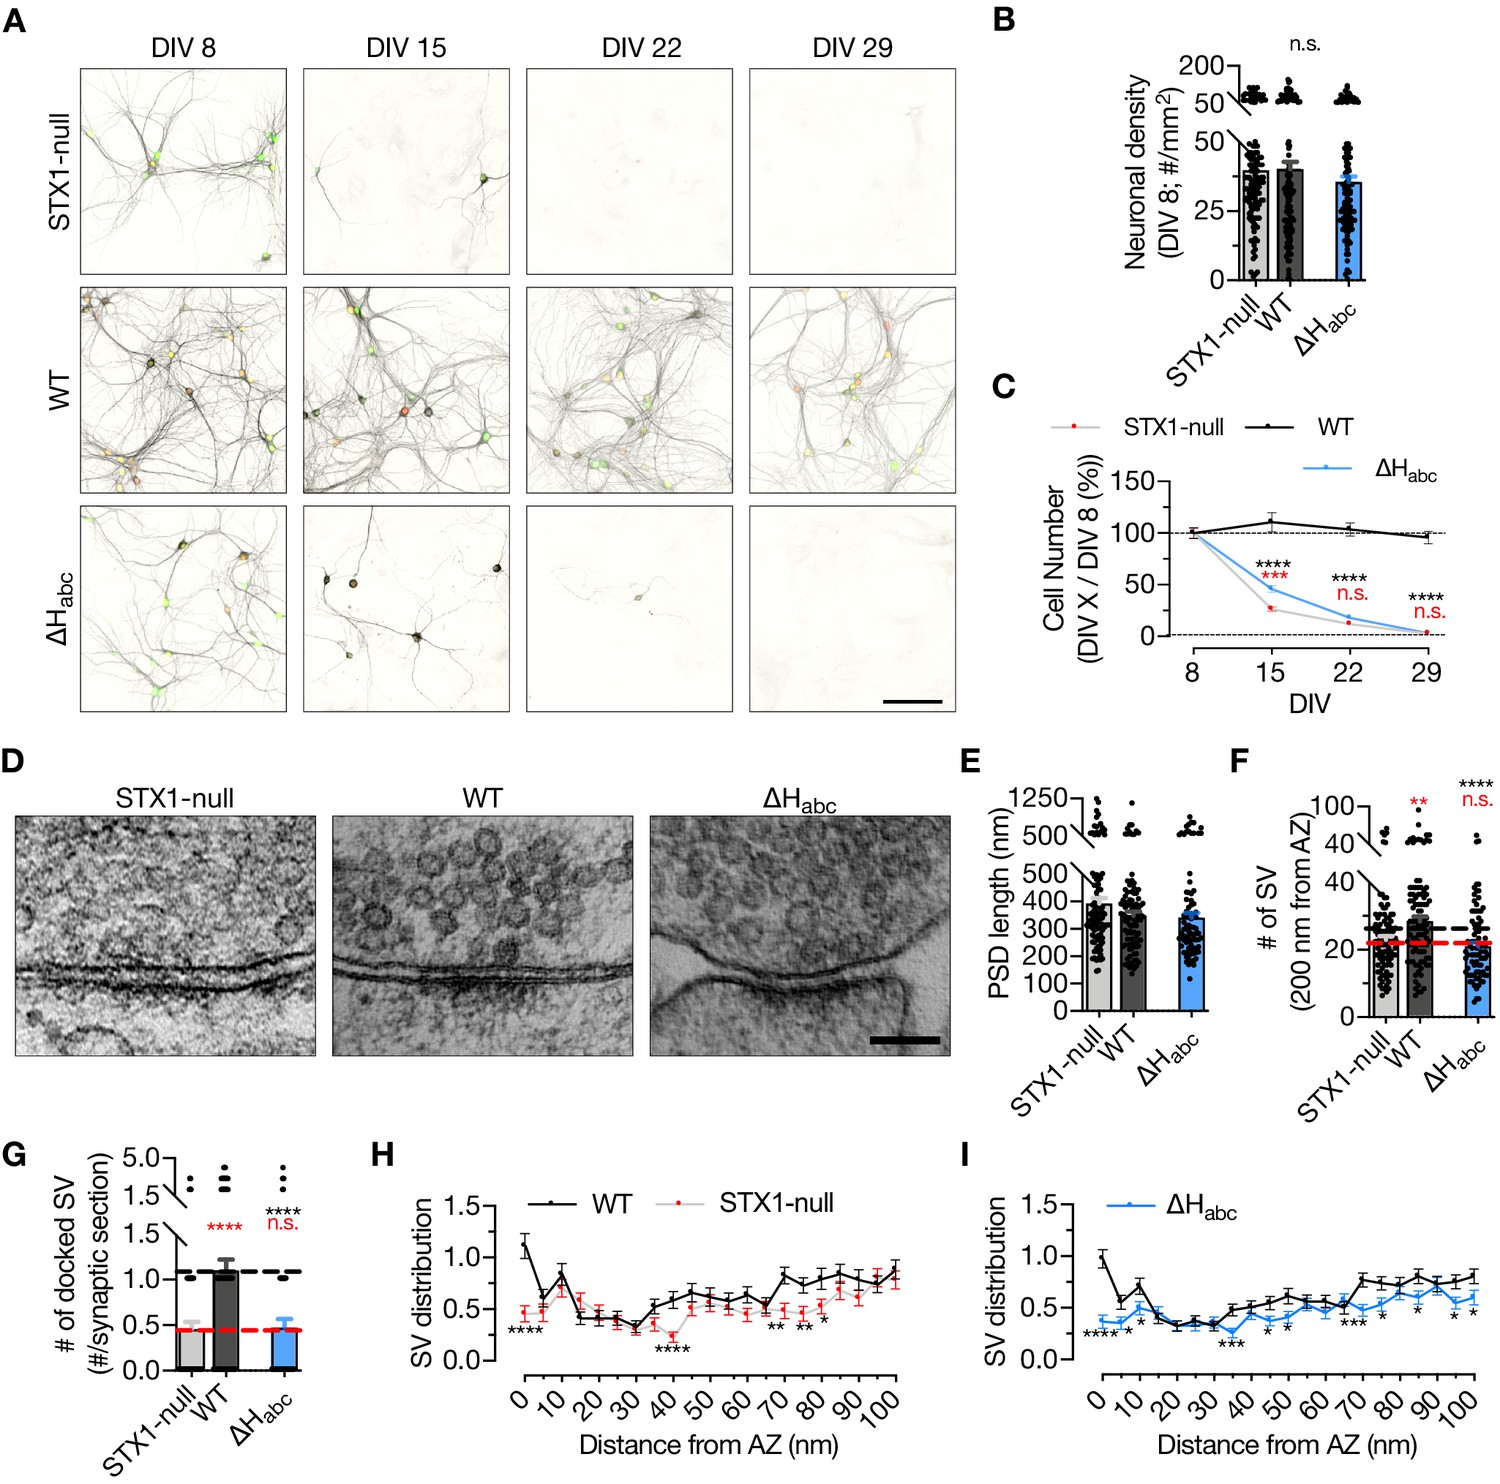
STX1’s Habc-domain is essential for the overall function of STX1A.
(A) Example images of high-density cultures of STX1-null, STX1AWT, and STX1A∆Habc hippocampal neurons at DIV 8, 15, 22, and 29 represented with immunofluorescent labeling of microtubule associated protein 2 (MAP2) . Red and green nuclei serve as a marker for NLS-RFP-P2A-Cre recombinase expression and for NLS-GFP-P2A-STX1A (either WT or mutants), respectively. Scale bar: 50 µm. (B) Quantification of neuronal density at DIV 8. (C) Quantification of the percentage of the surviving neurons at DIV 8, 15, 22, and 29 as normalized to the neuronal density at DIV 8 in the same well. (D) Example high-pressure freezing fixation combined with electron microscopy (HPF-EM) images of nerve terminals from high-density cultures of STX1-null hippocampal neurons either not rescued or rescued with STX1AWT or STX1A∆Habc. (E–G) Quantification of active zone (AZ) length, number of synaptic vesicles (SVs) within 200 nm distance from AZ, and number of docked SVs. (H, I) SV distribution of STX1-null and STX1A∆Habc neurons compared to that of STX1AWT neurons. Data information: in (B, E–G), data points represent single observations, the bars represent the mean ± SEM. In (C, H, I), data points represent the mean ± SEM. Red and black annotations (stars and n.s.) on the graphs show the significance comparisons to STX1-null and to STX1AWT neurons, respectively (nonparametric Kruskal–Wallis test followed by Dunn’s post hoc test, *p≤0.05, **p≤0.01, ***p≤0.001, ****p≤0.0001). The numerical values are summarized in Figure 2—source data 1.
-
Figure 2—source data 1
Quantification of the neuronal density at different time intervals and quantification of ultrastructural synaptic properties in high density cultures of STX1-null, STX1AWT, and STX1AΔΗabc neurons.
- https://cdn.elifesciences.org/articles/69498/elife-69498-fig2-data1-v4.xlsx
Figure 3 with 2 supplements
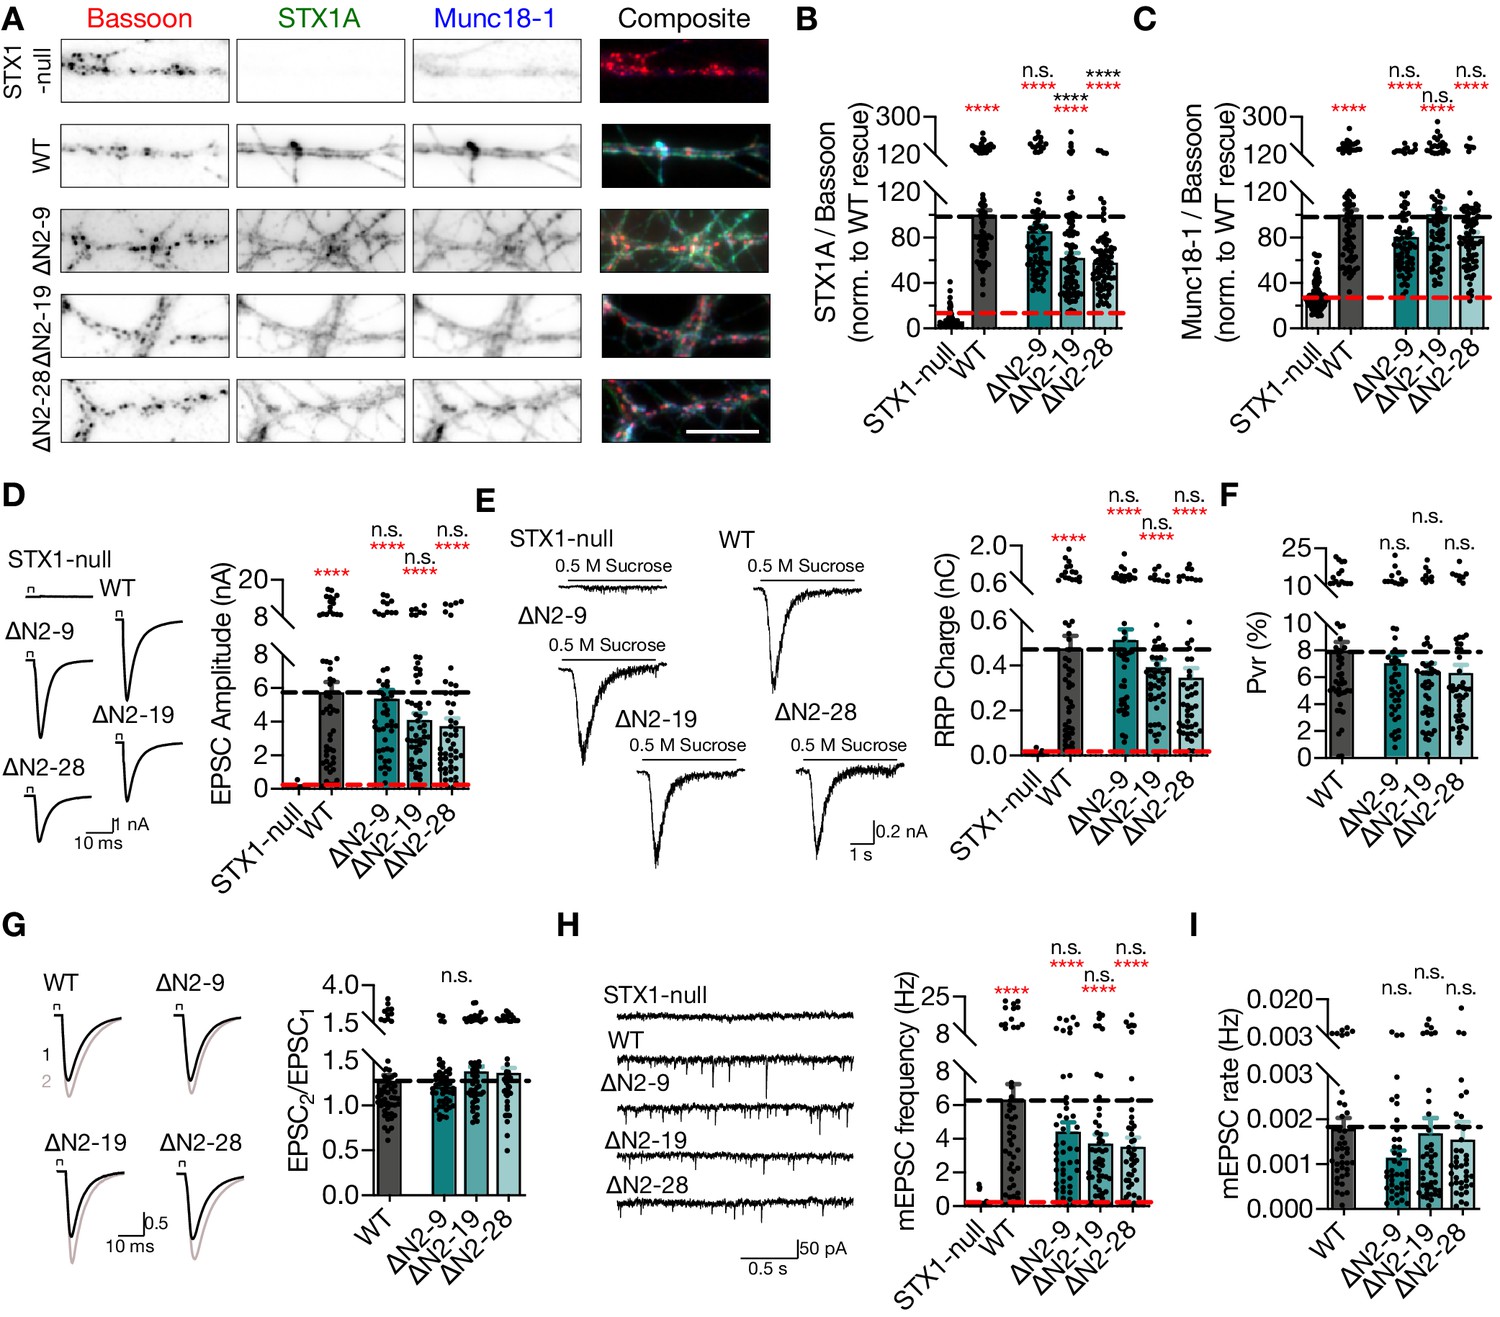
Deletion of the entire N-terminal stretch does not impair neurotransmitter release.
(A) Example images of immunofluorescence labeling for Bassoon, STX1A, and Munc18-1 shown as red, green, and blue, respectively, in the corresponding composite pseudocolored images obtained from high-density cultures of STX1-null hippocampal neurons either not rescued or rescued with STX1AWT, STX1A∆2-9, STX1A∆2-19, or STX1A∆2-28. Scale bar: 10 µm. (B, C) Quantification of the immunofluorescence intensity of STX1A and Munc18-1 as normalized to the immunofluorescence intensity of Bassoon in the same ROIs as shown in (A). The values were then normalized to the values obtained from STX1AWT neurons. (D) Example traces (left) and quantification of the amplitude (right) of EPSCs obtained from hippocampal autaptic STX1-null neurons either not rescued or rescued with STX1AWT, STX1A∆2-9, STX1A∆2-19, or STX1A∆2-28. (E) Example traces (left) and quantification of the charge transfer (right) of sucrose-elicited readily releasable pools (RRPs) obtained from the same neurons as in (D). (F) Quantification of probability of vesicular release (Pvr) determined as the percentage of the RRP released upon one action potential (AP). (G) Example traces (left) and quantification (right) of paired-pulse ratio (PPR) measured at 40 Hz. The artifacts are blanked in the example traces. (H) Example traces (left) and quantification of the frequency (right) of mEPSCs. The example traces were filtered at 1 kHz. (I) Quantification of mEPSC rate as spontaneous release of one unit of RRP. Data information: the artifacts are blanked in example traces in (D) and (G). The example traces in (H) were filtered at 1 kHz. In (B–I), data points represent single observations, the bars represent the mean ± SEM. Red and black annotations (stars and n.s.) on the graphs show the significance comparisons to STX1-null and to STX1AWT neurons, respectively (nonparametric Kruskal–Wallis test followed by Dunn’s post hoc test, ****p≤0.0001). The numerical values are summarized in Figure 3—source data 1.
-
Figure 3—source data 1
Quantification of the lentiviral expression of STX1AWT and STX1AΔΝ mutants in STX1-null neurons and the consequent neurotransmitter release properties.
- https://cdn.elifesciences.org/articles/69498/elife-69498-fig3-data1-v4.xlsx
Figure 3—figure supplement 1
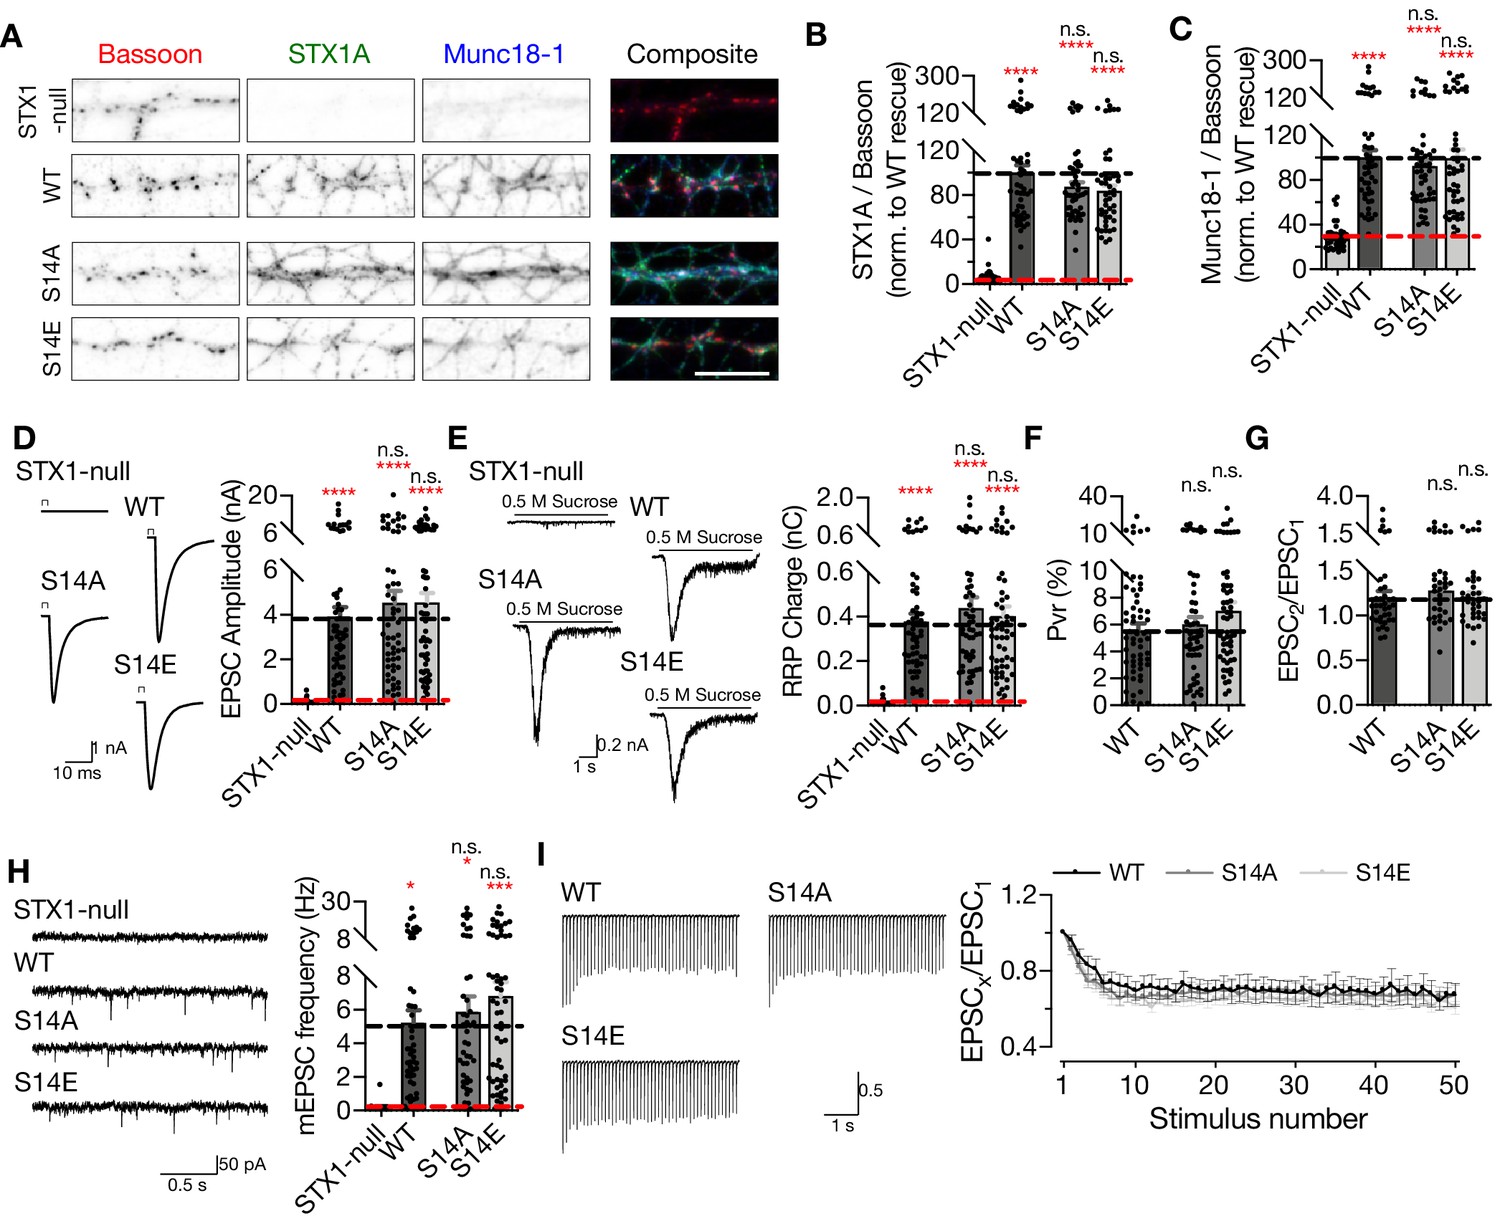
Phosphorylation of S14 of STX1 has no effect on synaptic transmission.
(A) Example images of immunofluorescence labeling for Bassoon, STX1A, and Munc18-1 shown as red, green, and blue, respectively, in the corresponding composite pseudocolored images obtained from high-density cultures of STX1-null, STX1AWT, STX1AS14A, or STX1AS14E neurons. Scale bar: 10 µm (B, C) Quantification of the immunofluorescence intensity of STX1A and Munc18-1 as normalized to the immunofluorescence intensity of Bassoon in the same ROIs as shown in (A). The values were then normalized to the values obtained from STX1-null neurons expressing STX1AWT. (D) Example traces (left) and quantification of the amplitude (right) of EPSCs obtained from hippocampal autaptic STX1-null neurons either not rescued or rescued STX1AWT, or STX1BS14A, or STX1AS14E. (E) Example traces (left) and quantification of the charge transfer (right) of sucrose-elicited readily releasable pools (RRPs). (F) Quantification of probability of vesicular release (Pvr) determined as the percentage of the RRP released upon one action potential (AP). (G) Quantification of paired-pulse ratio (PPR) of EPSCs elicited at 40 Hz. (H) Example traces (left) and quantification of the frequency (right) of mEPSCs recorded at –70 mV. The example traces were filtered at 1 kHz. (I) Example traces (left) and quantification (right) of STP determined by high-frequency stimulation at 10 Hz and normalized to the EPSC1 from the same neuron. Data information: the artifacts are blanked in In (D) and (I). In (B–H), data points represent single observations, the bars represent the mean ± SEM. In (I), data points represent mean ± SEM. Red and black annotations (stars and n.s.) on the graphs show the significance comparisons to STX1-null and to STX1AWT rescue, respectively (nonparametric Kruskal–Wallis test followed by Dunn’s post hoc test, *p≤0.05, ***p≤0.001, ****p≤0.0001). The numerical values are summarized in Figure 3—figure supplement 1—source data 1.
-
Figure 3—figure supplement 1—source data 1
Quantification of lentiviral expression of phosphonull and phosphomimetic STX1A mutants and the consequent neurotransmitter release properties.
- https://cdn.elifesciences.org/articles/69498/elife-69498-fig3-figsupp1-data1-v4.xlsx
Figure 3—figure supplement 2
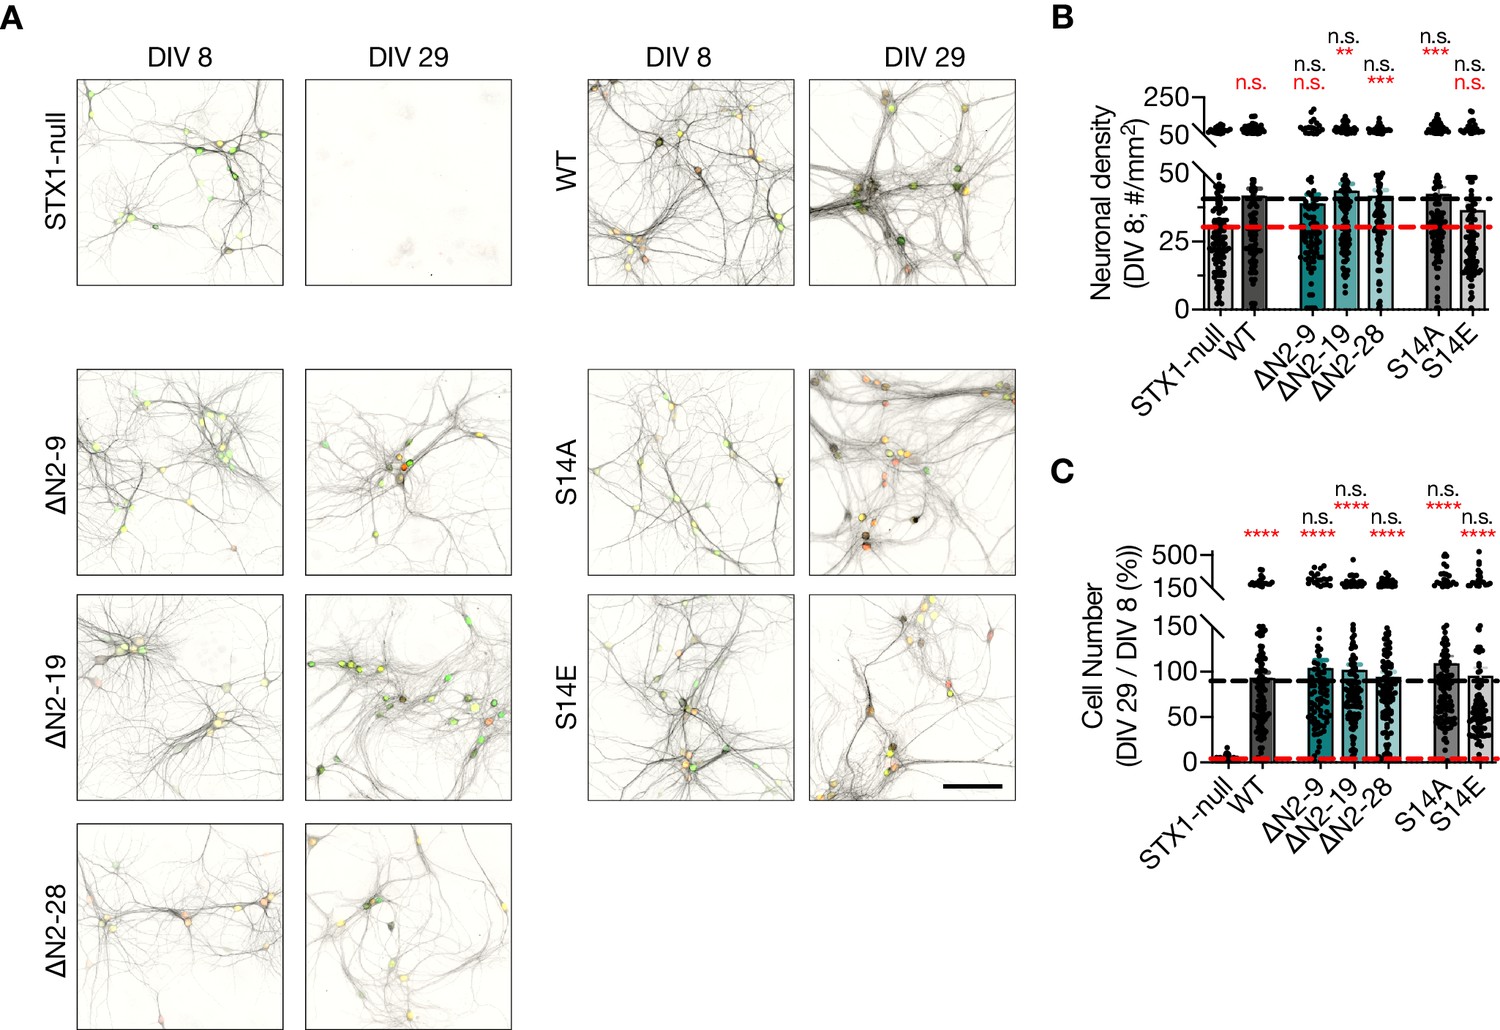
Modifications of STX1’s N-peptide either by deletions or phosphorylation does not compromise neuronal viability.
(A) Example images of high-density cultures of STX1-null hippocampal neurons at DIV 8 and 29 represented with immunofluorescent labeling of microtubule associated protein 2 (MAP2). Red and green nuclei serve as a marker for NLS-RFP-P2A-Cre recombinase expression and for NLS-GFP-P2A-STX1A (either WT or mutants), respectively. Scale bar: 50 µm. (B) Quantification of neuronal density at DIV 8 in STX1-null hippocampal neurons either not rescued or rescued with STX1AWT or STX1A∆N2-9, STX1A∆N2-19, STX1A∆N2-28, STX1AS14A, or STX1AS14E. (B) Quantification of the percentage of the surviving neurons at DIV 29 as normalized to the neuronal density at DIV 8. Data information: in (B, C), data points represent single observations, the bars represent the mean ± SEM. Red and black annotations (stars and n.s.) on the graphs show the significance comparisons to STX1-null and to STX1AWT rescue, respectively (nonparametric Kruskal–Wallis test followed by Dunn’s post hoc test, **p≤0.01, ***p≤0.001, ****p≤0.0001). The numerical values are summarized in Figure 3—figure supplement 2—source data 1.
-
Figure 3—figure supplement 2—source data 1
Quantification of neuronal density of STX1AΔΝ and phosphorylation mutant neurons in comparison to STX1AWT and STX1-null neurons at DIV 8 and DIV 29.
- https://cdn.elifesciences.org/articles/69498/elife-69498-fig3-figsupp2-data1-v4.xlsx
Figure 4 with 3 supplements

‘Opening’ of STX1A in combination with the deletion of its entire N-terminal stretch does not impair neurotransmitter release.
(A) Example images of immunofluorescence labeling for Bassoon, STX1A, and Munc18-1 shown as red, green, and blue, respectively, in the corresponding composite pseudocolored images obtained from high-density cultures of STX1-null hippocampal neurons either not rescued or rescued with STX1AWT, STX1ALEOpen, STX1ALEOpen + ∆N2-9, STX1ALEOpen + ∆N2-19, or STX1ALEOpen + ∆N2-28. Scale bar: 10 µm (B, C) Quantification of the immunofluorescence intensity of STX1A and Munc18-1 as normalized to the immunofluorescence intensity of Bassoon in the same ROIs as shown in (A). The values were then normalized to the values obtained from STX1AWT neurons. (D) Example traces (left) and quantification of the amplitude (right) of EPSCs obtained from hippocampal autaptic STX1AWT, STX1ALEOpen, STX1ALEOpen + ∆N2-9, STX1ALEOpen + ∆N2-19, or STX1ALEOpen + ∆N2-28 neurons. (E) Example traces (left) and quantification of the charge transfer (right) of sucrose-elicited readily releasable pools (RRPs) obtained from the same neurons as in (D). (F) Quantification of probability of vesicular release (Pvr) determined as the percentage of the RRP released upon one action potential (AP). (G) Example traces (left) and quantification (right) of paired-pulse ratio (PPR) measured at 40 Hz. (H) Example traces (left) and quantification of the frequency (right) of mEPSCs. (I) Quantification of mEPSC rate as spontaneous release of one unit of RRP. (I) Quantification of mEPSC rate as spontaneous release of one unit of RRP.
-
Figure 4—source data 1
Quantification of lentiviral expression of STX1ALEOpen and STX1ALEOpen + ΔΝ mutants in STX1-null neurons and the consequent neurotransmitter release properties.
- https://cdn.elifesciences.org/articles/69498/elife-69498-fig4-data1-v4.xlsx
Figure 4—figure supplement 1
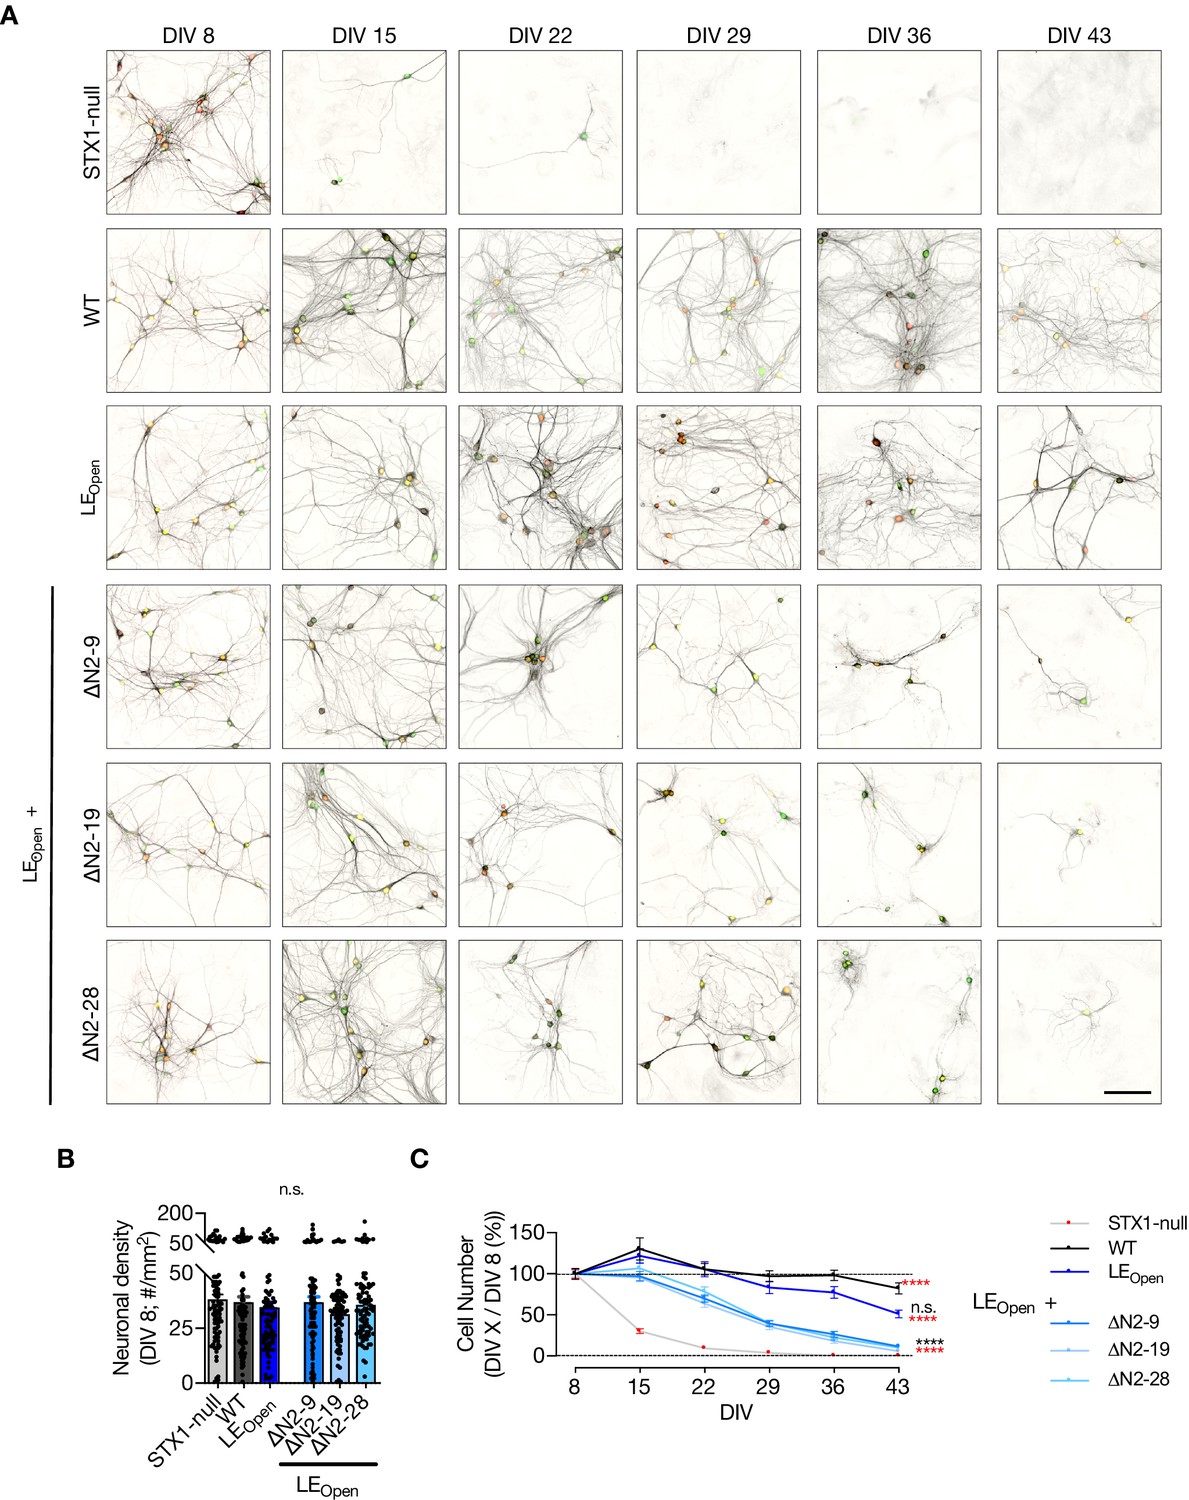
Interruption of both Munc18-1 binding modes of STX1 ultimately leads to neuronal death.
(A) Example images of high-density cultures of STX1-null hippocampal neurons at DIV 8, 15, 22, 29, 36, and 43 represented with immunofluorescent labeling of microtubule associated protein 2 (MAP2). Red and green nuclei serve as a marker for NLS-RFP-P2A-Cre recombinase expression and for NLS-GFP-P2A-STX1A (either WT or mutants), respectively. 50 µm. (A) Quantification of neuronal density at DIV 8 in STX1-null hippocampal neurons either not rescued or rescued with STX1AWT, STX1ALEOpen, STX1ALEOpen + ∆N2-9, STX1ALEOpen + ∆N2-19, or STX1ALEOpen + ∆N2-28. Scale bar: 10 µm (B) Quantification of the percentage of the surviving neurons at DIV 8, 15, 22, 29, 36, and 43 as normalized to the neuronal density at DIV 8. Data information: in (B), data points represent single observations, the bars represent the mean ± SEM. In (C), data points represent the mean ± SEM. Red and black annotations (stars and n.s.) on the graphs show the significance comparisons to STX1-null and to STX1AWT rescue, respectively (nonparametric Kruskal–Wallis test followed by Dunn’s post hoc test, *p≤0.05, **p≤0.01, ***p≤0.001, ****p≤0.0001). The number of observations and cultures and statistical data are summarized in Figure 4—source data 1. The numerical values are summarized in Figure 4—figure supplement 1—source data 1.
-
Figure 4—figure supplement 1—source data 1
Quantification of neuronal density of neurons expressing STX1ALEOpen or STX1ALEOpen + ΔΝ mutants at different time intervals.
- https://cdn.elifesciences.org/articles/69498/elife-69498-fig4-figsupp1-data1-v4.xlsx
Figure 4—figure supplement 2
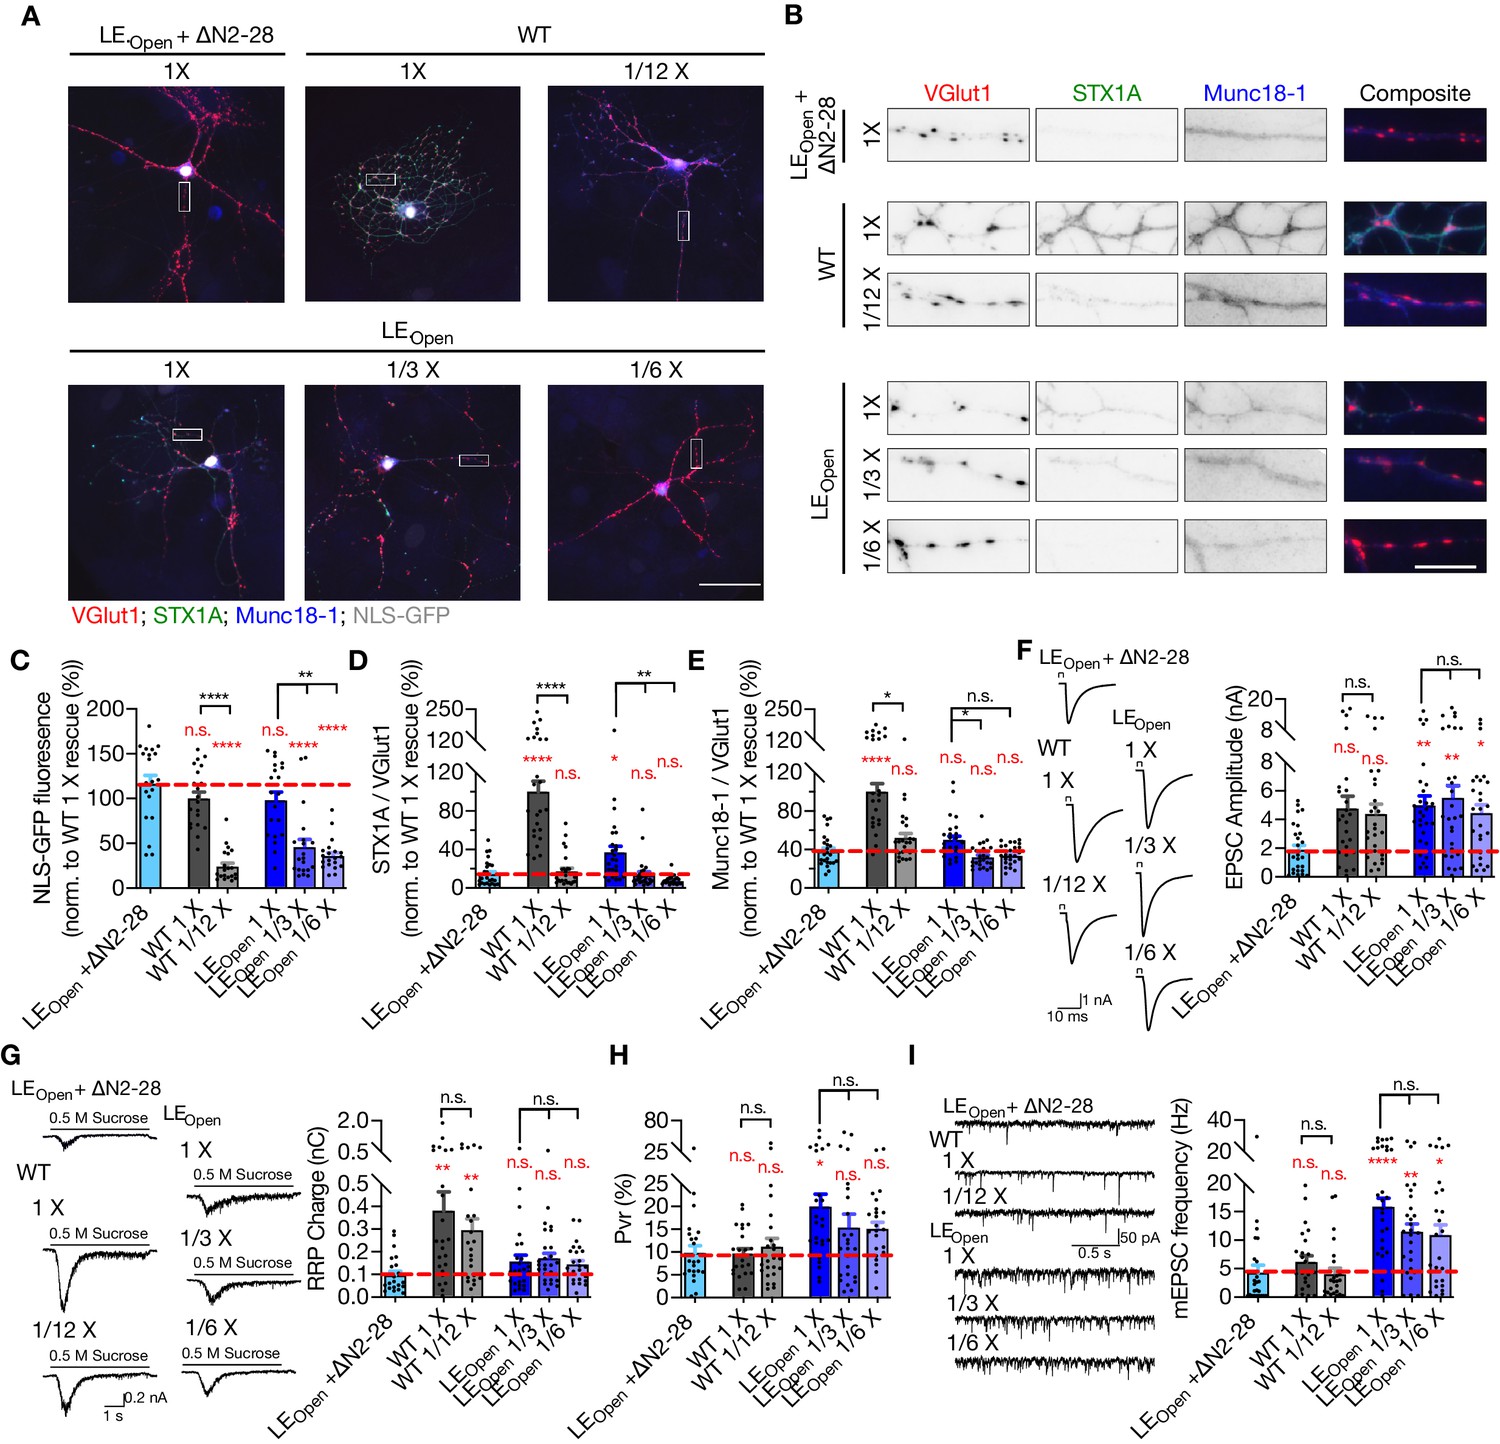
Reducing the expression levels of STX1AWT or STX1ALEOpen does not alter their synaptic release properties.
(A) Example images of immunofluorescence labeling for VGlut1, STX1A, Munc18-1, and NLS-GFP shown as red, green, blue, and gray, respectively, in autaptic STX1-null hippocampal neurons rescued with 1× viral volume of STX1ALEOpen + ∆N2-28 as reference or with different viral volumes of either STX1AWT, or STX1ALEOpen as. Scale bar: 50 µm. (A) Higher magnification images of the areas highlighted in the images in (A). VGlut1, STX1A, and Munc18-1 are shown as red, green, and blue, respectively, in the corresponding composite image. Scale bar: 10 µm. (B) Quantification of the fluorescence intensity of NLS-GFP from the neurons as in (A) as normalized to that of STX1AWT 1× rescue. (C) Quantification of the immunofluorescence intensity of STX1A as normalized to the immunofluorescence intensity of Bassoon in the same ROIs as shown in (B). The values were then normalized to the values obtained from STX1AWT 1× neurons. (D) Quantification of the immunofluorescence intensity of Munc18-1 as normalized to the immunofluorescence intensity of Bassoon in the same ROIs as shown in (B). The values were then normalized to the values obtained from STX1-null neurons expressing STX1AWT 1× neurons. Example traces (left) and quantification of the amplitude (right) of EPSCs obtained from hippocampal autaptic STX1-null neurons rescued with 1× viral volume of STX1ALEOpen + ∆N2-28 as reference or with different viral volumes of either STX1AWT, or STX1ALEOpen. The artifacts are blanked in the example traces. (E) Example traces (left) and quantification of the charge transfer (right) of sucrose-elicited readily releasable pools (RRPs) obtained from the same neurons as in (F), (G) Quantification of probability of vesicular release (Pvr) determined as the percentage of the RRP released upon one action potential. (H) Example traces (left) and quantification of the frequency (right) of mEPSCs recorded at –70 mV. The example traces were filtered at 1 kHz. Data information: in (C–I), data points represent single observations, the bars represent the mean ± SEM. Red annotations (stars and n.s.) on the graphs show the significance comparisons to STX1ALEOpen + ∆N2-28 1× rescue. Black annotations (stars and n.s.) on the bars show the significance comparisons for rescues using different viral volume either for STX1AWT or STX1ALEOpen. (nonparametric Kruskal–Wallis test followed by Dunn’s post hoc test, *p≤0.05, **p≤0.01, ***p≤0.001, ****p≤0.0001). The numerical values are summarized in Figure 4—figure supplement 2—source data 1.
-
Figure 4—figure supplement 2—source data 1
Quantification of the effects lentiviral downtitration of STX1AWT and STX1ALEOpen on STX1A's and Munc18-1's expression levels and on neurotransmitter release parameters.
- https://cdn.elifesciences.org/articles/69498/elife-69498-fig4-figsupp2-data1-v4.xlsx
Figure 4—figure supplement 3
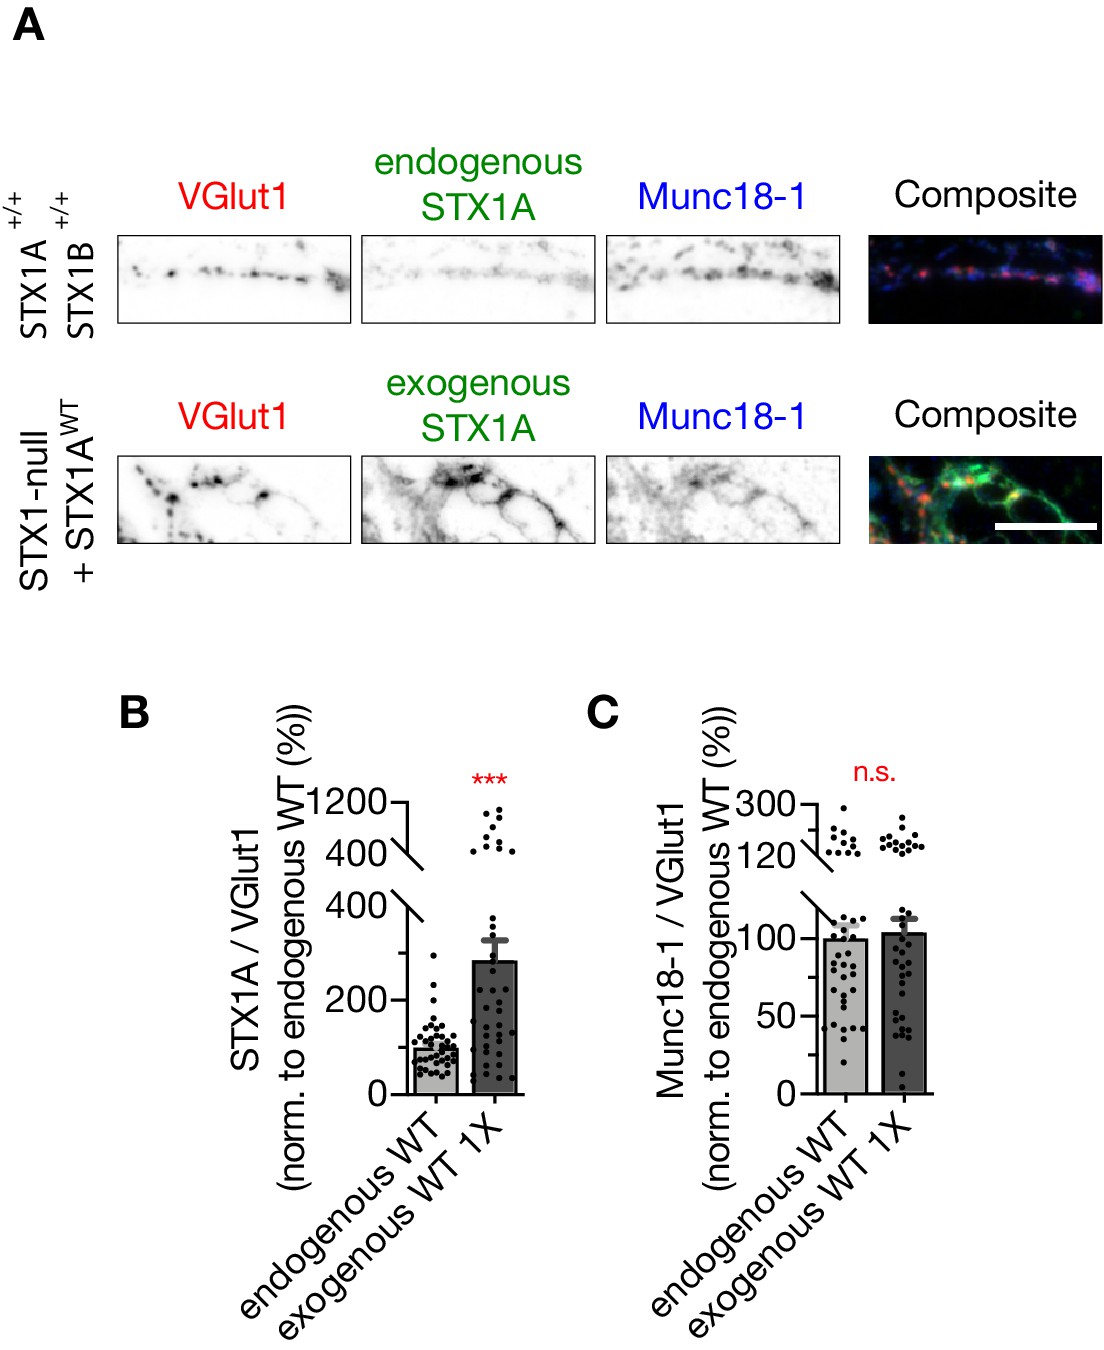
Exogenous expression of STX1A using 1× volume of lentiviral particles is approximately threefold higher than endogenous STX1A expression.
(A) Example images of immunofluorescence labeling for VGlut1, STX1A, and Munc18-1. Scale bar: 10 µm. (B) Quantification of the immunofluorescence intensity of STX1A as normalized to the immunofluorescence intensity of Bassoon in the same ROIs as shown in (A). The values were then normalized to the values obtained from WT neurons. (C) Quantification of the immunofluorescence intensity of Munc18-1 as normalized to the immunofluorescence intensity of Bassoon in the same ROIs as shown in (A). The values were then normalized to the values obtained from WT neurons. Data information: in (B, C), data points represent single observations, the bars represent the mean ± SEM. Red annotations (stars and n.s.) on the graphs show the significance comparisons of endogenous STX1A vs. exogenous STX1A using 1× viral volume. (Mann–Whitney test, ***p≤0.001). The numerical values are summarized in Figure 4—figure supplement 3—source data 1.
-
Figure 4—figure supplement 3—source data 1
Comparison of the lentiviral expression of STX1A with its endogenous expression.
- https://cdn.elifesciences.org/articles/69498/elife-69498-fig4-figsupp3-data1-v4.xlsx
Figure 5 with 1 supplement

‘Opening’ of STX1A in combination with the deletion of its entire N-terminal stretch reduces the number of docked synaptic vesicles (Svs).
(A) Example high-pressure freezing fixation combined with electron microscopy (HPF-EM) images of nerve terminals from high-density cultures of STX1AWT, STX1A∆N2-28, STX1ALEOpen, and STX1ALEOpen + ∆N2-28 Neurons. (B–D) Quantification of active zone (AZ) length, number of SVs within 200 nm distance from AZ, and number of docked SVs. (E) Correlation of the number of docked SVs obtained by HPF-EM to the size of readily releasable pool (RRP) obtained by electrophysiological recordings. (F–H) SV distribution of STX1A∆N2-28, STX1ALEOpen, and STX1ALEOpen + ∆N2-28 neurons compared to that of STX1AWT neurons. Data information: in (B–D), data points represent single observations, the bars represent the mean ± SEM. In (E–H), data points represent mean ± SEM. Black annotations on the graphs show the significance comparisons to STX1AWT rescue (nonparametric Kruskal–Wallis test followed by Dunn’s post hoc test in B–D, multiple t-tests in F–H *p≤0.05, **p≤0.01, ***p≤0.001). The numerical values are summarized in Figure 5—source data 1.
-
Figure 5—source data 1
Quantification of the ultrastructural synaptic properties of STX1AWT, STX1AΔΝ2-28, STX1ALEOpen, and STX1ALEOpen + ΔΝ2-28 neurons.
- https://cdn.elifesciences.org/articles/69498/elife-69498-fig5-data1-v4.xlsx
Figure 5—figure supplement 1
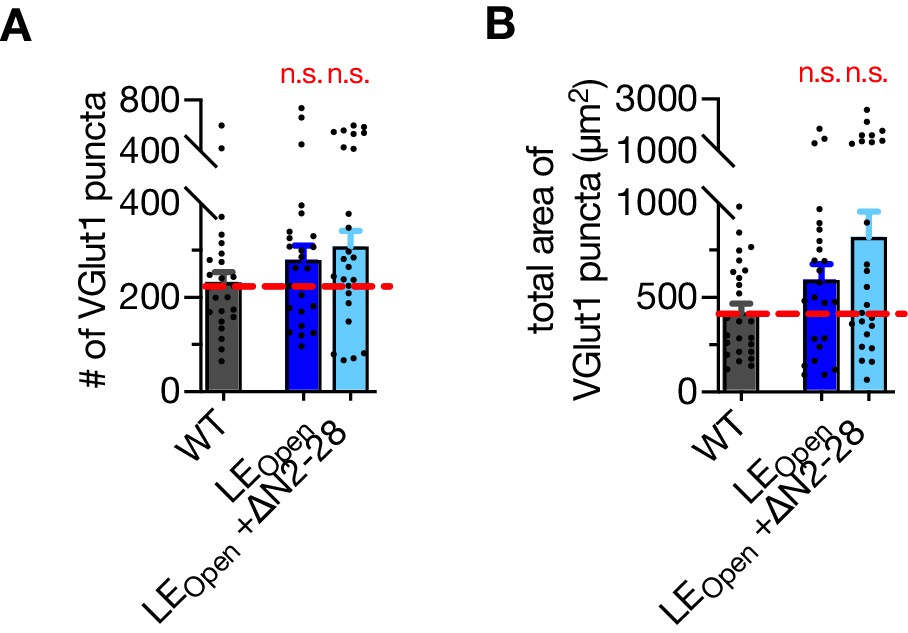
Synapse number and area are not affected neither by LEOpen mutation nor by LEOpen + ΔN mutation.
(A) Quantification of VGlut1-positive puncta using the images exemplified in Figure 4—figure supplement 2 and obtained from STX1AWT, STX1ALEOpen, and STX1ALEOpen + ∆N2-28 neurons. (B) Quantification of the total area of VGlut1-positive puncta using the images exemplified in Figure 4—figure supplement 2 and obtained from STX1AWT, STX1ALEOpen and STX1ALEOpen + ∆N2-28 neurons. Data information: data points represent single observations; the bars represent the mean ± SEM. Red annotations (n.s.) on the graphs show the significance comparisons to comparisons to STX1AWT (nonparametric Kruskal–Wallis test followed by Dunn’s post hoc test). The numerical values are summarized in Figure 5—figure supplement 1—source data 1.
-
Figure 5—figure supplement 1—source data 1
Quantification of the number the total area of VGlut1 positive puncta in autaptic neurons expressing STX1AWT, STX1ALEOpen, or STX1ALEOpen + ΔΝ2-28.
- https://cdn.elifesciences.org/articles/69498/elife-69498-fig5-figsupp1-data1-v4.xlsx
Figure 6 with 2 supplements
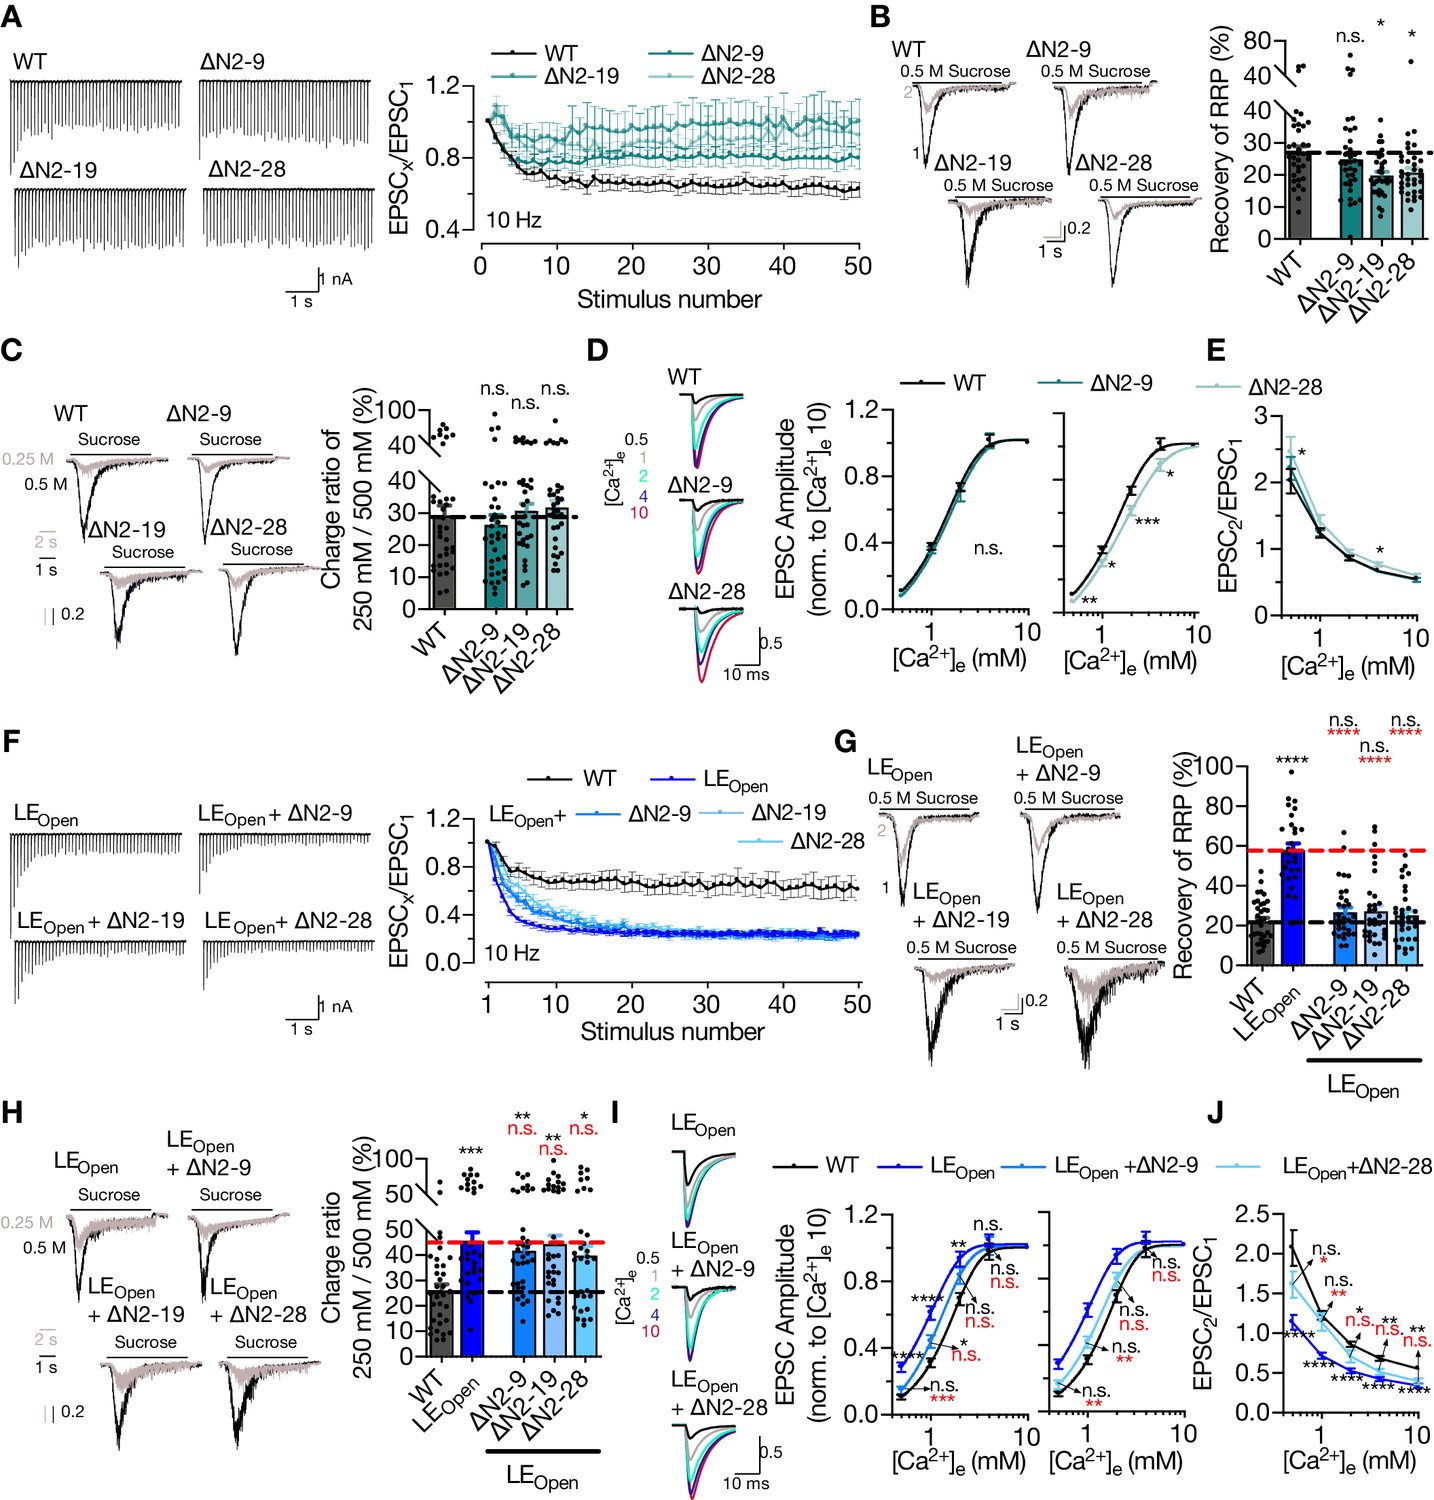
STX1A’s N-peptide has a modulatory function in short-term plasticity and Ca2+-sensitivity of synaptic transmission.
(A) Example traces (left) and quantification (right) of STP measured by 50 stimulations at 10 Hz from STX1AWT, STX1A∆N2-9, STX1A∆N2-19, or STX1A∆N2-28 neurons. The traces show the absolute values, whereas the quantification shows normalized EPSC to EPSC1. (B) Example traces (left) and quantification (right) of the recovery of readily releasable pool (RRP) determined as the fraction of RRP measured at a second pulse of 500 mM sucrose solution after 2 s of initial depletion from STX1AWT, STX1A∆N2-9, STX1A∆N2-19, or STX1A∆N2-28 neurons. (C) Example traces (left) and quantification (right) of the ratio of the charge transfer triggered by 250 mM sucrose over that of 500 mM sucrose as a read-out of fusogenicity of the synaptic vesicles (SVs). (D) Example traces (left) and quantification (right) of Ca2+-sensitivity as measured by the ratio of EPSC amplitudes at [Ca2+]e of 0.5, 1, 2, 4, and 10 mM recorded from STX1AWT, STX1A∆N2-9, or STX1A∆N2-28 neurons. The responses were normalized to the response at [Ca2+]e of 10 mM. (E) Paired-pulse ratio (PPR) of EPSC amplitudes at [Ca2+]e of 0.5, 1, 2, 4, and 10 mM recorded at 40 Hz. (F) Example traces (left) and quantification (right) of STP measured by 50 stimulations at 10 Hz from STX1AWT, STX1ALEOpen, STX1ALEOpen + ∆N2-9, STX1ALEOpen + ∆N2-19, or STX1ALEOpen + ∆N2-28 neurons. The traces show the absolute values, whereas the quantification shows normalized EPSC to EPSC1. (G) Example traces (left) and quantification (right) of the recovery of RRP determined as the fraction of RRP measured at a second pulse of 500 mM sucrose solution after 2 s of initial depletion from STX1AWT, STX1ALEOpen, STX1ALEOpen + ∆N2-9, STX1ALEOpen + ∆N2-19, or STX1ALEOpen + ∆N2-28 neurons. (H) Example traces (left) and quantification (right) of the ratio of the charge transfer triggered by 250 mM sucrose over that of 500 mM sucrose as a read-out of fusogenicity of the SVs. (I) Example traces (left) and quantification (right) of Ca2+-sensitivity recorded from STX1AWT, STX1ALEOpen, STX1ALEOpen + ∆N2-9, or STX1ALEOpen + ∆N2-28 neurons. The responses were normalized to the response at [Ca2+]e of 10 mM. (J) PPR of EPSC amplitudes at [Ca2+]e of 0.5, 1, 2, 4, and 10 mM recorded at 40 Hz from STX1AWT, STX1ALEOpen, or STX1ALEOpen + ∆N2-28 neurons. Data information: the artifacts are blanked in example traces in (A, D, F, I). In (A, D, E, F, I, J), data points represent the mean ± SEM. In (B, C, G, H), data points represent single observations, the bars represent the mean ± SEM. Black and red annotations on the graphs show the significance comparisons to STX1AWT or STX1ALEOpen, respectively. (either nonparametric Kruskal–Wallis followed by Dunn’s post hoc test or one-way ANOVA followed by Holm–Sidak’s post hoc test was applied based on the normality of the data, *p≤0.05, **p≤0.01, ***p≤0.001, ****p≤0.0001). The numerical values are summarized in Figure 6—source data 1.
-
Figure 6—source data 1
Quantification of the STP, recovery of RRP, RRP fraction released by 250 mM sucrose solution application and Ca2+-sensitivity of the vesicles in neurons expressing STX1AWT, STX1AΔΝ- or STX1ALEOpen mutants.
- https://cdn.elifesciences.org/articles/69498/elife-69498-fig6-data1-v4.xlsx
Figure 6—figure supplement 1
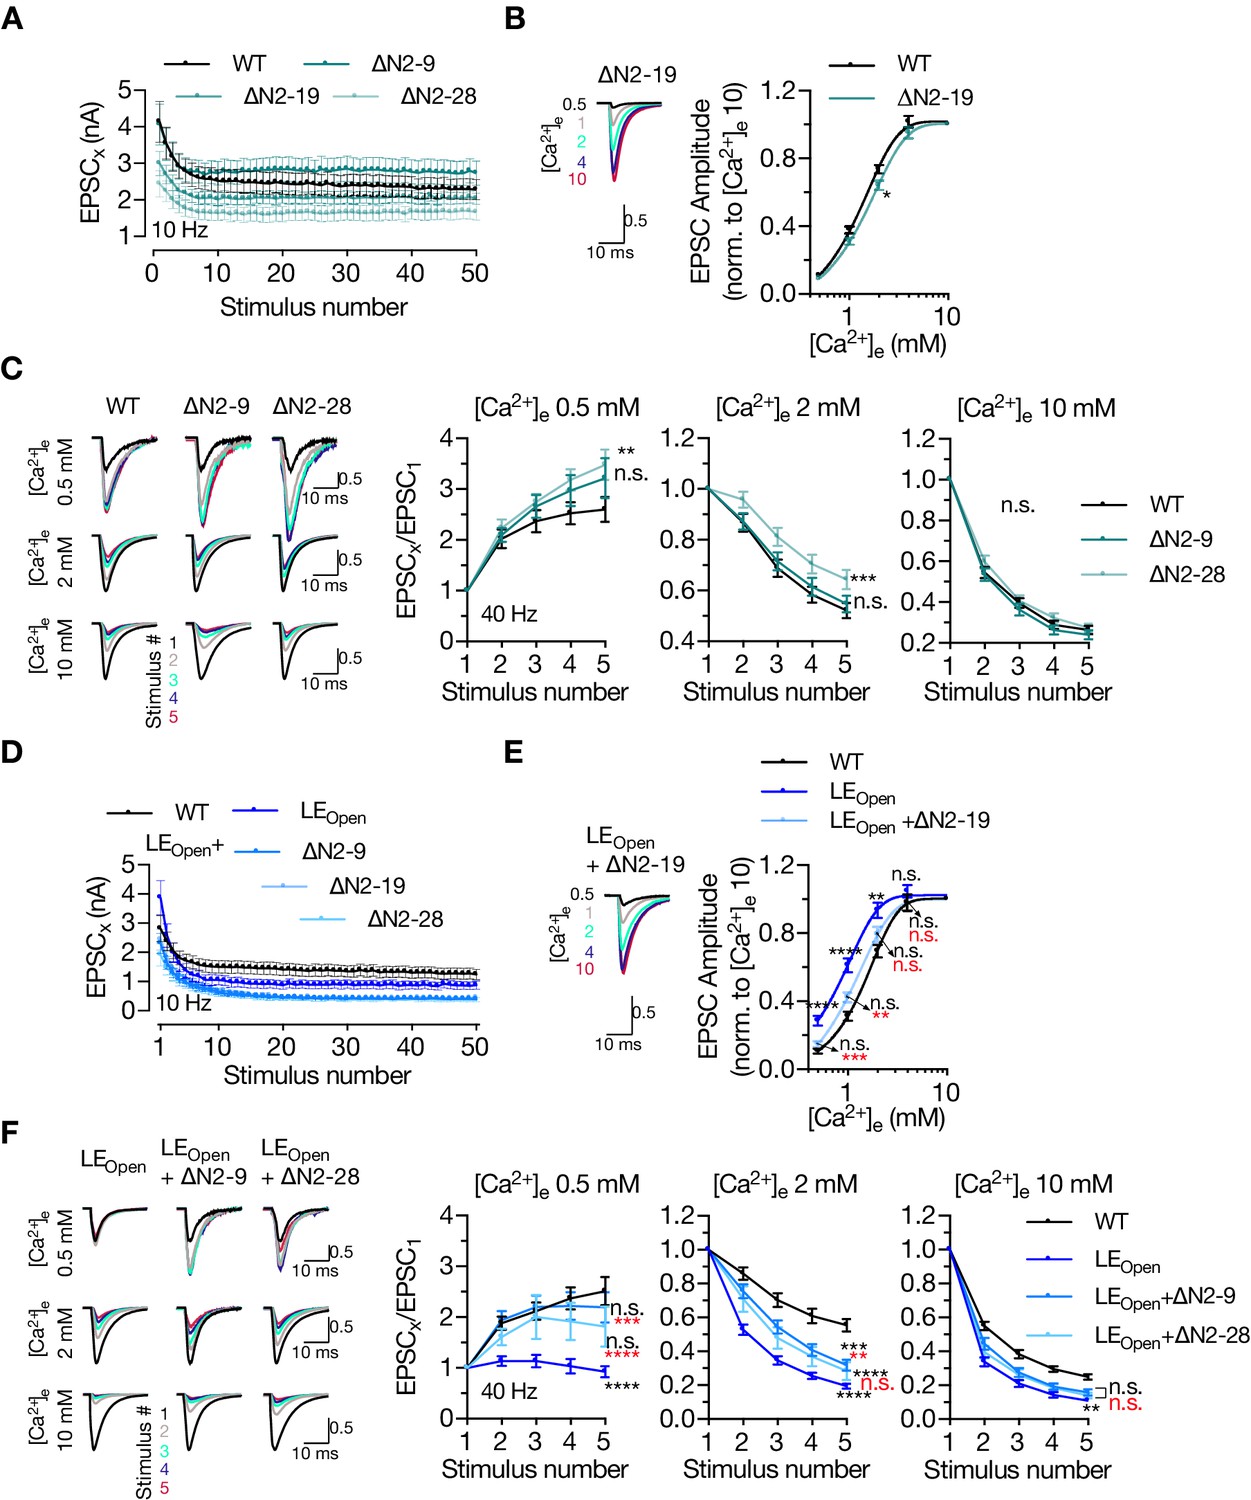
Deletion of N-peptide increases the paired-pulse ratio (PPR) both in closed and open conformation of STX1A in low extracellular Ca2+-concentration.
(A) Quantification of absolute values of 50 EPSCs elicited at 10 Hz recorded from neurons expressing either STX1AWT, STX1A∆N2-9, STX1A∆N2-19, or STX1A∆N2-28. (B) Example traces (left) and quantification (right) of Ca2+-sensitivity recorded from neurons expressing STX1A∆N2-19, compared to that of neurons expressing STX1AWT. The responses were normalized to the response at [Ca2+]e of 10 mM. The artifacts are blanked in the example traces. (C) Example traces (left) and quantifications (right) of STP measured at [Ca2+]e of either 0.5 mM, 2 mM, or 10 mM by five stimulations at 40 Hz from neurons expressing either STX1AWT, STX1A∆N2-9, or STX1A∆N2-28. The artifacts are blanked in the example traces. At every [Ca2+]e, the responses were normalized to the EPSC1. (D) Quantification of absolute values of 50 EPSCs elicited at 10 Hz recorded from neurons expressing either STX1AWT, STX1ALEOpen + ∆N2-9, STX1ALEOpen + ∆N2-19, or STX1ALEOpen + ∆N2-28. (E) Example traces (left) and quantification (right) of Ca2+-sensitivity recorded from neurons expressing STX1ALEOpen + ∆N2-19, compared to that of neurons expressing STX1AWT or STX1ALEOpen. The responses were normalized to the response at [Ca2+]e of 10 mM. The artifacts are blanked in the example traces. (F) Example traces (left) and quantifications (right) of STP measured at [Ca2+]e of either 0.5 mM, 2 mM, or 10 mM by five stimulations at 40 Hz from neurons expressing either STX1AWT, STX1ALEOpen + ∆N2-9, or STX1ALEOpen + ∆N2-28. The artifacts are blanked in the example traces. At every [Ca2+]e, the responses were normalized to the EPSC1. Data information: data points in all the graphs represent the mean ± SEM. Black and red annotations (stars and n.s.) on the graphs show the significance comparisons to STX1AWT and STX1ALEOpen rescue, respectively (nonparametric Kruskal–Wallis test followed by Dunn’s post hoc test, *p≤0.05, **p≤0.01, ***p≤0.001, ****p≤0.0001). The numerical values are summarized in Figure 6—figure supplement 1—source data 1.
-
Figure 6—figure supplement 1—source data 1
Quantification of the absolute values of EPSCs during STP and Ca2+-sensitivity of the vesicles in neurons expressing STX1AWT, STX1AΔΝ- or STX1ALEOpen mutants.
- https://cdn.elifesciences.org/articles/69498/elife-69498-fig6-figsupp1-data1-v4.xlsx
Figure 6—figure supplement 2
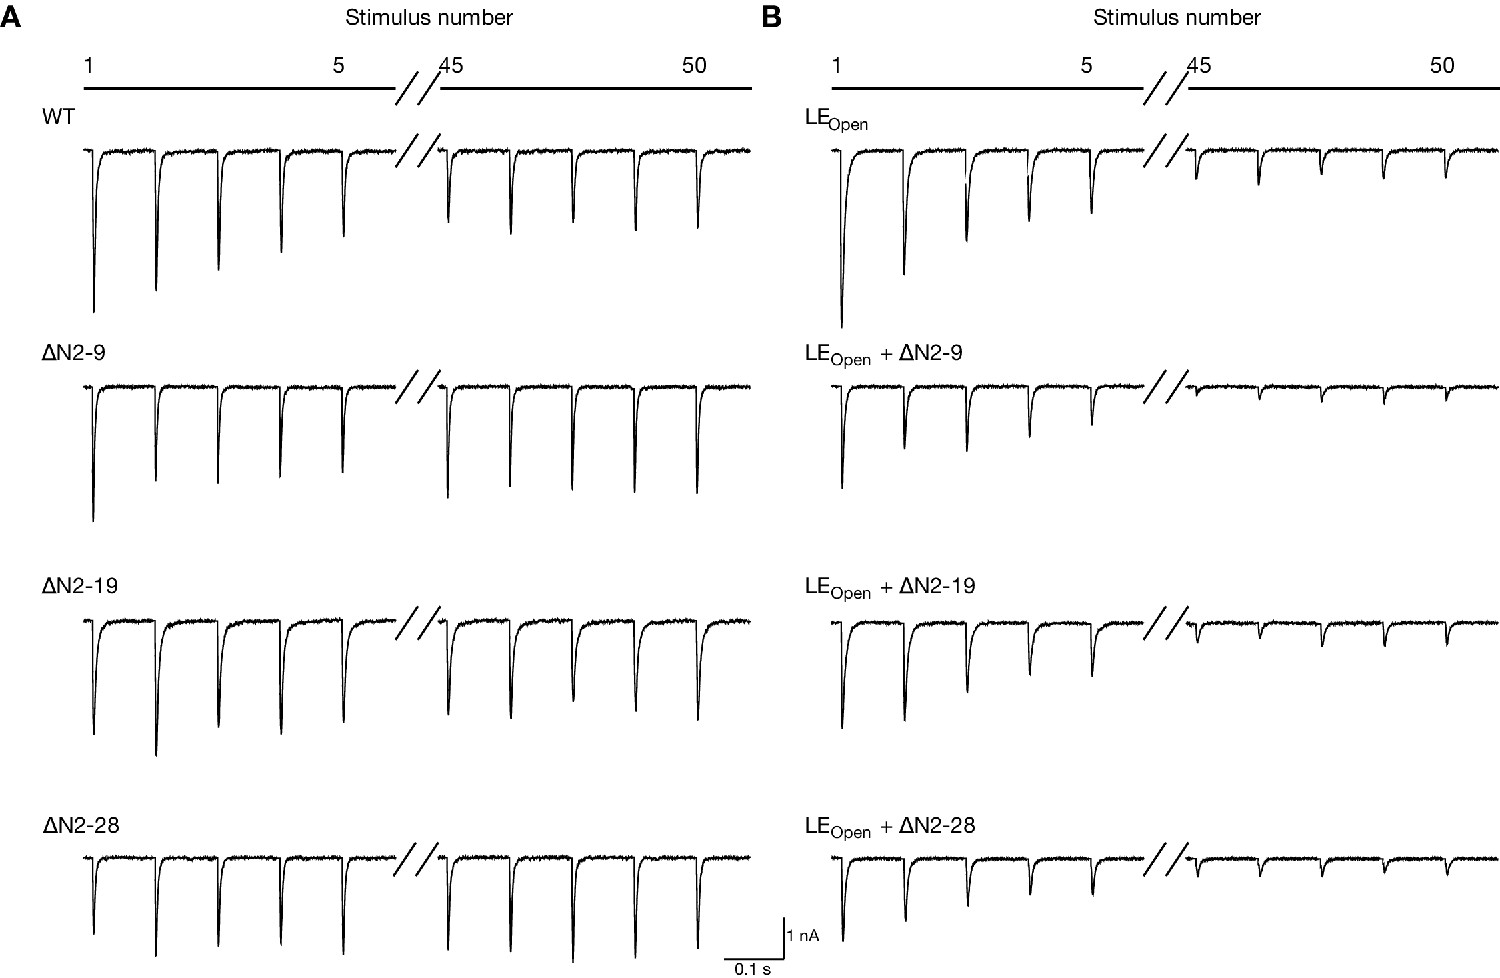
Zoomed-in example traces of STP.
(A) Zoomed-in example traces of the first and last five EPSCs recorded by 50 stimulations at 10 Hz from STX1AWT, STX1A∆N2-9, STX1A∆N2-19, or STX1A∆N2-28 neurons. The traces show the absolute values. (B) Zoomed-in example traces of the first and last five EPSCs recorded by 50 stimulations at 10 Hz from STX1ALEOpen, STX1ALEOpen + ∆N2-9, STX1ALEOpen + ∆N2-19, or STX1ALEOpen + ∆N2-28 neurons. The traces show the absolute values.
Figure 7 with 1 supplement
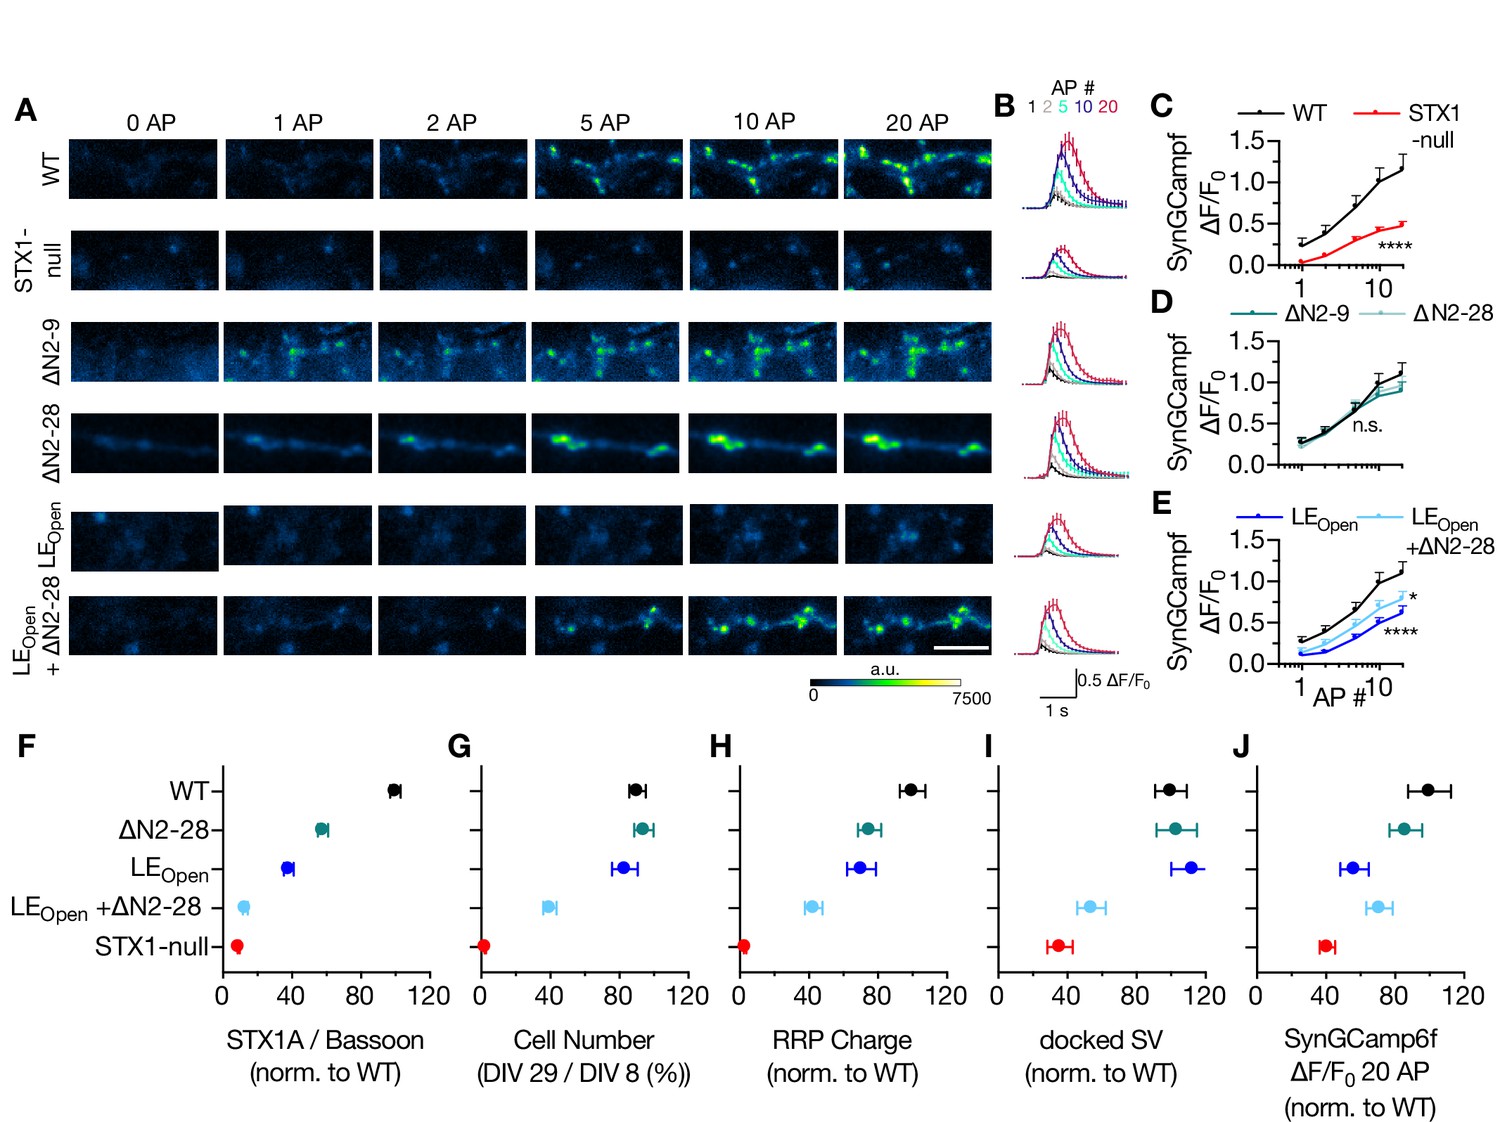
Ca2+-influx is reduced in STX1-null and in STX1LEOpen neurons.
(A, B) Example images and average of SynGCaMP6f fluorescence as (ΔF/F0) in STX1-null neurons either not rescued or rescued with STX1AWT, STX1A∆N2-9, STX1A∆N2-19, STX1ALEOpen, or STX1ALEOpen + ∆N2-28. The images were recorded at baseline, and at 1, 2, 5, 10, and 20 action potentials (APs). Scale bar: 10 µm (C–E) Maximum fluorescence changes (ΔF/F0) in STX1-null, STX1A∆N2-9, STX1A∆N2-28, STX1ALEOpen, or STX1ALEOpen + ∆N2-28 in comparison to that in STX1AWT neurons recorded at 1, 2, 5, 10, and 20 APs. (F–I-J) Summary plots of STX1A expression level, neuronal viability, readily releasable pool (RRP) charge, number of docked synaptic vesicles (SVs), and maximum SynGCaMP6f ΔF/F0 at 20 AP from STX1-null, STX1AWT, TX1A∆N2-28, STX1ALEOpen, and STX1ALEOpen + ∆N2-28. All the values were normalized to the one obtained from STX1AWT neurons in each individual culture. Data information: data points in all graphs represent the mean ± SEM. Black annotations on the graphs show the significance comparisons to STX1AWT (either unpaired t-test or Mann–Whitney test was applied in C based on the normality of the data; in D and E, nonparametric Kruskal–Wallis test followed by Dunn’s post hoc test was applied, *p≤0.05, ****p≤0.0001). The numerical values are summarized in Figure 7—source data 1.
-
Figure 7—source data 1
Quantification of the increase in SynGCaMP6f signal recorded at baseline or different numbers of APs in neurons expressing STX1AWT, STX1AΔΝ- or STX1ALEOpen mutants.
- https://cdn.elifesciences.org/articles/69498/elife-69498-fig7-data1-v4.xlsx
Figure 7—figure supplement 1
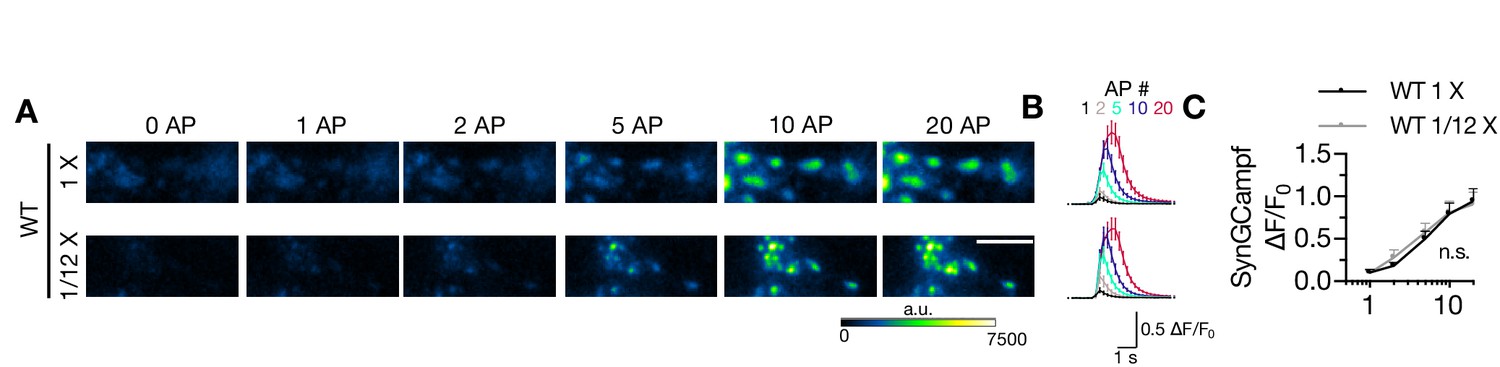
Reducing the expression level of STX1AWT does not alter Ca2+-influx.
(A, B) Example images and average of SynGCaMP6f fluorescence as (ΔF/F0) in STX1-null neurons either not rescued or rescued with 1× or 1/12× viral volume for STX1AWT. The images were recorded at baseline, and at 1, 2, 5, 10, and 20 action potentials (APs). Scale bar:10 µm. (C) Maximum fluorescence changes (ΔF/F0) in STX1AWT 1× and 1/12× neurons recorded at 1, 2, 5, 10, and 20 APs. Data information: data points in all graphs represent the mean ± SEM. Black annotation on the graph shows the significance comparison (Mann–Whitney test was applied). The numerical values are summarized in Figure 7—figure supplement 1—source data 1.
-
Figure 7—figure supplement 1—source data 1
Quantification of the increase in SynGCaMP6f signal recorded at baseline or different numbers of APs in neurons expressing STX1AWT at low level.
- https://cdn.elifesciences.org/articles/69498/elife-69498-fig7-figsupp1-data1-v4.xlsx
Figure 8
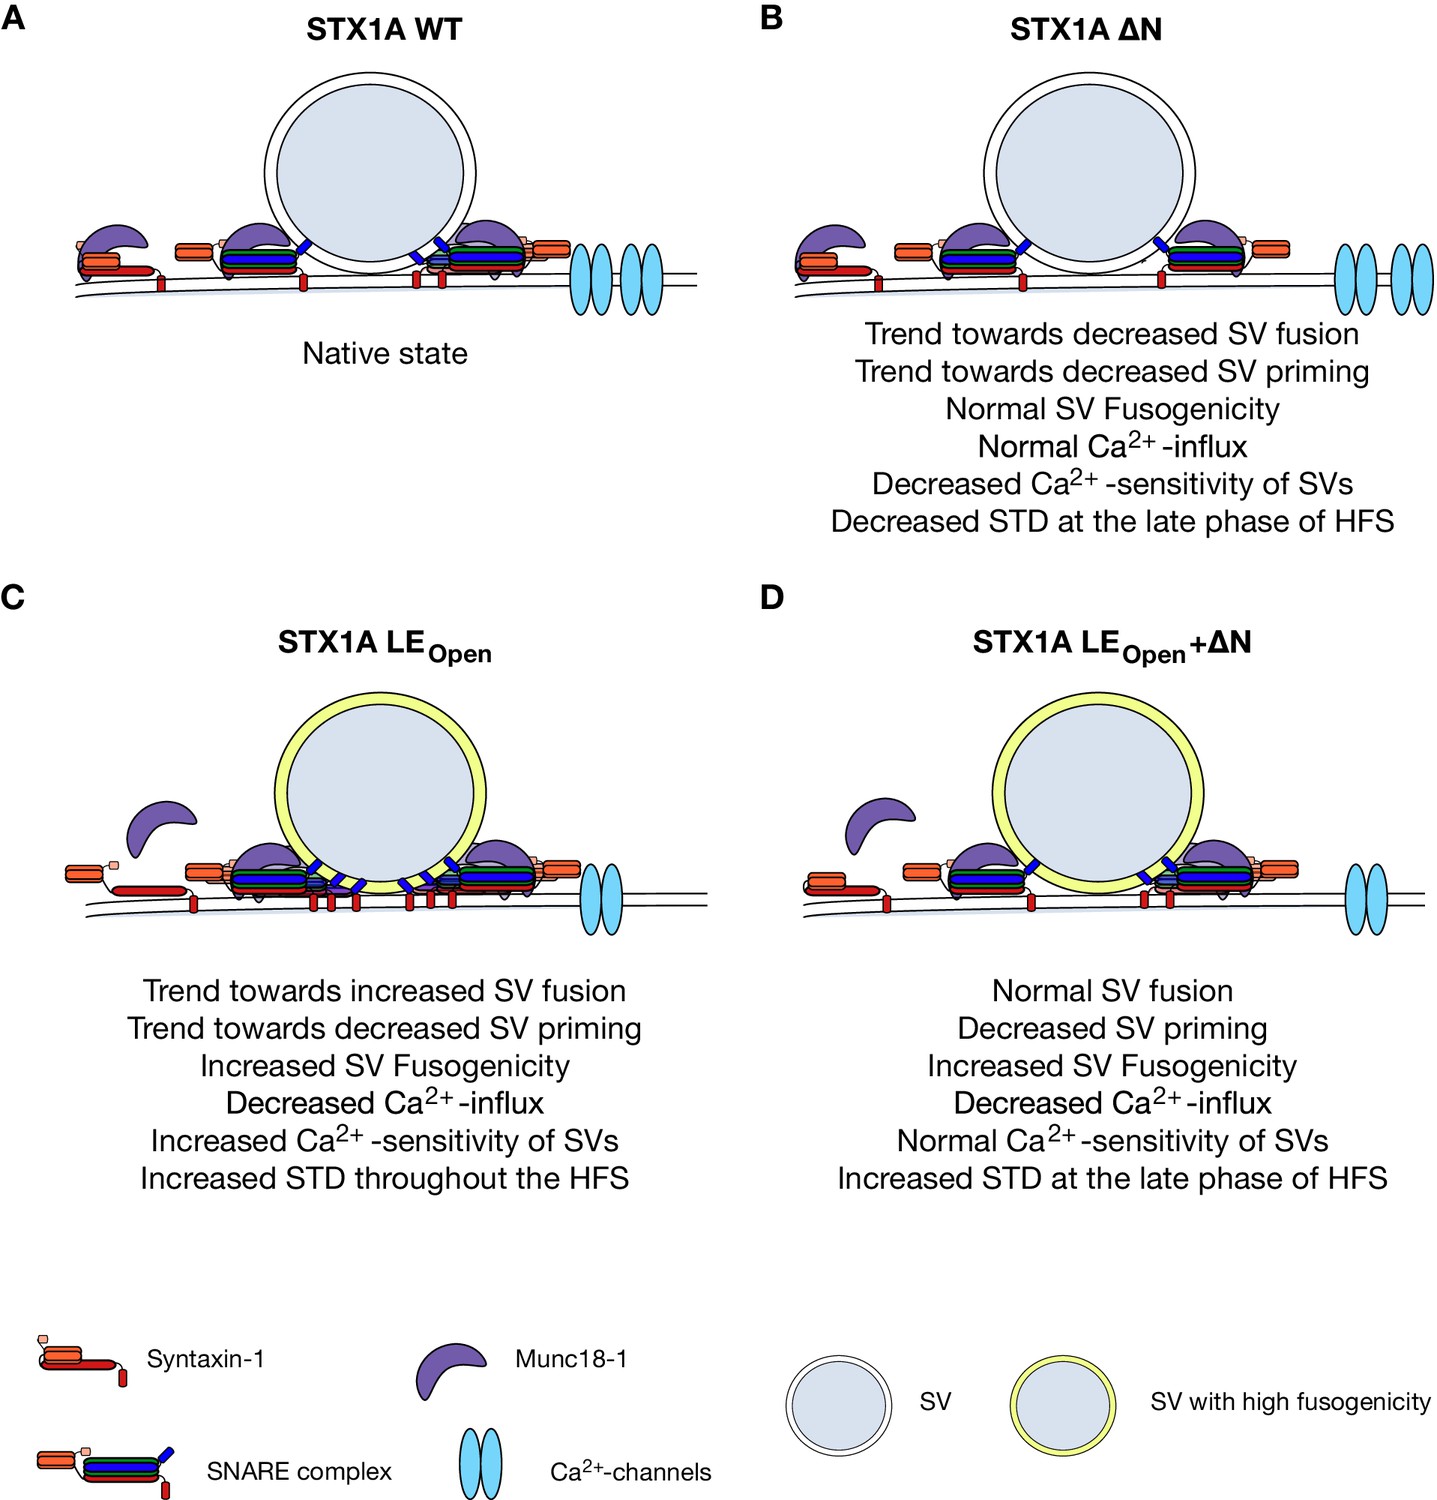
Speculative model of effects of N-peptide deletions and LEOpen mutation on vesicular release.
(A) Native state of STX1A. (B) N-peptide deletion of STX1A leads to a decrease in Ca2+-sensitivity of vesicular release and short-term depression (STD) upon 10 Hz stimulation potentially through increased distance of Ca2+-channel synaptic vesicle (SV) coupling. (C) LEOpen mutation on STX1A increases fusogenicity and Ca2+-sensitivity of SVs and thus leads to a high degree of STD. It also leads to reduced global Ca2+-influx. (D) SV fusion proceeds normal when LEOpen mutation is combined with N-peptide deletion. LEOpen mutation dictates SV fusogenicity and Ca2+-influx by increasing the former and decreasing the latter.
Additional files
Download links
A two-part list of links to download the article, or parts of the article, in various formats.
Downloads (link to download the article as PDF)
Open citations (links to open the citations from this article in various online reference manager services)
Cite this article (links to download the citations from this article in formats compatible with various reference manager tools)
Reexamination of N-terminal domains of syntaxin-1 in vesicle fusion from central murine synapses
eLife 10:e69498.
https://doi.org/10.7554/eLife.69498


