Characterization of the ABC methionine transporter from Neisseria meningitidis reveals that lipidated MetQ is required for interaction
- Division of Chemistry and Chemical Engineering, California Institute of Technology, United States
- Howard Hughes Medical Institute, California Institute of Technology, United States
Figures
Figure 1 with 1 supplement
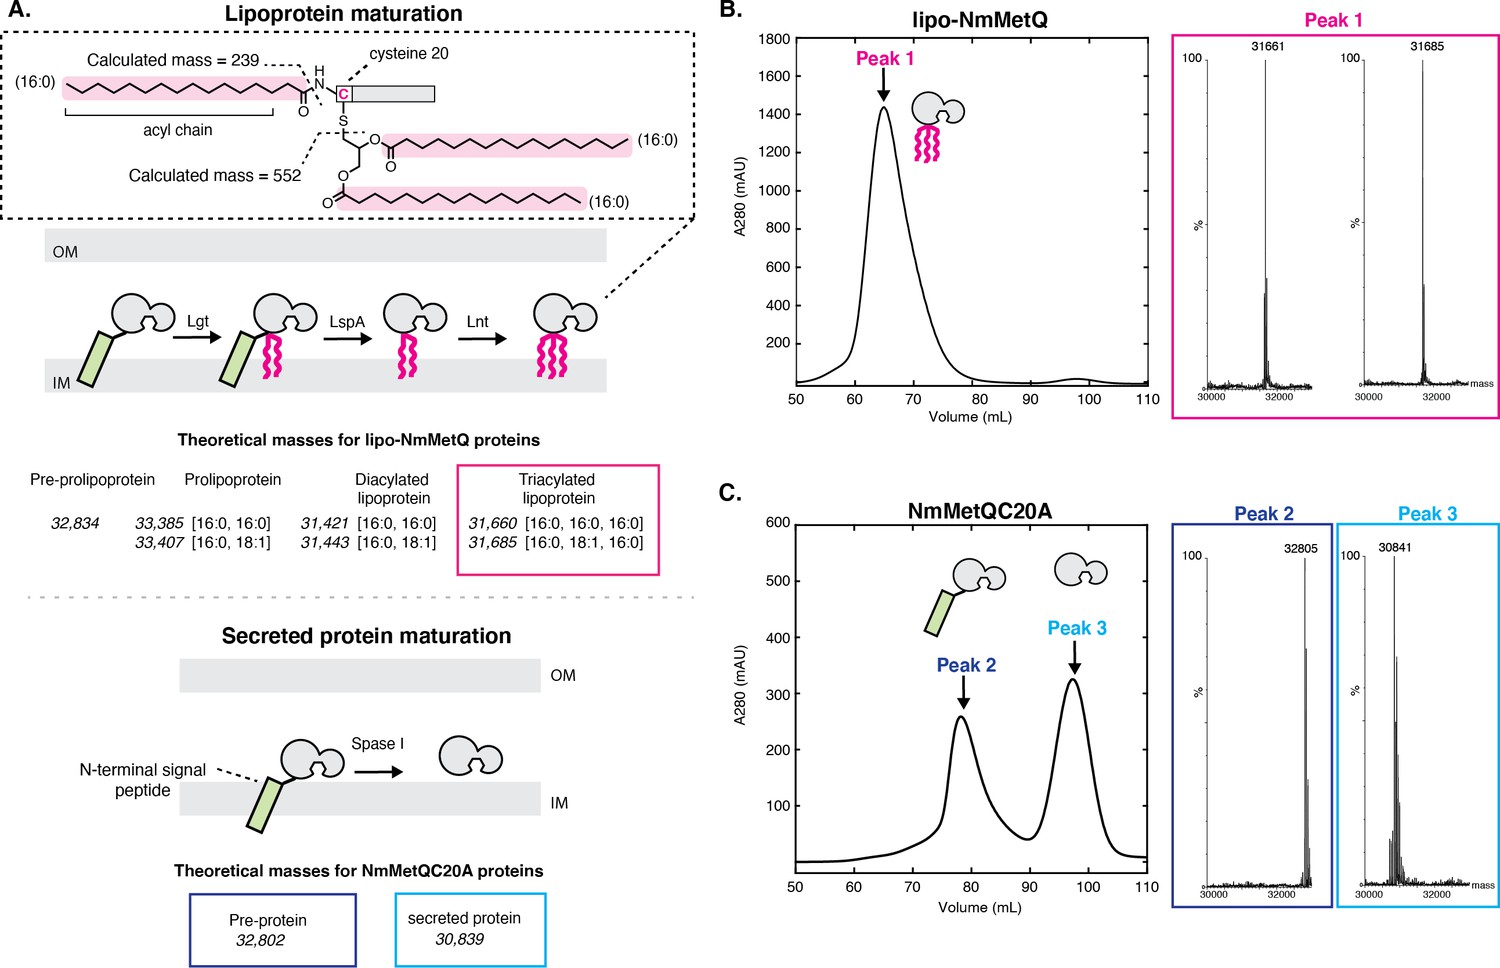
Mass spectrometry (MS) analysis of lipo-NmMetQ and NmMetQC20A proteins.
(A) (Top) Schematic of lipoprotein maturation pathway. Inset contains a schematic of a lipoprotein with acyl chain composition [16:0,16:0,16:0]. Acyl chains are grouped in a dotted line box and their average masses are calculated. Below the schematic are the theoretical masses for the lipo-NmMetQ proteins (in italics) assuming triacylation occurs via the canonical lipoprotein maturation pathway due to the sequential action of three enzymes (Lgt, LspA, and Lnt). The numbers in the brackets correspond to the total number of carbons and double bonds, respectively, present in the fatty acyl chains of the lipid. (Bottom) Schematic of various NmMetQC20A proteins with example theoretical average masses, shown in italics, assuming cleavage occurs between A19 and A20, possibly by signal peptidase I (SPase I). N-terminal signal peptides are represented by a green rectangle. (B) Characterization of lipo-NmMetQ. Size-exclusion chromatogram and mass spectra of peak 1. The molecular masses of the major species correspond within 1 Da to the predicted mass for two triacylated NmMetQ species, one with acyl chain composition [16:0, 16:0, 16:0] (31,661 Da) and the other with [16:0, 16:0, 18:1] (31,685 Da). (C) Characterization of NmMetQC20A. Size-exclusion chromatogram and mass spectra of the major species from peak 2 and peak 3. The molecular masses of the major species of peak 2 and 3 correspond to the pre-protein NmMetQ (32,802 Da) and secreted NmMetQ (30,839 Da), respectively. These measured masses are within 3 Da of the predicted masses for each species. Assigned NmMetQ species are depicted in cartoon form on the chromatograms.
Figure 1—figure supplement 1
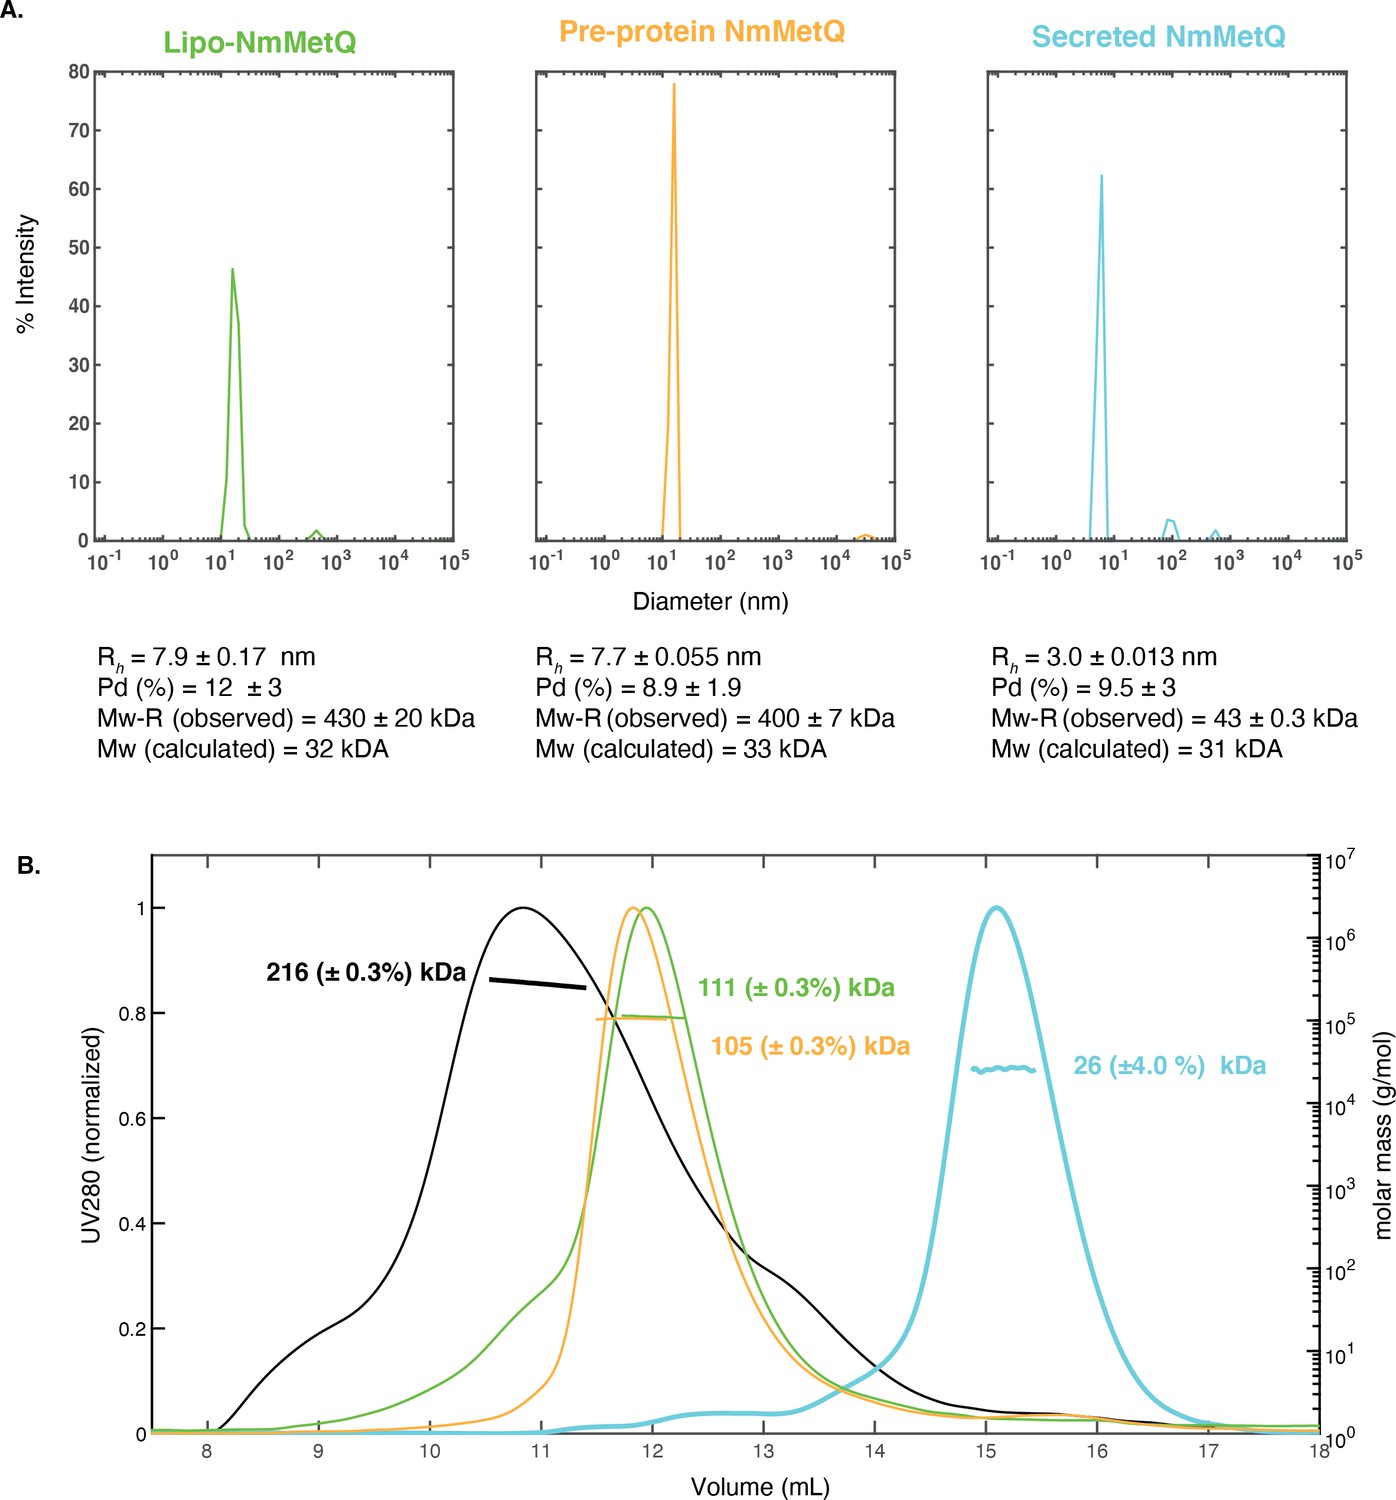
DLS and SEC-MALS measurements of NmMetQ proteins.
DLS and SEC-MALS measurements of NmMetQ proteins. (A) Representative DLS intensity distribution plots of lipo-NmMetQ (0.7 mg/ml), pre-protein (2.3 mg/ml) and secreted NmMetQ (2.7 mg/ml). The hydrodynamic radius (Rh), the polydispersity (Pd %), and molecular weight estimate based on the hydrodynamic radius of a folded globular protein (Mw-R) are listed below each plot. The mean and SEM of each measurement were calculated from triplicate measurements. (B) SEC-MALS profiles of NmMetNI (0.3 mg/ml, black trace), lipo-NmMetQ (0.05 mg/ml, green trace), pre-protein (0.1 mg/ml, yellow trace), and secreted NmMetQ (0.05 mg/ml, cyan trace). The UV absorbance at 280 nm (left y axis) is plotted against the SEC elution volume and overlaid with the molar mass determined for each peak (right y axis). The molar mass determined for each peak is indicated. Protein concentrations for the SEC-MALS experiments were determined at the highest point of the peak using UV as the concentration source and the appropriate extinction coefficient. We propose that both lipo-NmMetQ and pre-protein NmMetQ aggregate with DDM to form micelle-like complexes that depend on the experiment condition.
Figure 2
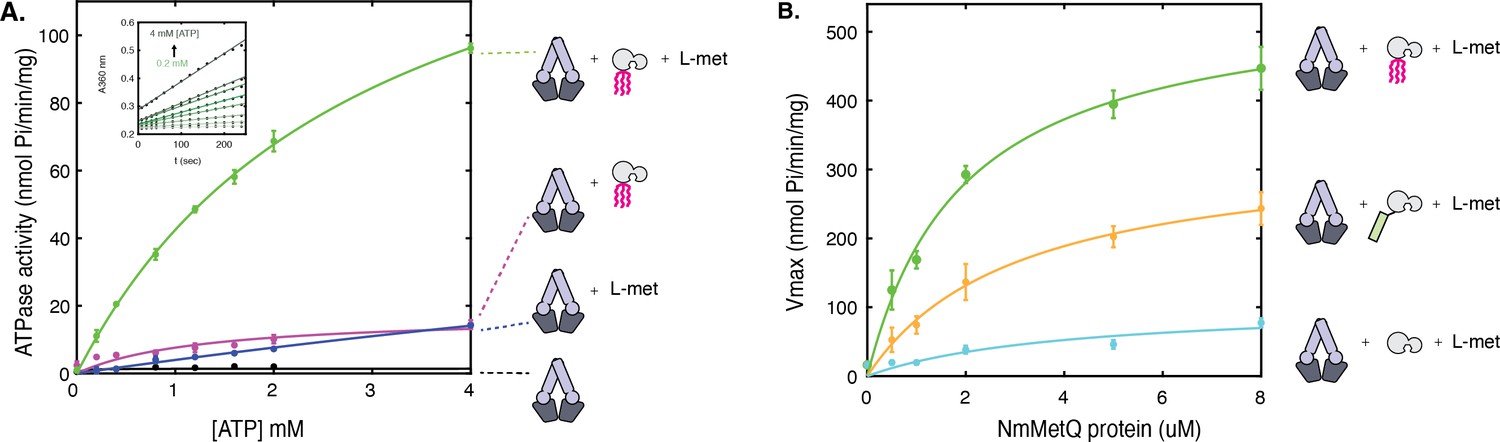
ATP hydrolysis of NmMetNI in the presence and absence of L-methionine and NmMetQ proteins.
(A) ATP hydrolysis was measured in the presence of 1 μM of DDM-solubilized NmMetNI alone (black trace), 50 μM L-methionine (blue trace), 1 μM lipo-NmMetQ (magenta trace) and both 50 μM L-methionine and 1 μM lipo-NmMetQ (green trace). Insert shows representative measurements of absorbance versus time (black dots) and the linear fits (green lines) for NmMetNI ATPase activity in the presence of lipo-NmMetQ and L-methionine at increasing ATP concentrations (0.2, 0.4, 0.8, 1.2, 1.6, 2.0, and 4.0 mM) (B) Specific activity of NmMetNI with increasing concentrations of various NmMetQ proteins: lipo-NmMetQ (green trace), pre-protein NmMetQ (orange trace), and secreted NmMetQ (cyan trace) with 50 μM L-methionine. Vmax values were determined by fitting the Michaelis-Menten equation to a plot of ATPase activity versus ATP concentration (0.2, 0.4, 0.8, 1.2, 1.6, 2.0, and 4.0 mM) at different MetQ protein concentrations ( 0.5, 1, 2, 4, 5, 8 μM). N=3 error bars represent standard error of the mean (SEM). These data show the NmMetNI ATPase activity is tightly coupled, requiring both L-methionine and lipo-NmMetQ for maximal NmMetNI ATPase stimulation.
Figure 3
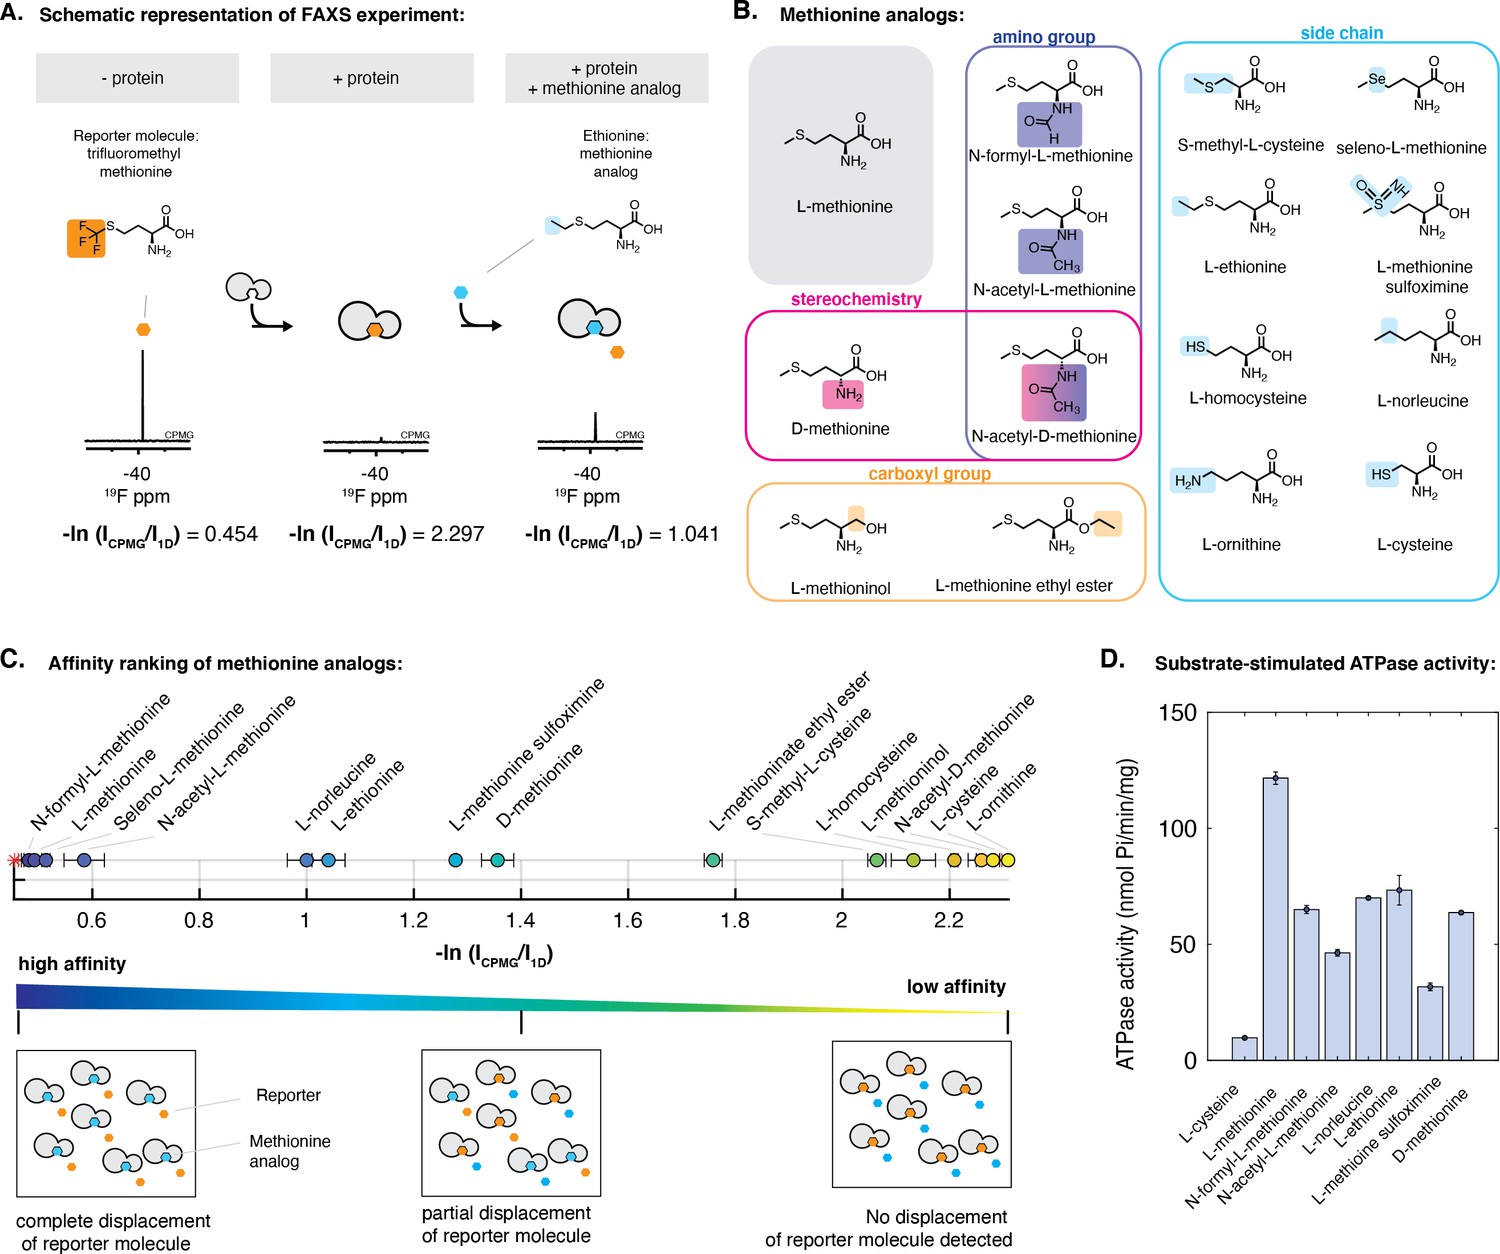
Characterization of the interaction of methionine analogs with NmMetQ using FAXS and ATPase experiments.
(A) Schematic diagram of the FAXS experiment. The intensity of the fluorine signal decreases in the presence of NLM-NmMetQ. Addition of the methionine analog causes the fluorine signal intensity of the reporter molecule to increase due to its displacement from NLM-NmMetQ. (B) Chemical structures of the methionine analogs used in this study. (C) (Top) Ordering of methionine analogs by their binding affinity to NLM-NmMetQ. (Bottom) Schematic representation of FAXS experiment depicted in bulk solution. Methionine analogs with higher affinity are positioned toward the left side of the plot, while lower affinity methionine analogs are positioned toward the right. (D) ATPase activity of NmMetNI at 2 mM ATP in the presence of lipo-NmMetQ and methionine analogs at 1:8:50 molar ratio, respectively. N=3 error bars represent SEM.
-
Figure 3—source data 1
The measured -ln(Icpmg/I1D) values: NMR.xlsx.
- https://cdn.elifesciences.org/articles/69742/elife-69742-fig3-data1-v2.xlsx
Figure 4 with 3 supplements
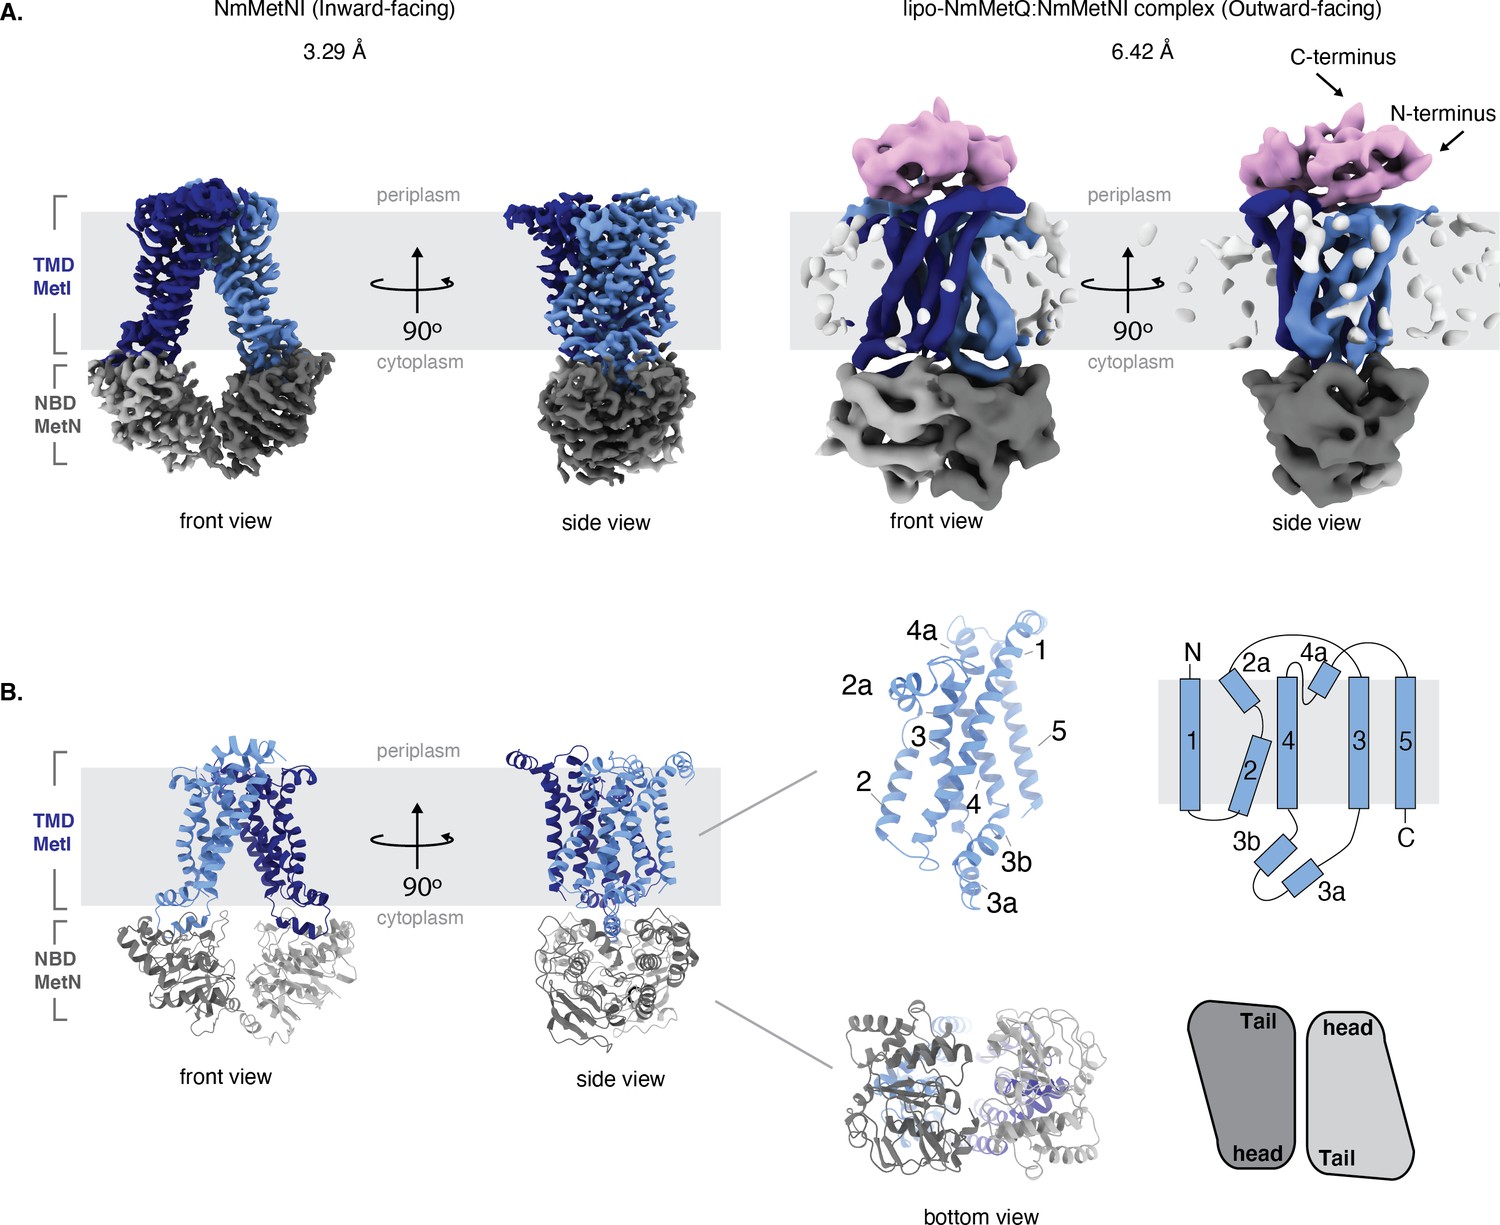
Architecture of NmMetNI and lipo-NmMetQ:NmMetNI complex.
(A) The 3.3 Å resolution cryo-EM map and NmMetNI in the inward-facing conformation in two views. (B) Transmembrane localization of NmMetI, showing NmMetI contains five transmembrane helices per monomer (C) The 6.4 Å resolution cryo-EM map and model of NmMetNI in complex with lipo-NmMetQ in the presence of ATP. NmMetNI is in the outward-facing conformation. NmMetI is shown in light/dark blue, NmMetN in light/dark grey and lipo-NmMetQ in light pink. The membrane is represented by a gray box.
Figure 4—figure supplement 1
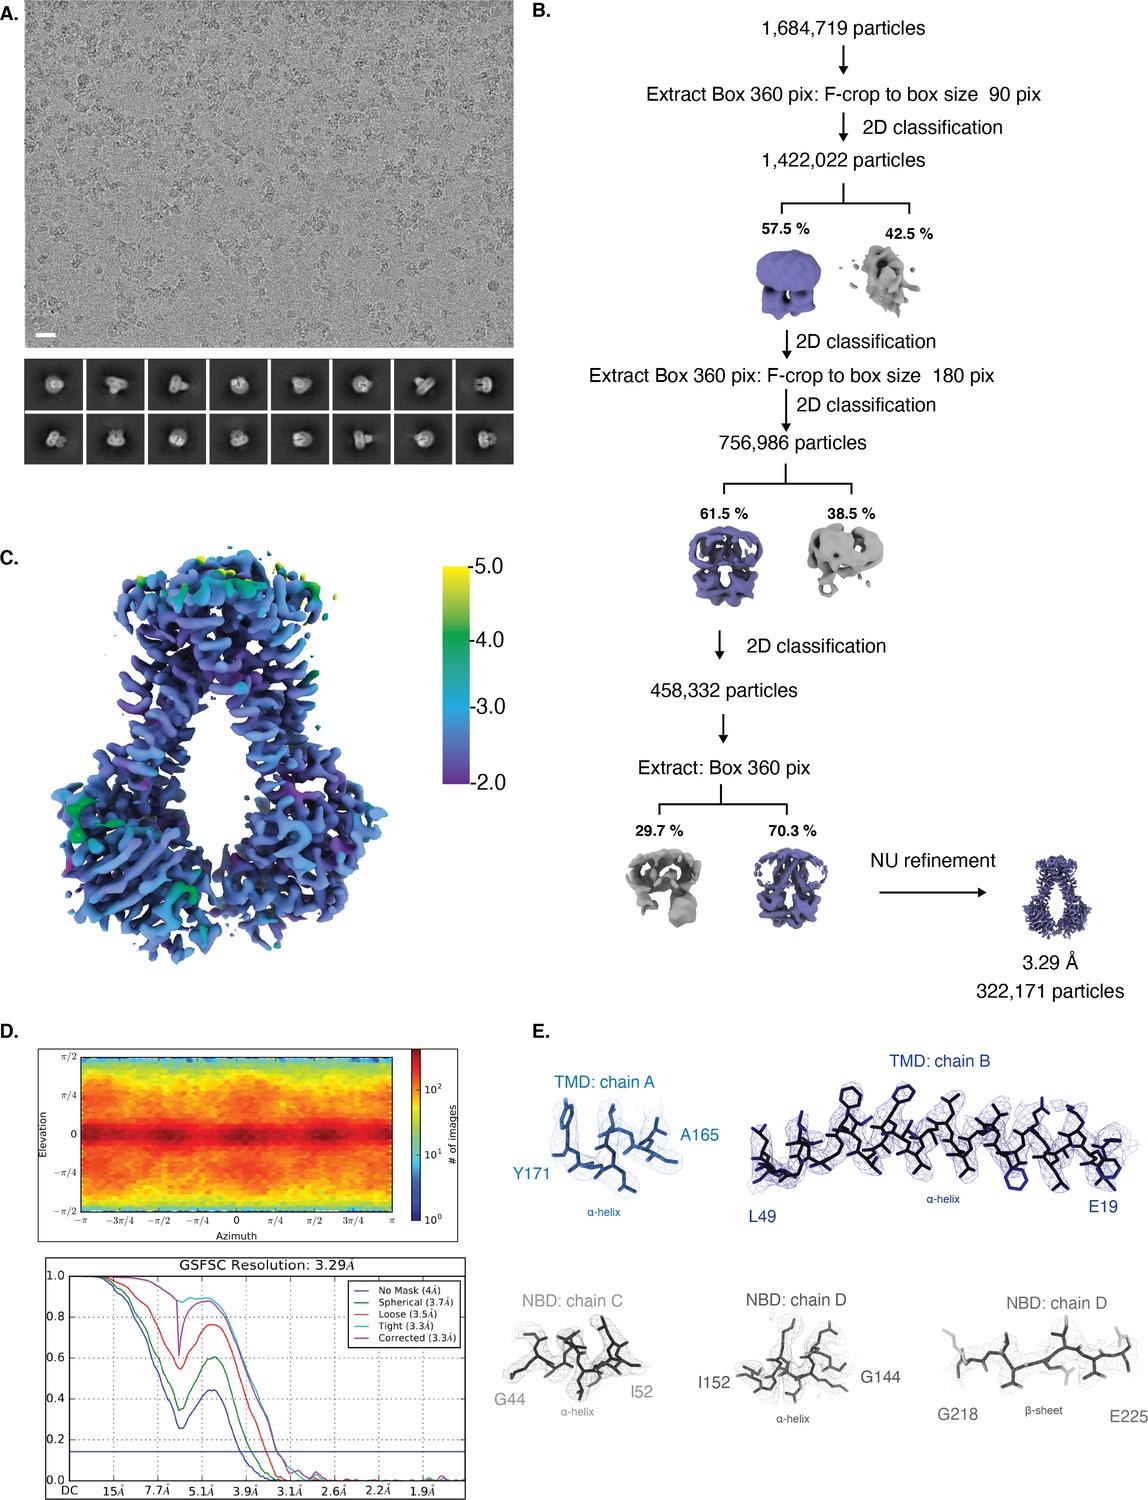
Cryo-EM map generation and data processing refinement of NmMetNI in the inward-facing conformation.
Cryo-EM map generation and data processing refinement of NmMetNI in the inward-facing conformation. (A) Representative cryo-EM micrograph of (scale bar is 20 nm) and select 2D class averages. (B) Workflow of single-particle image processing. (C) Local resolution plot of NmMetNI as calculated using cryoSPARC. (D) Angular distribution calculated for particle projections. Heatmap shows number of particles for each viewing angle (top) and gold-standard Fourier shell correlation (FSC) curves for masked and unmasked maps generated by cryoSPARC non-uniform refinement (bottom) (E) Cryo-EM density (mesh) overlaid on the atomic model of select regions of NmMetNI (sticks).
Figure 4—figure supplement 2
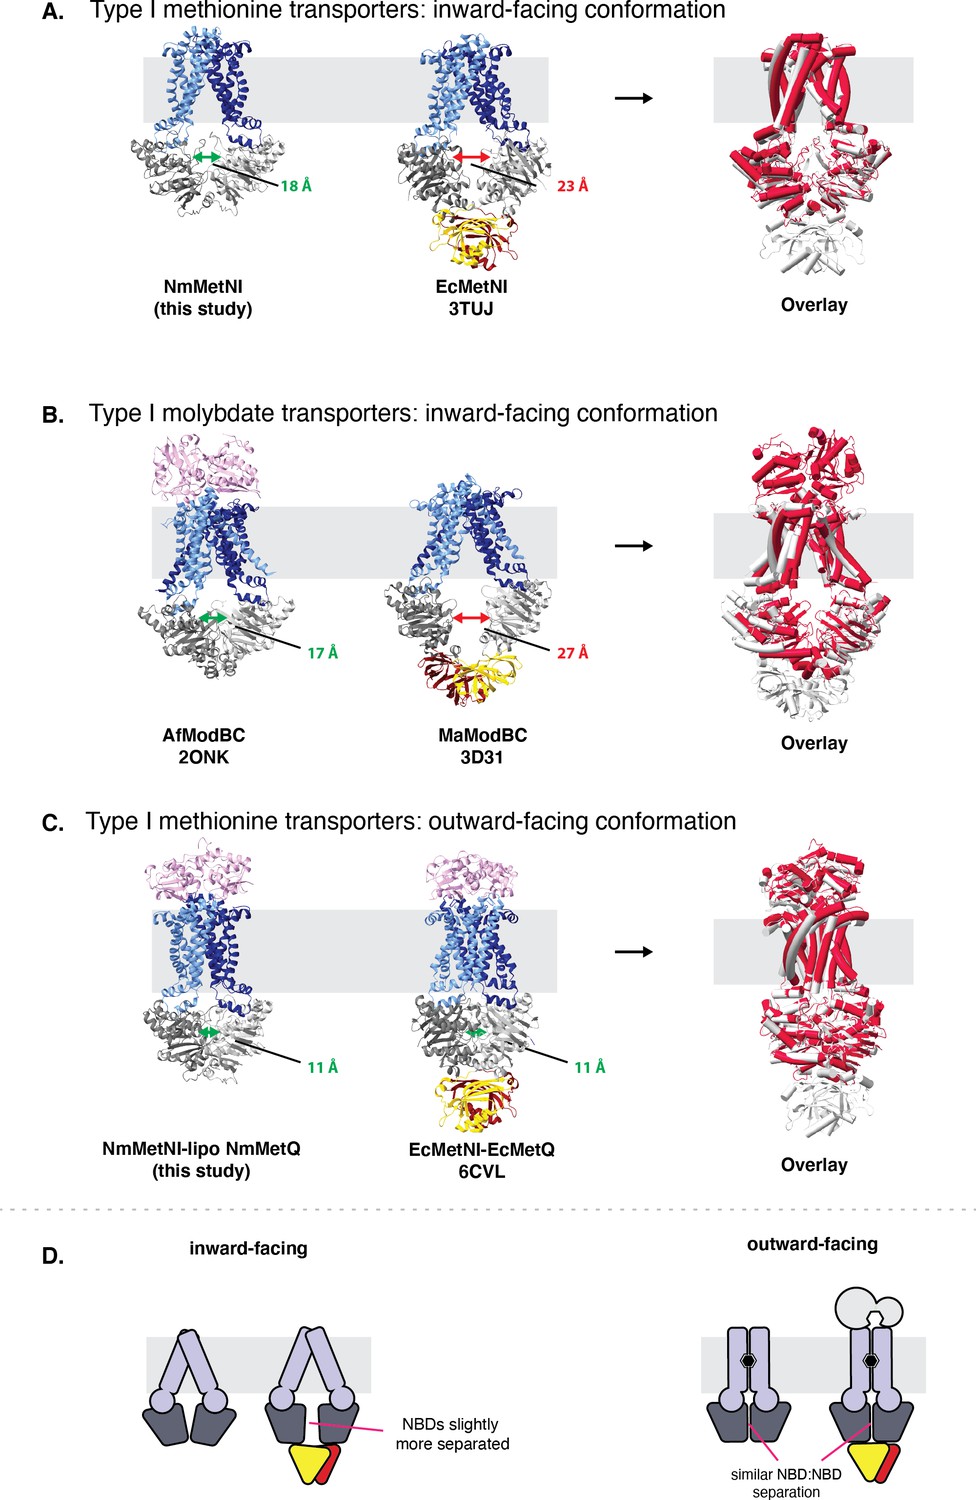
Comparison of type I ABC transporters.
Comparison of type I ABC transporters. (A) ABC methionine transporters in the inward-facing conformation. (B) ABC molybdate transporters in the inward-facing conformation and (C) ABC methionine transporters in the outward-facing conformation. For each model the TMDs, NBDs, and SBPs, are colored in blue, grey, and pink, respectively. Next to each panel, an overlay is included of the two structures, with the ABC transporter with a regulatory domain colored in grey and the ABC transporter with a regulatory domain colored in red. NBD:NBD inter-subunit distances were assessed using the Cα of NBD glycine residues in the P loop and signature motifs. The average of the two distances are indicated by double arrows. (D) Schematic summary for NBD:NBD distances of homologous methionine ABC transporters with and with out the autoinhibitory domain in the inward and outward-facing conformations, respectively.
Figure 4—figure supplement 3
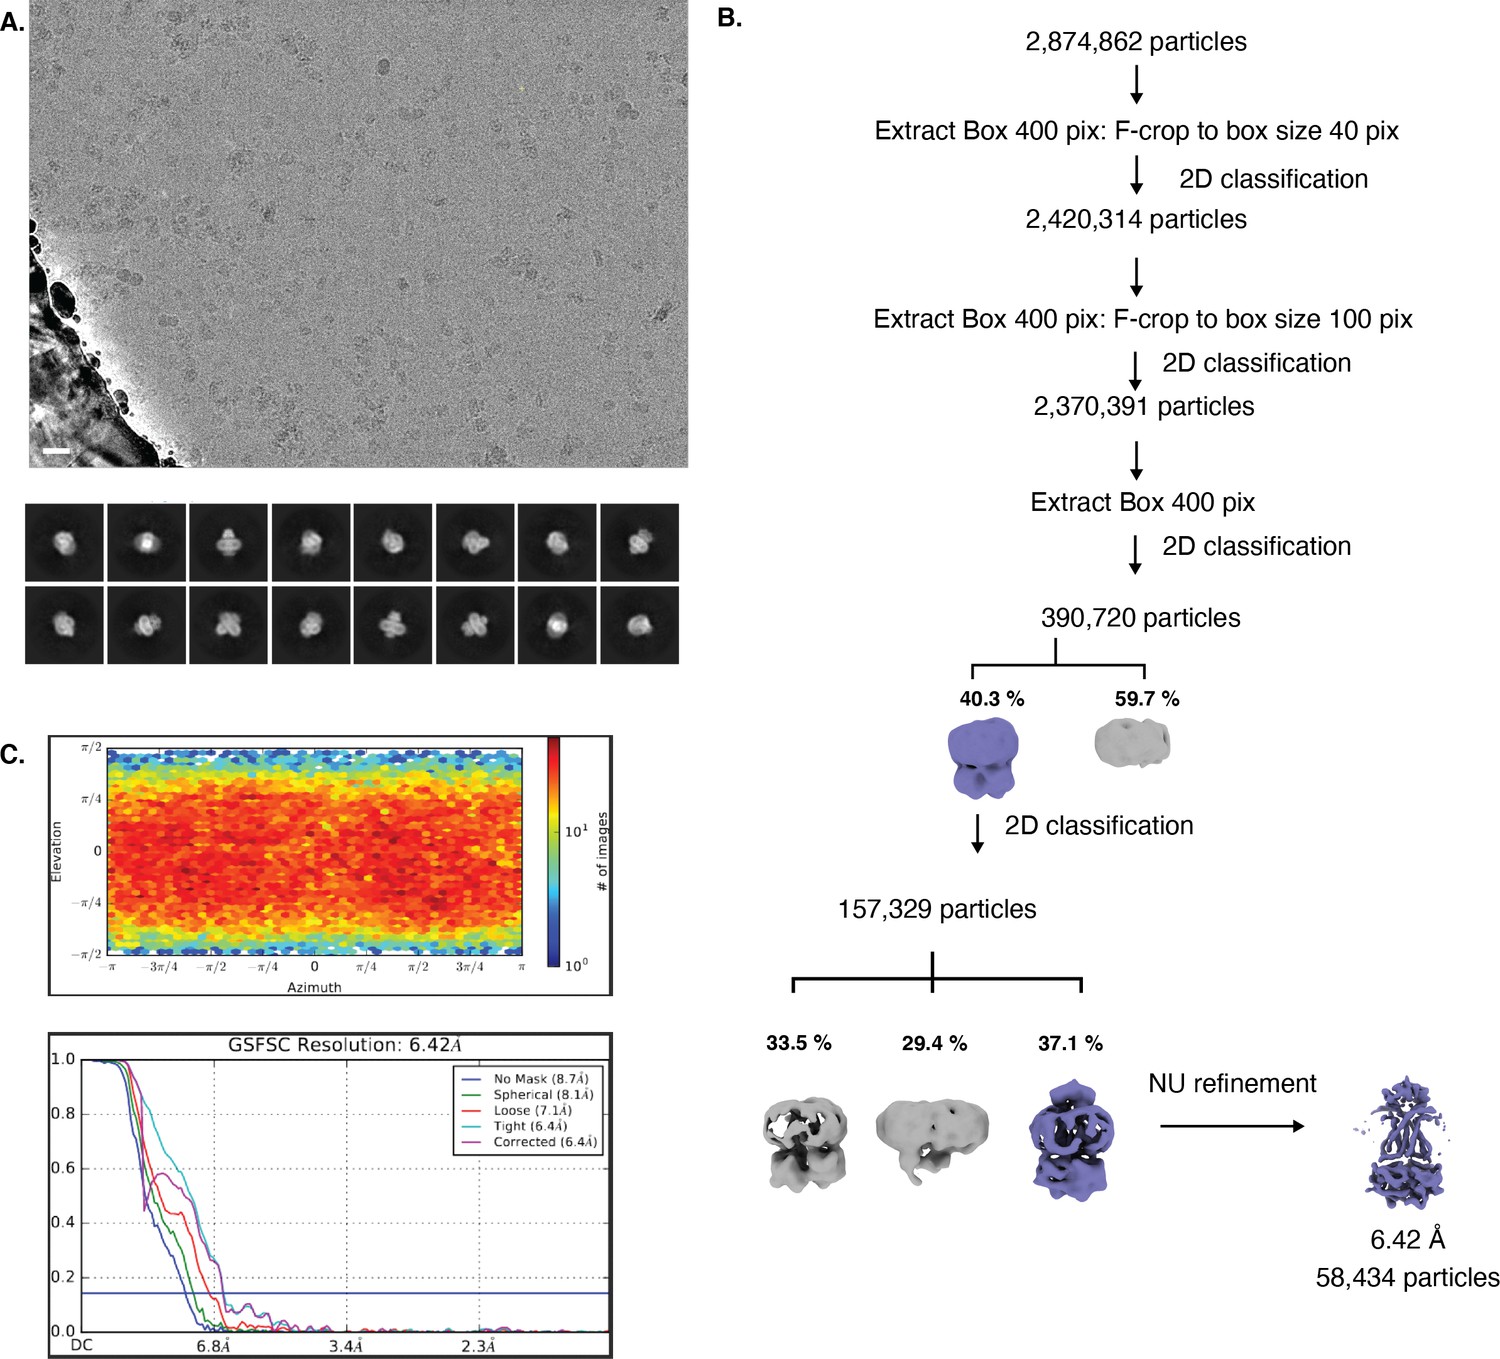
Cryo-EM map generation and data processing refinement of lipo-NmMetQ:NmMetNI complex in the outward-facing conformation.
Cryo-EM map generation and data processing refinement of lipo-NmMetQ:NmMetNI complex in the outward-facing conformation. (A) Representative cryo-EM micrograph of (scale bar is 20 nm) and select 2D class averages. (B) Workflow of single-particle image processing. (C) Angular distribution calculated for particle projections. Heatmap shows number of particles for each viewing angle (top) and gold-standard Fourier shell correlation (FSC) curves for masked and unmasked maps generated by cryoSPARC non-uniform refinement (bottom).
Figure 5

Distribution of lipid-modified MetQ proteins in different classes of Proteobacteria, a major phylum of Gram-negative bacteria.
Plot of the number of MetQ proteins analyzed in each Order, grouped by Proteobacteria. Predicted lipid-modified and secreted MetQ proteins are shown in magenta and white, respectively.
-
Figure 5—source data 1
Distribution of lipid-modified MetQ proteins: lipoproteins.xlsx.
- https://cdn.elifesciences.org/articles/69742/elife-69742-fig5-data1-v2.xlsx
Figure 6
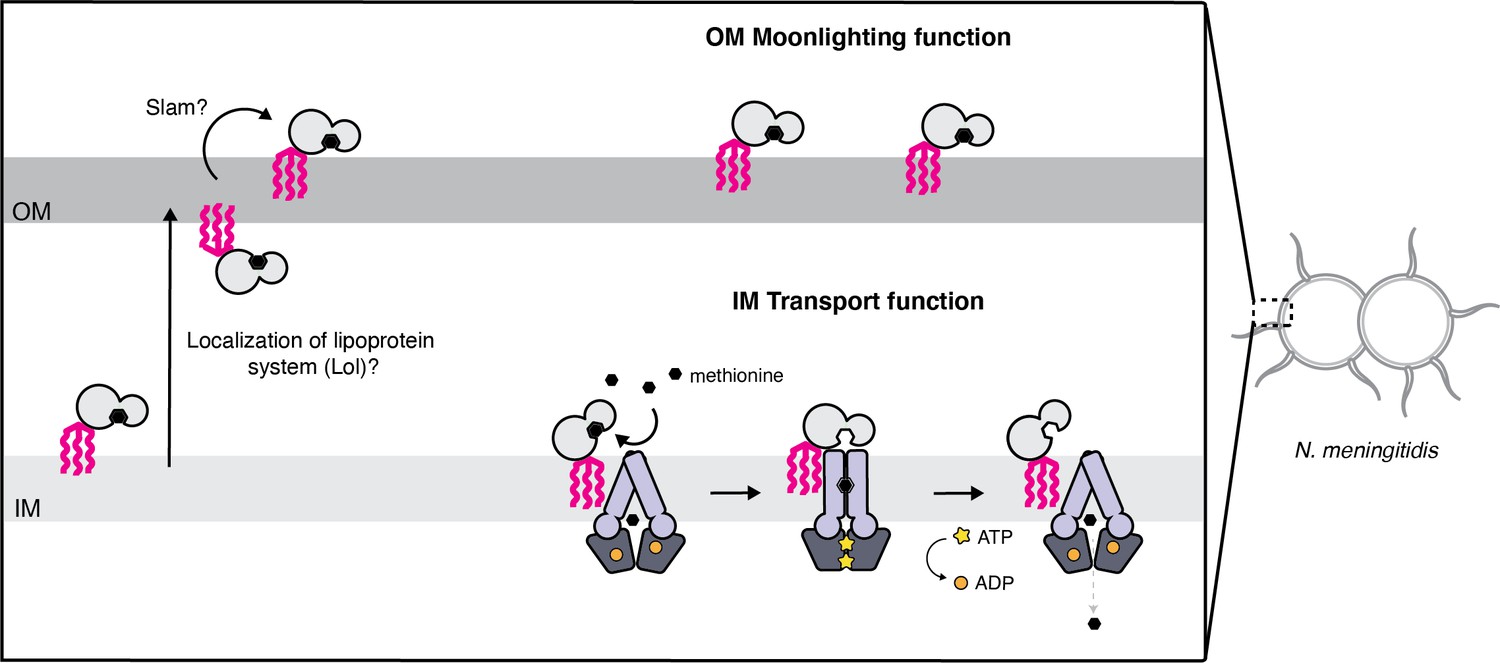
Proposed model for the cellular distribution of the N.meningitidis ABC methionine transporter proteins.
Lipo-NmMetQ tethers to membranes via a lipid anchor and has dual function and localization, playing a role in NmMetNI-mediated transport at the inner-membrane in addition to moonlighting on the bacterial surface. The lipid modifications are central to the model, helping to explain how NmMetQ remains at the surface of the bacterium.
Tables
Table 1
Cryo-EM data collection and refinement statistics.
| Inward-facing conformation of the MetNI methionine ABC transporter | Outward-facing conformation of the MetNI methionine ABC transporter in complex with lipo-MetQ | |
|---|---|---|
| PDB | 7MC0 | 7MBZ |
| EMD | EMD-23752 | EMD-23751 |
| Data collection conditions | ||
| Microscope | Titan Krios | Titan Krios |
| Camera | Gatan K3 Summit | Gatan K3 Summit |
| Magnification | 105,000x | 105,000x |
| Voltage (kV) | 300 | 300 |
| Recording mode | counting | counting |
| Frames/Movies | 40 | 40 |
| Total Electron dose (e-/Å2) | 60 | 60 |
| Defocus range (µm) | 1.0 – 2.8 | 1.0 – 2.8 |
| Pixel size (Å) | 0.856 | 0.856 |
| Micrographs collected | 4709 | 6183 |
| Micrographs used | 3968 | 5494 |
| Total extracted particles | 1,684,719 | 2,874,862 |
| Refined particles | 322,171 | 58,434 |
| Symmetry imposed | C1 | C1 |
| Nominal Map Resolution (Å) | ||
| FSC 0.143 (unmasked/masked) | 3.4/3.3 | 6.4/6.4 |
| Refinement and Validation | ||
| Initial model used | 3TUJ | |
| Number of atoms | ||
| Protein | 7092 | 8987 |
| Ligand | 0 | 0 |
| MapCC (mask/box) | 0.80/0.65 | 0.75/0.69 |
| Map sharpening B-factor | 91.3 | 496 |
| R.m.s. deviations | ||
| Bond lengths (Å) | 0.012 | 0.012 |
| Bond angles (º) | 1.62 | 1.92 |
| MolProbity score | 1.76 | 1.73 |
| Clashscore (all atom) | 7.56 | 6.77 |
| Rotamer outliers (%) | 1.19 | 1.04 |
| Ramachandran plot | ||
| Favored (%) | 95.77 | 95.09 |
| Allowed (%) | 3.90 | 4.91 |
| Outliers (%) | 0.33 | 0 |
Additional files
Download links
A two-part list of links to download the article, or parts of the article, in various formats.
Downloads (link to download the article as PDF)
Open citations (links to open the citations from this article in various online reference manager services)
Cite this article (links to download the citations from this article in formats compatible with various reference manager tools)
Characterization of the ABC methionine transporter from Neisseria meningitidis reveals that lipidated MetQ is required for interaction
eLife 10:e69742.
https://doi.org/10.7554/eLife.69742


