PGFinder, a novel analysis pipeline for the consistent, reproducible, and high-resolution structural analysis of bacterial peptidoglycans
- School of Biosciences, University of Sheffield, United Kingdom
- Department of Computer Science, University of Sheffield, United Kingdom
- Institut Pasteur, Unité Biologie et Génétique de la Paroi Bactérienne, France
- INSERM, Équipe Avenir, France
- CNRS, UMR 2001 "Microbiologie intégrative et moléculaire", France
- biOMICS Facility, Faculty of Science Mass Spectrometry Centre, University of Sheffield, United Kingdom
- Protein Metrics Inc, United States
- Infection and Immunity Program, Monash Biomedicine Discovery Institute, Australia
- Department of Microbiology, Monash University, Australia
Figures
Figure 1
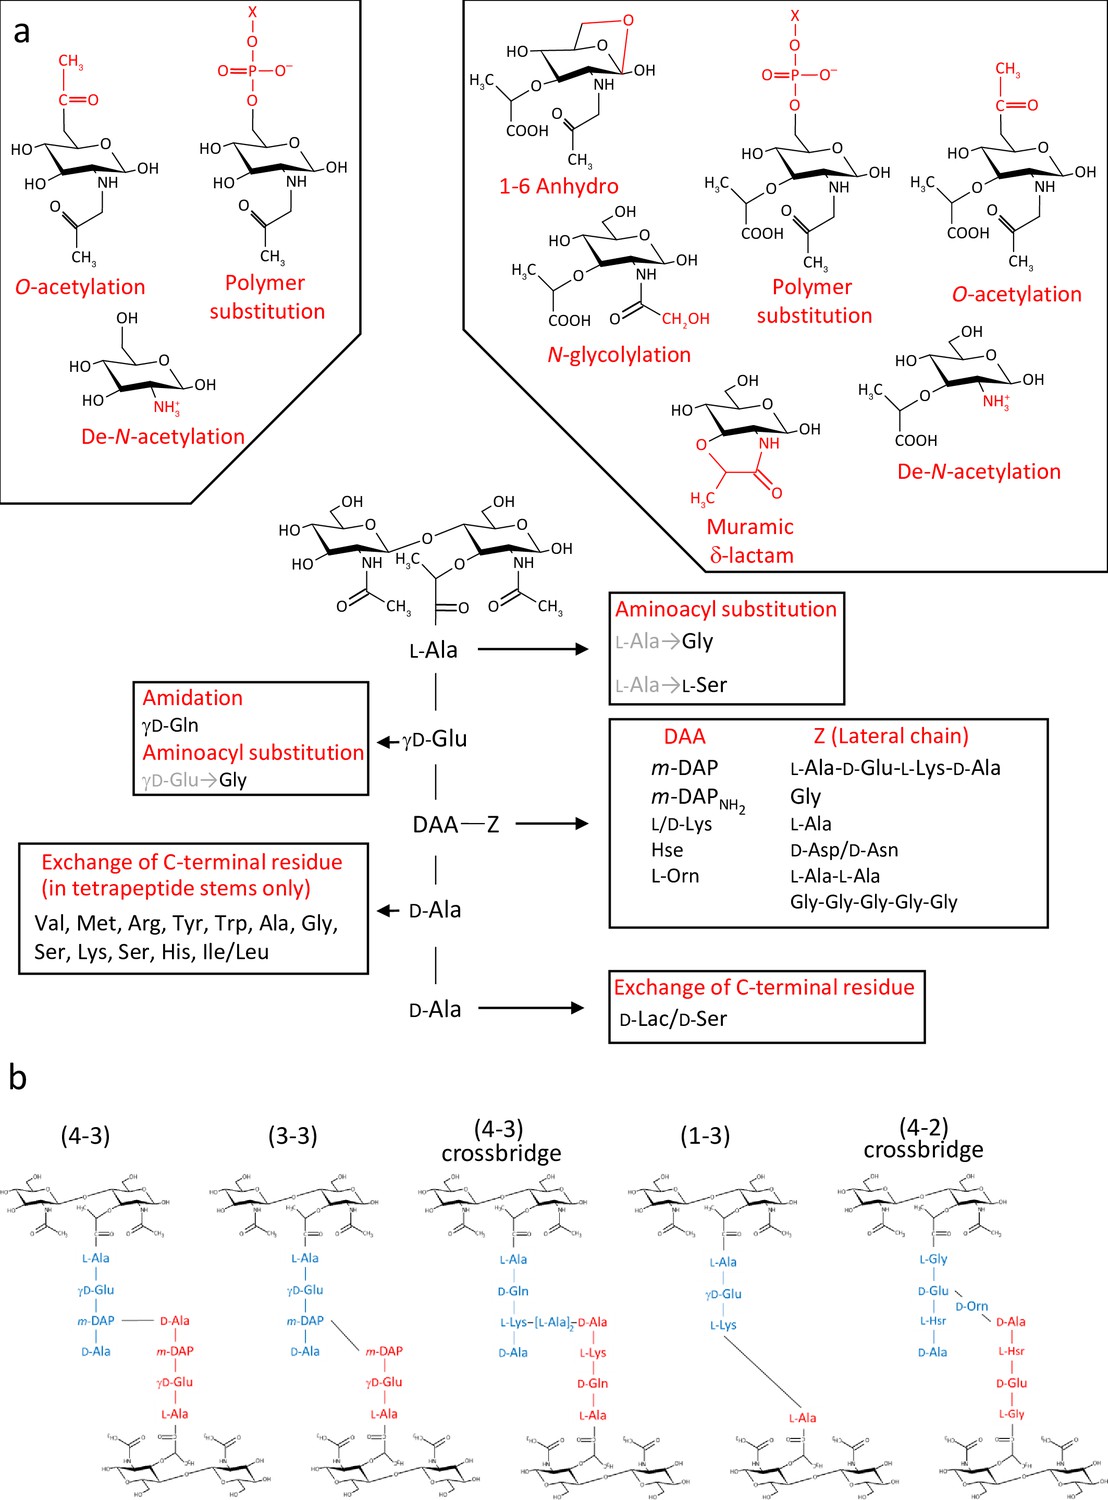
Diversity of peptidoglycan composition and structure.
(a) Representative peptidoglycan building block made of N-acetylglucosamine (GlcNAc) and N-acetylmuramic acid (MurNAc) forming a disaccharide subunit linked to a pentapeptide stem attached to the MurNAc via a lactyl moiety. Peptide stem contains both L and D-amino acids and show a great diversity in composition. Some examples of amino acids found in peptidoglycan are shown for each residue. Modifications of the sugars are also shown. (b) Representation of crosslinking diversity, 4–3 bonds (direct or via peptide crossbridge) and 3–3 bonds are made by D,D- or L,D-transpeptidases, respectively. The enzymes catalysing 1–3 and 4–2 bonds remain unknown. Acceptors stems are shown in blue and donor stems in red. DAA: diamino acid; m-DAP: meso-diaminopimelic acid; D-Lac: D-lactate; X: cell surface polymer (e.g teichoic acid); Z: lateral chain.
Figure 2
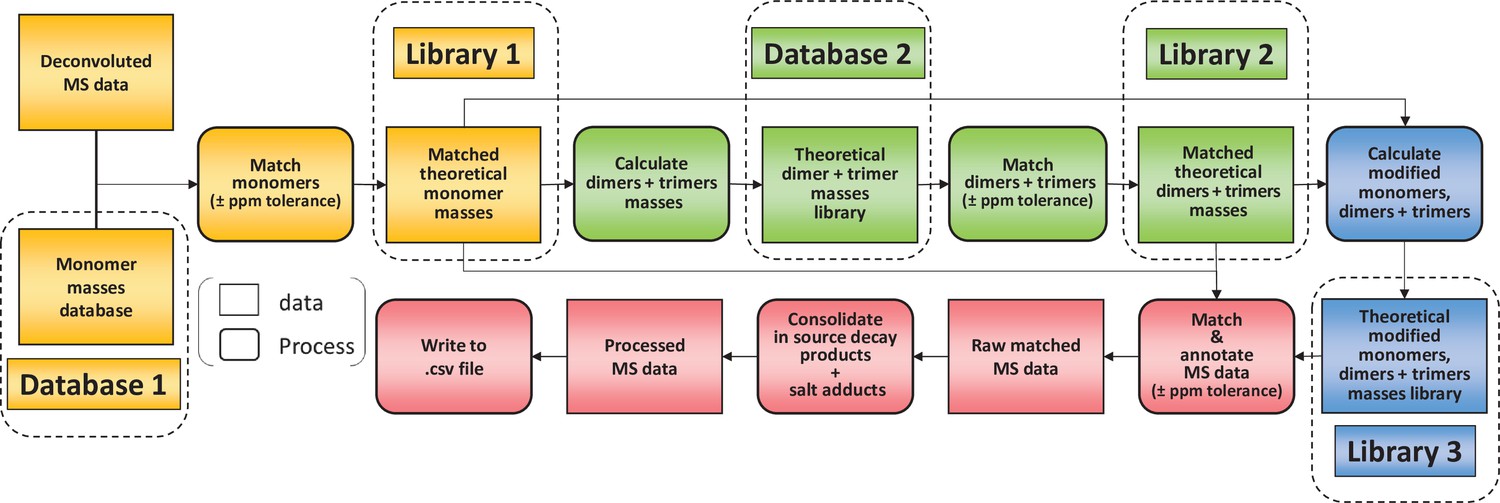
Flowchart outlining the algorithm for the matching script.
The identification of muropeptides was carried out using four successive steps, indicated by different colours (orange, green, blue, and red, respectively). As a first step, observed masses in the dataset are compared to a list of theoretical masses corresponding to monomers (database 1). Matched masses within the ppm tolerance set (10 ppm for Orbitrap data) are used to build a list of inferred monomeric structures and their corresponding theoretical masses (library 1). This is then used to generate a list of theoretical multimers (dimers and trimers) and their masses (database 2). A second matching round is carried out to build a list of inferred multimers (library 2). At this stage, matched monomers and multimers are combined to generate a list of modified muropeptides (library 3). Two libraries of matched theoretical masses (monomers and dimers, trimers) and a third library (their modified counterparts) are used to search the dataset. Muropeptide structures are inferred from a match within tolerance between theoretical and observed masses. This data is then ‘cleaned up’ by combining the intensities of ions corresponding to in-source decay and salt adducts to those of parent ions. The final matched mass spectrometry data is then written to a .csv file.
Figure 3
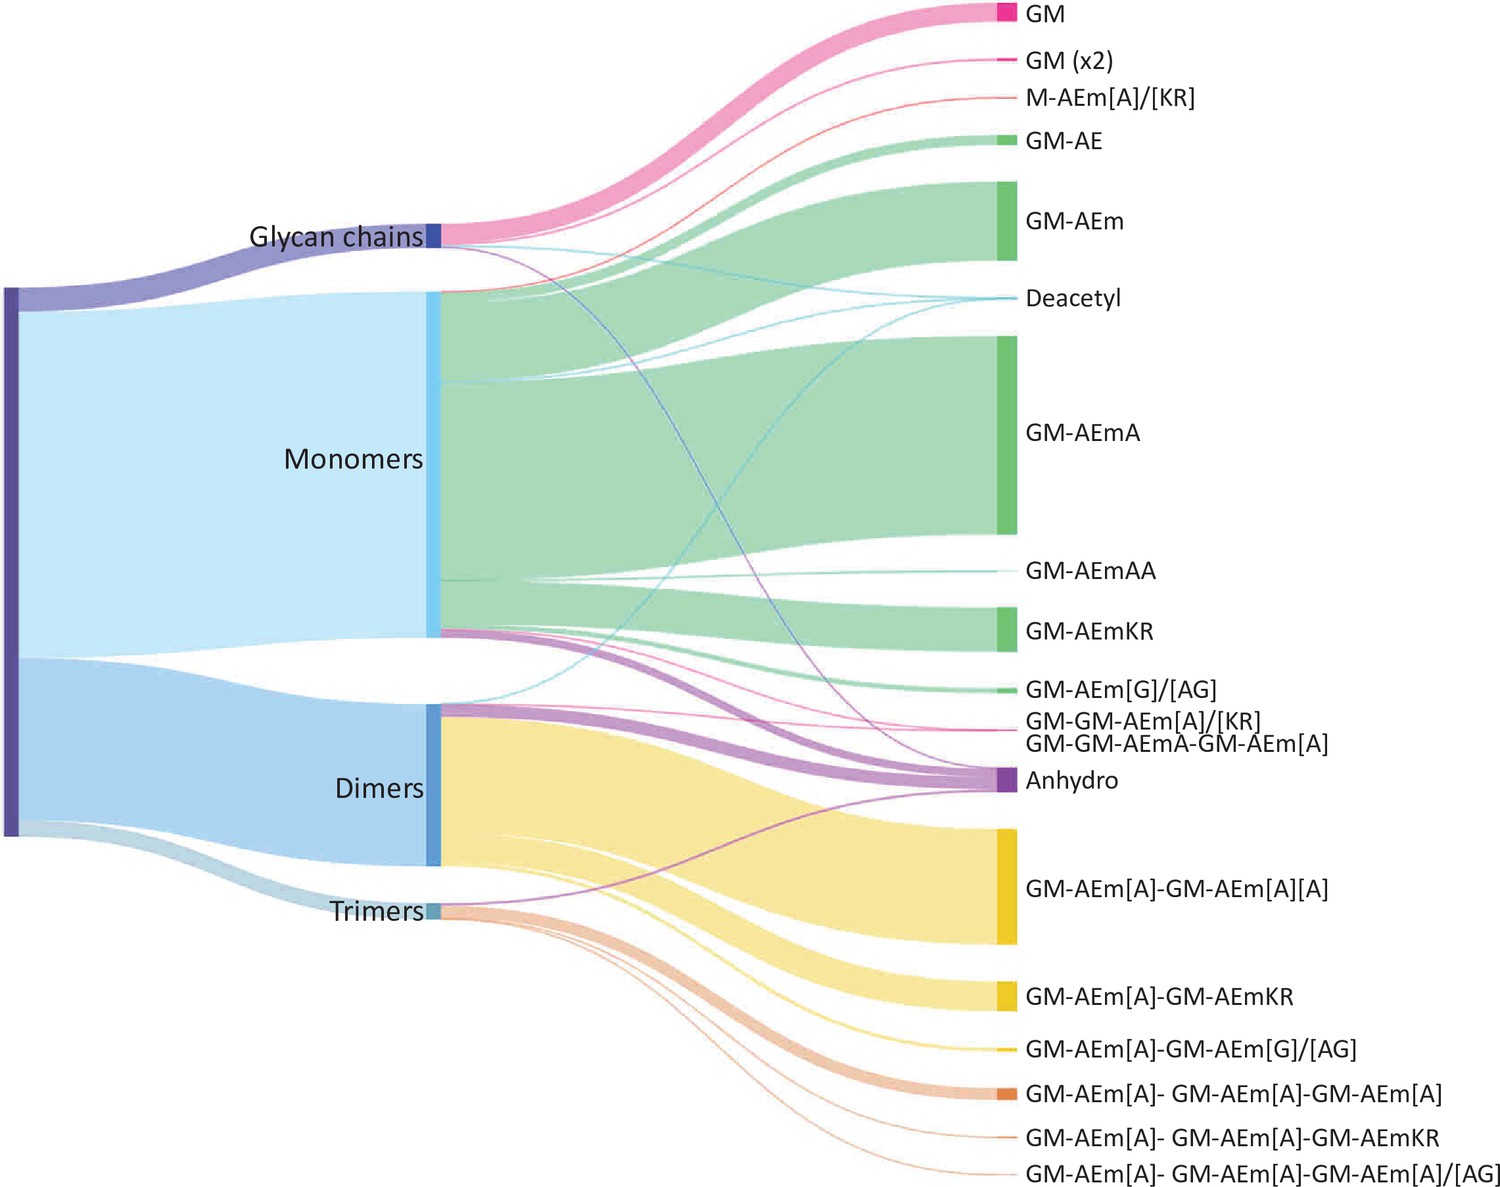
Distribution of E. coli peptidoglycan fragments identified using automated search workflow.
Breakdown of peptidoglycan is shown by oligomerisation state (left) branching to specific composition (right). Branch size is proportional to percentage. Monomers, dimers, trimers, and glycan chains (left) are broken down into muropeptide composition and structure (right). Individual structures are grouped by colour according to oligomerisation state. Monomers, green; dimers, yellow; trimers, orange. Residues in square brackets are only found in some muropeptides. For example, GM-AEJ[A]-GM-AEJ[A] can represent GM-AEJA-GM-AEJA, GM-AEJA-GM-AEJ, and GM-AEJ-GM-AEJ. G: N-acetylglucosamine; M, N-acetylmuramic acid; A: L- or D- alanine; E: γ-D-glutamic acid; J: meso-diaminopimelic acid; K: D-lysine; R: D-arginine; G: glycine.
Figure 4 with 1 supplement

Comparative analysis of C. difficile R20291 and M7404 peptidoglycan (PG) composition.
(a) Pearson’s correlation coefficients across biological replicates of R20291 and M7404 C. difficile isolates. Heatmap gradient shows highest value in green to lowest value in red. (b) Muropeptide distribution according to degree of crosslinking. Comparison was carried out using a Student’s t-test; p-value is indicated for each category of muropeptides. (c) Volcano plot, where each dot represents an individual muropeptide, plotted against the significance (Student’s t-test p-value<0.05, FDR < 0.05, S0 = 0.1) and difference (log2). Muropeptides showing a significantly different abundance between strains are highlighted in red. Lac: lactyl group; A: D/L-alanine; E: γ-D-glutamate; J: meso-diaminopimelic acid V: D-valine; L: D-leucine; I: D-isoleucine; G: glycine.
-
Figure 4—source data 1
C. difficile mass database.
- https://cdn.elifesciences.org/articles/70597/elife-70597-fig4-data1-v1.csv
-
Figure 4—source data 2
C. difficile 20291 versus M7404, list of muropeptides, abundance, RT.
- https://cdn.elifesciences.org/articles/70597/elife-70597-fig4-data2-v1.xlsx
Figure 4—figure supplement 1
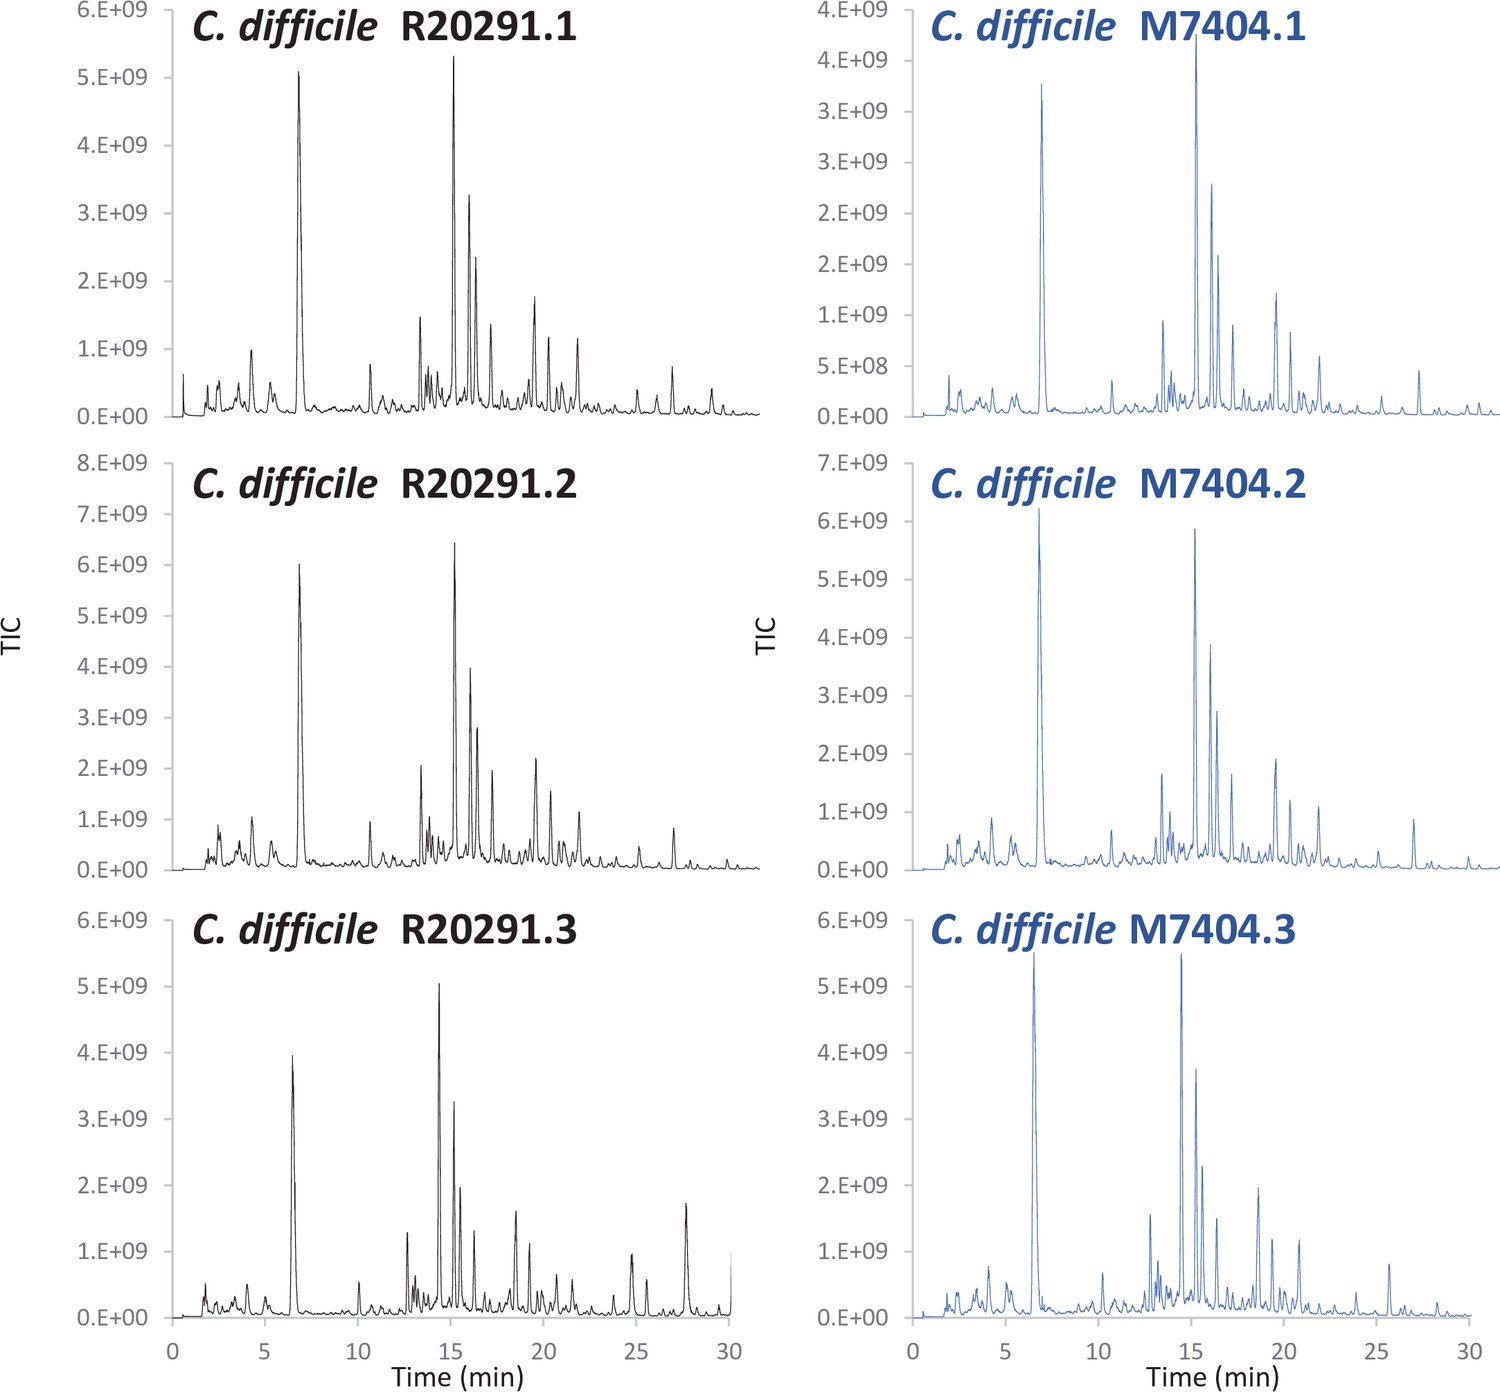
C. difficile LC-MS chromatograms.
Appendix 1—figure 1
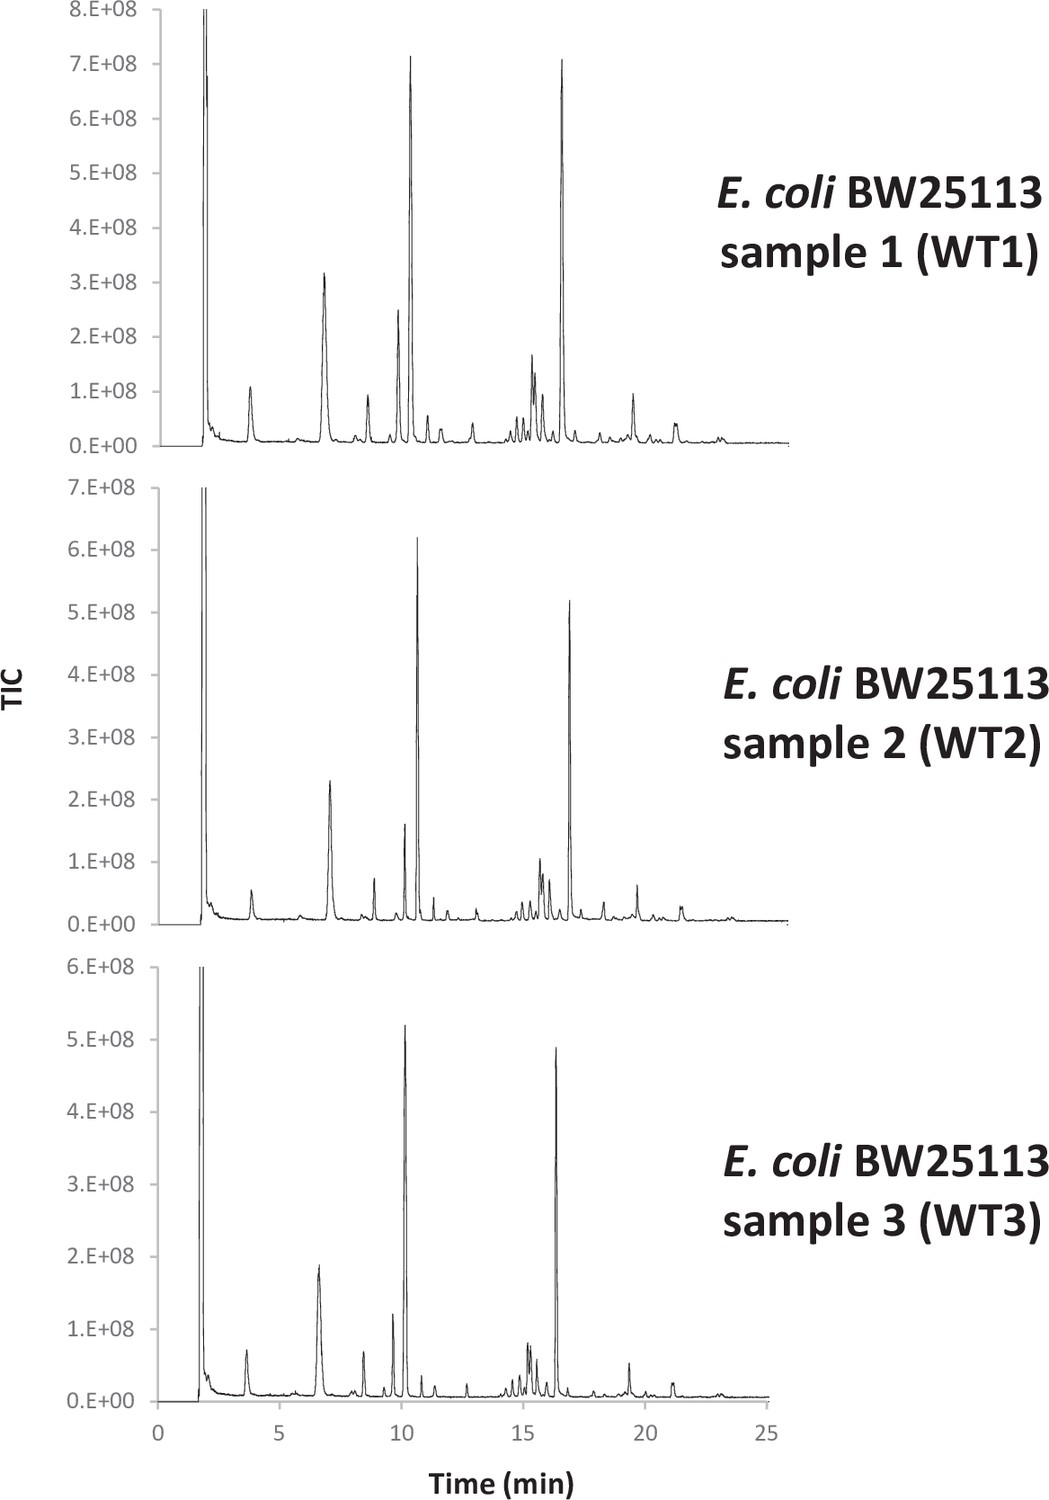
UHPLC-MS chromatogram of E. coli reduced disaccharide peptides.
Appendix 1—figure 2
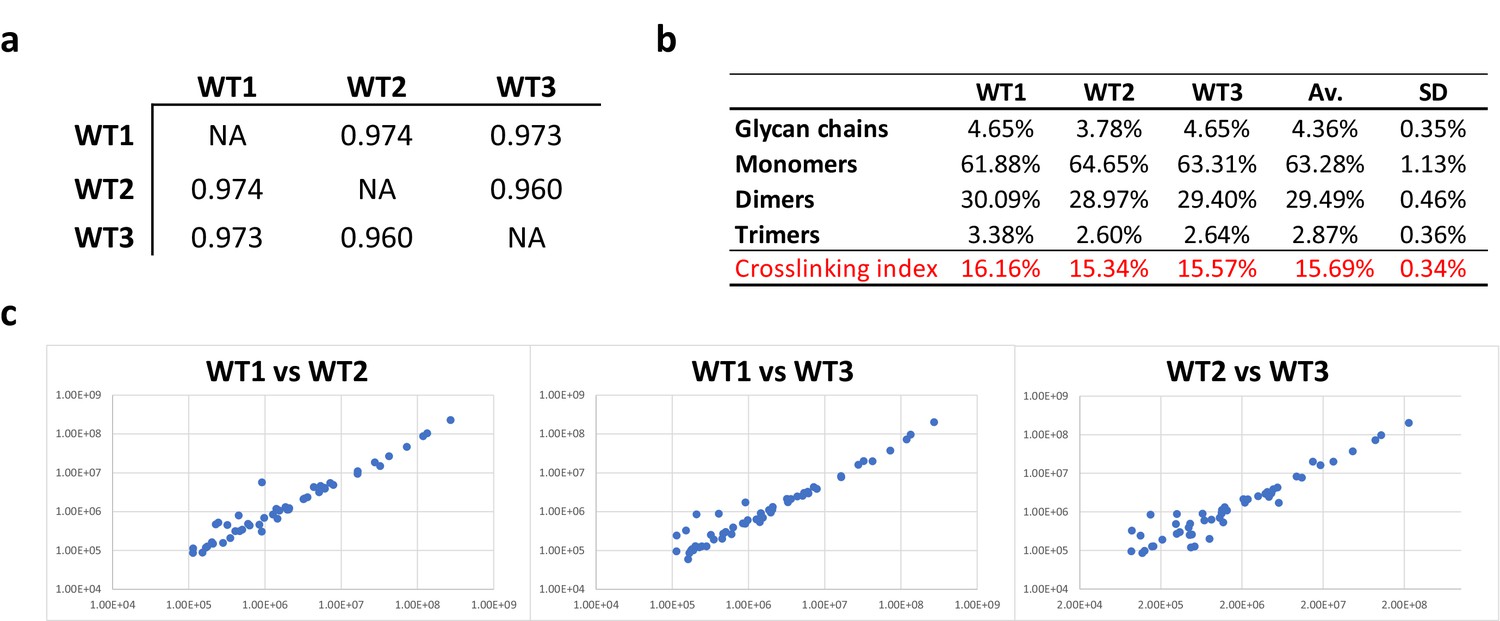
Consistency of E. coli PG analyses.
(a) Pearson’s correlation coefficients across biological replicates of E. coli BW25113. (b) Muropeptide distribution according to degree of crosslinking. The crosslinking index was calculated as described previously (Glauner, 1988). (c) Pairwise comparisons of intensities corresponding to individual muropeptides identified in biological replicates. WT1, WT2 and WT3 correspond to individual biological replicates; Av., average abundance; SD, standard deviation.
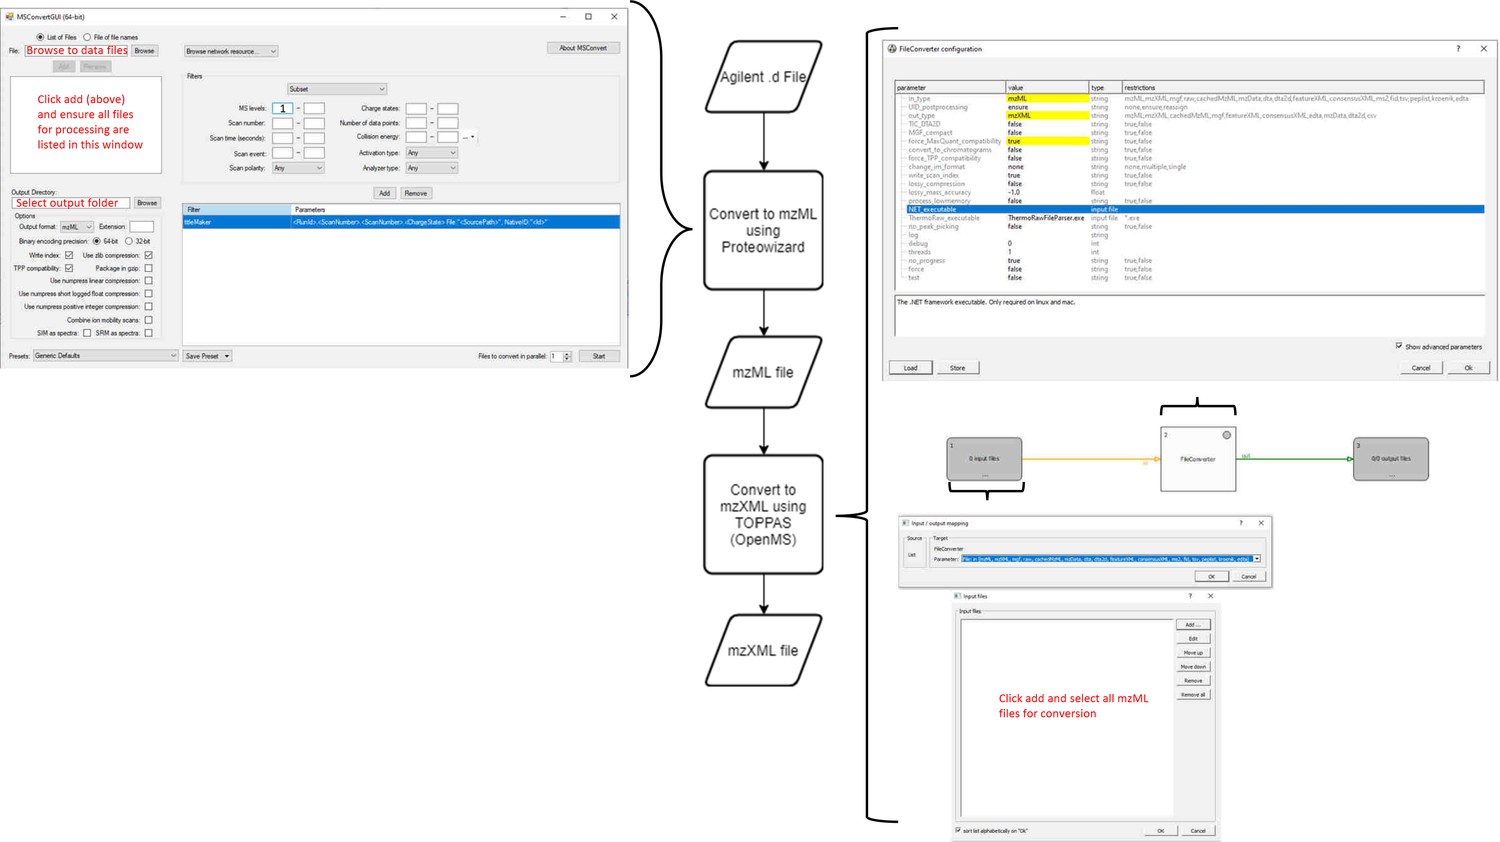
Appendix 2—figure 1

Workflow for production of MaxQuant compatible MS data files from Agilent QTOF data.
Agilent MS data (data: .d) is converted by Proteowizard to a mzML format (data: XML). Relevant settings for Proteowizard are shown (left). mzML file is then converted by TOPPAS to a mzXML file (data: XML). Relevant settings are shown (right).
Appendix 2—figure 2
Workflow for MS data processing using MaxQuant, before automated analysis.
mzXML (data: XML) is passed to MaxQuant (process) for deconvolution and monoisotopic mass determination. Default values used except where indicated (right). MaxQuant output (data: text file) is then passed to the data parser module (process). This module removes superfluous data and reformats remaining data to be compatible with the matching script as an Excel file (data: xlsx).
Author response image 1

Tables
Table 1
Processed match output.
| Structure | RT (min) | Abundance (%) | Monoisotopic mass (Da) | |||
|---|---|---|---|---|---|---|
| Av±SD | Av±SD | Obs | Theo | Δppm | ||
| GM|0 | 3.62±0.01 | 3.465±0.683 | 498.205 | 498.206 | 2.5 | |
| Glycans | GM (x2)|0 | 10.11±0.03 | 0.428±0.349 | 976.384 | 976.386 | 2.2 |
| 4.38%±0.35% | GM (anhydro) |0 | 8.20±1.92 | 0.238±0.025 | 478.179 | 478.180 | 2.9 |
| GM (deacetyl) |0 | 2.57±0.00 | 0.155±0.032 | 456.194 | 456.196 | 3.5 | |
| GM (x2) (deacetyl) |0 | 6.86±0.02 | 0.093±0.012 | 934.372 | 934.376 | 3.2 | |
| GM-AEmA|1 | 10.04±0.04 | 36.098±2.131 | 941.405 | 941.408 | 2.8 | |
| GM-AEm|1 | 6.57±0.01 | 14.352±0.397 | 870.368 | 870.371 | 3.0 | |
| GM-AEmKR|1 | 9.56±0.05 | 8.030±0.774 | 1154.563 | 1154.567 | 3.6 | |
| GM-AE|1 | 9.57±0.04 | 1.809±0.231 | 698.284 | 698.286 | 3.1 | |
| GM-AEmG|1 | 7.85±0.05 | 0.689±0.049 | 927.390 | 927.392 | 2.3 | |
| GM-AEm (anhydro) |1 | 13.98±0.02 | 0.668±0.073 | 850.342 | 850.344 | 2.2 | |
| Monomers | GM-AEmA (anhydro) |1 | 16.55±0.01 | 0.573±0.100 | 921.380 | 921.382 | 2.0 |
| 63.14%±1.13% | GM-AEmAG|1 | 9.45±0.05 | 0.219±0.009 | 998.426 | 998.429 | 3.1 |
| GM-AEmKR (anhydro) |1 | 14.83±0.01 | 0.160±0.039 | 1134.537 | 1134.540 | 2.9 | |
| GM-AEmA (deacetyl) |1 | 8.57±0.06 | 0.083±0.055 | 899.394 | 899.397 | 3.1 | |
| GM-GM-AEmA|1 | 13.10±0.02 | 0.075±0.040 | 1419.584 | 1419.588 | 2.9 | |
| GM-AE (anhydro) |1 | 17.44±0.01 | 0.069±0.013 | 678.258 | 678.260 | 2.8 | |
| M-AEm|1 | 4.56±0.01 | 0.062±0.064 | 667.289 | 667.291 | 3.8 | |
| M-AEmKR|1 | 8.16±0.06 | 0.061±0.056* | 951.484 | 951.487 | 3.2 | |
| GM-AEmAA|1 | 11.38±0.04 | 0.059±0.003 | 1012.442 | 1012.445 | 2.4 | |
| M-AEmA|1 | 8.52±0.05 | 0.053±0.015 | 738.325 | 738.328 | 4.0 | |
| GM-GM-AEm|1 | 11.31±0.04 | 0.042±0.025 | 1348.547 | 1348.551 | 2.4 | |
| GM-AEm (deacetyl) |1 | 4.77±0.01 | 0.024±0.014 | 828.358 | 828.360 | 3.0 | |
| GM-GM-AEmKR|1 | 12.18±0.03 | 0.011±0.002* | 1632.742 | 1632.747 | 3.0 | |
| GM-AEmA-GM-AEmA|2 | 16.01±0.02 | 17.247±0.777 | 1864.800 | 1864.805 | 2.3 | |
| GM-AEmA-GM-AEmKR|2 | 14.83±0.02 | 4.589±0.589 | 2077.957 | 2077.964 | 3.0 | |
| GM-AEmA-GM-AEm|2 | 15.09±0.02 | 3.207±0.168 | 1793.763 | 1793.768 | 2.6 | |
| GM-AEmA-GM-AEmA (anhydro) |2 | 20.56±0.01 | 0.873±0.037 | 1844.774 | 1844.778 | 2.4 | |
| GM-AEm-GM-AEmKR|2 | 14.22±0.00 | 0.855±0.101 | 2006.920 | 2006.926 | 3.3 | |
| GM-AEmA-GM-AEmKR (anhydro) |2 | 18.89±0.17 | 0.665±0.079 | 2057.934 | 2057.937 | 1.8 | |
| GM-AEm-GM-AEm|2 | 14.23±0.01 | 0.558±0.062 | 1722.725 | 1722.730 | 3.0 | |
| GM-AEm-GM-AEmAG|2 | 14.68±0.01 | 0.416±0.025 | 1850.785 | 1850.789 | 2.4 | |
| GM-AEmA-GM-AEm (anhydro) |2 | 19.66±0.01 | 0.381±0.028 | 1773.738 | 1773.741 | 2.1 | |
| Dimers | GM-AEmA-GM-AEmAG|2 | 15.33±0.02 | 0.179±0.005 | 1921.822 | 1921.826 | 2.2 |
| 29.54%±0.46% | GM-AEm-GM-AEmKR (anhydro) |2 | 18.07±0.01 | 0.170±0.024 | 1986.896 | 1986.900 | 2.1 |
| GM-AEm-GM-AEm (anhydro) |2 | 18.77±0.01 | 0.141±0.015 | 1702.697 | 1702.704 | 4.5 | |
| GM-AEmA-GM-AEmAA|2 | 16.54±0.01 | 0.075±0.002 | 1935.838 | 1935.842 | 2.1 | |
| GM-AEm-GM-AEmG|2 | 13.91±0.01 | 0.054±0.003 | 1779.747 | 1779.752 | 2.7 | |
| GM-GM-AEmA-GM-AEmA|2 | 17.51±0.01 | 0.046±0.028 | 2342.976 | 2342.985 | 3.6 | |
| GM-AEmA-GM-AEmA (deacetyl) |2 | 15.17±0.01 | 0.029±0.022 | 1822.789 | 1822.794 | 3.0 | |
| GM-AEmA-GM-AEmG (anhydro) |2 | 19.12±0.01 | 0.021±0.001 | 1830.761 | 1830.763 | 0.7 | |
| GM-AEmA-GM-AEmAG (anhydro) |2 | 19.73±0.01 | 0.019±0.002 | 1901.796 | 1901.800 | 2.1 | |
| GM-AEmA-GM-AEmAA (anhydro) |2 | 21.17±0.02 | 0.015±0.002 | 1915.812 | 1915.816 | 1.8 | |
| GM-GM-AEmA-GM-AEm|2 | 16.85±0.00 | 0.003±0.004 | 2271.943 | 2271.947 | 2.1 | |
| GM-AEmA-GM-AEmA-GM-AEmA|3 | 18.86±0.01 | 1.751±0.221 | 2788.192 | 2788.202 | 3.5 | |
| GM-AEmA-GM-AEmA-GM-AEm|3 | 18.23±0.21 | 0.371±0.031 | 2717.158 | 2717.164 | 2.2 | |
| GM-AEmA-GM-AEmA-GM-AEmA (anhydro) |3 | 22.39±0.02 | 0.222±0.027 | 2768.169 | 2768.175 | 2.3 | |
| GM-AEmA-GM-AEmA-GM-AEmKR|3 | 17.54±0.01 | 0.207±0.028 | 3001.350 | 3001.360 | 3.4 | |
| GM-AEmA-GM-AEmA-GM-AEm (anhydro) |3 | 21.60±0.02 | 0.117±0.003 | 2697.133 | 2697.138 | 1.8 | |
| Trimers | GM-AEmA-GM-AEmA-GM-AEmKR (anhydro) |3 | 20.90±0.16 | 0.088±0.026 | 2981.328 | 2981.334 | 2.2 |
| 2.94%±0.36% | GM-AEmA-GM-AEmA-GM-AEmG|3 | 17.72±0.01 | 0.039±0.004 | 2774.182 | 2774.186 | 1.4 |
| GM-AEmA-GM-AEm-GM-AEm|3 | 17.45±0.01 | 0.029±0.005 | 2646.123 | 2646.127 | 1.7 | |
| GM-AEmA-GM-AEm-GM-AEm (anhydro) |3 | 21.16±0.01 | 0.025±0.001 | 2626.096 | 2626.101 | 1.9 | |
| GM-AEmA-GM-AEm-GM-AEmKR|3 | 17.11±0.01 | 0.022±0.002 | 2930.316 | 2930.323 | 2.7 | |
| GM-AEmA-GM-AEmA-GM-AEmAG|3 | 18.24±0.01 | 0.021±0.001 | 2845.217 | 2845.223 | 2.0 | |
| GM-AEmA-GM-AEmA-GM-AEmAA|3 | 19.23±0.01 | 0.014±0.002* | 2859.235 | 2859.239 | 1.3 | |
| GM-AEmA-GM-AEm-GM-AEmKR (anhydro) |3 | 20.31±0.02 | 0.014±0.005 | 2910.293 | 2910.297 | 1.5 | |
| GM-AEm-GM-AEmG-GM-AEmAG|3 | 17.18±0.00 | 0.004±0.005 | 2703.143 | 2703.149 | 2.0 | |
| GM-AEmA-GM-AEm-GM-AEmG (anhydro) |3 | 21.21±0.02 | 0.011±0.003* | 2754.157 | 2754.160 | 1.1 | |
| GM-AEmA-GM-AEmA-GM-AEmAG (anhydro) |3 | 21.77±0.01 | 0.006±0.004 | 2825.189 | 2825.197 | 2.8 | |
-
Inferrred dimers and trimers are based on the most abundant monomers and could correspond to alternative structures.
-
G: GlcNAc; M: MurNAc; m: meso-diaminopimelic acid; the number following the symbol ‘|’ refers to the oligomerisation state (1 for monomers, 2 for dimers, and 3 for trimers).
-
*
Calculated from two values.
-
Table 1—source data 1
E. coli simple mass database.
- https://cdn.elifesciences.org/articles/70597/elife-70597-table1-data1-v1.csv
-
Table 1—source data 2
E. coli matching output and consolidated data.
- https://cdn.elifesciences.org/articles/70597/elife-70597-table1-data2-v1.xlsx
-
Table 1—source data 3
MS/MS analysis of E. coli glycan chains and monomers.
- https://cdn.elifesciences.org/articles/70597/elife-70597-table1-data3-v1.pdf
-
Table 1—source data 4
E. coli complex mass database.
- https://cdn.elifesciences.org/articles/70597/elife-70597-table1-data4-v1.csv
-
Table 1—source data 5
E. coli muropeptide complex table.
- https://cdn.elifesciences.org/articles/70597/elife-70597-table1-data5-v1.xlsx
Table 2
Automated identification of P. aeruginosa peptidoglycan fragments.
| Inferred structure | Mass | ∆ppm | MaxQuant | ||
|---|---|---|---|---|---|
| Theoretical | Observed | This work | Anderson et al. | ||
| GM (anhydro) | 478.1799 | 478.1780 | 4.0 | –2.7 | + |
| GM | 498.2061 | 498.2042 | 3.9 | –4.2 | + |
| GM (x2) (deacetyl) | 934.3755 | 934.3706 | 5.3 | –8.6 | + |
| GM (x2) (anhydro) | 956.3598 | 956.3551 | 5.0 | 6.0 | + |
| GM (x2) | 976.3860 | 976.3794 | 6.7 | –6.1 | + |
| GM (x3) (deacetyl) | 1412.5554 | 1412.5490 | 4.5 | –6.2 | + |
| GM (x3) (anhydro) | 1434.5397 | 1434.5348 | 3.4 | –7.5 | + |
| GM (x3) | 1454.5659 | 1454.5592 | 4.6 | –5.3 | + |
| GM (x4) | 1932.7458 | 1932.7352 | 5.5 | –5.1 | + |
| GM-AE (anhydro) | 678.2596 | 678.2567 | 4.3 | –9.1 | + |
| GM-AE | 698.2858 | 698.2830 | 3.9 | –12.9 | + |
| GM-AEJ (anhydro) | 850.3444 | 850.3401 | 5.1 | –10.6 | + |
| GM-AEJ | 870.3706 | 870.3676 | 3.5 | –5.9 | + |
| GM-AEJA (anhydro) | 921.3815 | 921.3765 | 5.4 | –9.9 | + |
| GM-AEJG | 927.3920 | 927.3868 | 5.6 | –8.9 | + |
| GM-AEJA | 941.4077 | 941.4045 | 3.4 | –5.0 | + |
| GM-AEJC | 973.3843 | 973.3763 | 8.2 | –2072.2 | + |
| GM-AEJL | 983.4593 | 983.4498 | 9.6 | –15.5 | + |
| GM-AEJK | 998.4703 | 998.4624 | 8.0 | –10.6 | + |
| GM-AEJM | 1001.4153 | 1001.4060 | 9.2 | –13.5 | + |
| GM-AEJAA | 1012.4448 | 1012.4413 | 3.4 | –7.8 | + |
| GM-AEJY (anhydro) | 1013.4091 | 1013.4242 | –14.9 | 17.8 | + |
| GM-AEJF | 1017.4433 | 1017.4347 | 8.4 | –15.0 | + |
| GM-AEJY | 1033.4353 | 1033.4278 | 7.2 | –5.3 | + |
| GM-AEJAV | 1040.4808 | 1040.4716 | 8.8 | –14.7 | + |
| GM-AEJIA | 1054.4964 | 1054.4874 | 8.5 | –11.3 | + |
| GM-AEJW | 1056.4394 | 1056.4455 | –5.8 | 4.0 | + |
| GM-AEJAM | 1072.4524 | 1072.4460 | 5.9 | –4.3 | + |
| GM-AEJKR | 1154.5667 | 1154.5631 | 3.1 | –8.1 | + |
| GM-GM-AE | 1176.4836 | 1176.4590 | 20.9 | –24.7 | + |
| GM-GM-AEJ | 1348.5684 | 1348.5457 | 16.9 | –24.9 | + |
| GM-GM-AEJA | 1419.6055 | 1419.5824 | 16.2 | –23.5 | + |
| GM-AEJA-GM-AEJ (amidase product) | 1313.5721 | 1313.5674 | 3.5 | –11.0 | + |
| GM-AEJA-GM-AEJA (amidase product) | 1384.6092 | 1384.6037 | 4.0 | –7.4 | + |
| GM-AEJ-GM-AEJ (anhydro) | 1702.7042 | 1702.6976 | 3.9 | 38.3 | + |
| GM-AEJ-GM-AEJ | 1722.7304 | 1722.7234 | 4.1 | –8.6 | + |
| GM-AEJA-GM-AEJ (double anhydro) | 1753.7151 | 1753.7043 | 6.2 | –7.2 | + |
| GM-AEJA-GM-AEJ (anhydro) | 1773.7413 | 1773.7339 | 4.2 | –11.1 | + |
| GM-AEJA-GM-AEJ | 1793.7675 | 1793.7596 | 4.4 | –8.8 | + |
| GM-AEJA-GM-AEJA (dacetyl) | 1822.7941 | 1822.7808 | 7.3 | –7.4 | + |
| GM-AEJA-GM-AEJA (double anhydro) | 1824.7601 | 1824.7447 | 8.4 | –15.6 | + |
| GM-AEJA-GM-AEJA (anhydro) | 1844.7784 | 1844.7704 | 4.3 | –8.3 | + |
| GM-AEJA-GM-AEJG | 1850.7889 | 1850.8158 | –14.6 | 9.7 | + |
| GM-AEJA-GM-AEJA | 1864.8046 | 1864.7962 | 4.5 | –6.6 | + |
| GM-AEJA-GM-AEJK (anhydro) | 1901.8410 | 1901.8297 | 5.9 | –14.5 | + |
| GM-AEJA-GM-AEJL | 1906.8562 | 1906.8452 | 5.8 | –11.3 | + |
| GM-AEJA-GM-AEJK | 1921.8672 | 1921.8586 | 4.5 | –12.0 | + |
| GM-AEJA-GM-AEJF | 1940.8402 | 1940.8263 | 7.2 | –8.8 | + |
| GM-AEJA-GM-AEJY | 1956.8322 | 1956.8210 | 5.7 | –7.6 | + |
| GM-AEJA-GM-AEJAL | 1977.8933 | 1977.8813 | 6.0 | –10.7 | + |
| GM-AEJA-GM-AEJKR | 2077.9636 | 2077.9589 | 2.2 | –13.0 | + |
| GM-GM-AEJ-GM-AEJ | 2200.9282 | 2200.9000 | 12.8 | –17.7 | + |
| GM-GM-AEJA-GM-AEJ | 2271.9653 | 2271.9368 | 12.6 | –18.4 | + |
| GM-GM-AEJA-GM-AEJA | 2343.0024 | 2342.9734 | 12.4 | 411.4 | + |
| GM-AEJA-GM-AEJA-GM-AEJ (double anhydro) | 2677.1120 | 2677.1000 | 4.5 | –10.7 | + |
| GM-AEJA-GM-AEJA-GM-AEJ (anhydro) | 2697.1382 | 2697.1259 | 4.6 | –8.6 | + |
| GM-AEJA-GM-AEJA-GM-AEJ | 2717.1644 | 2717.1532 | 4.1 | –10.7 | + |
| GM-AEJA-GM-AEJA-GM-AEJA (double anhydro) | 2748.1491 | 2748.1363 | 4.7 | –11.0 | + |
| GM-AEJA-GM-AEJA-GM-AEJA (anhydro) | 2768.1753 | 2768.1674 | 2.9 | –11.2 | + |
| GM-AEJA-GM-AEJA-GM-AEJA | 2788.2015 | 2788.1919 | 3.4 | –9.7 | + |
| GM-AEJA-GM-AEJA-GM-AEJK (anhydro) | 2825.2379 | 2825.2205 | 6.1 | –9.3 | + |
| GM-GM-AEJA-GM-AEJA-GM-AEJ | 3195.3622 | 3195.3264 | 11.2 | –14.0 | + |
| GM-GM-AEJA-GM-AEJA-GM-AEJA | 3266.3993 | 3266.3630 | 11.1 | –12.5 | + |
-
Alternative structures were matched:
-
GM-AEJ-GM-AEJK.
-
GM-AEJ-GM-AEJKA (anhydro).
-
GM-AEJ-GM-AEJKA.
-
GM-AEJ-GM-AEJA-GM-AEJKA (anhydro).
-
Table 2—source data 1
Pseudomonas aeruginosa matched muropeptides not reported previously.
- https://cdn.elifesciences.org/articles/70597/elife-70597-table2-data1-v1.xlsx
-
Table 2—source data 2
Raw output of automated search using MaxQuant and PGFinder.
- https://cdn.elifesciences.org/articles/70597/elife-70597-table2-data2-v1.xlsx
Key resources table
| Reagent type (species) or resource | Designation | Source or reference | Identifiers | Additional information |
|---|---|---|---|---|
| Strain, strain background(Escherichia coli) | BW25113 | https://doi.org/10.1073/pnas.120163297 | RRID:Addgene_72340 | Model strain for PG analysis |
| Strain, strain background(Clostridioides difficile) | R20291 | https://doi.org/10.1128/JB.0073107 | Model strain for PG analysis | |
| Strain, strain background(Clostridioides difficile) | M7404 | https://doi.org/10.1371/journal.ppat.1002317 | Model strain for PG analysis | |
| Software, algorithm | PGFinderv.0.02 | This work | Used for MS1 analysis of PG structure | |
| Software, algorithm | Byosv.3.9–32 | Protein Metrics Inc | Used for MS data deconvolution and MS/MS analysis | |
| Software, algorithm | MaxQuant v2.0.1.0 | Cox and Mann, 2008 | RRID:SCR_014485 | Used for MS data deconvolution |
| Software, algorithm | Perseusv.1.6.10.53 | Tyanova et al., 2016 | RRID:SCR_015753 | Used statistical analysis of muropeptide abundance |
Additional files
-
Transparent reporting form
- https://cdn.elifesciences.org/articles/70597/elife-70597-transrepform1-v1.docx
-
Supplementary file 1
Step by step strategy for PG analysis.
- https://cdn.elifesciences.org/articles/70597/elife-70597-supp1-v1.pdf
Download links
A two-part list of links to download the article, or parts of the article, in various formats.
Downloads (link to download the article as PDF)
Open citations (links to open the citations from this article in various online reference manager services)
Cite this article (links to download the citations from this article in formats compatible with various reference manager tools)
PGFinder, a novel analysis pipeline for the consistent, reproducible, and high-resolution structural analysis of bacterial peptidoglycans
eLife 10:e70597.
https://doi.org/10.7554/eLife.70597


