TRPC3 and NALCN channels drive pacemaking in substantia nigra dopaminergic neurons
- Department of physiology, Sungkyunkwan University School of Medicine, Republic of Korea
- Neurobiology Laboratory. National Institute of Environmental Health Sciences, North Carolina 27709, USA; and Institute of Biomedical Research (BIOMED), Catholic University of Argentina, Argentina
- Samsung Biomedical Research Institute, Samsung Medical Center, Republic of Korea
Figures
Figure 1 with 2 supplements
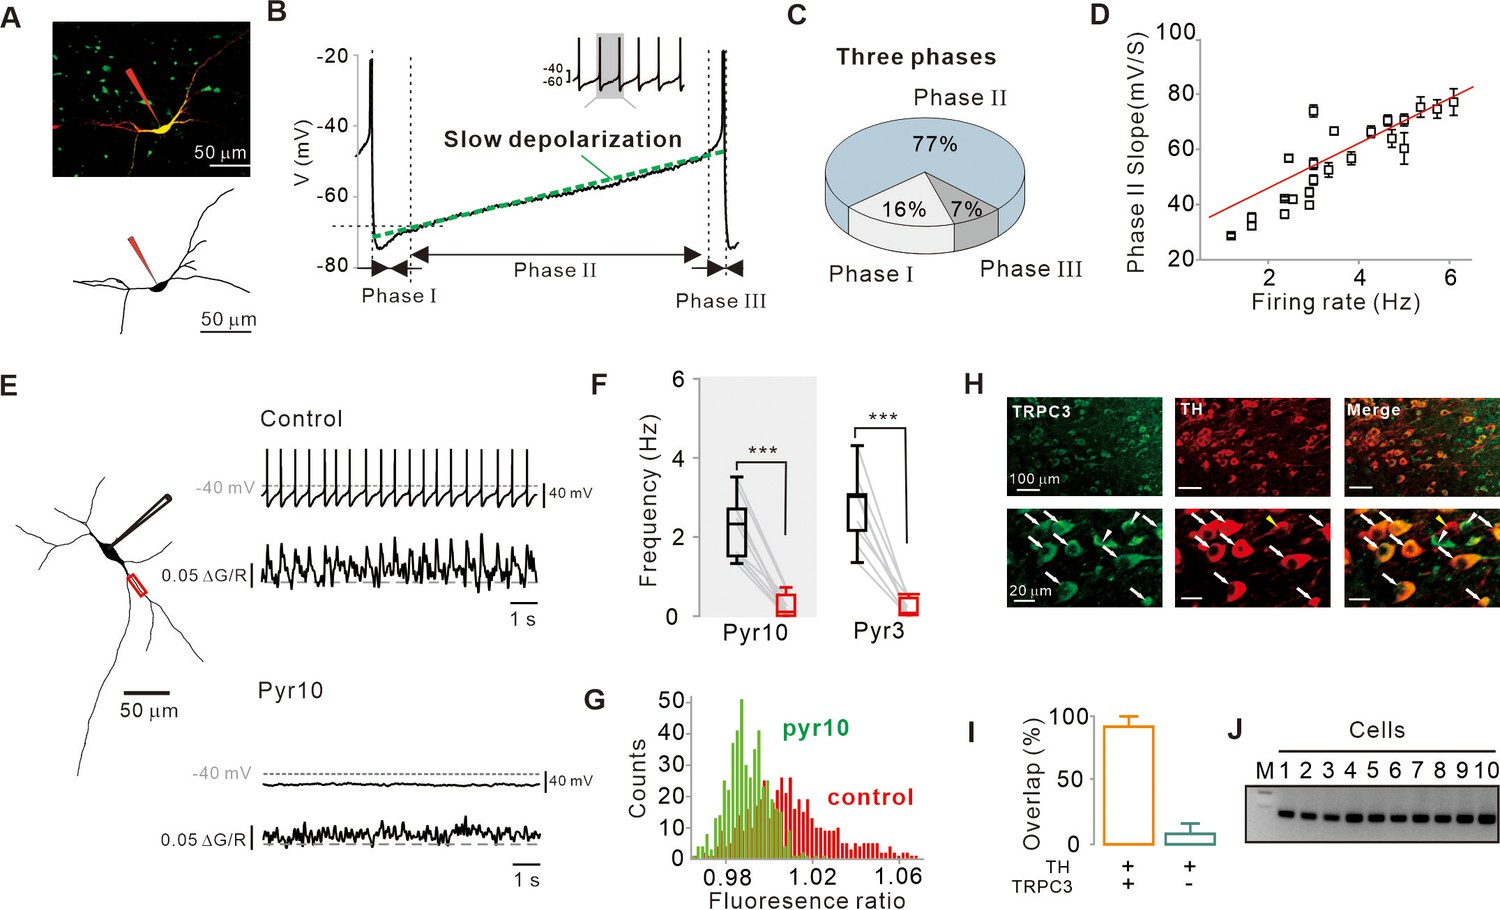
Importance of subthreshold slow depolarization and TRPC3 channels in the pacemaking of SNc DA neurons.
(A) Projection (top) and 3D reconstruction (bottom) images of TH-positive dopamine neurons from SNc slices filled with Alexa-594 and Fluo-4 through a whole-cell patch pipette. (B) Representative voltage trajectory during the inter-spike interval reveals three phases of slow depolarization for pacemaking of SNc dopamine neurons in midbrain slices. Inset, a longer period of pacemaking in the same neurons. (C) Pie chart showing the duration of each phase in slow depolarization (n = 20 from 12 mice). (D) Slope of slow depolarization (determined as in (B), green line) plotted against firing frequency (n = 23 from 15 mice). Red line is the best fitting line by linear regression. (E) Whole-cell recording from dopamine neurons in midbrain slices (left) and Ca2+ imaging at dendritic locations (left, red rectangle). Pyr10 (50–100 μM) inhibited both spontaneous firing (right, top) and dendritic Ca2+ oscillations (right, bottom). Representative traces were obtained from the same neuron. (F) Summary plot showing inhibition of firing frequency by pyr10 (n = 11 from 7 mice, ***p<0.0001) and pyr3 (n = 9 from 5 mice, ***p<0.0001). Black: control, red: after drug application. (G) All-points histogram of Ca2+ fluorescence shows that the fluorescence oscillation was reduced by pyr10. (H) Double immunofluorescence staining images for TRPC3 (left, green), TH (middle, red), and merge (right) from the SNc. Arrows indicate co-expression of TRPC3 and TH, while arrowheads indicate cells expressing only TRPC3 without TH. (I) Histogram for co-expression of TRPC3 and TH in SNc neurons (from three mice). (J) TRPC3 RT-PCR profiles from single dopamine neurons. All statistical data were analyzed by one-way ANOVA.
-
Figure 1—source data 1
Source data of each group in Figure 1.
- https://cdn.elifesciences.org/articles/70920/elife-70920-fig1-data1-v2.xlsx
Figure 1—figure supplement 1

Pharmacological examination of potential ion channels affecting the pacemaking activities of nigral dopamine neurons.
(A) Representative traces of the current-clamp recordings before and after applying isradipine (5 μM, top), ZD-7288 (20 μM, middle), and both (bottom), respectively. Traces showing the effect of each blocker were obtained from the same neuron. (B) Summary of the effects of isradipine (n = 9 from 5 mice), ZD-7288 (n = 5 from 5 mice), and both (n = 6 from 4 mice) on spontaneous firing rate (for all data, p>0.5). (C) SKF-96365 (50 μM, top) and 2-APB (100 μM, bottom) stopped pacemaking. Traces showing the effect of each blocker were obtained from the same neuron. (D) Summary of changes in spontaneous firing rate after applications of SKF-96365 (n = 6 from 4 mice, ***p<0.001) and 2-APB (n = 5 from 5 mice, *p<0.05) (black, control; red, after drug application). (E) Voltage trajectories (top, 10 firing cycles averaged) and subtracted traces (bottom) of the membrane potential during the interspike intervals before and after the application of isradipine (5 μM). Note the reductions of both hyperpolarization in phase I (blue area) and depolarization in phase III (red area). (F) Voltage trajectories (10 firing cycles averaged) and subtracted traces (bottom) of the membrane potential during the interspike intervals before and after application of ZD-7288 (top, 20 μM). Note the increase of the hyperpolarization in the phase I (blue area). (G) Box plots summarizing the changes of the membrane potentials by ZD-7288 or isradipine (ZD-7288, n = 5 from 4 mice, *p<0.05; isradipine n = 6 from 4 mice, all phases, *p<0.05) in phase I (blue) and phase III (red) of the slow depolarization. All statistical data were analyzed by one-way ANOVA.
-
Figure 1—figure supplement 1—source data 1
Source data of each group in Figure 1—figure supplement 1.
- https://cdn.elifesciences.org/articles/70920/elife-70920-fig1-figsupp1-data1-v2.xlsx
Figure 1—figure supplement 2
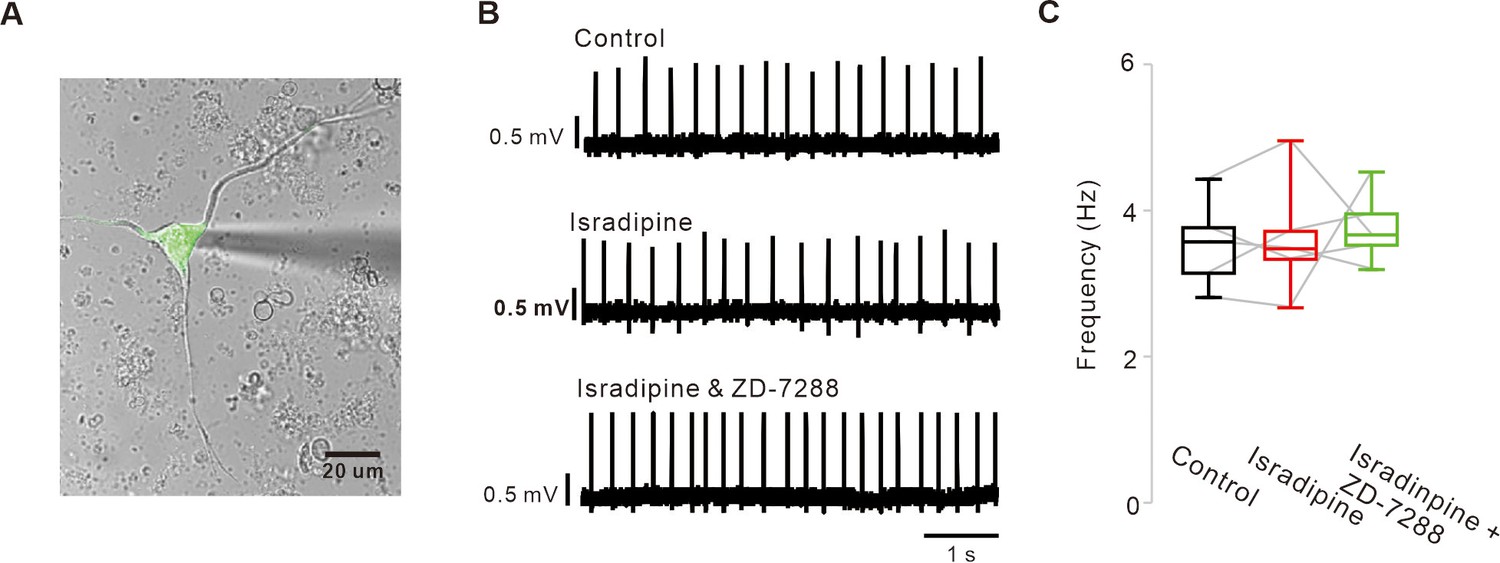
Blockade of L-type Ca2+ and HCN channels does not stop the pacemaking of acutely dissociated SNc dopamine neurons.
(A) A representative transmitted image showing an acutely dissociated SNc dopamine neurons attached with a patch pipette. Overlapped by a fluorescence image of TH-GFP (green). (B) Representative traces recorded by the cell-attached patch-clamp recording from acutely dissociated dopamine neurons. Application of isradipine (5 μM) and subsequent addition of ZD-7288 (10 μM) did not slow spontaneous firing rate. (C) Summaries of the data B (n = 5 from 4 mice). p>0.05 for all data. All statistical data were analyzed using one-way ANOVA.
-
Figure 1—figure supplement 2—source data 1
Source data of each group in Figure 1—figure supplement 2.
- https://cdn.elifesciences.org/articles/70920/elife-70920-fig1-figsupp2-data1-v2.xlsx
Figure 2 with 1 supplement

Abolition of pacemaking activity by TRPC3 blockade and its resumption by compensating leak-like current injection.
(A) Voltage traces from SNc dopamine neurons in the midbrain slices (left). Pyr10 (left, black trace, 50 μM) completely inhibited spontaneous firing, but it was rescued by somatic linear current injection (left, red trace). Representative voltage traces were obtained from the same neuron. Pacemaking activities under the presence of pyr10 were gradually revived by slow ramp-current injection (right upper). No significant shape changes between control and revived action potentials (APS, right bottom). (B) Box plots for pacemaking frequencies from data in a (n = 6 from 3 mice). ***p<0.0001 for control versus 0 pA; ***p<0.001 for control versus +20 pA; p>0.5 for control versus +40 pA. (C) Changes of membrane potentials in SNc dopamine neurons by L-type calcium channel blockade after TTX (0.5 μM) treatment (isradipine 5 μM). (D) Application of pyr10 (50 μM) hyperpolarized the membrane potential in the presence of TTX. (E) Summary of membrane potential changes by TTX (n = 7 from 6 mice), TTX and isradipine (n = 5 from 3 mice), and TTX and pyr10 (n = 6 from 3 mice). **p<0.01 for TTX versus TTX and isradipine; ***p<0.001 for TTX versus TTX and pyr10; ***p<0.001 for TTX versus NMDG. All statistical data were analyzed by one-way ANOVA.
-
Figure 2—source data 1
Source data of each group in Figure 2.
- https://cdn.elifesciences.org/articles/70920/elife-70920-fig2-data1-v2.xlsx
Figure 2—figure supplement 1
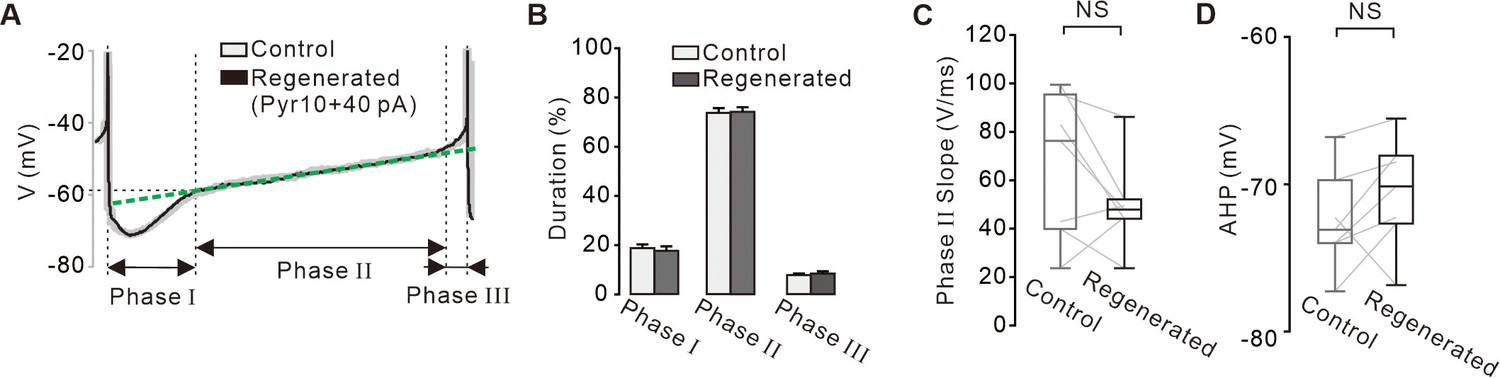
Comparisons of time courses of the action potentials between the control and regenerated firings under the inhibition of TRPC3 channels.
(A) Representative voltage traces during the inter-spike interval reveals and three phases of the slow depolarization. Control voltage traces (gray) was overlapped with the firing regenerated by current injection (+40 pA, black) after blockade of TRPC3 channels. Green dotted line indicates the slope of the slow depolarization. (B) Histogram showing the durations of three phases between the control (gray) and regenerated firings (black) (n = 7 from 4 mice). p>0.5 for all data between control and regenerated. (C) Box plots showing slopes of the slow depolarization in phase II between control and regenerated firings (n = 7 from 4 mice, p=0.14). (D) Box plots showing the minimum peak of the afterhyperpolarization potential (AHP) between in control and regenerated firings (n = 7 from 4 mice, p=0.34). All statistical data were analyzed using one-way ANOVA. NS indicates no statistically significant difference.
-
Figure 2—figure supplement 1—source data 1
Source data of each group in Figure 2—figure supplement 1.
- https://cdn.elifesciences.org/articles/70920/elife-70920-fig2-figsupp1-data1-v2.xlsx
Figure 3 with 4 supplements
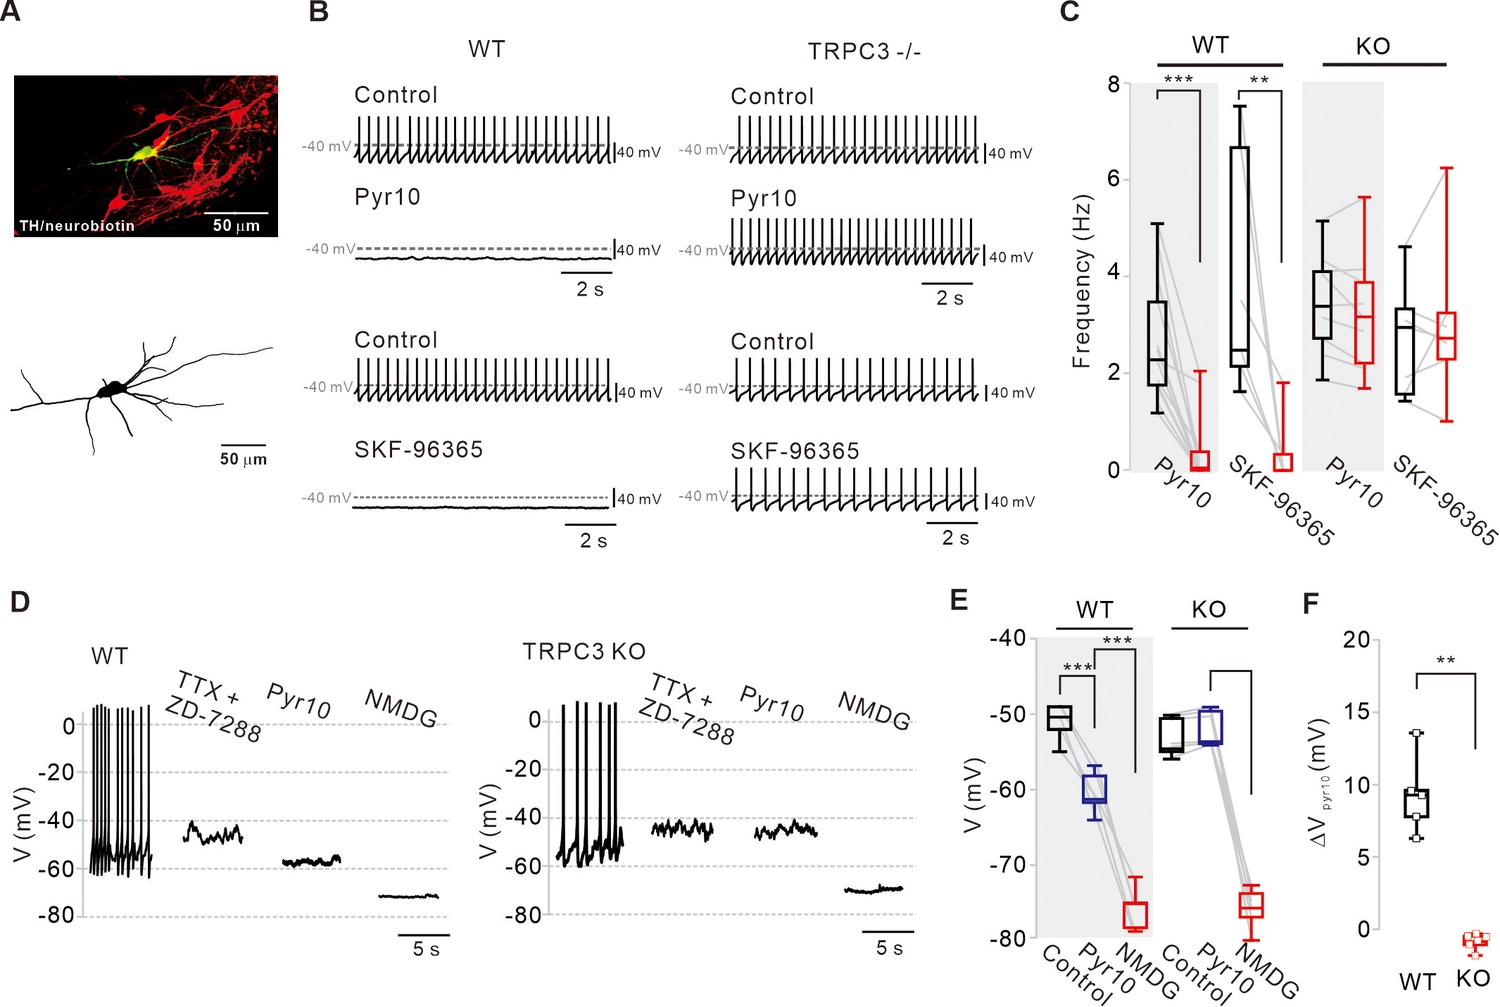
Different effects of TRPC blockers on the pacemaking activities of DA neurons in wild-type and TRPC3 KO mice.
(A) Dopamine neurons were identified from SNc slices by post hoc staining (top) for TH (red) and neurobiotin (green) in TRPC3 knockout (KO) and wild-type (WT) mice. The lower image is a 3D reconstructed dopamine neuron that was previously recorded with a patch pipette (bottom). (B) Application of pyr10 (50 μM) or SKF-96365 (20 μM) inhibited the pacemaking of dopamine neurons in midbrain slices from WT (left) mice, but not from TRPC3 KO mice (right). Traces showing the effect of each blocker were obtained from the same neuron. (C) Summary plots for the effects of pyr10 or SKF-96365 on the spontaneous firing frequency from WT (pyr10, n = 13 from 11 mice, ***p<0.001; SKF-96365, n = 6 from 6 mice, **p<0.01) and TRPC3 KO (pyr10, n = 9 from 6 mice, p>0.05; SKF-96365, n = 7 from 4 mice, p>0.05) mice (black, control; red, after drug application). (D) Different effects of pyr10 (10 μM) on the membrane potentials in the presence of TTX (0.5 μM) and ZD-7288 (20 μM), measured in acutely dissociated dopamine neurons from WT (left) and TRPC3 KO (right) mice. Representative voltage traces were obtained from the same neuron. (E) Summary of membrane potential changes by pyr10 in the presence of TTX and ZD-7288 in WT (pyr10, n = 5 from 5 mice, ***p<0.001; NMDG, ***p<0.001) and TRPC3 KO (pyr10, n = 6 from 5 mice, p=0.57; NMDG, ***p<0.001). (F) Box plots for membrane potential changes by pyr10 (∆Vpyr10) in WT and TRPC3 KO mice. Data from (E) (**p<0.01). All statistical data were analyzed by one-way ANOVA.
-
Figure 3—source data 1
Source data of each group in Figure 3.
- https://cdn.elifesciences.org/articles/70920/elife-70920-fig3-data1-v2.xlsx
Figure 3—figure supplement 1
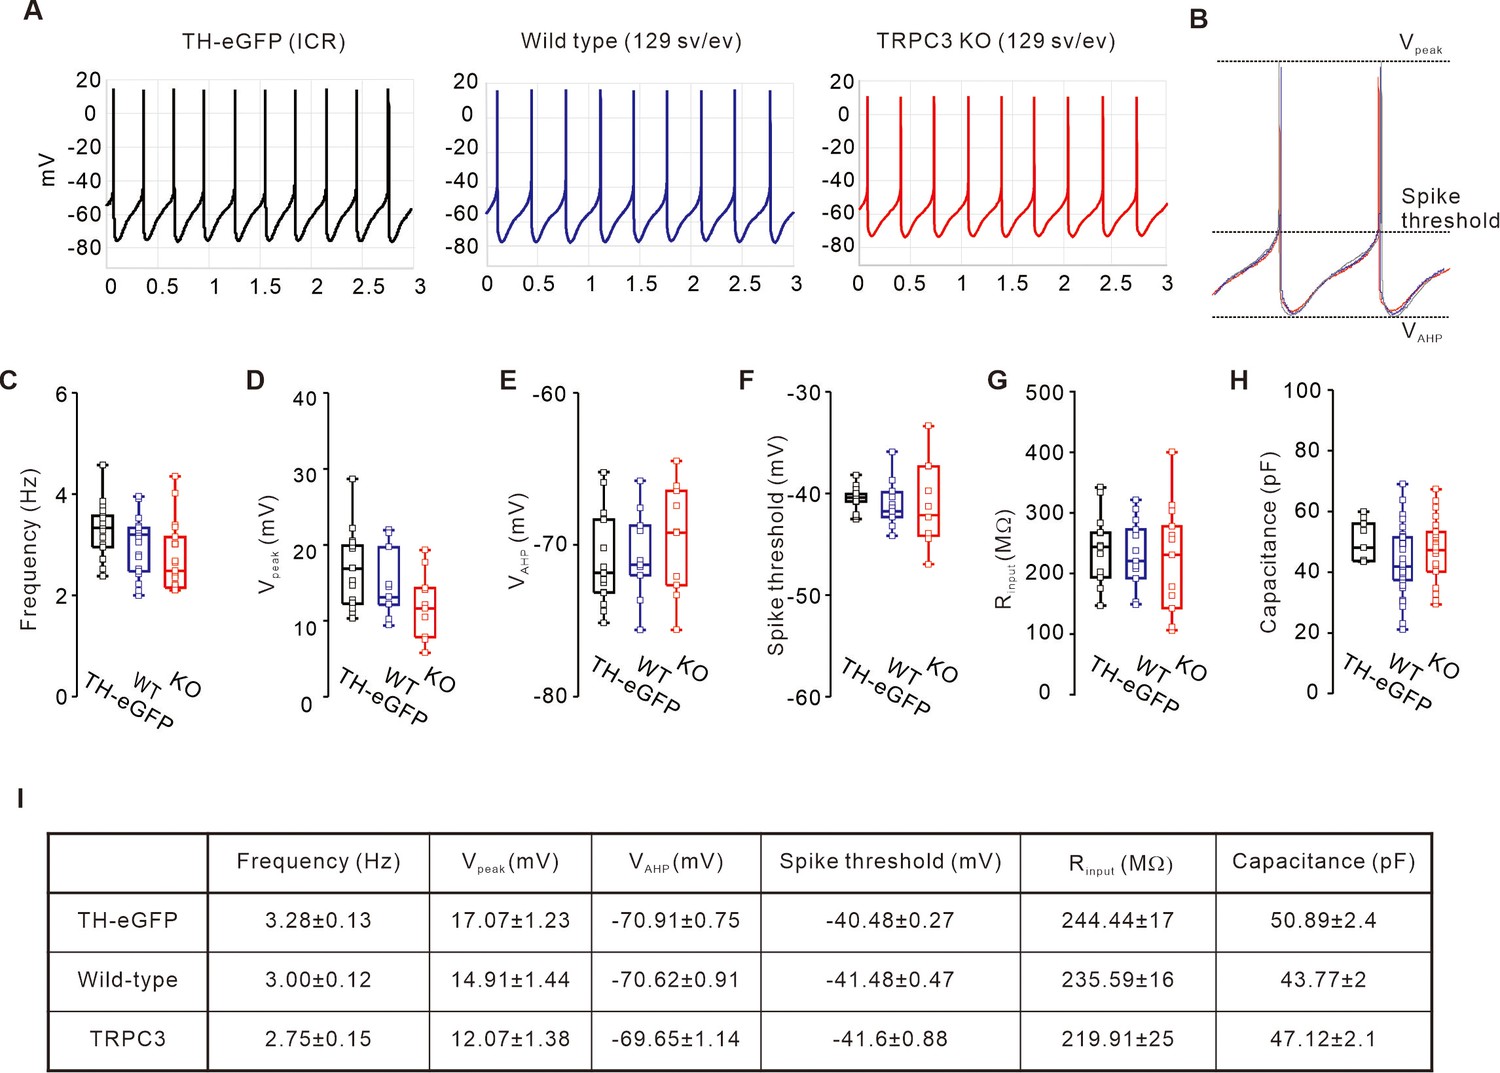
Comparison of electrophysiological properties of DA neurons between TH-GFP, TRPC3 WT, and TRPC3 KO mice.
(A) Representative traces of spontaneous firings from TH-eGFP (ICR, left black), TRPC3 WT (129 sv/ev, center, blue), and TRPC3 KO (129 sv/ev, right, red) mice. (B) Aligning of the normalized spontaneous action potentials traces from TH-eGFP (black), TRPC3 WT (blue), and TRPC3 KO (red). (C) Box plots showing the spontaneous firing frequency of SNc dopamine neurons from TH-eGFP (black, n = 17 from 10 mice), TRPC3 WT (blue, n = 23 from 15 mice), and TRPC3 KO mice (red, n = 23 from 15 mice). (D–F) Comparisons of the peaks of APs (D, Vpeak), the lowest values of afterhyperpolarization (E, VAHP), and spike thresholds (F) from TH-eGFP (black, n = 16 from 10 mice), TRPC3 WT (blue, n = 10 from 8 mice), and TRPC3 KO mice (red, n = 10 from 8 mice). (G) Input resistances of SNc dopamine neurons from TH-eGFP (black, n = 12 from 10 mice), TRPC3 WT (blue, n = 12 from 10 mice), and TRPC3 KO mice (red, n = 13 from 10 mice). (H) Cell capacitances of SNc dopamine neurons from TH-eGFP (black, n = 8 from 8 mice), TRPC3 WT (blue, n = 35 from 12 mice), and TRPC3 KO mice (red, n = 28 from 11 mice). (I) Summary table showing mean values of box plots shown in C-H. p>0.05 for all data. All statistical data were analyzed using one-way ANOVA.
-
Figure 3—figure supplement 1—source data 1
Source data of each group in Figure 3—figure supplement 1.
- https://cdn.elifesciences.org/articles/70920/elife-70920-fig3-figsupp1-data1-v2.xlsx
Figure 3—figure supplement 2
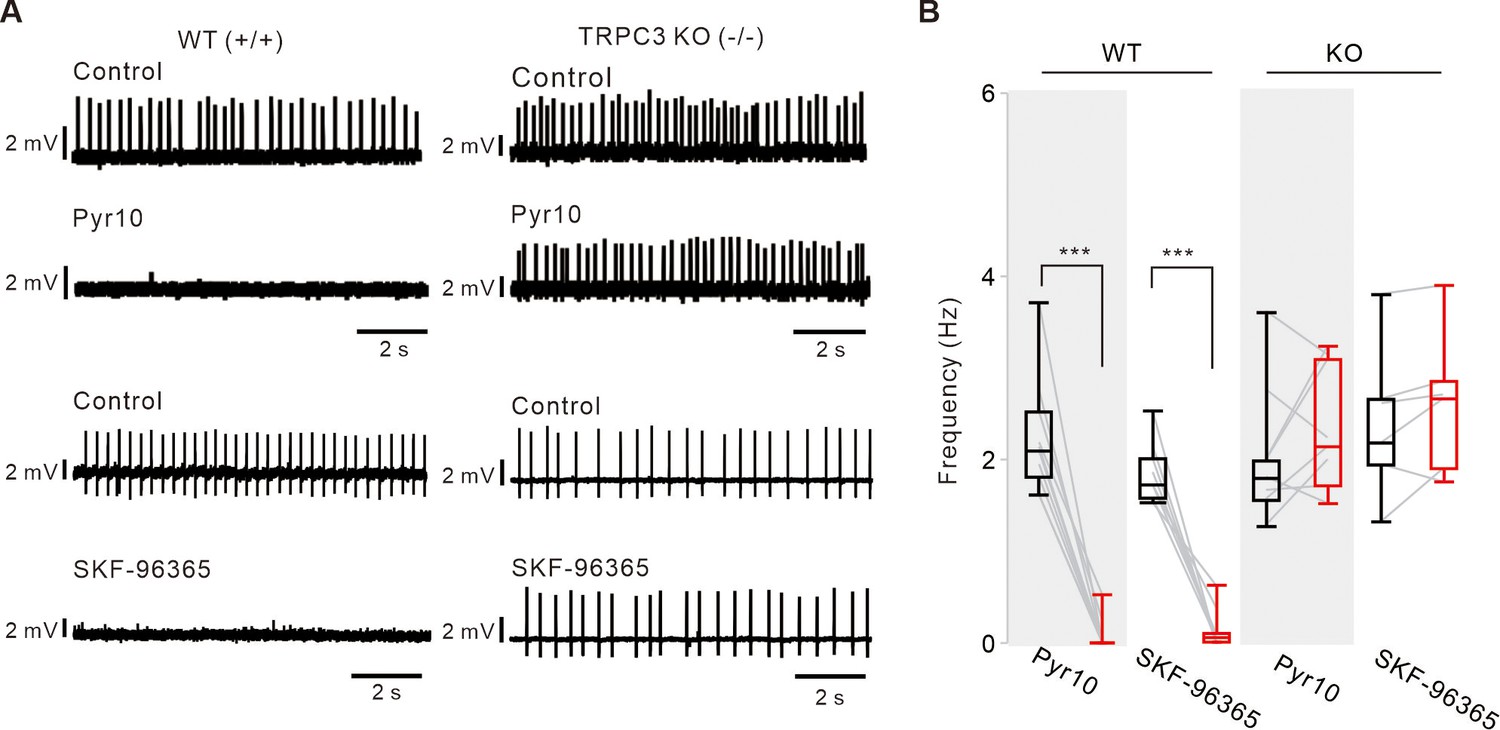
Different effects of TRPC channel blockers on the pacemaking of SNc DA neurons between TRPC3 KO and WT mice.
(A) Representative traces of spontaneous firings of acutely dissociated DA neurons recorded by the cell-attached patch clamp recording from TRPC3 KO and WT mice. Pyr10 (10 μM) or SKF-96365 (10 μM) completely inhibited the spontaneous firing of DA neurons in WT mice (left), but did not inhibit the spontaneous firing of DA neurons in TRPC3 KO (KO, right) mice. Traces showing the effect of each blocker were obtained from the same neuron in WT or KO mice. (B) Box plots summarizing the effects of pyr10 and SKF-96365 on spontaneous firing of DA neurons in WT mice (pyr10, n = 10 from 5 mice, ***p<0.001; SKF-96365, n = 8 from 4 mice, ***p<0.001) and KO mice (pyr10, n = 8 from 6 mice, p>0.4; SKF-96365, n = 6 from 6 mice, p>0.5). Black boxes from control, red boxes from data after drug applications. All statistical data were analyzed using one-way ANOVA.
-
Figure 3—figure supplement 2—source data 1
Source data of each group in Figure 3—figure supplement 2.
- https://cdn.elifesciences.org/articles/70920/elife-70920-fig3-figsupp2-data1-v2.xlsx
Figure 3—figure supplement 3
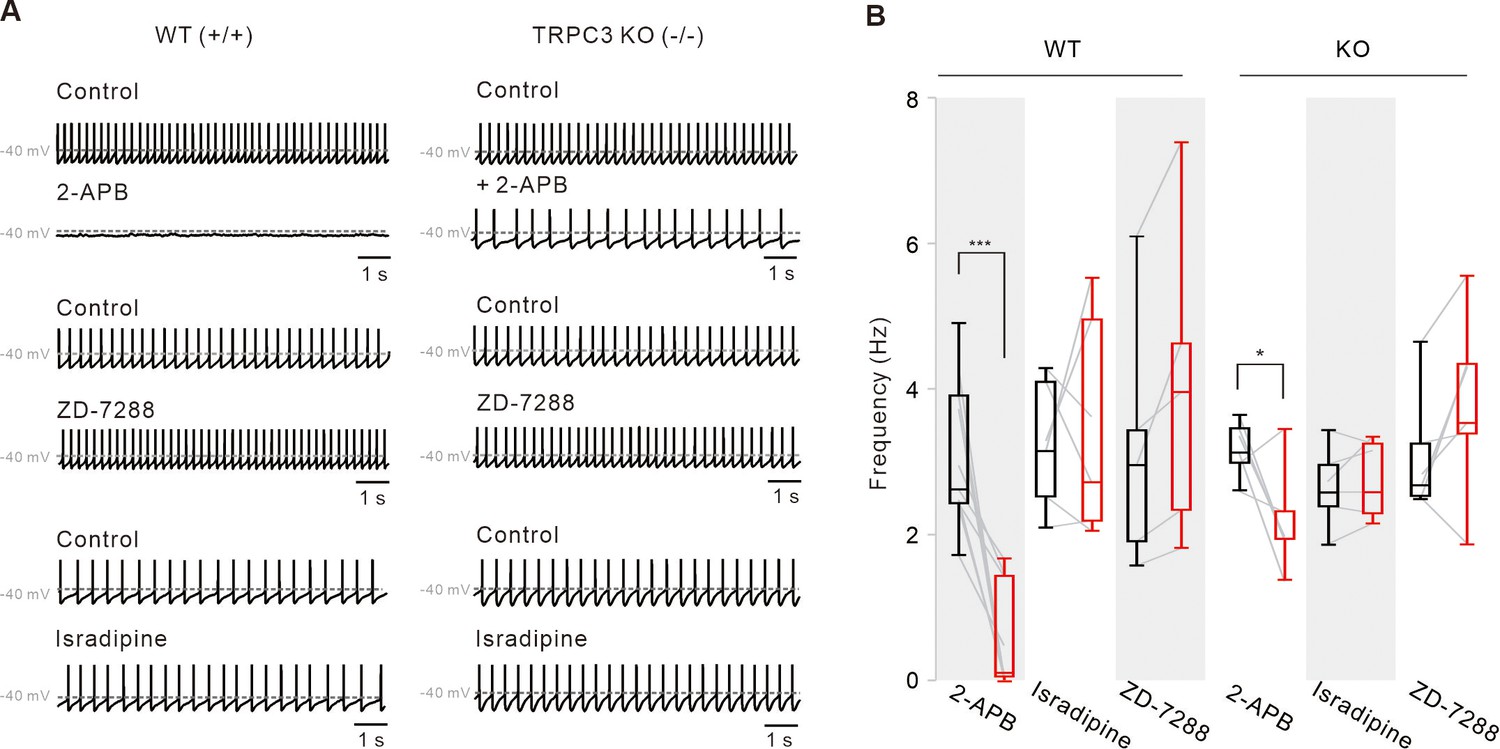
Pharmacological examinations of potential ion channels compensating for the pacemaking of DA neurons in TRPC3 KO mice.
(A) Representative traces of spontaneous firings of SNc DA neurons in the midbrain slices from TRPC3 KO and WT mice. ZD-7288 (100 μM) and isradipine (5 μM) had no effect on the spontaneous firing rate of SNc DA neurons from TRPC3 KO and WT mice. 2-APB (50 μM) completely stopped spontaneous firing in WT mice, but failed to stop it in TRPC3 KO mice. Traces showing the effect of each blocker were obtained from the same neuron in WT or KO mice. (B) Summaries of the spontaneous firing rates of DA neurons. 2-APB (WT, n = 9 from 6 mice ***P < 0.001; KO, n = 6 from 4 mice *P < 0.05), ZD-7288 (WT, n = 5 from 4 mice, P > 0.2; KO, n = 6 from 4 mice, P > 0.5), and isradipine (WT, n = 6 from 5 mice, P > 0.7; KO, n = 6 from 4 mice, P > 0.6; black, control; red, after drug application). All statistical data were analyzed using one-way ANOVA.
-
Figure 3—figure supplement 3—source data 1
Source data of each group in Figure 3—figure supplement 3.
- https://cdn.elifesciences.org/articles/70920/elife-70920-fig3-figsupp3-data1-v2.xlsx
Figure 3—figure supplement 4
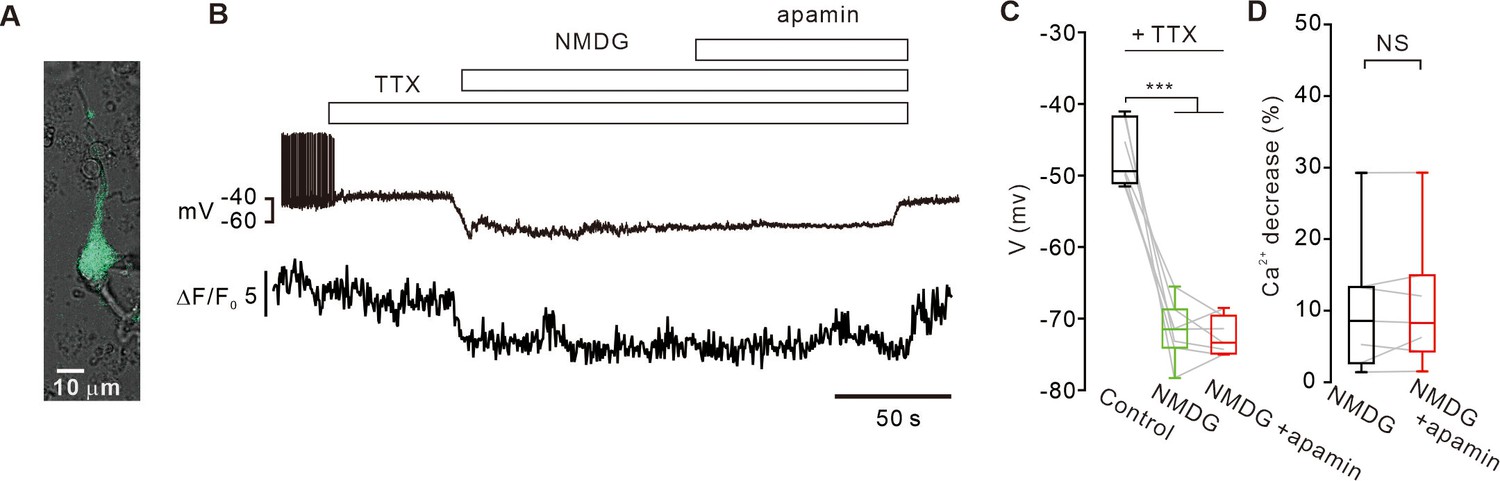
Replacement of extracellular Na+ with NMDG decreases intracellular [Ca2+]c levels and does not activate SK channels in SNc DA neurons.
(A) A representative transmitted image showing an acutely dissociated SNc DA neuron with a patch pipette. Overlapped by a fluorescence image of TH-GFP (green). (B) Representative traces of voltage and [Ca2+]c changes from acutely isolated SNc dopamine neurons. In the presence of TTX (0.5 μM), substitution of extracellular Na+ with NMDG hyperpolarized the membrane potential and decreased [Ca2+]c. After Na+ replacement with NMDG, application of apamin (0.1 μM) had no effect on the membrane potential. (C) Summary of membrane potential changes by Na+ replacement with NMDG and apamin in the presence of TTX (n = 7 from 3 mice). ***p<0.001 for Control (black) versus NMDG (green) or NMDG+ apamin (red). (D) Summaries of changes of [Ca2+]c levels by NMDG (black) or NMDG+ apamin (red) in the presence of TTX (n = 7 from 3 mice, p=0.93). All statistical data were analyzed using one-way ANOVA. NS indicates no statistically significant difference.
-
Figure 3—figure supplement 4—source data 1
Source data of each group in Figure 3—figure supplement 4.
- https://cdn.elifesciences.org/articles/70920/elife-70920-fig3-figsupp4-data1-v2.xlsx
Figure 4 with 2 supplements
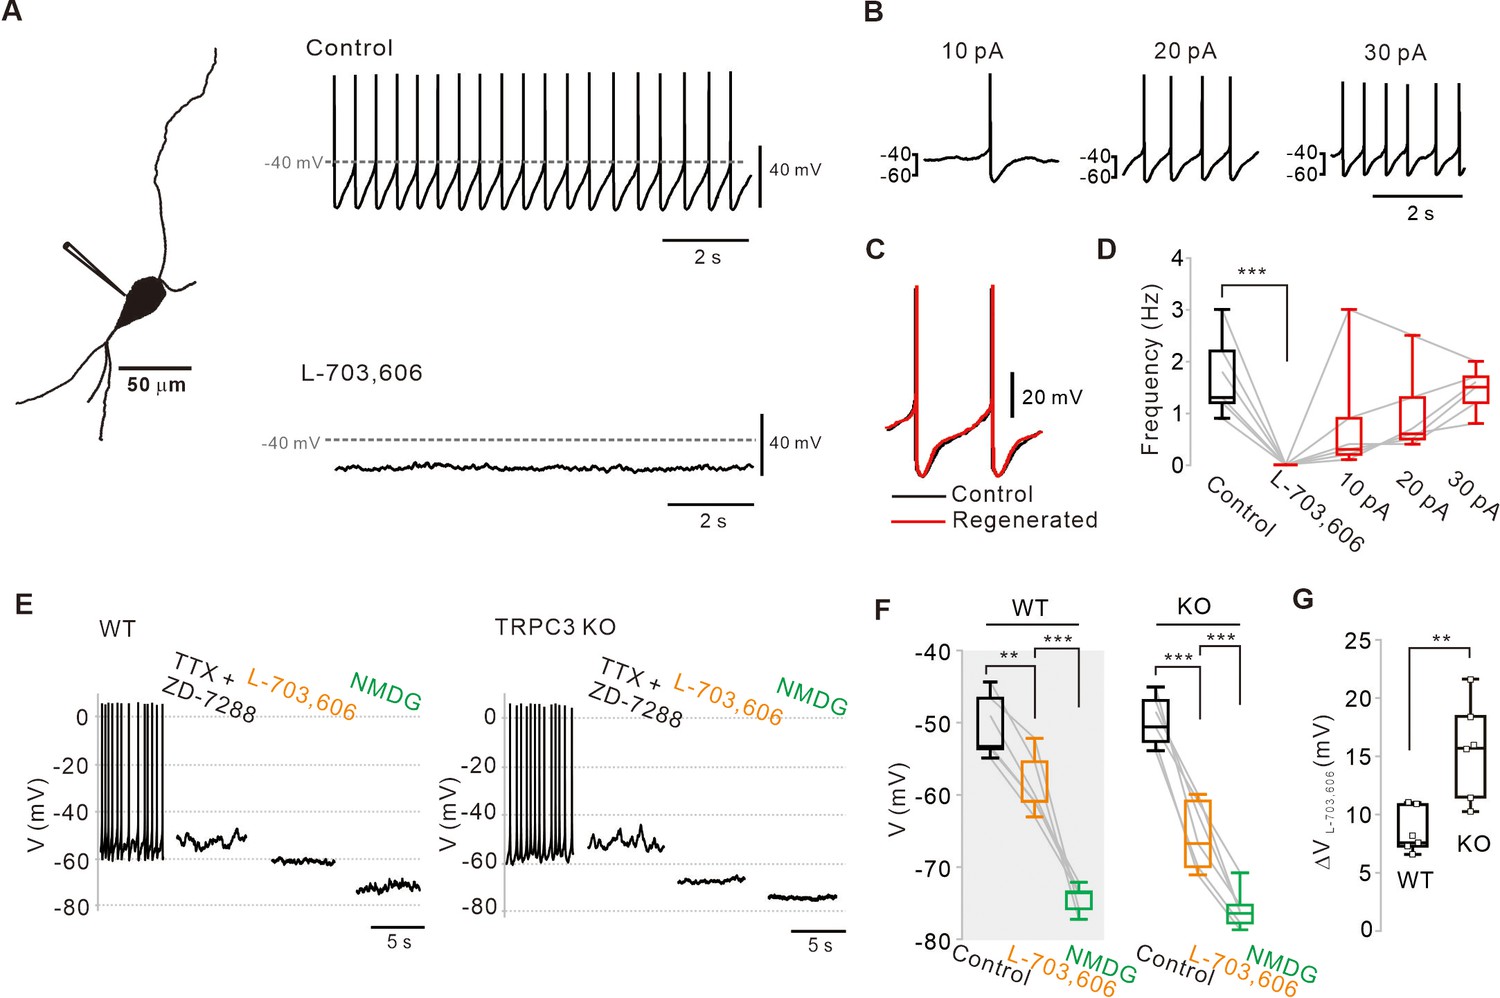
Abolition of pacemaking activity by NALCN channel blockers and its resumption by compensating leak-like current injection.
(A) A 3D reconstruction image of an SNc dopamine neuron in a midbrain slice with a whole-cell patch pipette. Application of L-703,606 (10 μM) inhibited spontaneous firing. Representative voltage traces were obtained from the same neuron. (B) Spontaneous firing in the presence of L-703,606 was gradually rescued by somatic linear current injection (n = 6 from 4 mice). (C) Alignment of AP waveforms (normalized with time) between control (black) and regenerated (red, +30 pA). No significant changes in the shapes between control and revived APs. (D) Box plots for pacemaking frequencies before and after L-703,606 treatment and during somatic current injections in the presence of L-703,606 in SNc dopamine neurons (n = 6 from 4 mice). ***p<0.001 for control versus L-703,606; p>0.1 for control versus +10, +20, and +30 pA. (E) Representative traces for membrane potential changes in acutely dissociated dopamine neurons by L703,606 (5 μM) in the presence of TTX (0.5 μM) and ZD-7288 (20 μM) between wild-type (left, n = 6 from 4 mice) and TRPC3 KO mice (right, n = 6 from 4 mice). (F) Summary of membrane potential changes by L-703,606 in the presence of TTX and ZD-7288 in WT and KO. **p>0.01 for TTX and ZD-7288 versus L-703,606 from WT; ***p<0.001 for L-703,606 versus NMDG from WT; ***p<0.001 for TTX and ZD-7288 versus L-706,606 from TRPC3 KO; ***p<0.001 for L-703,606 versus NMDG from TRPC3 KO. (G) Summary plots for voltage differences (∆VL-703,606) changed by L-703,606 between WT and KO mice (**p<0.01). All statistical data were analyzed by one-way ANOVA.
-
Figure 4—source data 1
Source data of each group in Figure 4.
- https://cdn.elifesciences.org/articles/70920/elife-70920-fig4-data1-v2.xlsx
Figure 4—figure supplement 1

NALCN channel blockers stopped the pacemaking of acutely dissociated SNc DA neurons.
(A) A representative transmitted image showing acutely dissociated SNc DA neurons attached with a patch pipette. Overlapped by a fluorescence image of TH-GFP (green). (B) Representative traces of spontaneous firing recorded by the cell-attached voltage-clamp recordings. Application of L-703,606 (5 μM) inhibited spontaneous firing of acutely dissociated SNc dopamine neurons, reversibly and completely (top). Extended traces from (a) and (b) from the top trace (bottom). (C) Summaries of the spontaneous firing inhibitions by L-703,606 in acutely dissociated dopamine neurons (n = 14 from 6 mice, ***p<0.001). All statistical data were analyzed using one-way ANOVA.
-
Figure 4—figure supplement 1—source data 1
Source data of each group in Figure 4—figure supplement 1.
- https://cdn.elifesciences.org/articles/70920/elife-70920-fig4-figsupp1-data1-v2.xlsx
Figure 4—figure supplement 2

Comparisons of time courses of the action potentials between the control and regenerated firings under the inhibition of NALCN channels.
(A) Representative voltage traces during the inter-spike interval reveals three phases of slow depolarization. Voltage trace (gray) of control firing was overlapped with that of the firing regenerated by current injection ( +30 pA, black) after blockade of NALCN channels. Green dotted line indicates the slope of the slow depolarization. (B) Histogram showing the durations of three phases between the control (gray) and regenerated firings (black) (n = 5 from 3 mice). p>0.5 for all data between the control and regenerated firings. (C) Box plots showing slopes of the slow depolarization in phase II between the control and regenerated firings (n = 5 from 3 mice, p=0.77). (D) Box plots showing the lowest values of the afterhyperpolarization potential (AHP) between in control and regenerated firings (n = 5 from 3 mice, p=0.67). All statistical data were analyzed using one-way ANOVA. NS indicates no statistically significant difference.
-
Figure 4—figure supplement 2—source data 1
Source data of each group in Figure 4—figure supplement 2.
- https://cdn.elifesciences.org/articles/70920/elife-70920-fig4-figsupp2-data1-v2.xlsx
Figure 5
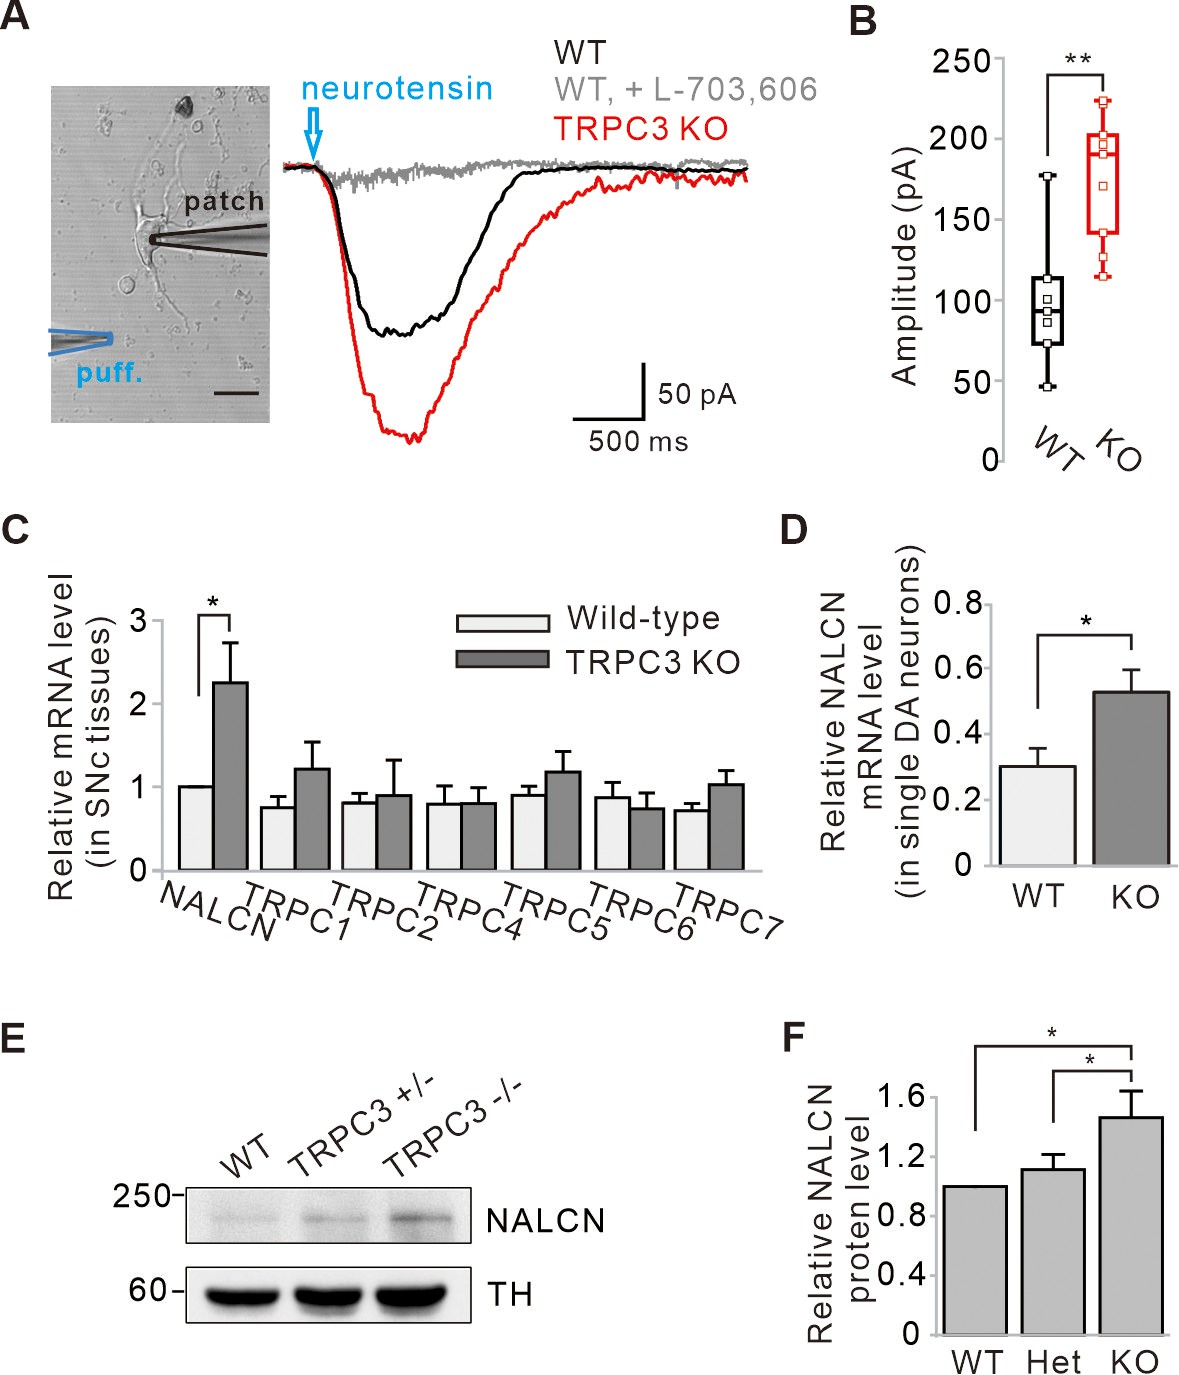
Enhancement of NALCN currents and mRNA and protein expressions in SNc dopamine neurons of TRPC3 KO mice.
(A) An acutely dissociated dopamine neuron from the SNc was whole-cell patched and neurotensin (NT, 10 μM) was applied to dendritic compartments by a micro-puff system (left, blue, duration = 1). The NT-evoked NALCN currents were larger in the TRPC3 KO mice (red, n = 9 from 4 mice) than in the wild-type mice (black, n = 7 from 5 mice). Holding potential = –60 mV. (B) Summary of the current amplitudes evoked by NT in WT and TRPC3 KO (KO). p=0.0019 for WT versus TRPC3 KO. (C) Bar graphs showing the relative mRNA levels of NALCN and TRPC channels in SNc tissues from WT and TRPC3 KO mice (n = 5 mice). *p<0.05 for wild type versus TRPC3 KO from NALCN. (D) Relative NALCN mRNA levels of single SNc dopamine neurons between WT (n = 36 from 4 mice) and TRPC3 KO mice (n = 37 from 4 mice, *p<0.05). (E) Immunoblotting of TH (top) and NALCN (bottom) showing expression levels of NALCN protein in SNc tissues of wild-type, TRPC3 hetero (+/−) and KO (−/−) mice. (F) Comparisons of expression levels of NALCN protein in SNc tissues of wild-type, TRPC3 hetero and KO mice (n = 3, *p<0.05). All statistical data were analyzed by one-way ANOVA.
-
Figure 5—source data 1
Source data of each group in Figure 5.
- https://cdn.elifesciences.org/articles/70920/elife-70920-fig5-data1-v2.xlsx
Figure 6
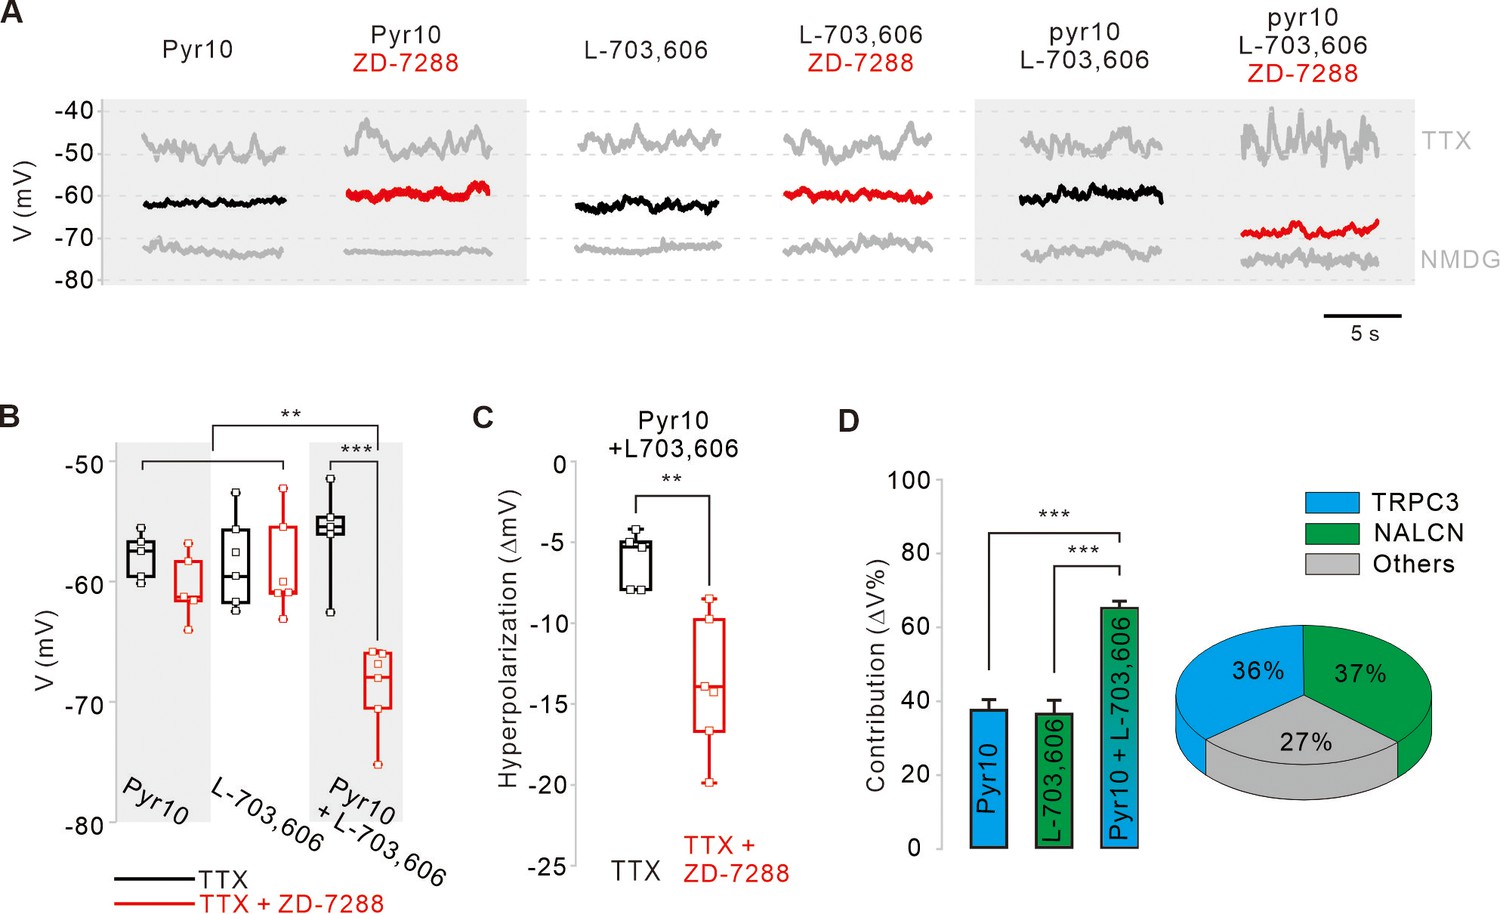
Relative contributions of TRPC3, NALCN, and HCN channels to the subthreshold depolarization of membrane potentials in SNc DA neurons.
(A) Steady-state membrane potentials after treatment of acutely dissociated SNc DA neurons with TTX (0.5 μM) were measured by whole-cell patch-clamp recording. Relative changes of the membrane potentials in the silenced DA neurons by application of pyr10 (10 μM), L-703,606 (5 μM), and both blockers together were compared with or without ZD-7288. The maximally hyperpolarized membrane potentials were measured by the replacement of extracellular Na+ with NMDG. (B) Summaries of the membrane potential changes by pyr10, L-703,606, and both. TTX alone (black, pyr10, n = 5 from 5 mice; L-703,606, n = 6 from 5 mice; pyr10 and L-703,606, n = 5 from 3 mice). TTX and ZD-7288 (red, pyr10, n = 5 from 6 mice; L-703,606, n = 6 from 4 mice; pyr10 and L-703,606, n = 6 from 3 mice). ***p<0.001 for TTX versus TTX and ZD-7288 from pyr10 and L-703,606; **p<0.01 for pyr10 and L-703,606 from TTX and ZD-7288 versus all others. (C) Box plots for the hyperpolarization of the membrane potential induced by ZD-7288 after blocking both TRPC3 and NALCN channels. Pyr10 and L-703,606 (black, n = 5 from 3 mice), ZD-7288 (red, TTX and ZD-7288, n = 6 from 3 mice, **p<0.05). (D) Relative contribution of TRPC3 and NALCN to depolarization of the membrane potentials in the presence of TTX and ZD-7288. Relative contributions were calculated using the ratios of the degrees of hyperpolarization after blocker treatment and NMDG replacement (∆Vblocker/∆VNMDG) from data A. p>0.8 for pyr10 versus L-703,606; ***p<0.001 for pyr10 versus pyr10 and L-703,606; ***p<0.001 for L-703,606 versus pyr10 and L-703,606. Pie chart (right) showing the relative contribution of TRPC3 (cyan) and NALCN (blue) to subthreshold depolarization of the membrane potential. All statistical data were analyzed using one-way ANOVA.
-
Figure 6—source data 1
Source data of each group in Figure 6.
- https://cdn.elifesciences.org/articles/70920/elife-70920-fig6-data1-v2.xlsx
Author response image 1
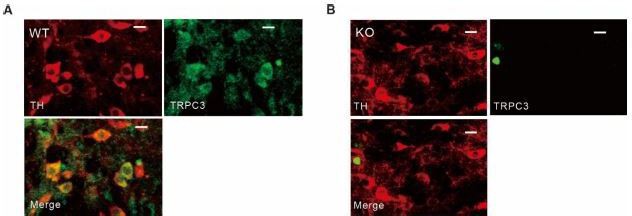
Tyrosine hydroxylase and TRPC3 antibody staining in SNc dopamine neurons of wild-type and TRPC3 KO mice.
(A, B) Double immunofluorescence staining images for tyrosine hydroxylase (TH, left, red), TRPC3 (TRPC3, right, green), and merge (bottom) from the SNc slices of wild-type (WT, A) and TRPC3 (KO, B) mice..
Tables
Key resources table
| Reagent type (species) or resource | Designation | Source or reference | Identifiers | Additional information |
|---|---|---|---|---|
| Antibody | Anti-TRPC3 (Rabbit polyclonal) | Alomone labs | Cat. #: ACC-016; RRID: AB_2040236 | IF (1:500) |
| Antibody | Anti-Tyrosine Hydroxylase (Mouse monoclonal) | Millipore | Cat. #: MAB318; RRID: AB_2201528 | IF (1:500)WB (1:1000) |
| Antibody | Anti-NALCN (Rabbit polyclonal) | Alomone labs | Cat. #: ASC-022; RRID: AB_11120881 | IF (1:1000)WB (1:1000) |
| Antibody | Anti-Mouse Alexa Fluor 488 (Goat polyclonal) | Thermo Fisher Scientific | Cat. #: A32723; RRID: AB_2633275 | IF (1:500) |
| Antibody | Anti-Rabbit Alexa Fluor 647 (Goat polyclonal) | Thermo Fisher Scientific | Cat. #: A32733; RRID: AB_2633282 | IF (1:500) |
| Antibody | Anti-Rabbit HRP (Goat polyclonal) | Bio-Rad | Cat. #: 170–6515; RRID: AB_11125142 | WB (1:1000) |
| Chemical compound, drug | Pyr3 | Tocris | Cat. #: 2004 | Kiyonaka et al., 2009 |
| Chemical compound, drug | Pyr10 | Sigma-Aldrich | Cat. #: 648,494 | Schleifer et al., 2012 |
| Chemical compound, drug | L-703,606 oxalate salt hydrate | Sigma-Aldrich | Cat. #: L119 | Hahn et al., 2020 |
| Chemical compound, drug | Neurotensin | Sigma-Aldrich | Cat. #: N6383 | |
| Chemical compound, drug | Fluo-4, Pentapotassium Salt | Thermo Fisher Scientific | Cat. #: F14200 | |
| Chemical compound, drug | Oregon Green 488 BAPTA-1, Hexapotassium Salt | Thermo Fisher Scientific | Cat. #: O6806 | |
| Chemical compound, drug | Alexa Fluor 594 Hydrazide | Thermo Fisher Scientific | Cat. #: A10438 | |
| Chemical compound, drug | Streptavidin, Alexa Fluor 488 conjugate | Thermo Fisher Scientific | Cat. #: S11223 | |
| Chemical compound, drug | Neurobiotin | Vector laboratories | Cat. #: SP-1120 | |
| Chemical compound, drug | SR 95531 hydrobromide | Tocris | Cat. #: 1,262 | |
| Chemical compound, drug | CGP 55845 hydrochloride | Tocris | Cat. #: 1,248 | |
| Chemical compound, drug | NBQX disodium salt | Tocris | Cat. #: 1,044 | |
| Chemical compound, drug | (R)-CPP | Tocris | Cat. #: 0247 | |
| Chemical compound, drug | Isradipine | Tocris | Cat. #: 2004 | |
| Chemical compound, drug | ZD-7288 | Tocris | Cat. #: 1,000 | |
| Chemical compound, drug | Tetrodotoxin | Tocris | Cat. #: 1,078 | |
| Chemical compound, drug | 2-APB | Tocris | Cat. #: 1,224 | |
| Chemical compound, drug | SKF 96365 hydrochloride | Tocris | Cat. #: 1,147 | |
| Chemical compound, drug | Normal goat serum | Abcam | Cat. #: ab7481 | |
| Chemical compound, drug | Triton X-100 | Sigma-Aldrich | Cat. #: T8787 | |
| Chemical compound, drug | N-Methyl-D-glucamine | Glentham Life Sciences | Cat. #: GA0865 | |
| Strain, strain background (M. musculus) | Transgenic mouse line Th-EGFP, DJ76Gsat/Mmnc | MMRRC | PMID:26435058 | |
| Strain, strain background (M. musculus) | TRPC3 Knockout | PMID:18701065 | LutzBirnbaumer (Hartmann et al., 2008) | |
| Strain, strain background (M. musculus) | Crl:CD1(ICR) | Charles River Laboratories | Strain code: 022 | |
| Sequence-based reagent | GFP genotyping forward | This paper | PCR primers | CCT ACG GCG TGC AGT GCT TCA GC |
| Sequence-based reagent | GFP genotyping reverse | This paper | PCR primers | CGG CGA GCTGCA CGC TGC GTC CTC |
| Sequence-based reagent | TRPC3 genotyping forward | This paper | PCR primers | GAA TCC ACC TGC TTA CAA CCA TGT G |
| Sequence-based reagent | TRPC3 genotyping reverse | This paper | PCR primers | GGT GGA GGT AAC ACA CAG CTA AGC C- |
| Sequence-based reagent | Th forward | This paper | PCR primers | GCT GTG GCC TTT GAG AA |
| Sequence-based reagent | Th reverse | This paper | PCR primers | GCC AAG GAC AAG CTC AGG AA |
| Sequence-based reagent | TRPC1 forward | This paper | PCR primers | GCA AAC CCG TTT TGT TCG CA |
| Sequence-based reagent | TRPC1 reverse | This paper | PCR primers | AAA TGG AGT GGG CCA TGT GTA |
| Sequence-based reagent | TRPC2 forward | This paper | PCR primers | CTC AAG GGT ATG TTG AAG CAG T |
| Sequence-based reagent | TRPC2 reverse | This paper | PCR primers | AGC CGT CTT CCT GTT TGG TTC |
| Sequence-based reagent | TRPC3 forward | This paper | PCR primers | TGA CTT CCG TTG TGC TCA AAT ATG |
| Sequence-based reagent | TRPC3 reverse | This paper | PCR primers | CCT TCT GAA GCT TCT CCT TCT GC |
| Sequence-based reagent | TRPC4 forward | This paper | PCR primers | GCA AGA CAT TTC TAG CTT CCG C |
| Sequence-based reagent | TRPC4 reverse | This paper | PCR primers | GAG TAA TTT CTT CTT CGC TCT GGC |
| Sequence-based reagent | TRPC5 forward | This paper | PCR primers | TAC CAA TGT GAA GGC CCG AC |
| Sequence-based reagent | TRPC5 reverse | This paper | PCR primers | GCA TGA TCG GCA ATG AGC TG |
| Sequence-based reagent | TRPC6 forward | This paper | PCR primers | GCG CTC AGG TCA AGG TTC C |
| Sequence-based reagent | TRPC6 reverse | This paper | PCR primers | GTC ACC AAC TGA GCT GGA CC |
| Sequence-based reagent | TRPC7 forward | This paper | PCR primers | CTC CAA GTT CAG GAC TCG CT |
| Sequence-based reagent | TRPC7 reverse | This paper | PCR primers | GGG CCT TCA GCA CGT ATC TC |
| Sequence-based reagent | NALCN forward | This paper | PCR primers | CAA CAG CAA AAG GCA AGC GA |
| Sequence-based reagent | NALCN reverse | This paper | PCR primers | CCT ATG GCG GCT CAG TCA G |
| Sequence-based reagent | Th qRT-PCR forward | This paper | PCR primers | TGC TCT TCT CCT TGA GGG GT |
| Sequence-based reagent | Th qRT-PCR reverse | This paper | PCR primers | ACC TCG AAG CGC ACA AAG TA |
| Sequence-based reagent | GAPDH forward | This paper | PCR primers | GGA GAG TGT TTC CTC GTC CC |
| Sequence-based reagent | GAPDH reverse | This paper | PCR primers | ATG AAG GGG TCG TTG ATG GC-3 |
| Software, algorithm | Patchmaster | HEKA | RRID:SCR_000034 | |
| Software, algorithm | Fitmaster | HEKA | RRID:SCR_016233 | |
| Software, algorithm | LSM 510 meta | Zeiss | ||
| Software, algorithm | Origin 7.0 | Origin lab corporation | RRID:SCR_014212 | |
| Software, algorithm | IGOR Pro 4.01 | WaveMetrics | RRID:SCR_000325 | |
| Software, algorithm | QuantStudio 6 Real Time PCR System | Applied Biosystems | RRID:SCR_020239 | |
| Software, algorithm | Thermal Cycler Dice Real Time System III | TAKARA | ||
| Software, algorithm | Corel Graphics Suite 8 and 2019 | Corel Corporation | RRID:SCR_013674 | |
| Software, algorithm | Imaris | Bitplane | RRID:SCR_007370 | |
| Commercial assay or kit | HelixAmp Taq-plus with dye | Nanohelix | Cat. #: PM001L | |
| Commercial assay or kit | RNeasy Micro Kit | QIAGEN | Cat. #: 74,004 | |
| Commercial assay or kit | SYBR Green master mix | Applied Biosystems | Cat. #: A25742 | |
| Commercial assay or kit | TB Green premix Ex Taq | TAKARA | Cat. #: RR420A | |
| Commercial assay or kit | Superscript III for qRT-PCR | Thermo Fisher Scientific | Cat. #: 11752050 |
Additional files
Download links
A two-part list of links to download the article, or parts of the article, in various formats.
Downloads (link to download the article as PDF)
Open citations (links to open the citations from this article in various online reference manager services)
Cite this article (links to download the citations from this article in formats compatible with various reference manager tools)
TRPC3 and NALCN channels drive pacemaking in substantia nigra dopaminergic neurons
eLife 10:e70920.
https://doi.org/10.7554/eLife.70920


