DNA circles promote yeast ageing in part through stimulating the reorganization of nuclear pore complexes
- Institute of Biochemistry, Department of Biology, ETH Zürich, Switzerland
- Institute of Genetics and Molecular and Cellular Biology, France
- Scientific Center for Optical and Electron Microscopy, ETH Zürich, Switzerland
Figures
Figure 1 with 1 supplement
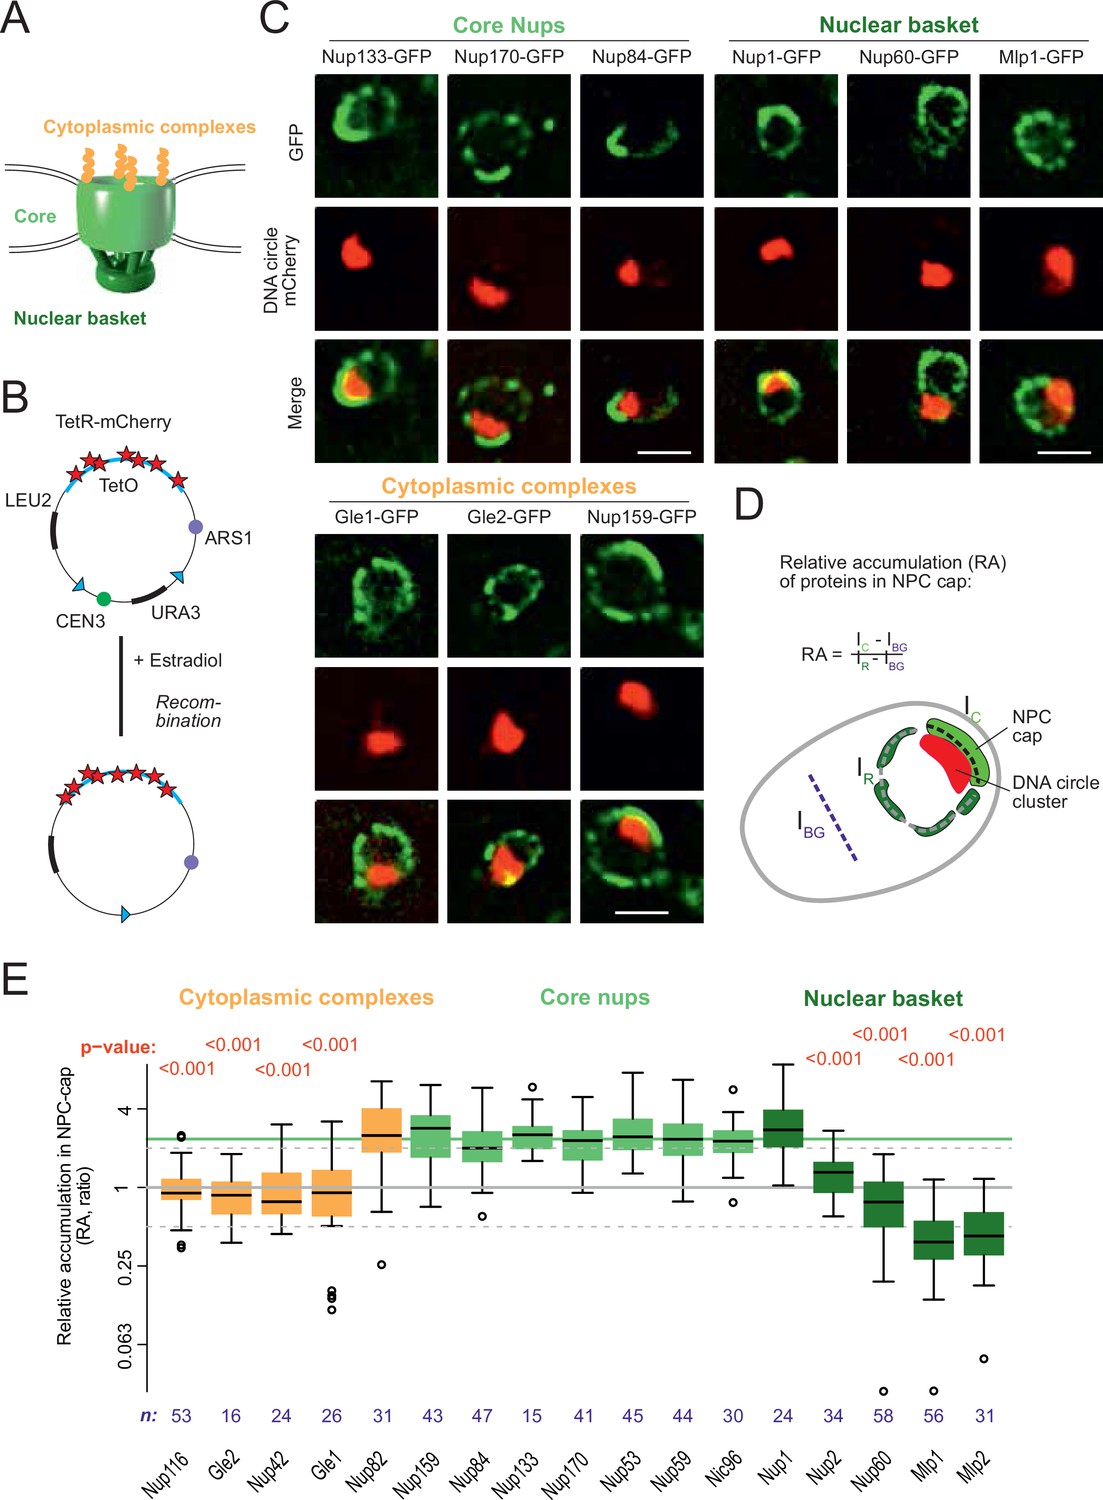
DNA circle anchored NPCs lack the peripheral subunits.
(A) Cartoon of the NPC, showing the scaffold core, cytoplasmic complexes and nuclear basket. (B) Cartoon of an engineered DNA circle with an excisable centromere (CEN3) and TetR-mCherry decorated TetO repeats. The circle contains an autonomic replication sequence (ARS1) and selection markers (LEU2, URA3). (C) Fluorescent images of nuclei in yeast cells with accumulated DNA circles; the DNA circle clusters are labeled with TetR-NLS-mCherry (red) and different nucleoporins labeled with GFP (green). Scale bar is 2 µm. More images in Figure 1—figure supplement 1. (D) Cartoon exemplifying the quantification of protein accumulation around the DNA cluster. The NPC cap was selected by a line scan through the nuclear envelope adjacent to the DNA circle cluster. The relative accumulation (RA) is defined as the ratio of background corrected GFP intensity in the NPC cap (Ic – IBG) over that in the rest of the nucleus (IR – IBG). (E) Quantification of GFP-labeled nucleoporin accumulation in the NPC cap localized at the DNA circle cluster. The relative fluorescence intensity in the NPC cap is plotted on a log2-scale. The median accumulation of the core nucleoporins is indicated (green line). p-Value stands for student’s t-test between the specific nucleoporin and pooled data of all core nups together, no p-value is indicated if the difference is not significant; the sample size per strain is indicated (n).
-
Figure 1—source data 1
Nups relative intensity in the cap versus the rest of the nuclear envelope.
- https://cdn.elifesciences.org/articles/71196/elife-71196-fig1-data1-v2.xlsx
Figure 1—figure supplement 1
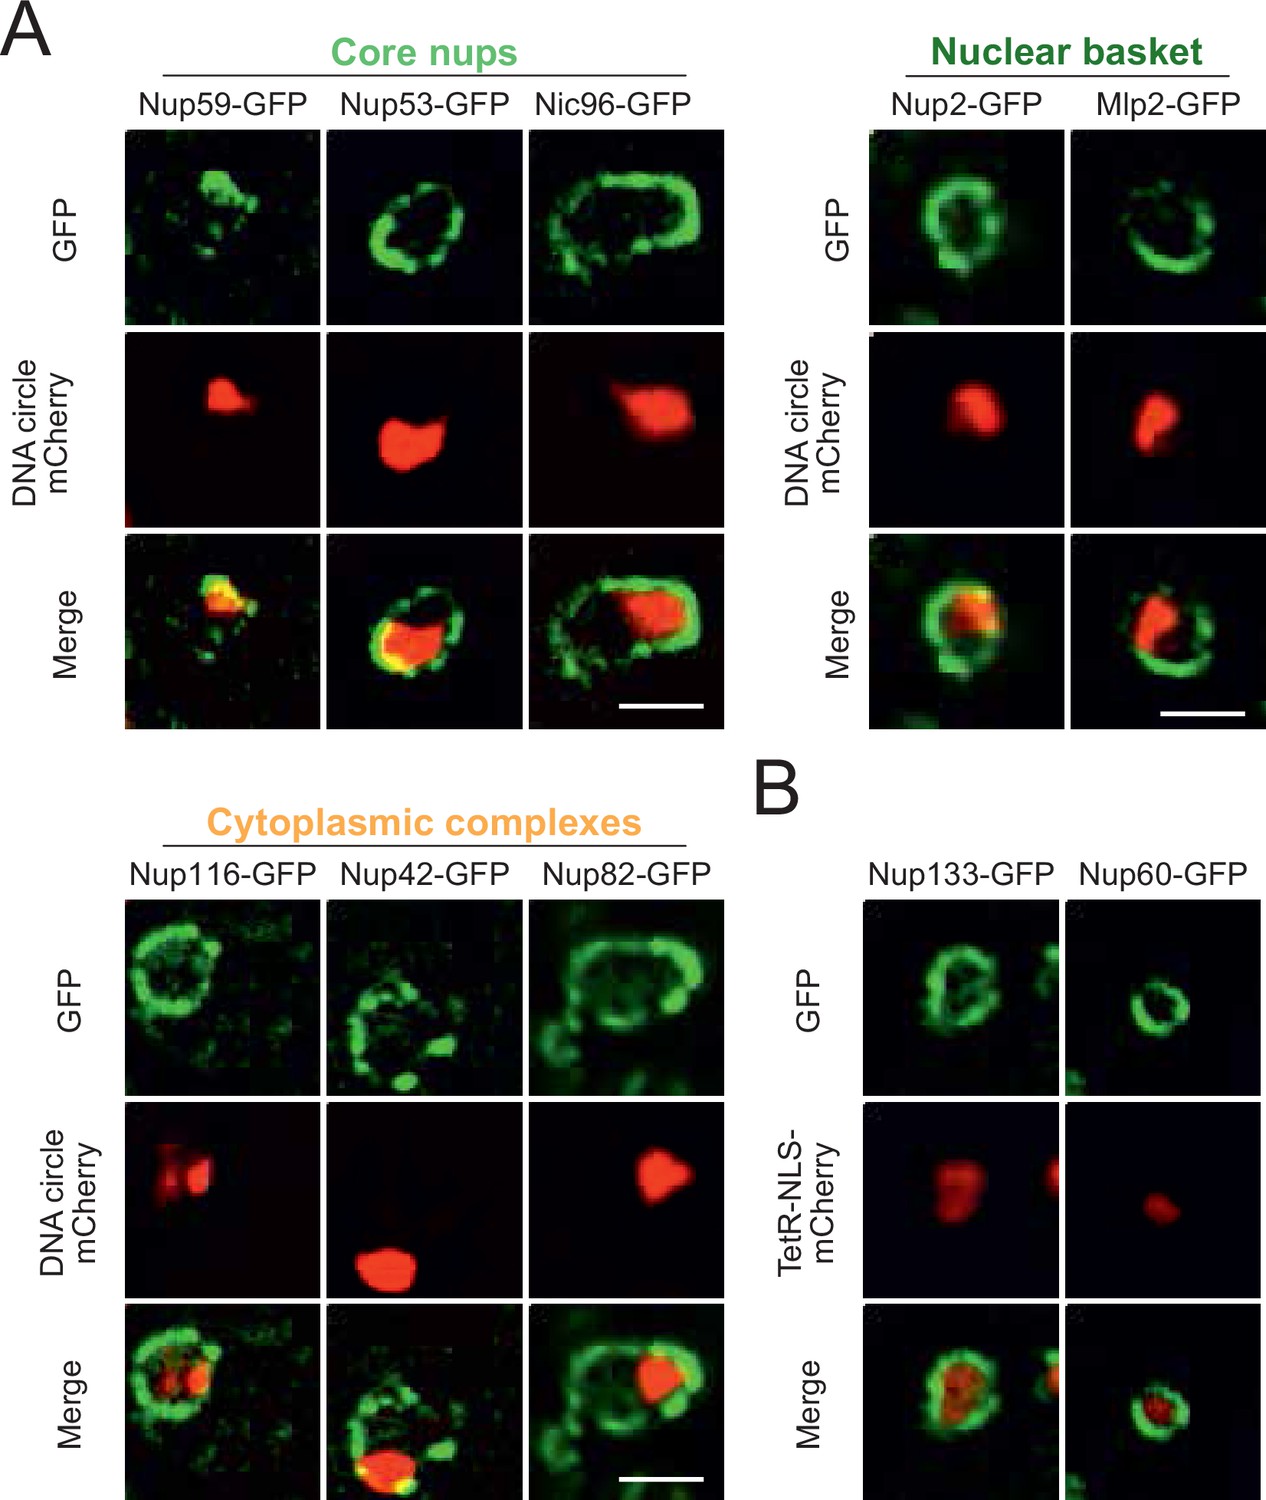
DNA circle anchored NPCs lack the peripheral subunits, Related to Figure 1.
(A) Additional example images of all strains as quantified in Figure 1E. The DNA circle clusters are labeled with TetR-NLS-mCherry (red) and different nucleoporins with GFP (green). Scale bar is 2 µm. (B) Example images of nuclei in young yeast cells prior to DNA circle accumulation; with nucleoporins labeled with GFP and soluble TetR-NLS-mCherry. Without Tet-O containing DNA circles, TetR-NLS-mCherry is homogenously distributed in the nucleoplasm and the localization of both core subunits (Nup133-GFP) and basket subunits (Nup60-GFP) is rather homogenously distributed throughout the nuclear envelope.
Figure 2
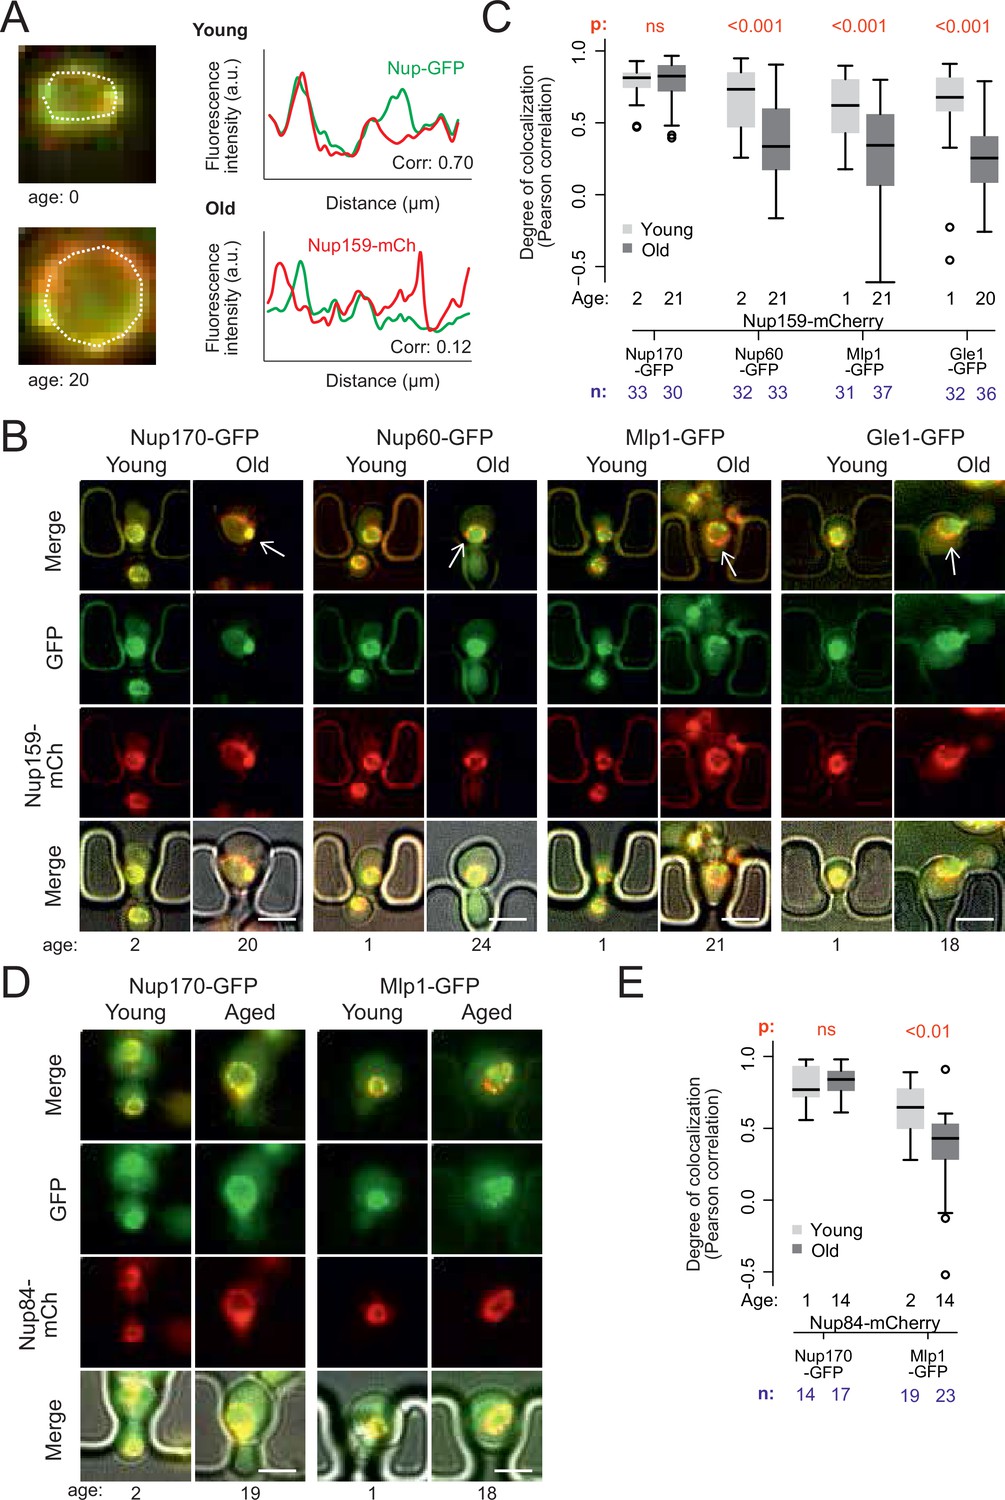
Peripheral subunits of NPC displaced in wild-type aged cells.
(A) To quantify the degree of nucleoporin colocalization, a line was drawn through the nuclear envelope in a focal image of a young (top) and aged (bottom) nucleus of cells co-expressing GFP-tagged Nup GFP (e.g. Nup60-GFP) and a mCherry-tagged Nup as a reference (e.g. Nup159-mCherry, see Materials and methods). The Pearson correlation between the two intensity profiles is calculated, and used as a measure for nucleoporin colocalization. (B) Fluorescent images of young and old cells in the yeast ageing chip, with nucleoporins labeled with GFP (green) and the reference Nup159 with mCherry (red). The age of each cell is indicated. Scale bars are 5 µm. (C) Quantification of the degree of colocalization between target and reference nucleoporin is plotted for young and old wild type cells. The p-value stands for the student’s t-test between young and old cells. The sample size (n) and the median age is indicated. (D) Fluorescent images of young and aged cells in the yeast ageing chip, as in B, but with Nup84-mCherry as a reference nucleoporin. Scale bars are 5 µm. (E) Quantification of the co-localization between nucleoporins in young and old cells, as in C, but with Nup84-mCherry as a reference.
-
Figure 2—source data 1
Correlation data Core/Peripheral Nups according to age.
- https://cdn.elifesciences.org/articles/71196/elife-71196-fig2-data1-v2.xlsx
Figure 3
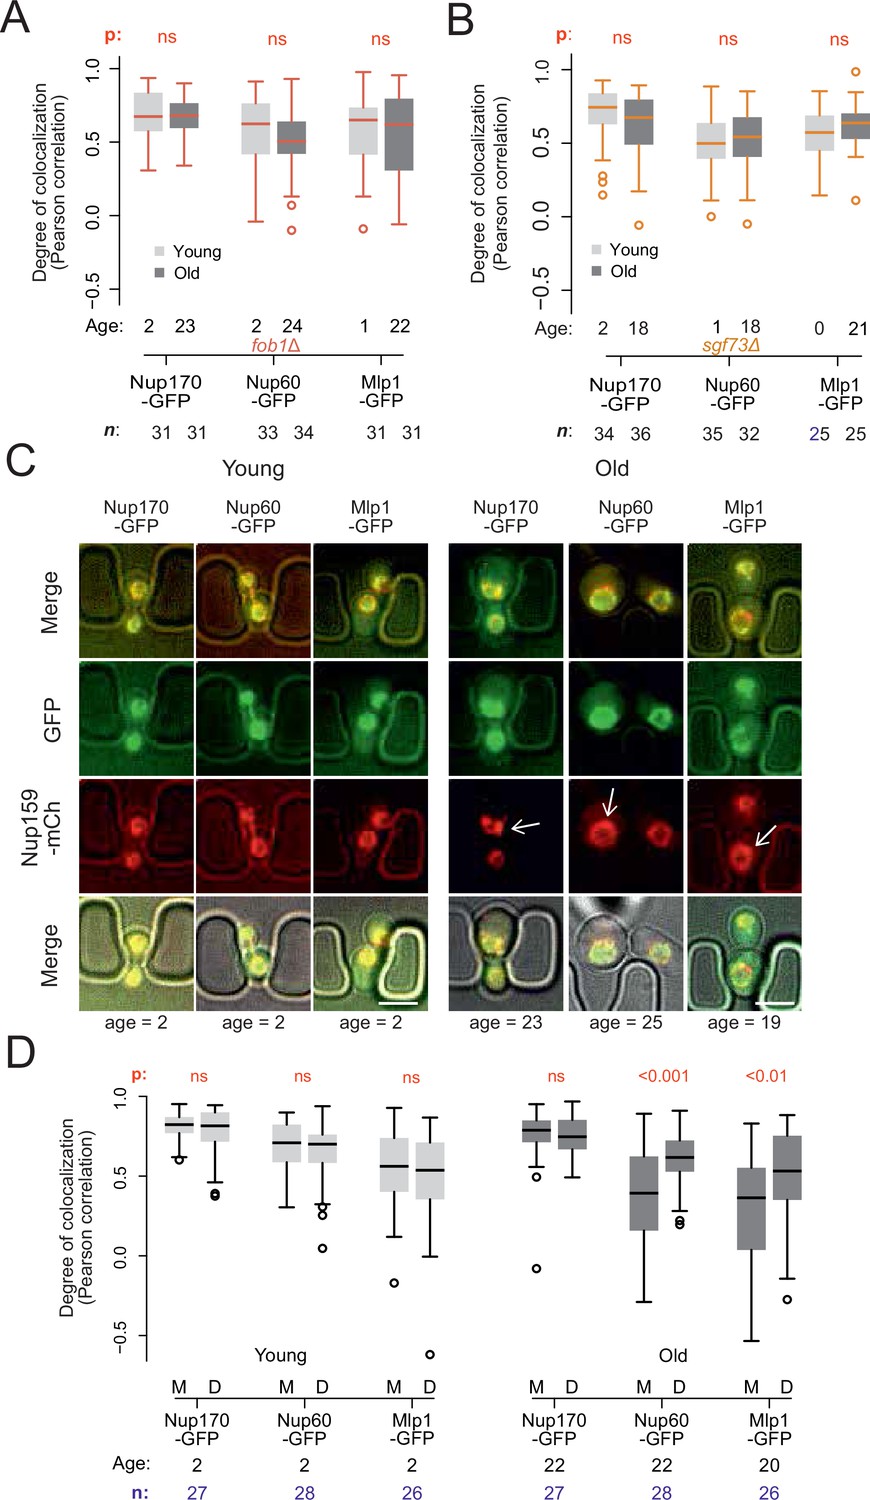
Endogenous DNA circles drive nuclear basket displacement in wild-type aged cells.
(A) Quantification of the degree of colocalization between target and reference nucleoporin is plotted for young and old wild-type, as was done in Figure 2C, but in fob1Δ cells. The sample size (n) and the median age is indicated. The p-value stands for the student’s t-test between young and old cells. (B) Same as A, but in sgf73Δ cells. (C) Fluorescent images of young and old mitotic cells in the yeast ageing chip. Scale bars are 5 µm. (D) Same as in Figure 2C, but comparing nucleoporin colocalization in young and old mother (M) with their corresponding daughter (D) cell. The p-value stands for the student’s t-test between mother and daughter cell. The sample size (n) and the median age is indicated.
-
Figure 3—source data 1
Correlation data Core/Basket Nups in fob1∆ mutant cells.
- https://cdn.elifesciences.org/articles/71196/elife-71196-fig3-data1-v2.xlsx
-
Figure 3—source data 2
Mother/Daughter distribution Core/Basket Nups with age.
- https://cdn.elifesciences.org/articles/71196/elife-71196-fig3-data2-v2.xlsx
Figure 4 with 1 supplement
DNA circle anchored NPCs are not recognized as defective.
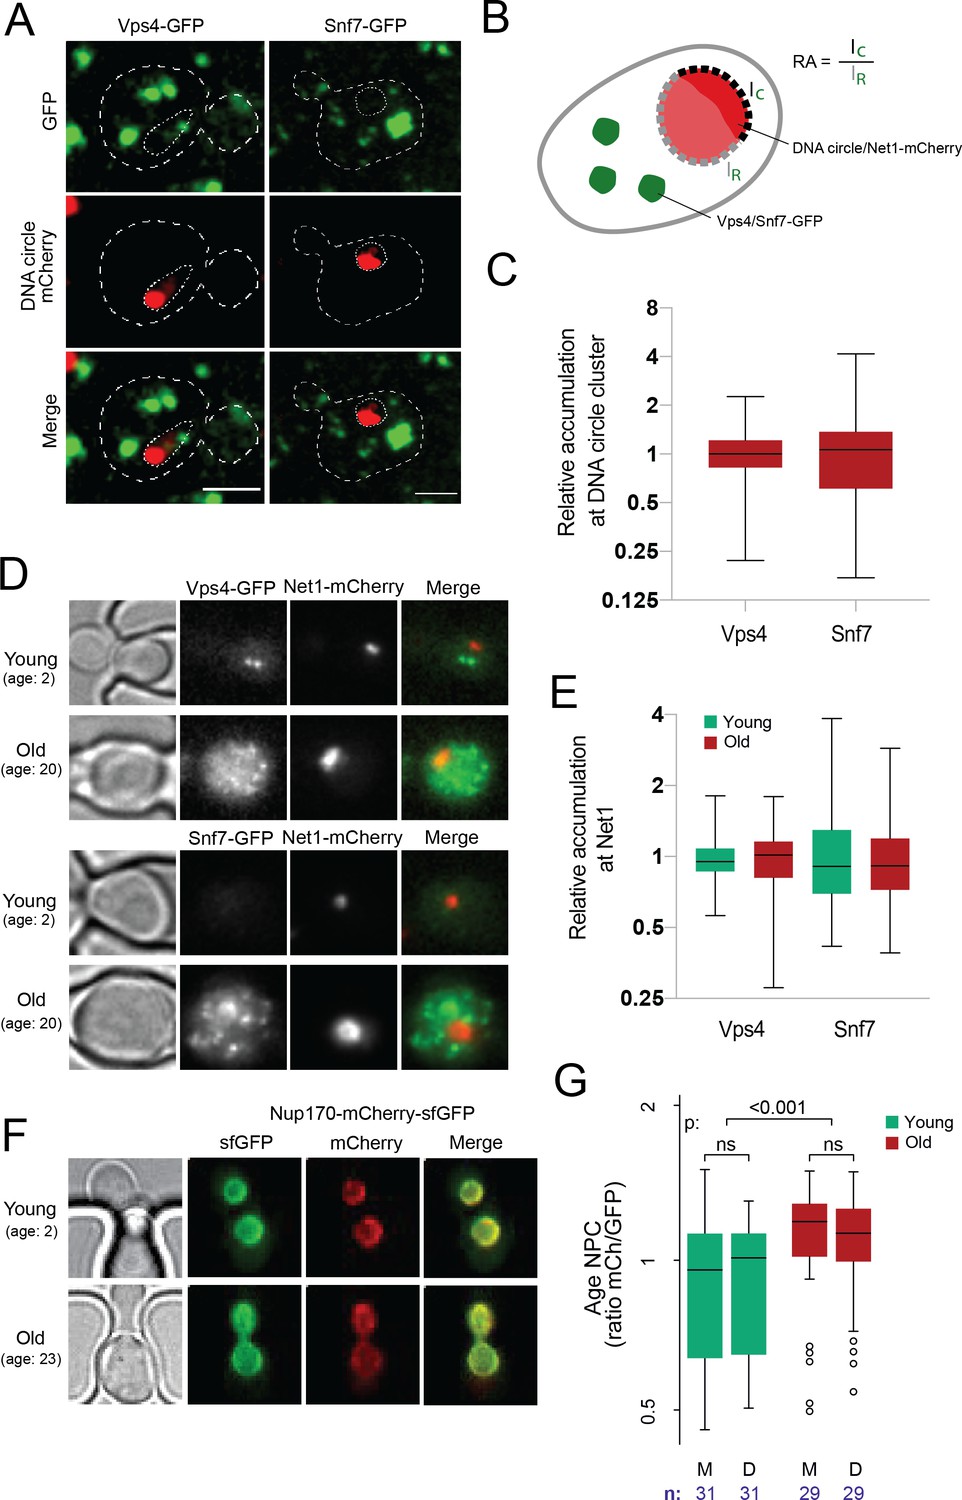
(A) Cells with accumulated DNA circles labeled with TetR‐NLS-mCherry and ESCRT-complex components Vps4 or Snf7 tagged with GFP. (B) Cartoon exemplifying the quantification of Vps4/Snf7 accumulation around the DNA circle cluster/Net1-mCherry focus. A line scan was drawn over the nuclear envelope adjacent to the DNA circle cluster/Net1-mCherry focus and another one over the rest of the nuclear envelope, in a single focal plane. The intensity of Vps4-GFP or Snf7-GFP was measured in each region. The relative accumulation (RA) is defined as the ratio of GFP intensity around the DNA circle cluster/Net1-mCherry focus (IC) over that in the rest of the nuclear periphery (IR). (C) Quantification of relative accumulation of Vps4-GFP and Snf7-GFP at the DNA circle cluster (n = 60 cells each). (D) Young and old cells in the yeast ageing chip. Net1 is tagged with mCherry and ESCRT-complex components Vps4 or Snf7 with GFP. (E) Quantification of the relative accumulation of Vps4 and Snf7 at Net1-mCherry foci in young and old cells (n = 50 cells each). (F) Young and old cells in the yeast ageing chip. Nup170 is tagged with a fluorescent timer (Nup170‐mCherry‐sfGFP). (G) Quantification of the relative age of the NPC plotted as the intensity ratio between mCherry and GFP of Nup170 tagged with a fluorescent timer (Nup170‐mCherry‐sfGFP), measured in young and old mother (M) versus daughter cells (D). Sample size (n) is indicated.
-
Figure 4—source data 1
ESCRT/NPC colocalization and NPC age data.
- https://cdn.elifesciences.org/articles/71196/elife-71196-fig4-data1-v2.xlsx
Figure 4—figure supplement 1
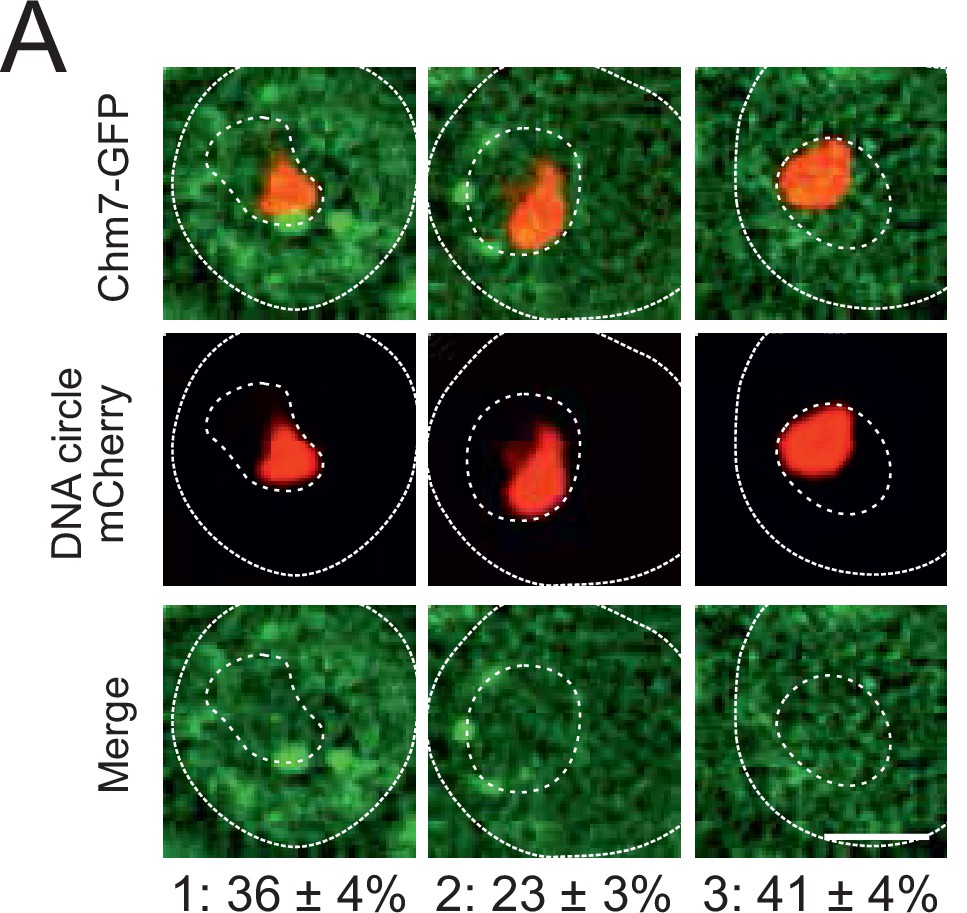
Chm7 does not accumulate at the DNA circle cluster.
(A) Fluorescent images of nuclei in yeast cell with accumulated DNA circles labeled with TetR‐NLS-mCherry and Chm7‐GFP. Occurrence of Chm7‐GFP localization is categorized (1) at least one Chm7 focus in the NPC‐cap, (2) a Chm7 focus somewhere else in the nuclear envelope and (3) no visible Chm7 foci. The standard error of the mean is indicated, n = 190.
Figure 5

mRNA export and surveillance factors are displaced from circle-bound NPCs.
(A) Fluorescent images of nuclei in aged yeast cells, where the DNA circle clusters are labeled with TetR-NLS-mCherry (red) and transport factors with GFP (green). Scale bar is 2 µm. (B) Quantification of factor recruitment in the NPC cap adjacent to the DNA circle cluster, as in Figure 1E. The protein accumulation is plotted for associated factors (purple), import factors (red), and export factors (orange), and is compared to accumulation of the pooled NPC core subunits NPC (green line, duplicated from Figure 1E), no p-value is indicated if the difference is not significant. The sample size (n) is indicated.
-
Figure 5—source data 1
Relative intensity of NPC associated factors in the cap versus the rest of the nuclear envelope.
- https://cdn.elifesciences.org/articles/71196/elife-71196-fig5-data1-v2.xlsx
Figure 6
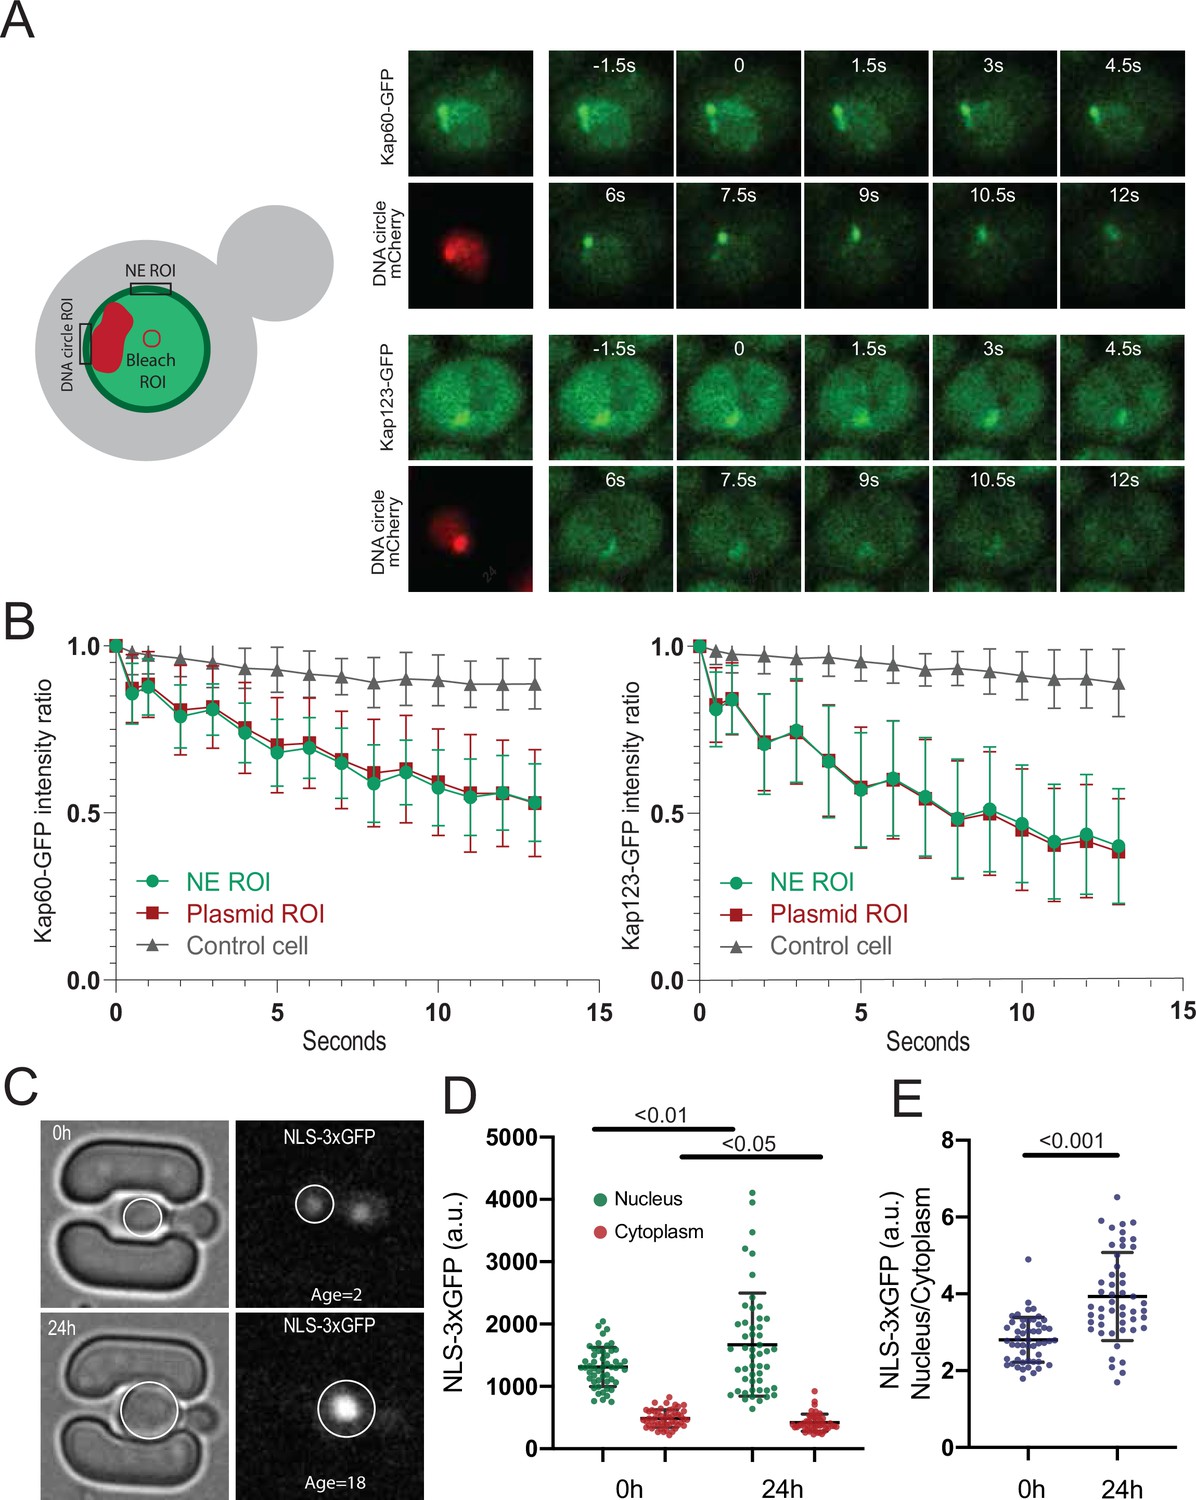
DNA circle bound NPCs are functional in the nuclear import and retention of proteins.
(A) Fluorescent images from FLIP experiments on Kap60-GFP and Kap123-GFP with a DNA circle cluster (labeled with TetR-NLS-mCherry). A region within the nucleus was continuously bleached for 13 s and (B) the intensity kinetics of Kap60 and Kap123 were measured at the Nuclear Envelope (NE) at the DNA circle cluster and in the adjacent NE region, in a single focal plane (n = 33). (C) Example images from a microfluidics ageing experiment of NLS-3xGFP strain. Intensity of the GFP was measured in the nucleus and the cytoplasm of a single focal plane and quantifications are shown in (D) and (E) (n = 50 at each timepoint). Statistical significance assessed by unpaired t-test. Average replicative lifespan at 24 hr is ~18 divisions.
-
Figure 6—source data 1
Kap60-GFP and Kap123-GFP FLIP and NLS-3xGFP intensity in ageing cells.
- https://cdn.elifesciences.org/articles/71196/elife-71196-fig6-data1-v2.xlsx
Figure 7
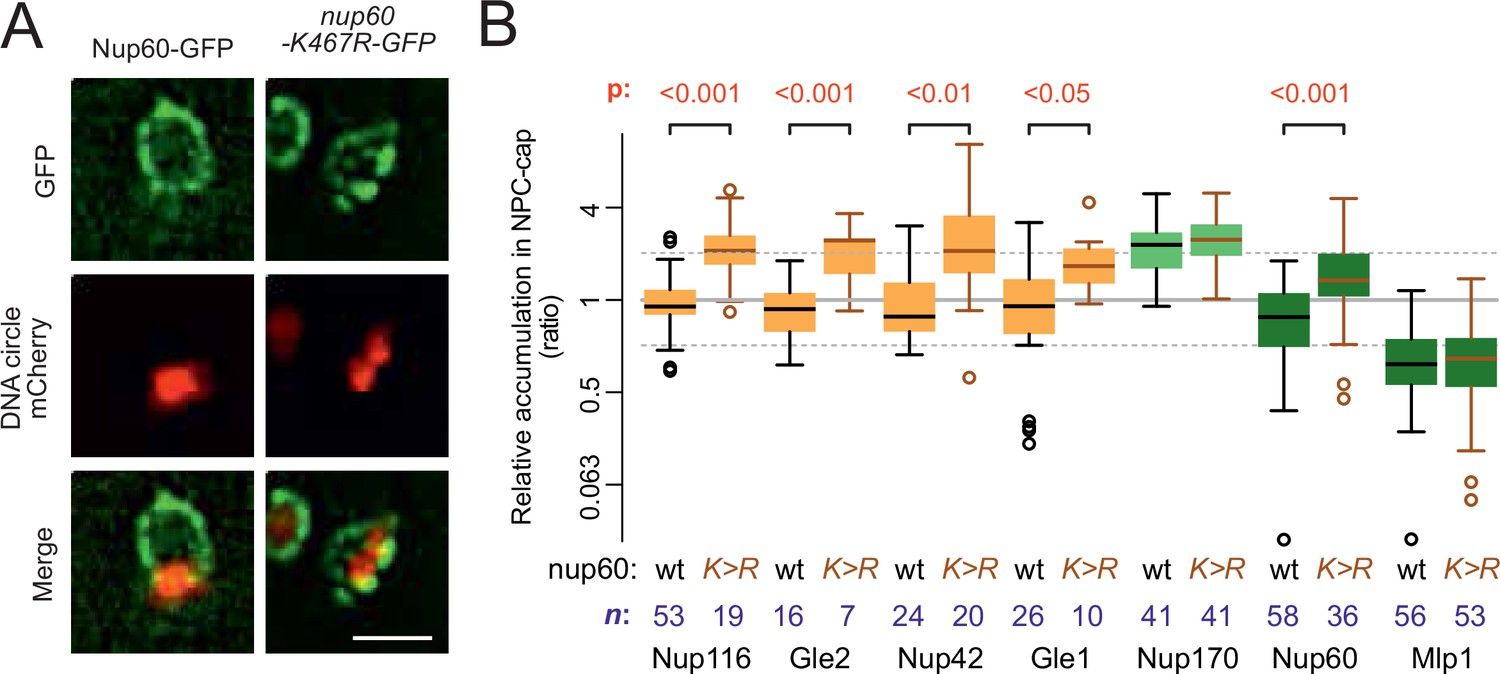
Nup60 acetylation mediates its removal from NPCs as well as that of the cytoplasmic complex upon circle anchorage.
(A) Example images of nuclei in yeast cells with accumulated DNA circles and Nup60-GFP and nup60-K467R-GFP. The DNA circle clusters are labeled with TetR-NLS-mCherry (red). Scale bar is 2 µm. (B) Quantification of GFP-labeled nucleoporin accumulation in the cap, in nup60-K467R (brown lines), compared to wild-type (black lines) on a log2-scale, as in Figure 1E. Wild-type data is a copy from Figure 1E. The p-value stands for the student’s t-test between accumulation ratio of a specific nucleoporin in wild-type and nup60-K467R, no p-value is indicated if the difference is not significant. The sample size (n) is indicated.
-
Figure 7—source data 1
Relative intensity of cytoplasmic complex and nuclear basket factors in the cap versus the rest of the nuclear envelope in nup60-K467R.
- https://cdn.elifesciences.org/articles/71196/elife-71196-fig7-data1-v2.xlsx
Figure 8
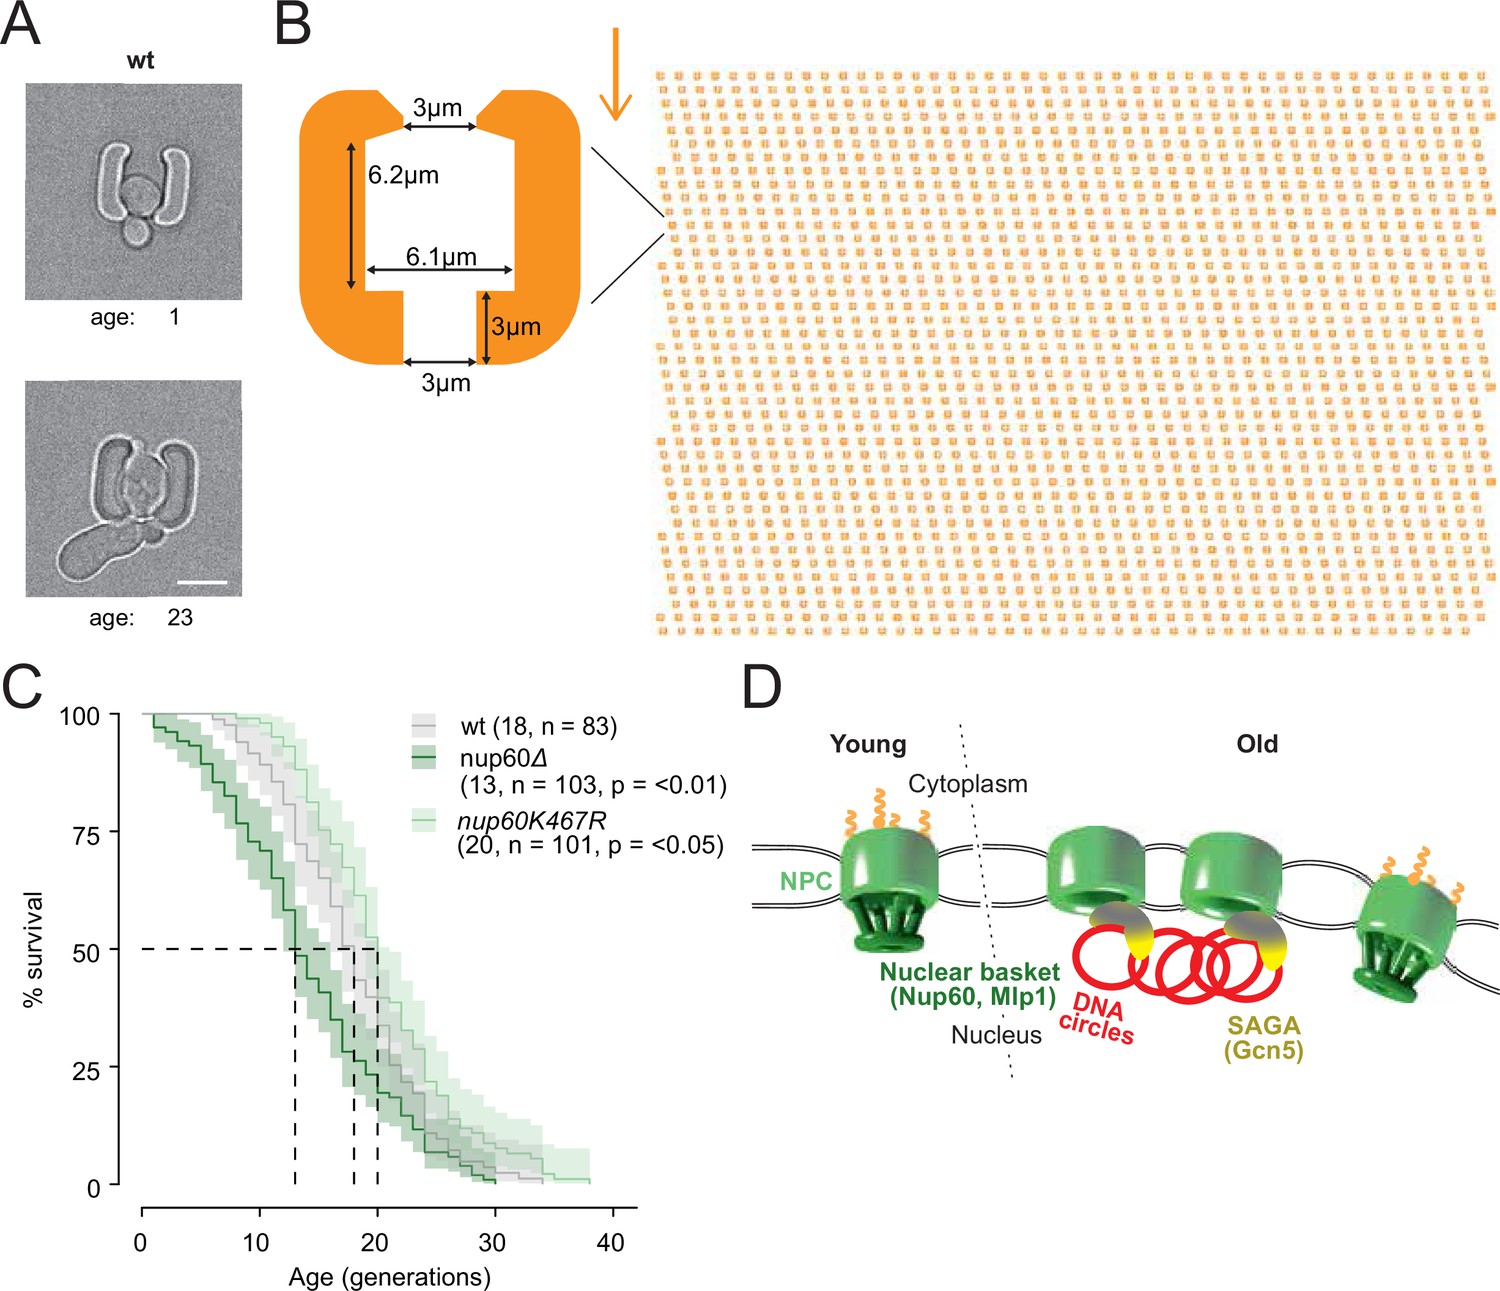
Basket displacement promotes ageing (A) Example images of the same young and old wild-type cell in a trap of the yeast ageing chip.
The age of the cell is indicated, scale bar is 5 µm. (B) The design of the array with improved traps in the ageing chip. One single trap is highlighted to show its dimensions. The arrow shows the direction of the medium flow. (C) The lifespan curve for nup60Δ and nup60-K467R compared to a wild-type strain, plotted with 95% confidence interval limits. The p-value stands for Log-Rank test between nup60Δ or nup60-K467R with the wild-type strain. (D) Model depicting that DNA circle accumulation affects the organization of the NPC via a SAGA-mediated basket displacement.
-
Figure 8—source data 1
Replicative lifespan of wt, nup60del and nup60-K467R cells.
- https://cdn.elifesciences.org/articles/71196/elife-71196-fig8-data1-v2.xlsx
Author response image 1
Additional files
-
Supplementary file 1
Table containing all the yeast strains and plasmids used in this paper.
- https://cdn.elifesciences.org/articles/71196/elife-71196-supp1-v2.xlsx
-
Transparent reporting form
- https://cdn.elifesciences.org/articles/71196/elife-71196-transrepform1-v2.docx
Download links
A two-part list of links to download the article, or parts of the article, in various formats.
Downloads (link to download the article as PDF)
Open citations (links to open the citations from this article in various online reference manager services)
Cite this article (links to download the citations from this article in formats compatible with various reference manager tools)
DNA circles promote yeast ageing in part through stimulating the reorganization of nuclear pore complexes
eLife 11:e71196.
https://doi.org/10.7554/eLife.71196


