An experimental test of the effects of redacting grant applicant identifiers on peer review outcomes
- Retired, formerly Center for Scientific Review, National Institutes of Health, United States
- Center for Scientific Review, National Institutes of Health, United States
- Social Solutions International, United States
Figures
Figure 1
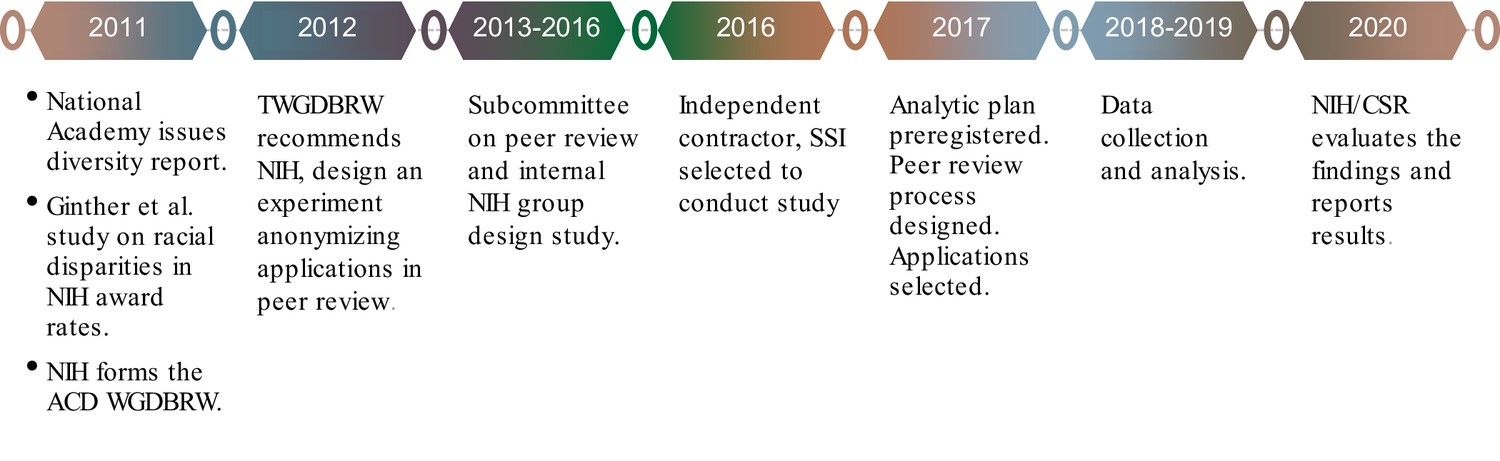
Study background and timeline.
Figure 2
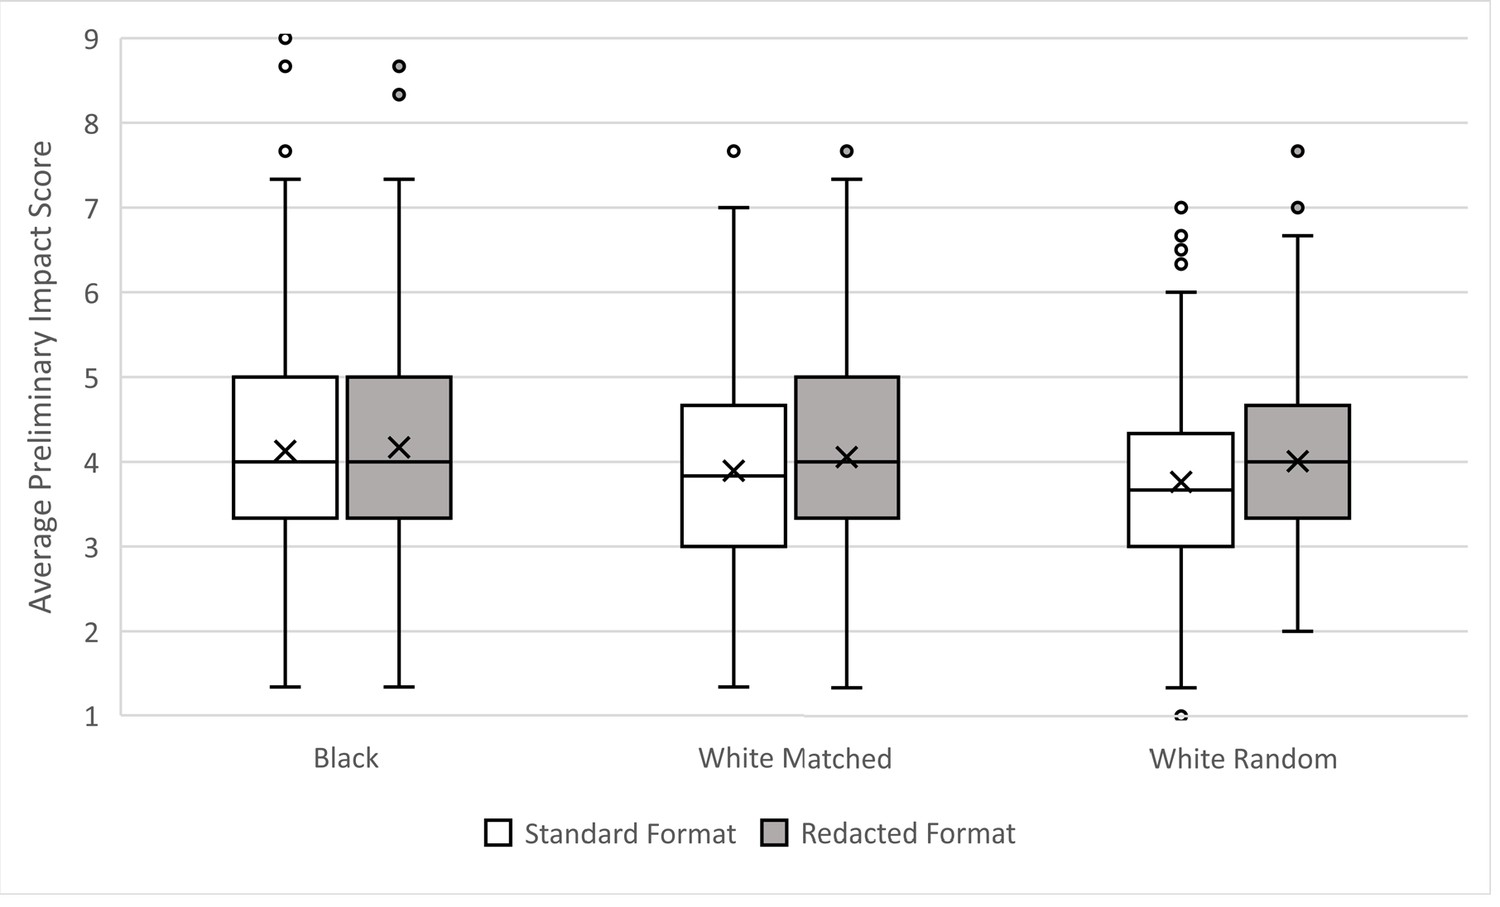
Distributions of preliminary overall impact scores according to race of PI and format in which the applications were reviewed.
Boxes delineate the central 50% of scores those falling between the 25th and 75th percentiles (Interquartile Range, IQR). Whiskers extend 1.5X the IQR. Dots mark outliers. Horizontal lines within boxes indicate the median, and “x” marks the mean value. Lower scores are better.
Tables
Table 1
PI demographics and application characteristics by sample.
| Match criteria | Black (n = 400) | White matched (n = 400) | White random (n = 400) |
|---|---|---|---|
| Gender | |||
| Male | 232 | 233 | 276 |
| Female | 166 | 167 | 120 |
| Unknown | 2 | 4 | |
| Institution NIH mean (SD) awarded dollars in $millions | 182.88 (172.02) | 171.12 (159.85) | 176.92 (157.13) |
| Type of application | |||
| Type 1 (New) | 370 | 369 | 334 |
| Type 2 (Renewal) | 30 | 31 | 66 |
| Revision or resubmission | |||
| A0 (original submission) | 290 | 290 | 263 |
| A1 (resubmission) | 110 | 110 | 137 |
| Early stage investigator | |||
| Yes | 102 | 102 | 47 |
| No | 298 | 298 | 353 |
| Investigator age mean (SD) | 48.66 (9.31) | 50.27 (10.20) | 51.96 (9.96) |
| Behavioral/social science IRG | |||
| Yes | 174 | 173 | 75 |
| No | 226 | 227 | 325 |
| Degree held | |||
| MD | 80 | 72 | 54 |
| PhD | 237 | 267 | 289 |
| MD/PhD | 37 | 33 | 40 |
| Others | 24 | 16 | 8 |
| Unknown | 22 | 12 | 9 |
| Original preliminary overall impact scores: mean (SD) | 4.35 (1.46) | 4.34 (1.36) | 3.94 (1.26) |
| % with multiple PIs | 24 | 18 | 21 |
Table 2
Reviewer’s guesses of applicant race in relation to actual race by application format.
| Reviewer guess of PI race | Standard format applications | Redacted format applications | ||
|---|---|---|---|---|
| Black PIs | White PIs | Black PIs | White PIs | |
| Black | 683 (58%) | 49 (2%) | 336 (28%) | 48 (2%) |
| White | 432 (36%) | 2234 (93%) | 723 (61%) | 2081 (87%) |
| Other | 45 (4%) | 66 (3%) | 78 (7%) | 172 (7%) |
| No guess | 25 (2%) | 41 (2%) | 52 (4%) | 90 (4%) |
Table 3
Reviewer confidence regarding their guesses of investigator demographics.
| Applicantcharacteristic | Black investigators | White matched investigators | White random investigators | |||
|---|---|---|---|---|---|---|
| Standard reviews | Anonymized reviews | Standard reviews | Anonymized reviews | Standard reviews | Anonymized reviews | |
| Race | 3.2 | 2.1 | 3.2 | 2.2 | 3.4 | 2.2 |
| Gender | 4.3 | 2.3 | 4.4 | 2.3 | 4.5 | 2.3 |
| Institution | 4.2 | 3.2 | 4.3 | 3.3 | 4.4 | 3.3 |
| Career stage | 4.2 | 3.1 | 4.2 | 3.2 | 4.4 | 3.2 |
-
Note: 5-point scale, 1 = low confidence, 5 = high confidence.
Table 4
Rates of reviewer identification of name/research group in redacted applications.
| PI race | Correct | Incorrect | No guess |
|---|---|---|---|
| Overall(3580) | 21.6%(775) | 6.1%(217) | 72.3%(2588) |
| Black(1189) | 18.9%(225) | 5.6%(67) | 75.4%(897) |
| White (matched sample)(1194) | 19.4%(232) | 7.0%(84) | 73.5%(878) |
| White (random sample)(1197) | 26.6%(318) | 5.5%(66) | 67.9%(813) |
Table 5
Primary analysis.
Effects of race and application format on overall impact scores in matched White and Black application sets.
| Estimate | p-Value | 95% Confidence interval (CI) | |
|---|---|---|---|
| Fixed effects | |||
| Race | –0.17 | 0.01 | (−0.31,–0.04) |
| Application format | –0.10 | 0.02 | (−0.19,–0.02) |
| Race × application format | –0.12 | 0.17 | (–0.29, 0.05) |
| Intercept | 4.06 | < 0.001 | (3.99, 4.13) |
| Random effects | |||
| Application intercept | 0.61 | – | (0.51, 0.72) |
-
Note: The reference category for race is the Black group. The reference category for application format is the redacted format.
Table 6
Simple contrasts of average preliminary impact scores for redacted vs. standard format applications by PI race.
Matched White application set.
Table 7
Parameter estimates and standard errors from nested models predicting overall impact scores in the Black and random White application sets.
| Model 1(n = 4764800 applications) | Model 2(n = 4728794 applications) | Model 3(n = 4728794 applications) | Model 4(n = 4315794 applications) | |||||
|---|---|---|---|---|---|---|---|---|
| Fixed effects | Coef. | SE | Coef. | SE | Coef. | SE | Coef. | SE |
| DemographicsRace (White = 1) | –0.266a | 0.069 | –0.132c | 0.065 | –0.132c | 0.065 | –0.124 | 0.068 |
| Type 2 application | –0.492a | 0.101 | –0.491a | 0.101 | –0.484a | 0.104 | ||
| A1 application | –0.420a | 0.069 | –0.420a | 0.069 | –0.415a | 0.072 | ||
| Gender | –0.005 | 0.067 | –0.005 | 0.067 | 0.013 | 0.069 | ||
| Early-stage investigator | 0.178c | 0.084 | 0.178c | 0.084 | 0.186c | 0.087 | ||
| Low NIH institutional funding | 0.618a | 0.094 | 0.618a | 0.094 | 0.612a | 0.097 | ||
| Experimental covariates | ||||||||
| Format (standard = 1) | –0.144a | 0.042 | –0.022 | 0.041 | ||||
| Format × race | –0.186b | 0.083 | –0.237b | 0.080 | ||||
| Perceptions | ||||||||
| PI race guess Black | –0.155b | 0.069 | ||||||
| PI gender guess female | –0.069 | 0.061 | ||||||
| PI career stage guessEarly-stage investigator | 0.091 | 0.063 | ||||||
| Institutional funding guess ‘low’ | 0.447a | 0.134 | ||||||
| Grantsmanship indicators | ||||||||
| Grant 1 | –0.519a | 0.027 | ||||||
| Grant 2 | –0.204a | 0.029 | ||||||
| Random effects | ||||||||
| Grant 1 slope | 0.052 | |||||||
| Institution slope | 0.489 | 0.489 | 0.477 | |||||
| Application intercept | 0.614 | 0.400 | 0.402 | 0.511 | ||||
| Residual | 2.044 | 2.041 | 2.032 | 1.561 | ||||
-
Note: Statistically significant parameter estimates are bolded; ap ≤ 0.001, bp ≤ 0.025, cp < 0.05.
Table 8
Simple contrasts of average preliminary impact scores for redacted vs. standard format applications by PI race.
Randomly selected White application set.
Author response table 1
Distribution of change (redacted score – standard score) according to PI race.
| Min | 1st quarter | Median | Mean | 3rd quarter | Max | |
|---|---|---|---|---|---|---|
| Black | –3.67 | –0.67 | 0 | 0.04 | 1 | 3.33 |
| White matched | –3 | –0.67 | 0 | 0.16 | 1 | 3.33 |
| White random | –3.83 | –0.33 | 0.33 | 0.24 | 1 | 4.33 |
Additional files
-
Supplementary file 1
Additional methodological details.
(A) Sample size calculations. (B) Number of matched white applications per matching criteria. (C) Redacted fields and their locations. (D) Differences between standard National Institutes of Health (NIH) review and this study.
- https://cdn.elifesciences.org/articles/71368/elife-71368-supp1-v2.docx
-
Supplementary file 2
Data collection instrument.
- https://cdn.elifesciences.org/articles/71368/elife-71368-supp2-v2.docx
-
Transparent reporting form
- https://cdn.elifesciences.org/articles/71368/elife-71368-transrepform1-v2.docx
-
Source data 1
Data used in reported analyses.
- https://cdn.elifesciences.org/articles/71368/elife-71368-supp3-v2.xlsx
Download links
A two-part list of links to download the article, or parts of the article, in various formats.
Downloads (link to download the article as PDF)
Open citations (links to open the citations from this article in various online reference manager services)
Cite this article (links to download the citations from this article in formats compatible with various reference manager tools)
An experimental test of the effects of redacting grant applicant identifiers on peer review outcomes
eLife 10:e71368.
https://doi.org/10.7554/eLife.71368


