Type I and II PRMTs inversely regulate post-transcriptional intron detention through Sm and CHTOP methylation
- Department of Biochemistry, Albert Einstein College of Medicine, United States
- Department of Molecular Pharmacology, Albert Einstein College of Medicine, United States
- Department of Cell Biology, Albert Einstein College of Medicine, United States
Figures
Figure 1 with 2 supplements

Type I PRMTs and PRMT5 inversely regulate intron retention.
(a) Overview of protein arginine methyltransferases and their catalyzed reactions. (b) Comparison of ΔΨ for retained introns (RI) following PRMT inhibition where ΔΨ=Ψ (PRMT inhibitor)–Ψ (DMSO). Significance determined using Kolmogorov-Smirnov test; *<0.05, ****<0.0001, ns=not significant. (c) Comparison of ΔΨ z-score for common RI after 2-day treatment with PRMT inhibitors. (d) Genome browser track of poly(A)-RNA seq aligned reads for GAS5, ANKZF1, and NOP2. Yellow shading denotes RI. Scale (0.1 kb) indicated in lower right corner. (e) RT-qPCR of RI highlighted in panel (d). Data are represented as mean ± SD. (f, g) Comparison of RI and A549-expressed intron distance to the transcription-end site (TES) (f) or intron length (g) in log10(kb). Dashed line indicates genomic median; solid line within boxplot is condition-specific median. Significance determined using Wilcoxon rank-sum test; ****<0.0001.
Figure 1—figure supplement 1
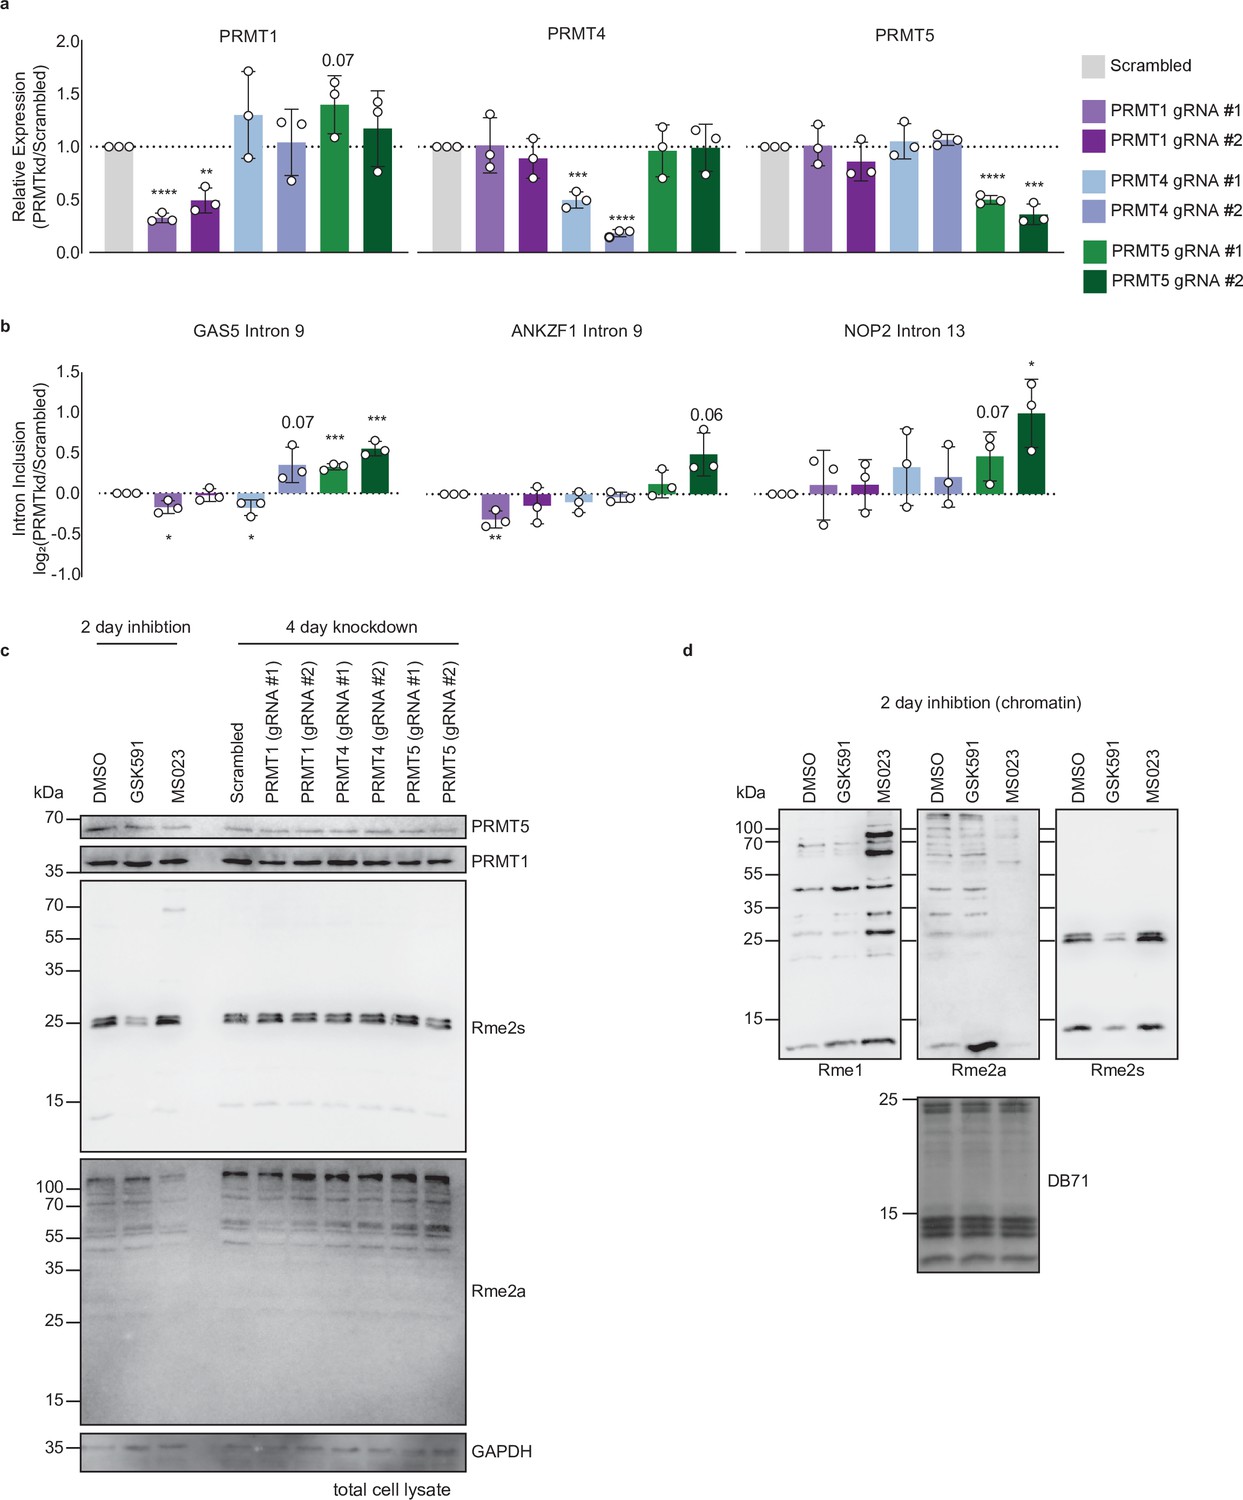
PRMTkd recapitulates RI inclusion seen with PRMT inhibition.
(a, b) RT-qPCR of PRMT expression (a) or RI (b) 4 days after transduction of A549 cells with gRNAs targeting the indicated PRMT. Data are represented as mean ± SD. Significance determined using Student’s t-test; *<0.05, **<0.01, ***<0.001, ****<0.0001. (c) Western blot of total cell extract following 2-day treatment with DMSO, GSK591, or MS023 or 4-day knockdown of indicated PRMTs. See Figure 1—figure supplement 1—source data 1. (d) Western blot of chromatin following 2-day treatment with DMSO, GSK591, or MS023. DB71=Direct Blue 71 membrane stain. See Figure 1—figure supplement 1—source data 2.
-
Figure 1—figure supplement 1—source data 1
Western blot data for Figure 1—figure supplement 1c.
- https://cdn.elifesciences.org/articles/72867/elife-72867-fig1-figsupp1-data1-v2.zip
-
Figure 1—figure supplement 1—source data 2
Western blot data for Figure 1—figure supplement 1d.
- https://cdn.elifesciences.org/articles/72867/elife-72867-fig1-figsupp1-data2-v2.zip
Figure 1—figure supplement 2
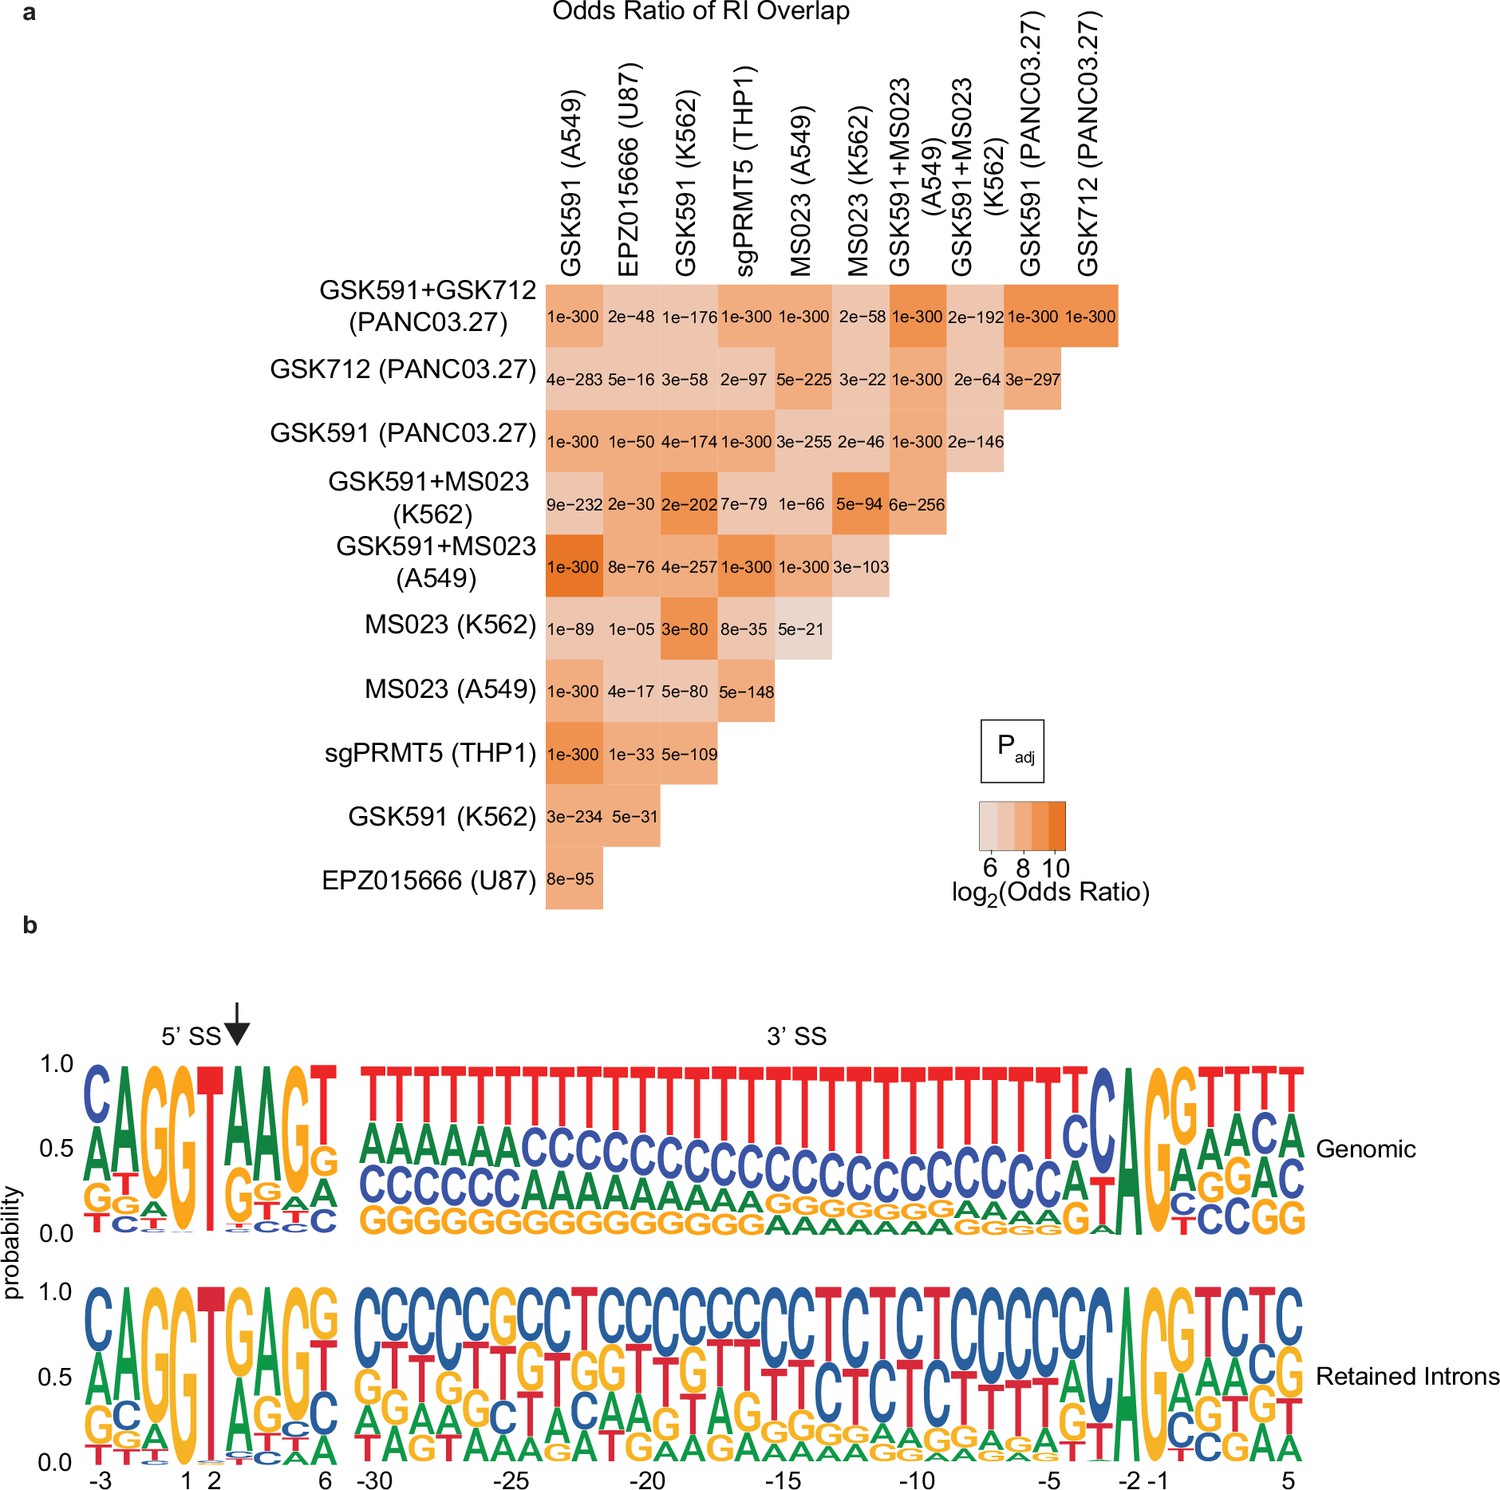
PRMTs regulate a conserved class of retained introns (RI) that share unique features.
(a) Matrix comparing the log2(odds ratio) and significance as determined by the Fisher’s exact test of overlapping RI from indicated experimental models. (b) Web logo diagram of nucleotide distribution probability of A549 expressed or RI.
Figure 2 with 2 supplements
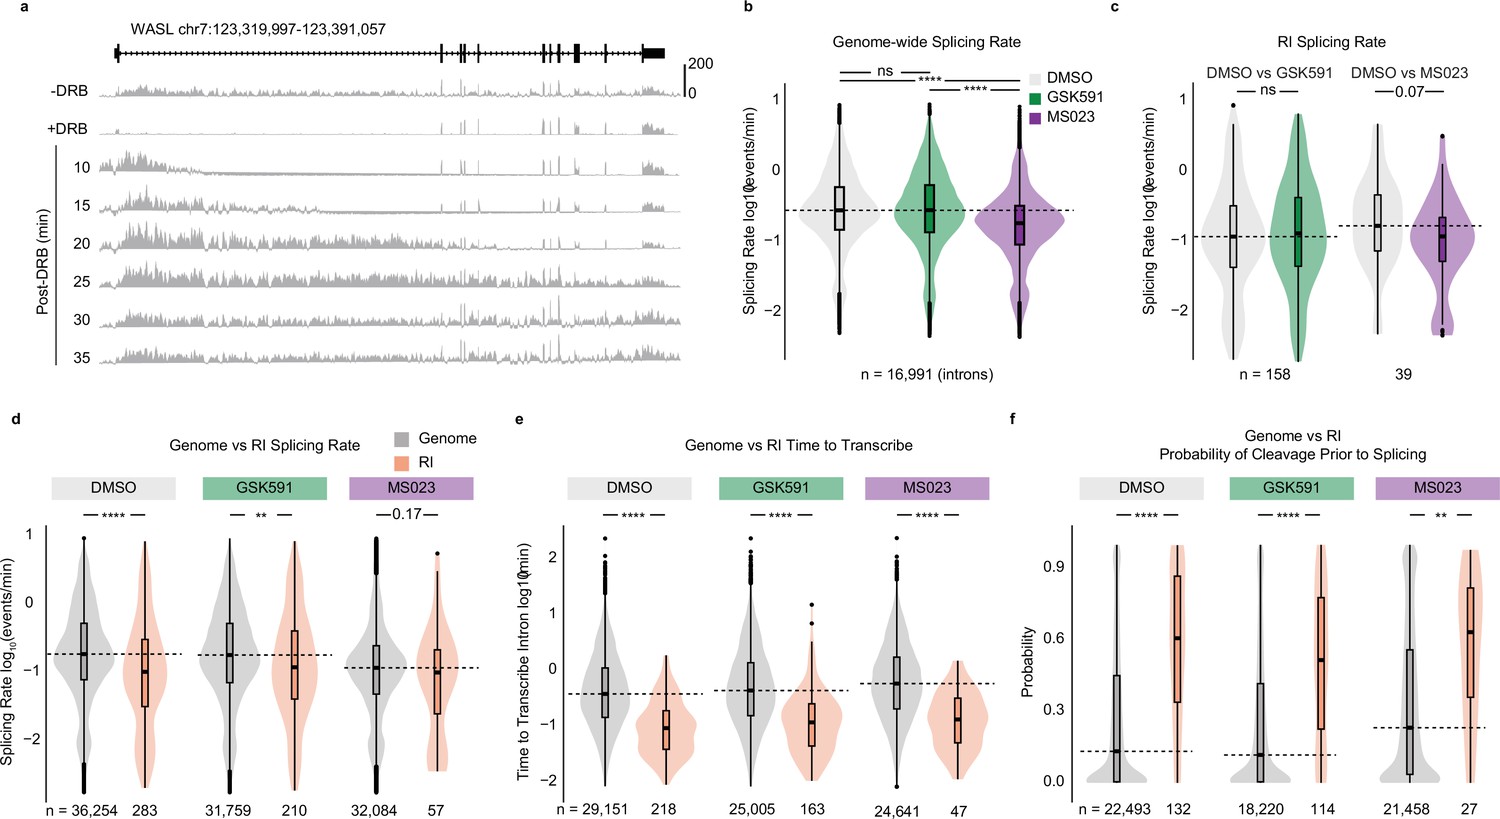
Retained introns (RI) share unique characteristics and are independent of PRMT-regulated co-transcriptional splicing.
(a) Histogram of SKaTER-seq aligned reads across WASL. (b) Distribution of splicing rates for common genomic introns. Dashed line indicates DMSO median; solid line within boxplot is condition-specific median. Significance determined using Wilcoxon rank-sum test; ****<0.0001, ns=not significant. (c) Distribution of splicing rates for common RI as in panel (b). (d–f) Distribution of splicing rates (d), time to transcribe (e), and the probability of cleavage prior to splicing (f) for RI (orange) and A549 expressed introns (dark gray) within the same condition. Dashed line indicates genomic median; solid line within boxplot is condition-specific median. Significance determined using Wilcoxon rank-sum test; *<0.05, **<0.01, ***<0.001, ****<0.0001.
Figure 2—figure supplement 1
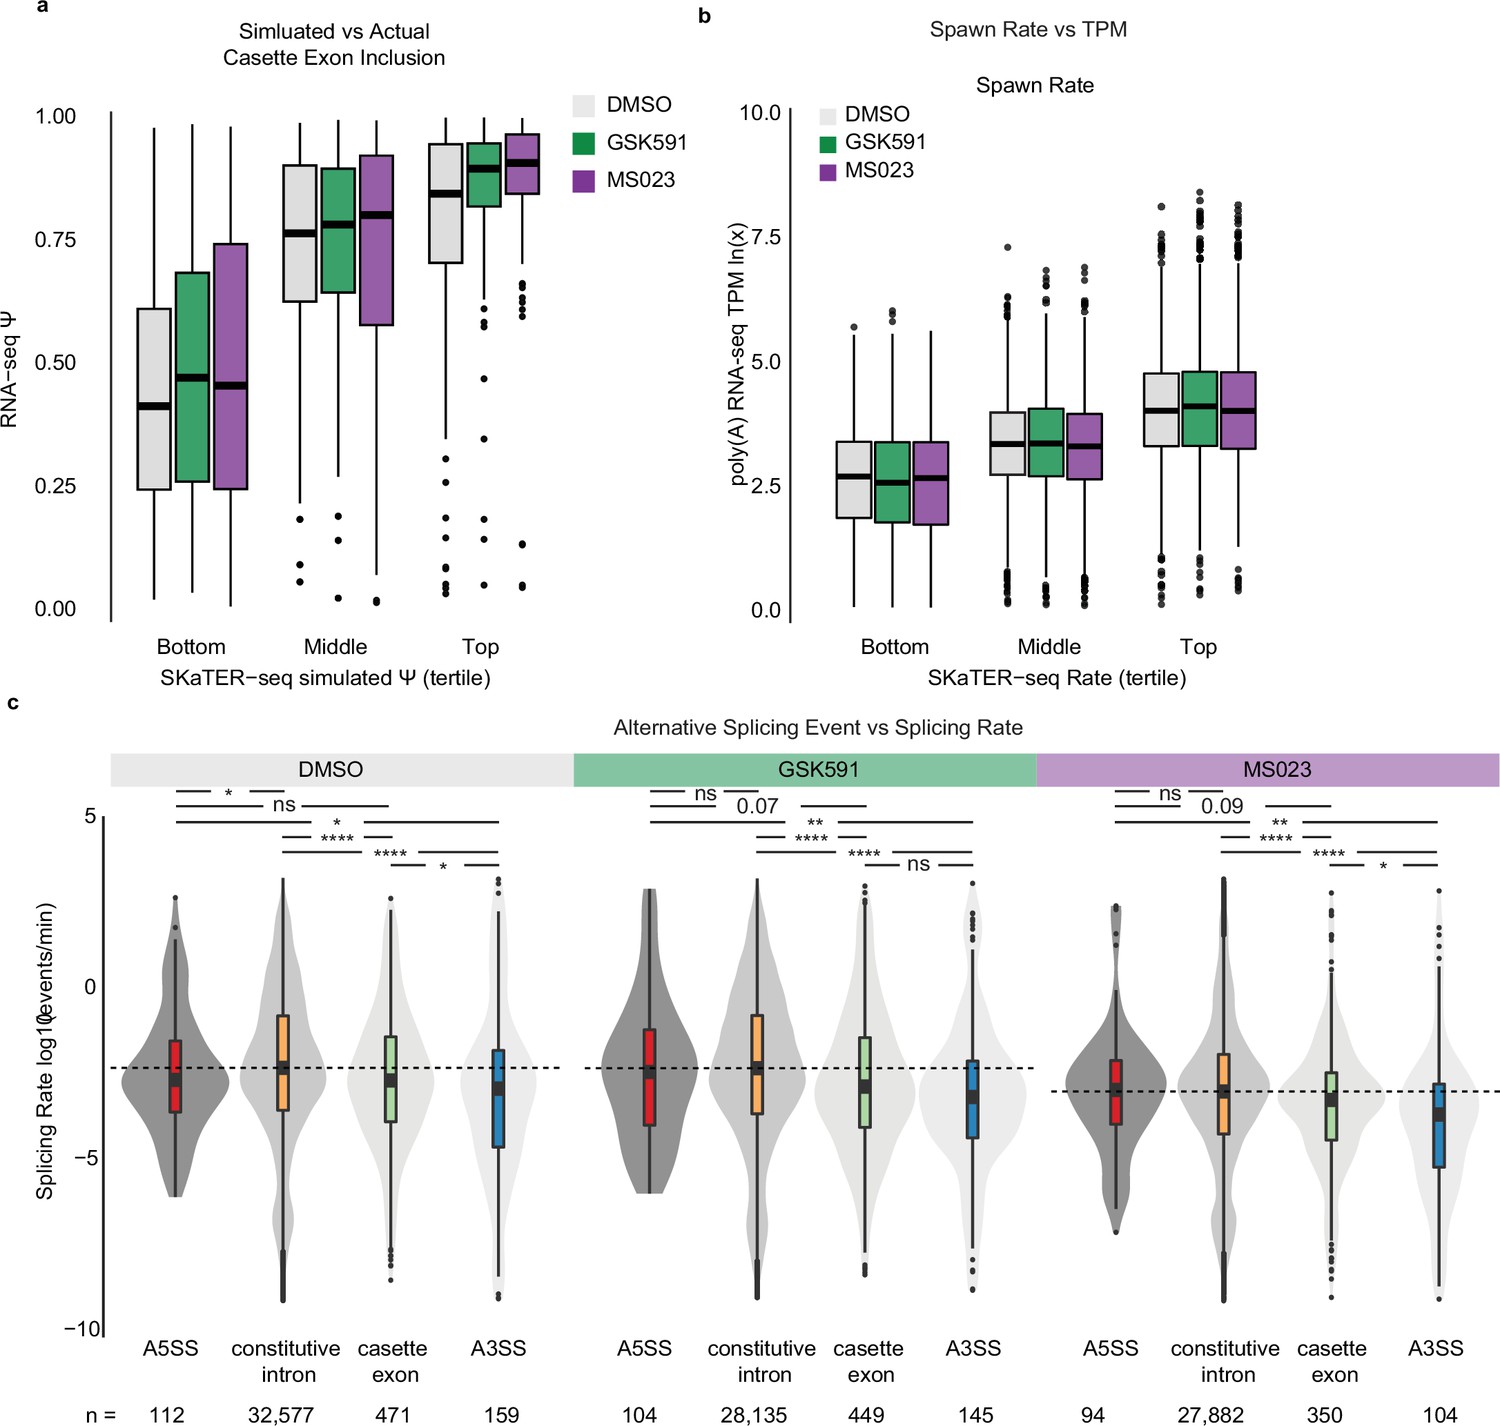
Transcript spawn rate correlates with expression and alternative splicing events are slower than constitutive ones.
(a) Correlation of SKaTER-seq model simulated cassette exon Ψ versus poly(A)-RNA seq Ψ. (b) Correlation of RNA pol II initiation and pause-release (spawn rate) with poly(A)-RNA seq transcripts per million (TPM). x-axis is spawn rate in tertiles; y-axis is poly(A)-RNA seq ln(TPM). (c) Distribution of splicing rate versus splicing event as determined by SKaTER-seq modeling. A5SS=alternative 5′ splice site, A3SS=alternative 3′ splice site. Dashed line indicates constitutive intron median; solid line within boxplot is event-specific median. Significance determined using Kolmogorov-Smirnov test; *<0.05, **<0.01, ***<0.001, ****<0.0001, ns=not significant.
Figure 2—figure supplement 2
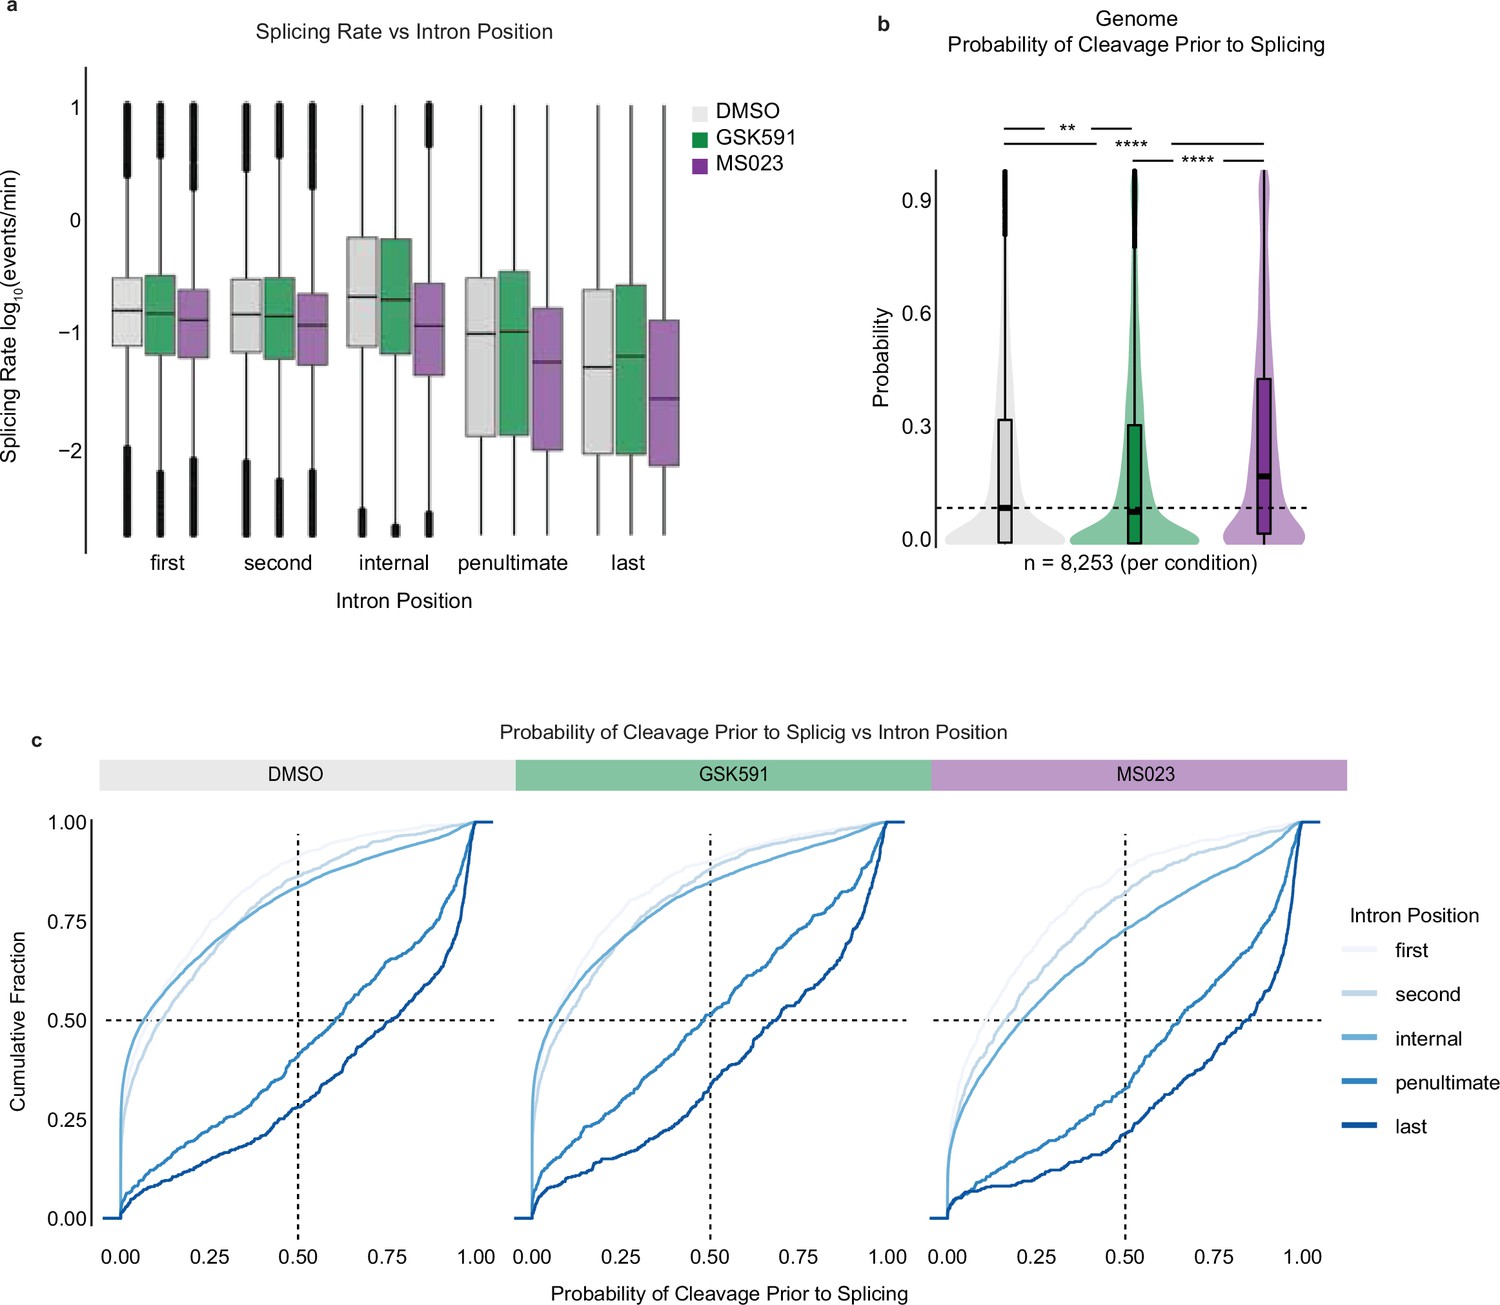
Splicing rate and probability of cleavage prior to splicing correlate with intron position.
(a) Correlation of splicing rate and intron position in cells treated with DMSO, GSK591, or MS023 for 2 days. (b) Probability of cleavage prior to splicing for common genome-wide introns relative to DMSO. Dashed line indicates DMSO median; solid line within boxplot is condition-specific median. Significance determined using Wilcoxon rank-sum test; **<0.01, ****<0.0001. (c) Cumulative distribution functions comparing the probability of transcript cleavage prior to intron splicing and intron position. Color range indicates intron position where light blue is closer to transcription start site and dark blue closer to transcription end site.
Figure 3

Type I and II PRMTs regulate RI post-transcriptionally.
(a) Overview of Actinomycin D (ActD) poly(A)-RNA sequencing protocol. (b) Genome browser track of poly(A)-RNA seq aligned reads (−) and (+) ActD for NOP2. (c) Distribution of log2(+ActD/−ActD) abundance for common RI between GSK591 and MS023 treated cells relative to DMSO treatment. Dashed line indicates DMSO median; solid line within boxplot is condition-specific median. Significance determined using Wilcoxon rank-sum test; **<0.01, ***<0.001. (d) RT-qPCR of RI (−) and (+) ActD relative to DMSO. Data are represented as mean ± SD. Significance determined using Student’s t-test; **<0.01, ***<0.001, ns=not significant.
Figure 4 with 1 supplement
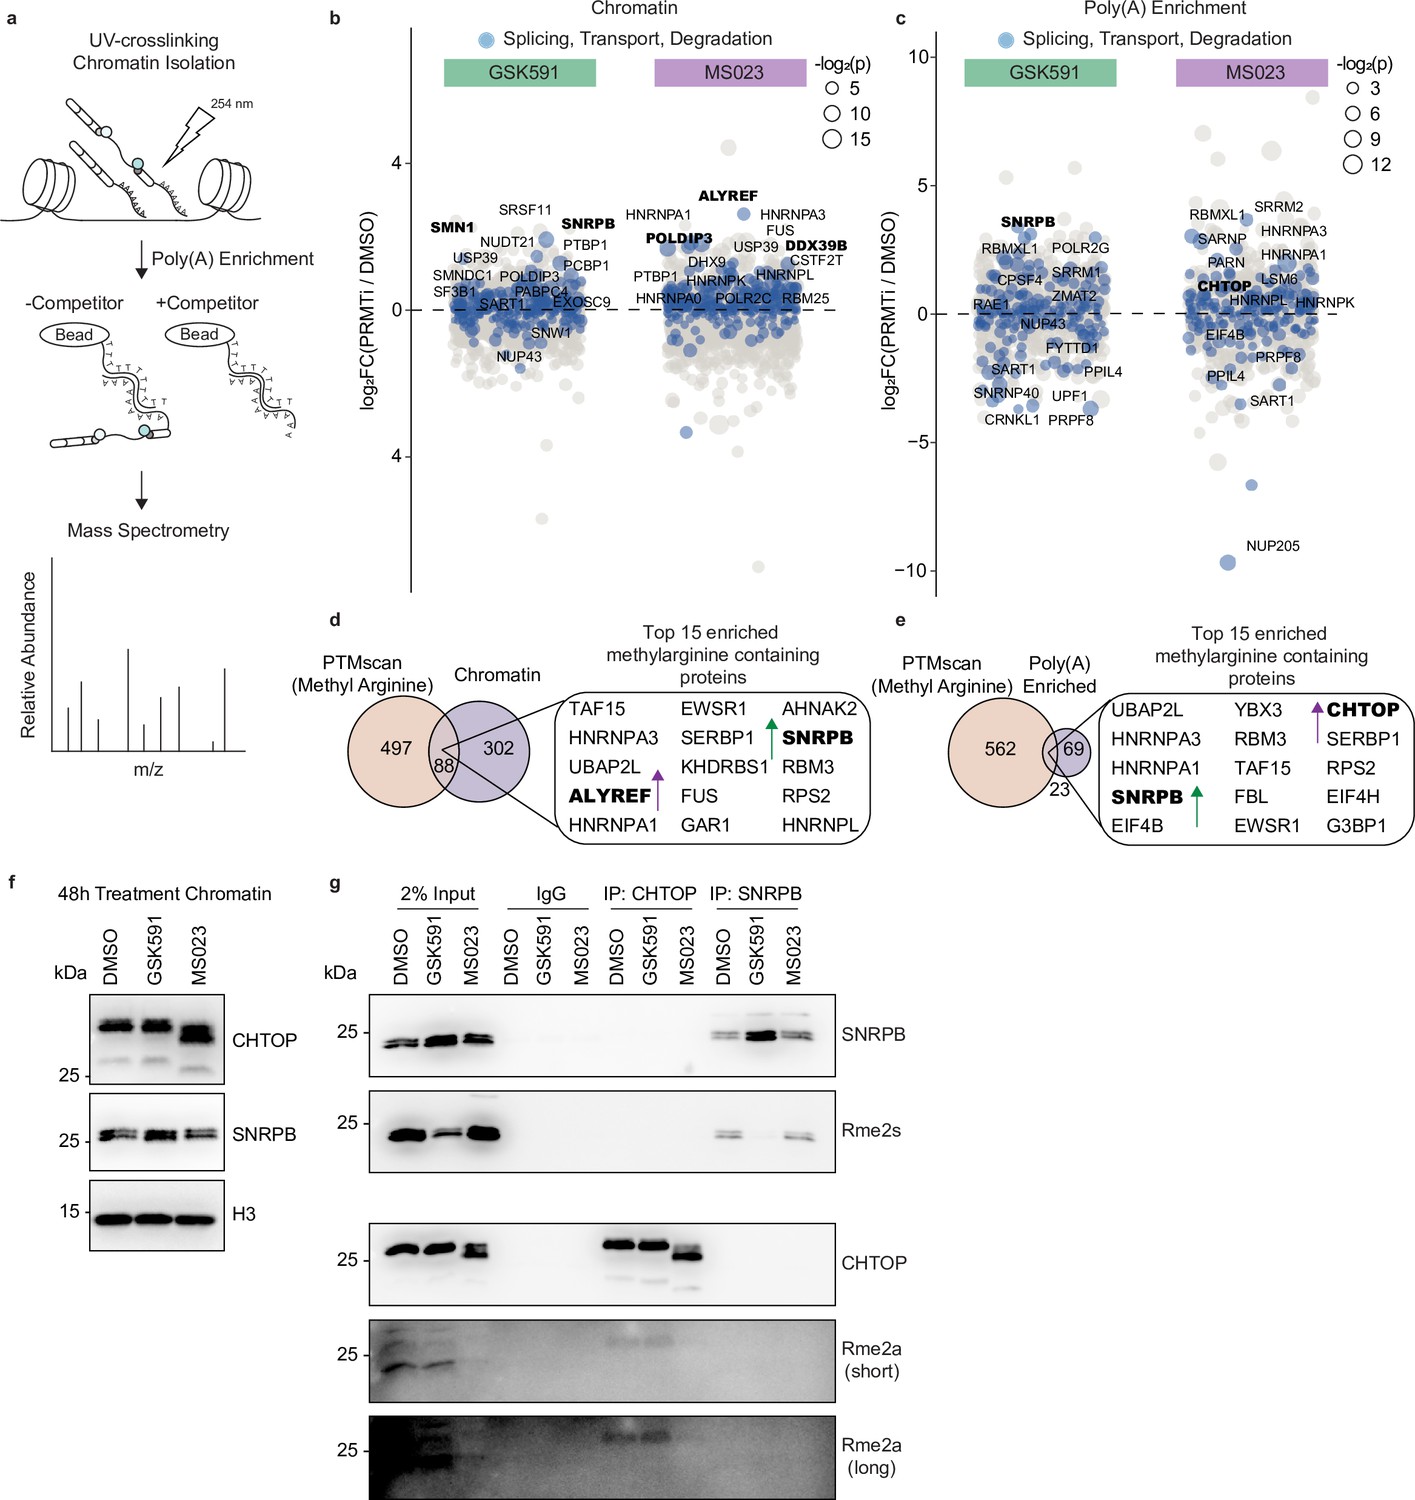
PRMT inhibition promotes aberrant binding of RNA processing factors to chromatin-associated poly(A) RNA.
(a) Overview of chromatin-associated poly(A)-RNA LC-MS/MS experiment. (b, c) Dot plot of proteins bound to chromatin (b) or chromatin-associated poly(A) RNA (c) relative to DMSO. Circle size is proportional to −log2(p). Colored values denote factors with ontology pertaining to RNA splicing, transport, or degradation. The names of the top 15 significant proteins are labeled. Significance determined using a heteroscedastic t-test. (d, e) Venn diagram comparing proteins containing methylarginine (Maron et al., 2021) and those that were differentially enriched in the chromatin (d) or chromatin-associated poly(A) (e) fractions following PRMT inhibition. (f) Western blot of chromatin following 2-day treatment with DMSO, GSK591, or MS023. See Figure 4—source data 1. (g) Immunoprecipitation and analysis of CHTOP and SNRPB methylarginine following treatment with DMSO, GSK591, or MS023 for 2 days. See Figure 4—source data 2.
-
Figure 4—source data 1
Western blot data for Figure 4f.
- https://cdn.elifesciences.org/articles/72867/elife-72867-fig4-data1-v2.zip
-
Figure 4—source data 2
Western blot data for Figure 4g.
- https://cdn.elifesciences.org/articles/72867/elife-72867-fig4-data2-v2.zip
Figure 4—figure supplement 1
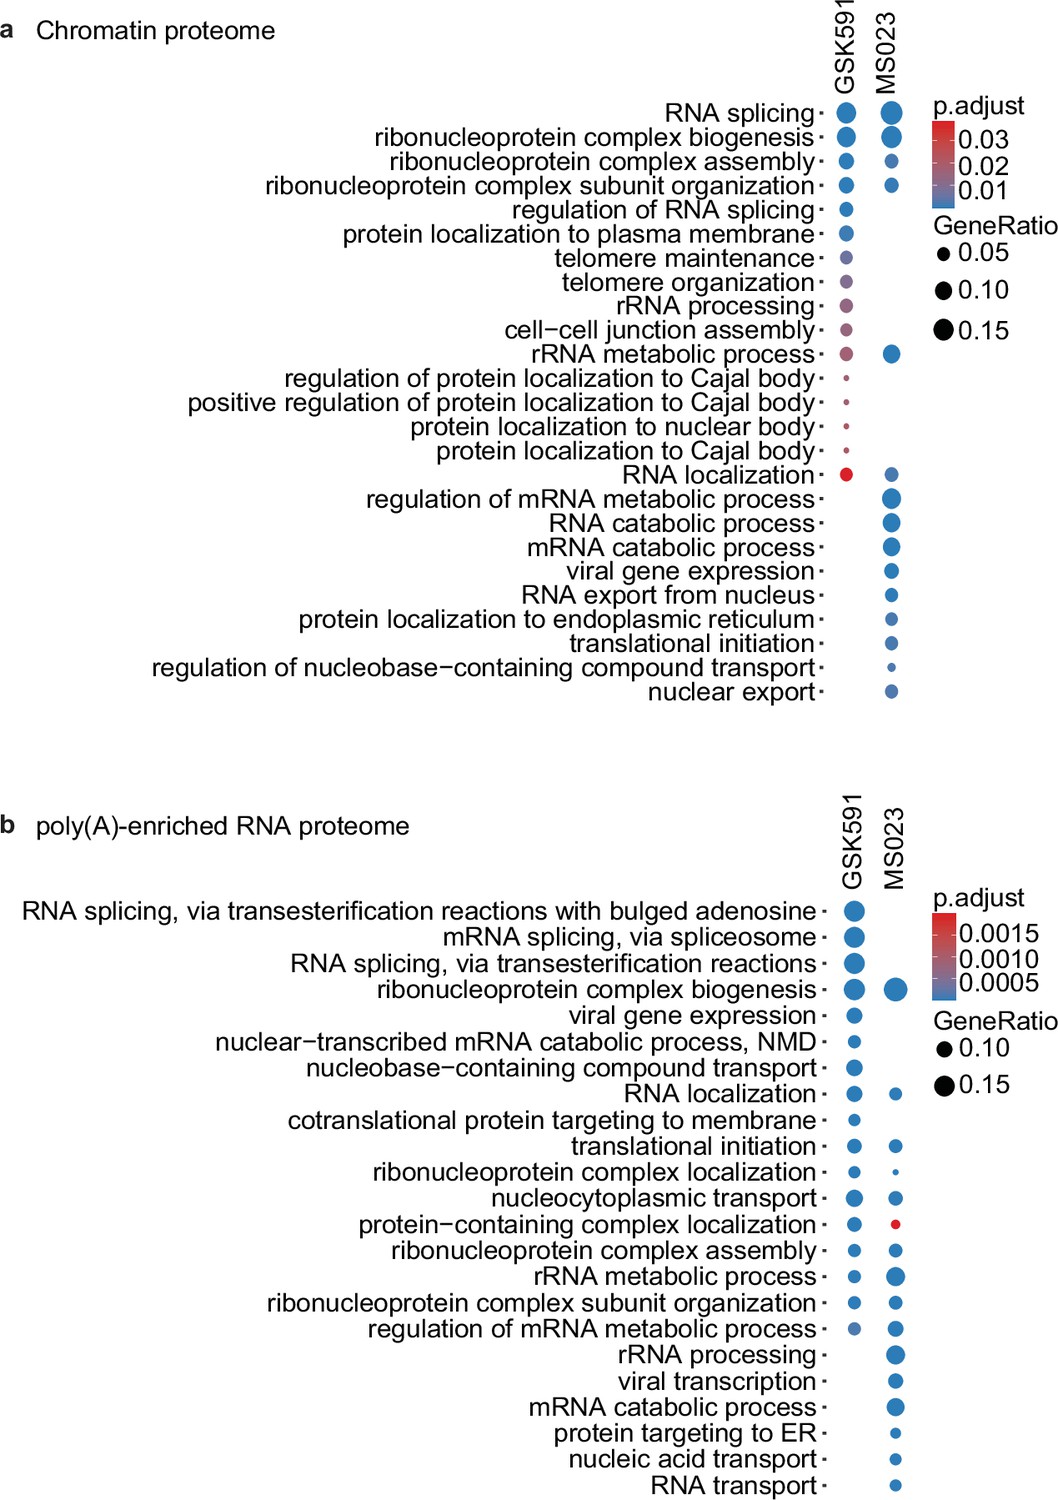
PRMT inhibition alters association of RNA splicing, localization, and processing factors to chromatin and chromatin-associated poly(A) RNA.
(a, b) Enriched biological processes found in the proteome of input chromatin (a) and chromatin-associated poly(A) RNA (b) in A549 cells treated with GSK591 or MS023 relative to DMSO.
Figure 5 with 2 supplements
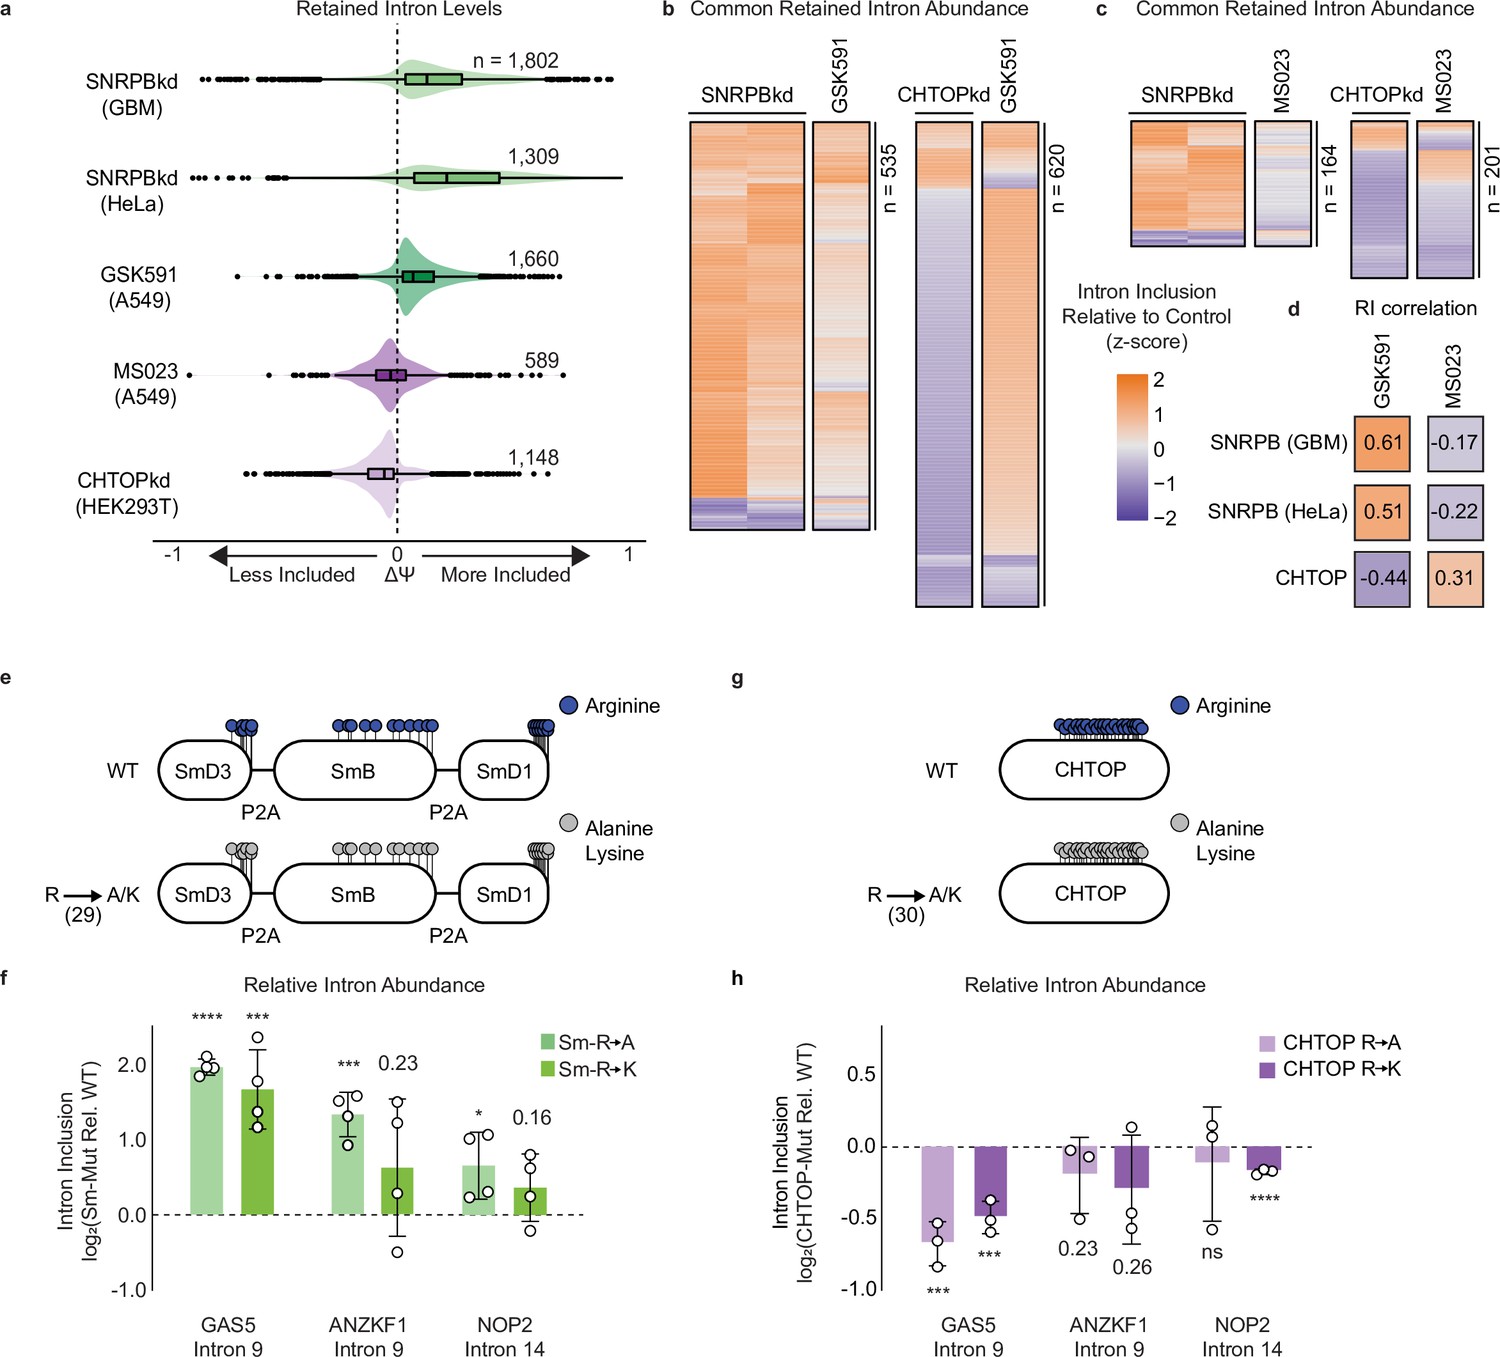
Sm and CHTOP methylarginine mediates PRMT-dependent RI.
(a) Comparison of ΔΨ for RI following SNRPB knockdown (kd), GSK591 treatment, MS023 treatment, and CHTOPkd where ΔΨ=Ψ (Treatment)–Ψ (Control). (b, c) Comparison of ΔΨ z-score for common RI between SNRPBkd and CHTOPkd with either GSK591 (b) or MS023 (c) treatment. (d) Spearman rank correlation of ΔΨ for common RI between SNRPBkd and CHTOPkd with either GSK591 or MS023 treatment. (e) Schematic of Sm expression constructs where lollipops represent individual methylarginines. (f) RT-qPCR of RI following transduction with Sm R-to-A or R-to-K mutants relative to wild-type (WT). Data are represented as mean ± SD. Significance determined using Student’s t-test; *<0.05, ***<0.001, ****<0.0001. (g) Schematic of CHTOP expression construct as in panel (e). (h) RT-qPCR of RI following transduction with CHTOP R-to-A or R-to-K mutants relative to WT. Data are represented as mean ± SD. Significance determined using Student’s t-test; ***<0.001, ****<0.0001, ns=not significant.
Figure 5—figure supplement 1
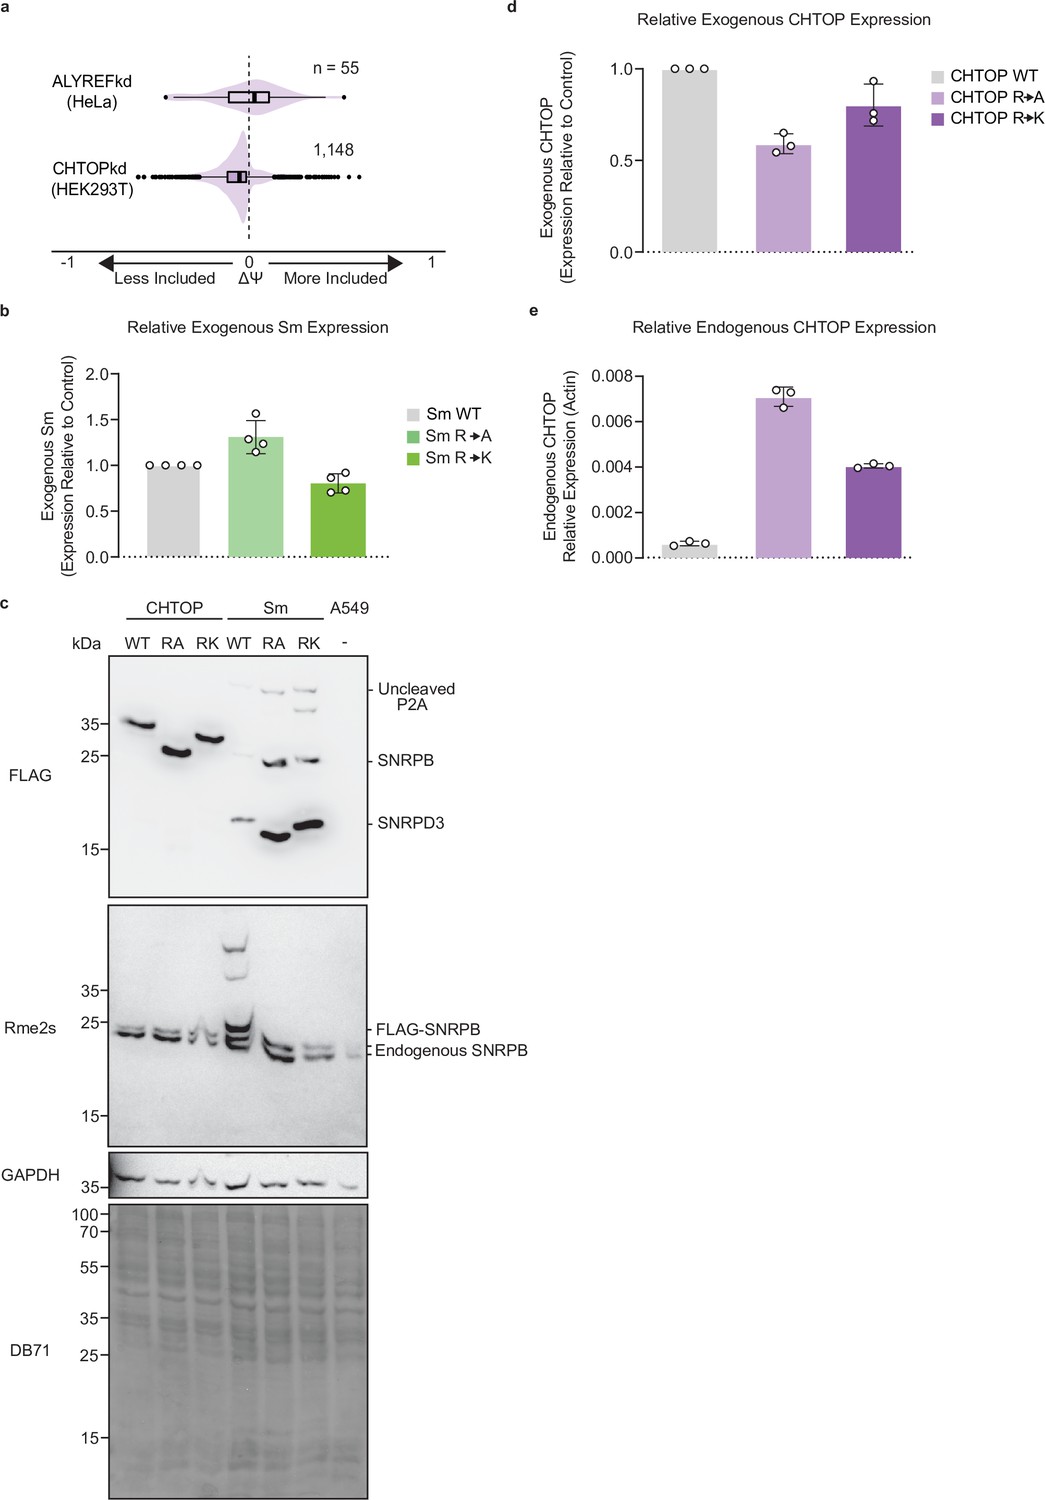
CHTOP and Sm arginine mutants phenocopy PRMT inhibition.
(a) Comparison of ΔΨ for RI following ALYREFkd and CHTOPkd where ΔΨ=Ψ (Treatment)–Ψ (Control). (b) RT-qPCR of Exogenous Sm R-to-A and R-to-K mutants normalized to wild-type (WT) expression vector. Data are represented as mean ± SD. (c) Western blot of total cell extract from A549 cells expressing CHTOP or Sm WT, R-to-A, or R-to-K mutants. DB71=Direct Blue 71 membrane stain. See Figure 5—figure supplement 1—source data 1. (e) RT-qPCR of Exogenous CHTOP R-to-A and R-to-K mutants normalized to WT expression vector. Data are represented as mean ± SD. (f) RT-qPCR of Endogenous CHTOP in A549 cells expressing CHTOP WT, R-to-A, or R-to-K mutants. Data are represented as mean ± SD.
-
Figure 5—figure supplement 1—source data 1
Western blot data for Figure 5—figure supplement 1c.
- https://cdn.elifesciences.org/articles/72867/elife-72867-fig5-figsupp1-data1-v2.zip
Figure 5—figure supplement 2
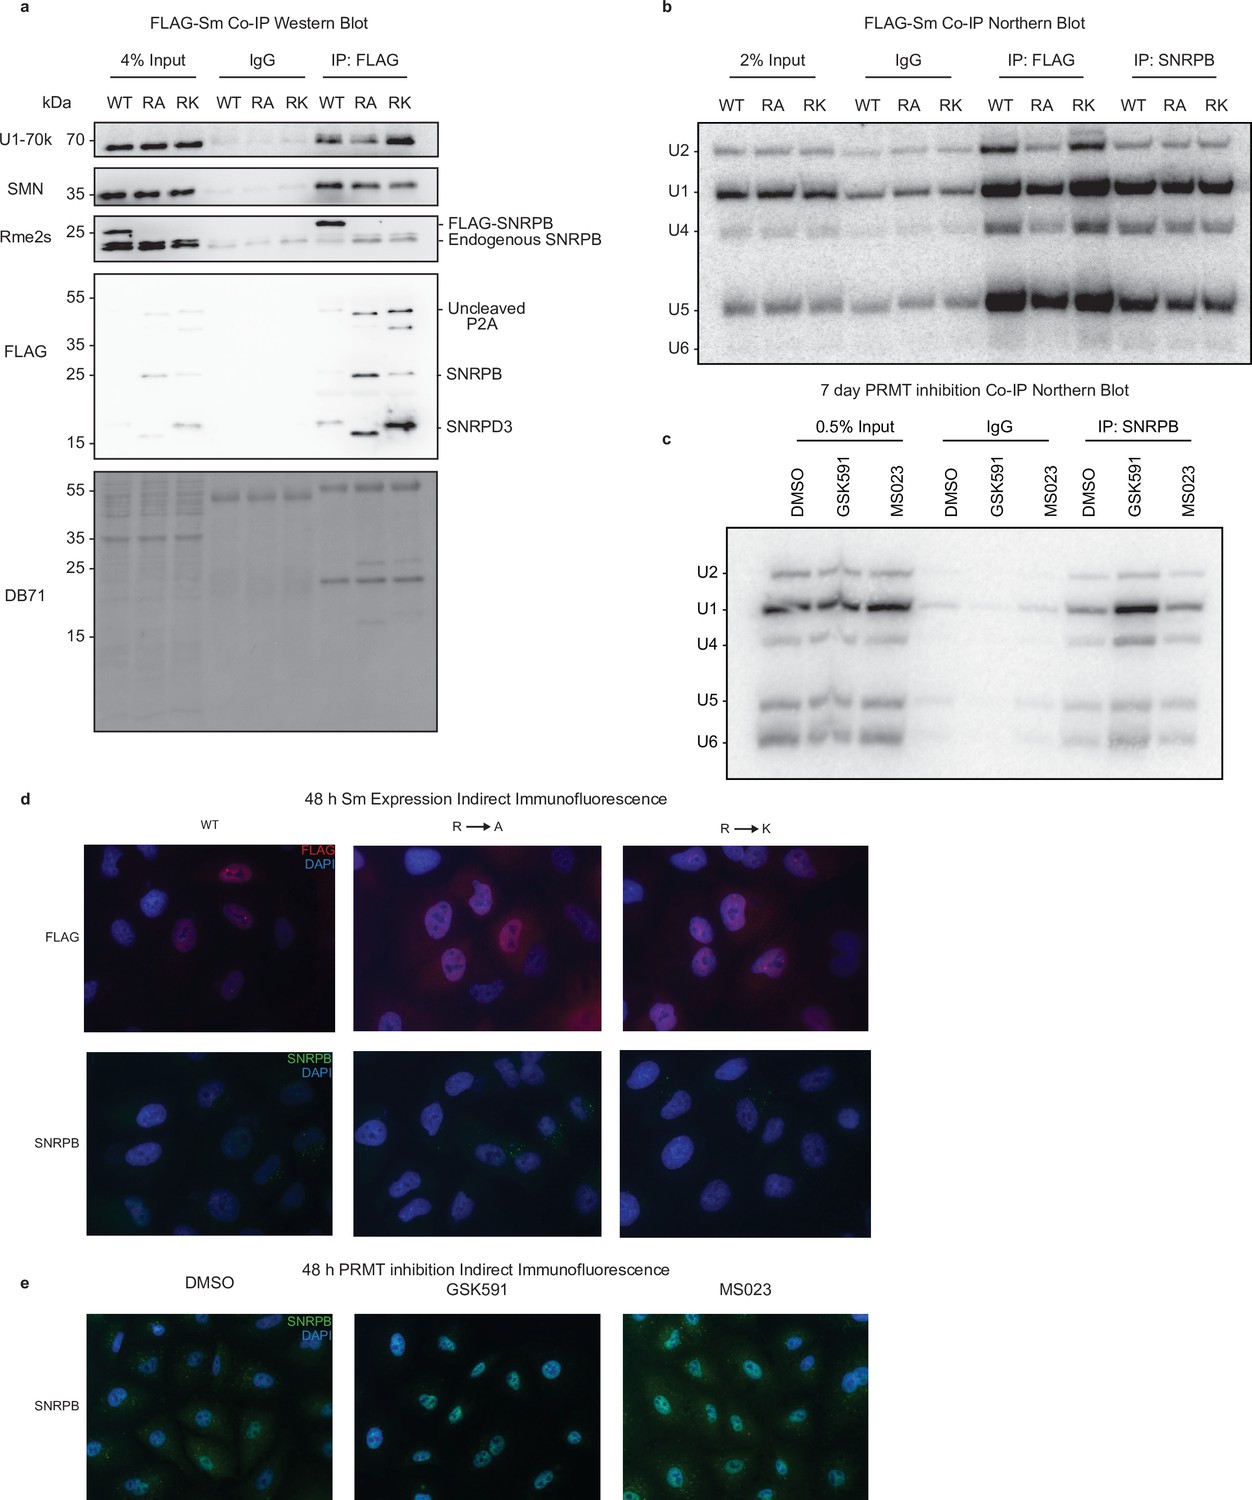
Sm methylarginine is dispensable for snRNP assembly.
(a) Western blot analysis of FLAG-targeted immunoprecipitation in A549 cells expressing Sm wild-type (WT), R-to-A, or R-to-K mutants. DB71=Direct Blue 71 membrane stain. See Figure 5—figure supplement 2—source data 1. (b) Northern blot analysis of snRNAs from FLAG- or SNRPB-targeted immunoprecipitation in A549 cells expressing Sm WT, R-to-A, or R-to-K mutants. See Figure 5—figure supplement 2—source data 2. (c) Northern blot analysis of snRNAs from SNRPB-targeted immunoprecipitation in A549 cells treated with DMSO, GSK591, or MS023 for 7 days. See Figure 5—figure supplement 2—source data 3. (d) Indirect immunofluorescence for FLAG (top/red) or SNRPB (bottom/green) in A549 cells expressing Sm WT, R-to-A, or R-to-K mutants. DAPI-nuclear stain is blue. See Figure 5—figure supplement 2—source data 4. (e) Indirect immunofluorescence for SNRPB (green) in A549 cells treated with DMSO, GSK591, or MS023 for 2 days. DAPI-nuclear stain is blue. See Figure 5—figure supplement 2—source data 5.
-
Figure 5—figure supplement 2—source data 1
Western blot data for Figure 5—figure supplement 2a.
- https://cdn.elifesciences.org/articles/72867/elife-72867-fig5-figsupp2-data1-v2.zip
-
Figure 5—figure supplement 2—source data 2
Northern blot data for Figure 5—figure supplement 2b.
- https://cdn.elifesciences.org/articles/72867/elife-72867-fig5-figsupp2-data2-v2.zip
-
Figure 5—figure supplement 2—source data 3
Northern blot data for Figure 5—figure supplement 2c.
- https://cdn.elifesciences.org/articles/72867/elife-72867-fig5-figsupp2-data3-v2.zip
-
Figure 5—figure supplement 2—source data 4
Image data for Figure 5—figure supplement 2d.
- https://cdn.elifesciences.org/articles/72867/elife-72867-fig5-figsupp2-data4-v2.zip
-
Figure 5—figure supplement 2—source data 5
Image data for Figure 5—figure supplement 2e.
- https://cdn.elifesciences.org/articles/72867/elife-72867-fig5-figsupp2-data5-v2.zip
Figure 6
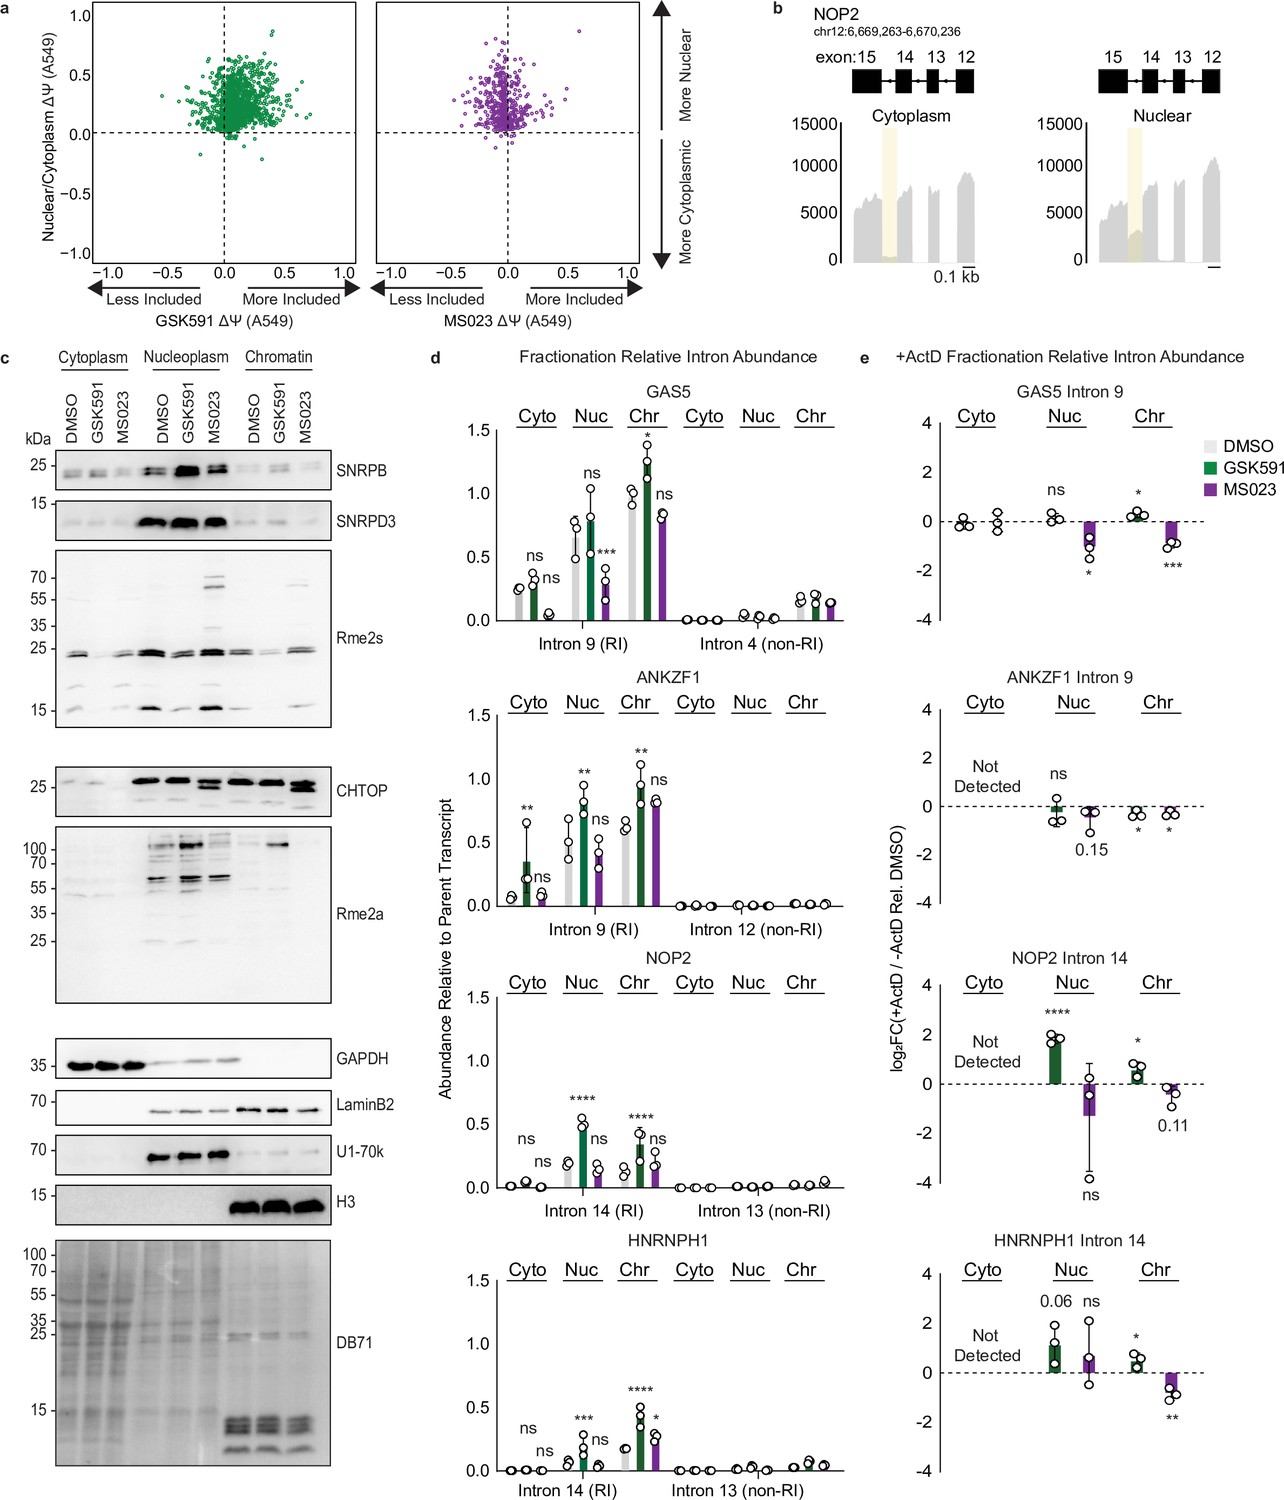
PRMT-dependent RI are localized to the nucleoplasm and chromatin.
(a) Scatter plot of ΔΨ for common RI in A549 nuclear/cytoplasmic fractions and GSK591 (left, green) or MS023 (right, purple) treated cells where ΔΨ=Ψ (Nuclear/PRMT inhibition)–Ψ (Cytoplasm/DMSO). (b) Genome browser track of poly(A)-RNA seq aligned reads for NOP2 in A549 cytoplasmic or nuclear fractions. (c) Western blot of cellular fractions following 2-day treatment with DMSO, GSK591, or MS023. DB71=Direct Blue 71 membrane stain. See Figure 6—source data 1. (d) RT-qPCR of RI or non-RI from cytoplasmic, nuclear, or chromatin fractions of A549 cells treated with DMSO, GSK591, or MS023 for 2 days. Data are represented as mean ± SD. Significance determined using two-way analysis of variance with Tukey’s multiple comparisons test; *<0.05, **<0.01, ***<0.001, ****<0.0001, ns=not significant. (e) RT-qPCR of RI (−) and (+) ActD relative to DMSO from cytoplasmic, nuclear, or chromatin fractions. Data are represented as mean ± SD. Significance determined using Student’s t-test; *<0.05, **<0.01, ***<0.001, ****<0.0001, ns=not significant.
-
Figure 6—source data 1
Western blot data for Figure 6c.
- https://cdn.elifesciences.org/articles/72867/elife-72867-fig6-data1-v2.zip
Figure 7
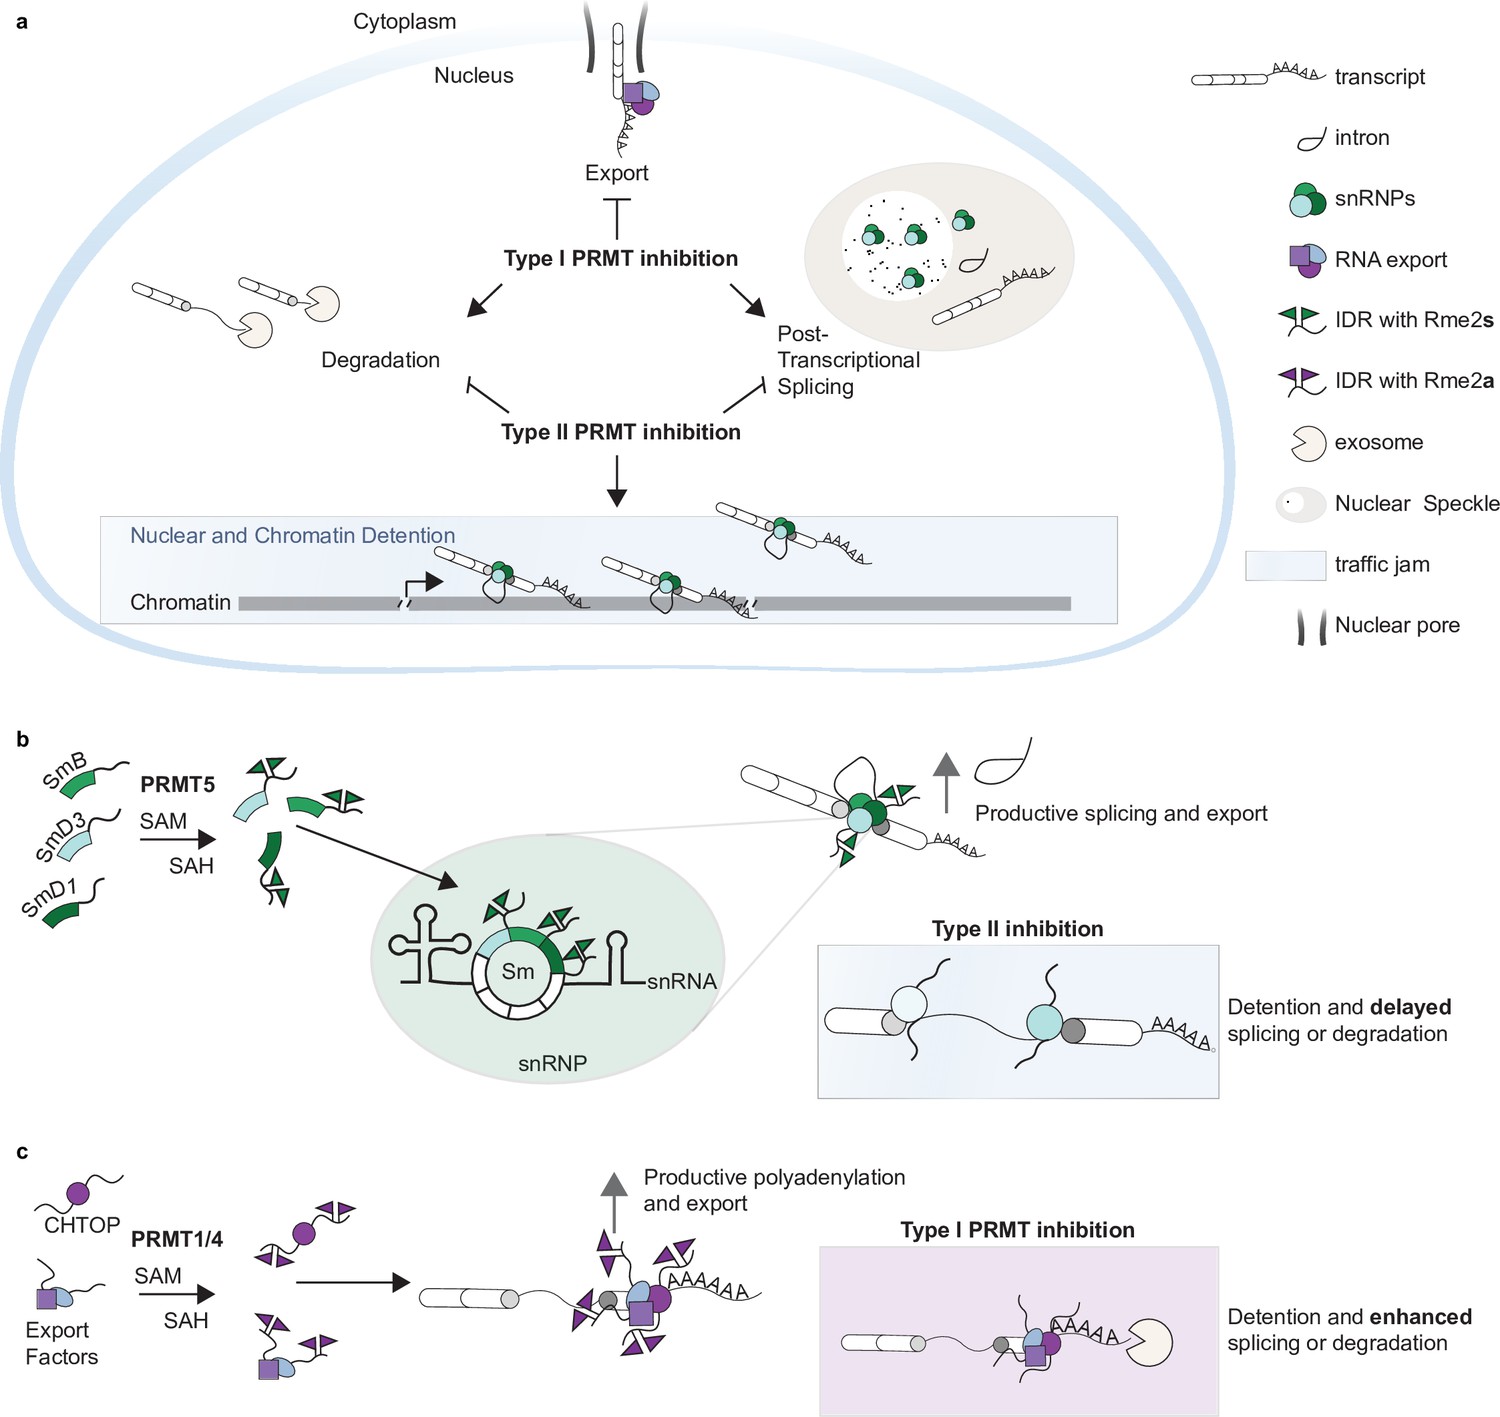
Type I and II PRMTs regulate post-transcriptional intron detention through Sm and CHTOP methylation.
(a–c) Model figures representing an overview of Type I- and Type II-dependent regulation of detained introns (DI) (a). Sm Rme2s is necessary for productive splicing and maturation of DI; absence of Rme2s results in detention of the parent transcript (b). Type I PRMT-catalyzed CHTOP Rme2a is required for appropriate polyadenylation and nuclear export of DI; absence of Rme2a increases nuclear residence time resulting in increased degradation or splicing (c).
Tables
Key resources table
| Reagent type (species) or resource | Designation | Source or reference | Identifiers | Additional information |
|---|---|---|---|---|
| Cell line (Homo sapiens) | A549 | ATCC | Cat#: CCL-185RRID:CVCL_0023 | |
| Transfected construct (H. sapiens) | Wild-type FLAG-SmD3-p2a-FLAG-SmB-p2a-V5-SmD1 | VectorBuilder | VB210103-1026dg | Lentiviral construct to transfect and express the wild-type Sm proteins. |
| Transfected construct (H. sapiens) | R-to-A FLAG-SmD3-p2a-FLAG-SmB-p2a-V5-SmD1 | VectorBuilder | VB210103-1027ttz | Lentiviral construct to transfect and express the R-to-A mutant Sm proteins. |
| Transfected construct (H. sapiens) | R-to-K FLAG-SmD3-p2a-FLAG-SmB-p2a-V5-SmD1 | VectorBuilder | VB210317-1185yxr | Lentiviral construct to transfect and express the R-to-K mutant Sm proteins. |
| Transfected construct (H. sapiens) | Wild-type FLAG-CHTOP | VectorBuilder | VB210427-1238rhx | Lentiviral construct to transfect and express the wild-type CHTOP protein. |
| Transfected construct (H. sapiens) | R-to-A FLAG-CHTOP | VectorBuilder | VB210427-1241jrw | Lentiviral construct to transfect and express the R-to-A CHTOP protein. |
| Transfected construct (H. sapiens) | R-to-K FLAG-CHTOP | VectorBuilder | VB210427-1242gjh | Lentiviral construct to transfect and express the R-to-K CHTOP protein. |
| Transfected construct (H. sapiens) | dCas9-KRAB-MeCP2 | VectorBuilder | VB900120-5303pyt | Lentiviral construct to transfect and express dCas9-KRAB-MeCP2. |
| Transfected construct (H. sapiens) | gRNA parent vector | VectorBuilder | VB210119-1169qwd | Lentiviral construct to clone, transfect, and expressPRMTkd gRNAs (see Materials and methods). |
| Antibody | Anti-human SNRPB (Rabbit polyclonal) | ProteinTech | Cat#: 16807-1-AP; RRID:AB_2878319 | WB: 1:2000IF: 1:125IP: 5 μg |
| Antibody | Anti-FLAG (Mouse monoclonal) | Sigma-Aldrich | Cat#: F1804; RRID:AB_262044 | WB: 1:10,000IF: 1:50IP: 5 μg |
| Antibody | Anti-Rabbit IgG (Goat polyclonal) | Thermo Fisher Scientific | Cat#: 35552; RRID:AB_844398 | IF: 1:1000 |
| Antibody | Anti-Mouse IgG (Goat polyclonal) | Thermo Fisher Scientific | Cat#: A28180RRID:AB_2536164 | IF: 1:1000 |
| Antibody | Anti-Rme2s (Rabbit polyclonal) | CST | Cat#: 13222SRRID:AB_2714013 | WB: 1:2000 |
| Antibody | Anti-Rme2a (Rabbit polyclonal) | CST | Cat#: 13522SRRID:AB_2665370 | WB: 1:2000 |
| Antibody | Anti-Rme1 (Rabbit polyclonal) | CST | Cat#: 8015SRRID:AB_10891776 | WB: 1:2000 |
| Antibody | Anti-Mouse CHTOP (Rat monoclonal) | LSBio | Cat#: LS-B11259-50 | WB: 1:2000IP: 5 μg |
| Antibody | Anti-human SNRPD3(Rabbit polyclonal) | Abcam | Cat#: ab157118 | WB: 1:2000 |
| Antibody | Anti-human LaminB2 (Mouse monoclonal) | Thermo Fisher Scientific | Cat#: MA1-06104RRID:AB_2136415 | WB: 1:2000 |
| Antibody | Anti-human U1-70k (Mouse monoclonal) | Santa Cruz Biotechnology | Cat#: sc-390988 | WB: 1:2000 |
| Antibody | Anti-human H3 (Rabbit polyclonal) | Abcam | Cat#: ab1791RRID:AB_302613 | WB: 1:100,000 |
| Antibody | Anti-human GAPDH (Mouse monoclonal) | Abcam | Cat#: ab9484RRID:AB_307274 | WB: 1:10,000 |
| Antibody | Anti-human PRMT1 (Rabbit polyclonal) | Millipore | Cat#: 07-404RRID:AB_11212188 | WB: 1:2000 |
| Antibody | Anti-human PRMT5 (Rabbit polyclonal) | Millipore | Cat#: 07-405RRID:AB_310589 | WB: 1:2000 |
| Antibody | Anti-Rat IgG HRP (Goat polyclonal) | Millipore | Cat#: AP183PMI | WB: 1:100,000 |
| Antibody | Anti-Rabbit IgG HRP (Goat polyclonal) | Cytiva | Cat#: NA934 | WB: 1:100,000 |
| Antibody | Anti-Mouse IgG HRP (Goat polyclonal) | Cytiva | Cat#: NA931 | WB: 1:100,000 |
| Chemical compound, drug | DMSO | Acros Organics | Cat#: D/4125/PB08 | |
| Chemical compound, drug | GSK591 | Cayman | Cat#: 18354 | |
| Chemical compound, drug | MS023 | Cayman | Cat#: 18361 | |
| Chemical compound, drug | Actinomycin D | Sigma-Aldrich | Cat#: A1410 | |
| Software, algorithm | STAR | Dobin et al., 2013 | RRID:SCR_004463 | Version 2.4.2 |
| Software, algorithm | rMATS | Shen et al., 2014 | RRID:SCR_013049 | Version 4.1.0 |
| Software, algorithm | Kallisto | Bray et al., 2016 | RRID:SCR_016582 | Version 0.46.0 |
| Software, algorithm | Proteome Discoverer software | Thermo Fisher Scientific | Version 2.4 | |
| Software, algorithm | Prism | Graphpad | RRID:SCR_002798 | |
| Software, algorithm | R | R Project | RRID:SCR_001905 | Version 4.0.2 |
| Other | DAPI Prolong gold | Invitrogen | Cat#: P36941 |
Additional files
-
Supplementary file 1
Chromatin-Associated Poly(A) RNA Enrichment.
Enrichment and relative abundance of proteins in chromatin or chromatin-associated poly(A) RNA following treatment with DMSO, GSK591, or MS023 for two days.
- https://cdn.elifesciences.org/articles/72867/elife-72867-supp1-v2.xlsx
-
Supplementary file 2
Oligonucleotide sequences used in this study.
- https://cdn.elifesciences.org/articles/72867/elife-72867-supp2-v2.xlsx
-
Supplementary file 3
Publicly available data used in this study.
- https://cdn.elifesciences.org/articles/72867/elife-72867-supp3-v2.xlsx
-
Transparent reporting form
- https://cdn.elifesciences.org/articles/72867/elife-72867-transrepform1-v2.docx
Download links
A two-part list of links to download the article, or parts of the article, in various formats.
Downloads (link to download the article as PDF)
Open citations (links to open the citations from this article in various online reference manager services)
Cite this article (links to download the citations from this article in formats compatible with various reference manager tools)
Type I and II PRMTs inversely regulate post-transcriptional intron detention through Sm and CHTOP methylation
eLife 11:e72867.
https://doi.org/10.7554/eLife.72867


