Intergenerational adaptations to stress are evolutionarily conserved, stress-specific, and have deleterious trade-offs
- Centre for Trophoblast Research, Department of Physiology, Development and Neuroscience, University of Cambridge, United Kingdom
- Gurdon Institute, University of Cambridge, United Kingdom
- Van Andel Institute, United States
- Department of Molecular Genetics, University of Toronto, Canada
- Department of Biology, Duke University, United States
- Department of Molecular Biosciences, Northwestern University, United States
- Wellcome Sanger Institute, Wellcome Genome Campus, United Kingdom
- Center for Genomic and Computational Biology, Duke University, United States
- Department of Genetics, University of Cambridge, United Kingdom
Figures
Figure 1 with 1 supplement
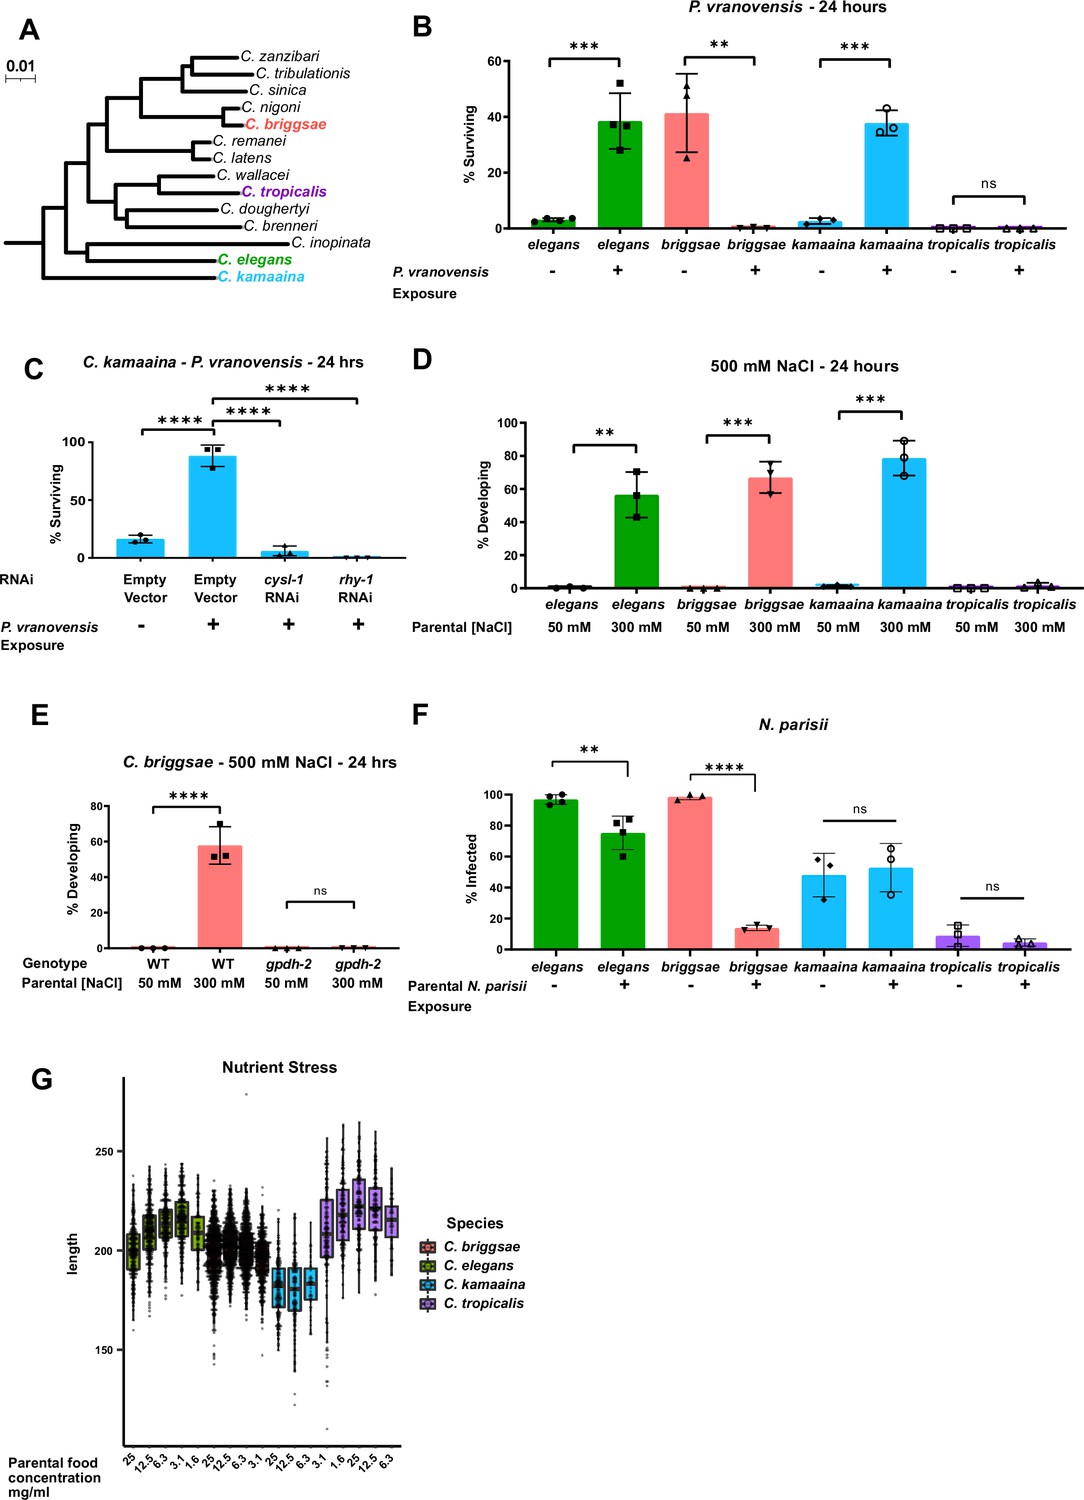
Intergenerational adaptations to multiple stresses are evolutionarily conserved in multiple species of Caenorhabditis.
(A) Phylogenetic tree of the Elegans group of Caenorhabditis species adapted from Stevens et al., 2020. Scale represents substitutions per site. (B) Percent of wild-type C. elegans (N2), C. kamaaina (QG122), C. briggsae (AF16), and C. tropicalis (JU1373) animals surviving after 24 hr on plates seeded with P. vranovensis BIGb0446. Data presented as mean values ± s.d. n = 3–4 experiments of >100 animals. (C) Percent of C. kamaaina wild-type (QG122) animals surviving after 24 hr of exposure to P. vranovensis. Data presented as mean values ± s.d. n = 3 experiments of >100 animals. (D) Percent of wild-type animals mobile and developing at 500 mM NaCl after 24 hr. Data presented as mean values ± s.d. n = 3 experiments of >100 animals. (E) Percent of wild-type and Cbr-gpdh-2(syb2973) mutant C. briggsae (AF16) mobile and developing after 24 hr at 500 mM NaCl. Data presented as mean values ± s.d. n = 3 experiments of >100 animals. (F) Percent of animals exhibiting detectable infection by N. parisii as determined by DY96 staining after 72 hr for C. elegans and C. briggsae, or 96 hr for C. kamaaina and C. tropicalis. Data presented as mean values ± s.e.m. n = 3–4 experiments of 83–202 animals. (G) Boxplots for length of L1 progeny from P0 parents that were subject to the HB101 dose series. Larvae were measured using Wormsizer. Boxplots show median length with four quartiles. n = 3–8 experiments of 50–200 animals. **p < 0.01, ***p < 0.0001, ****p < 0.0001.
-
Figure 1—source data 1
Statistics source data for Figure 1.
- https://cdn.elifesciences.org/articles/73425/elife-73425-fig1-data1-v2.xlsx
Figure 1—figure supplement 1
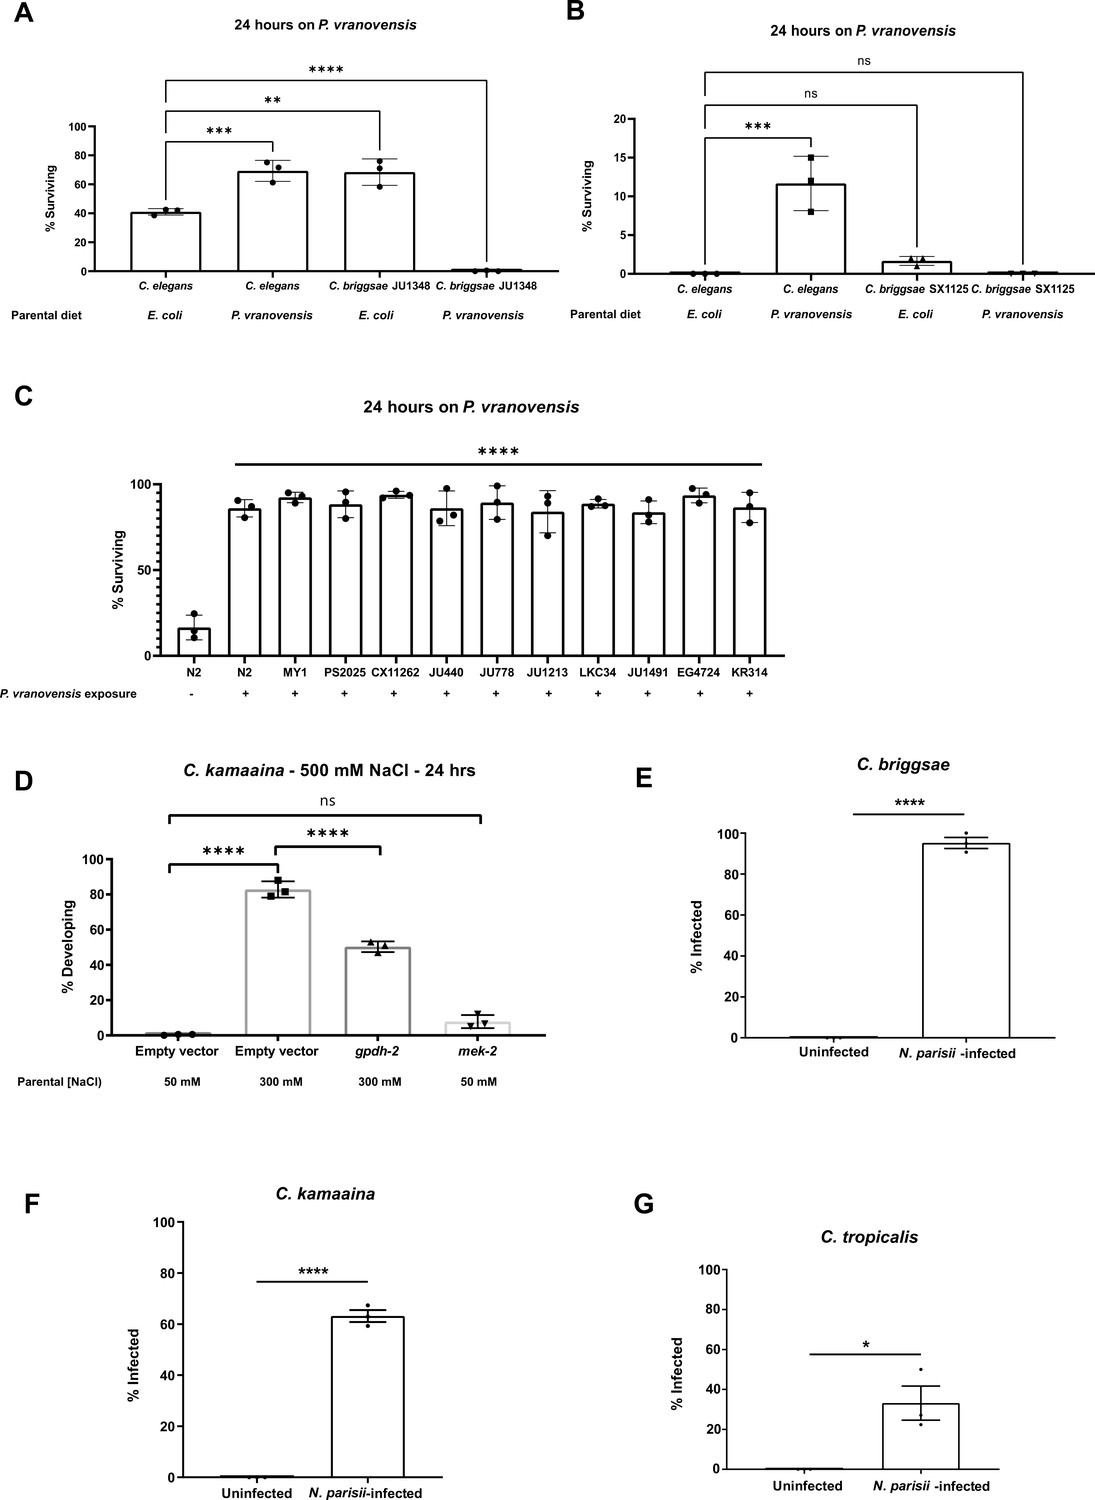
Intergenerational responses to environmental stress are conserved in wild isolates of Caenorhabditis species.
(A) Percent of wild-type C. elegans (N2) and C. briggsae (JU1348) animals surviving after 24 hr on plates seeded with P. vranovensis BIGb0446. Data presented as mean values ± s.d. n = 3 experiments of >100 animals. (B) Percent of wild-type C. elegans (N2) and C. briggsae (SX1125) animals surviving after 24 hr on plates seeded with P. vranovensis BIGb0446. Data presented as mean values ± s.d. n = 3 experiments of >100 animals. (C) Percent of wild-type C. elegans isolates surviving after 24 hr on plates seeded with P. vranovensis BIGb0446. Data presented as mean values ± s.d. n = 3 experiments of >100 animals. (D) Percent of wild-type C. kamaaina animals mobile and developing at 500 mM NaCl after 24 hr. Data presented as mean values ± s.d. n = 3 experiments of >100 animals. (E–G) Percent of animals exhibiting detectable infection by N. parisii as determined by DY96 staining after 72 hr for C. elegans and C. briggsae, or 96 hr for C. kamaaina and C. tropicalis. Data presented as mean values ± s.e.m. n = 3 experiments of 68–115 animals (E), 27–102 animals (F), and 38–104 animals ( G). * p < 0.05, ** p < 0.01, *** p < 0.001, **** p < 0.0001.
Figure 2 with 1 supplement
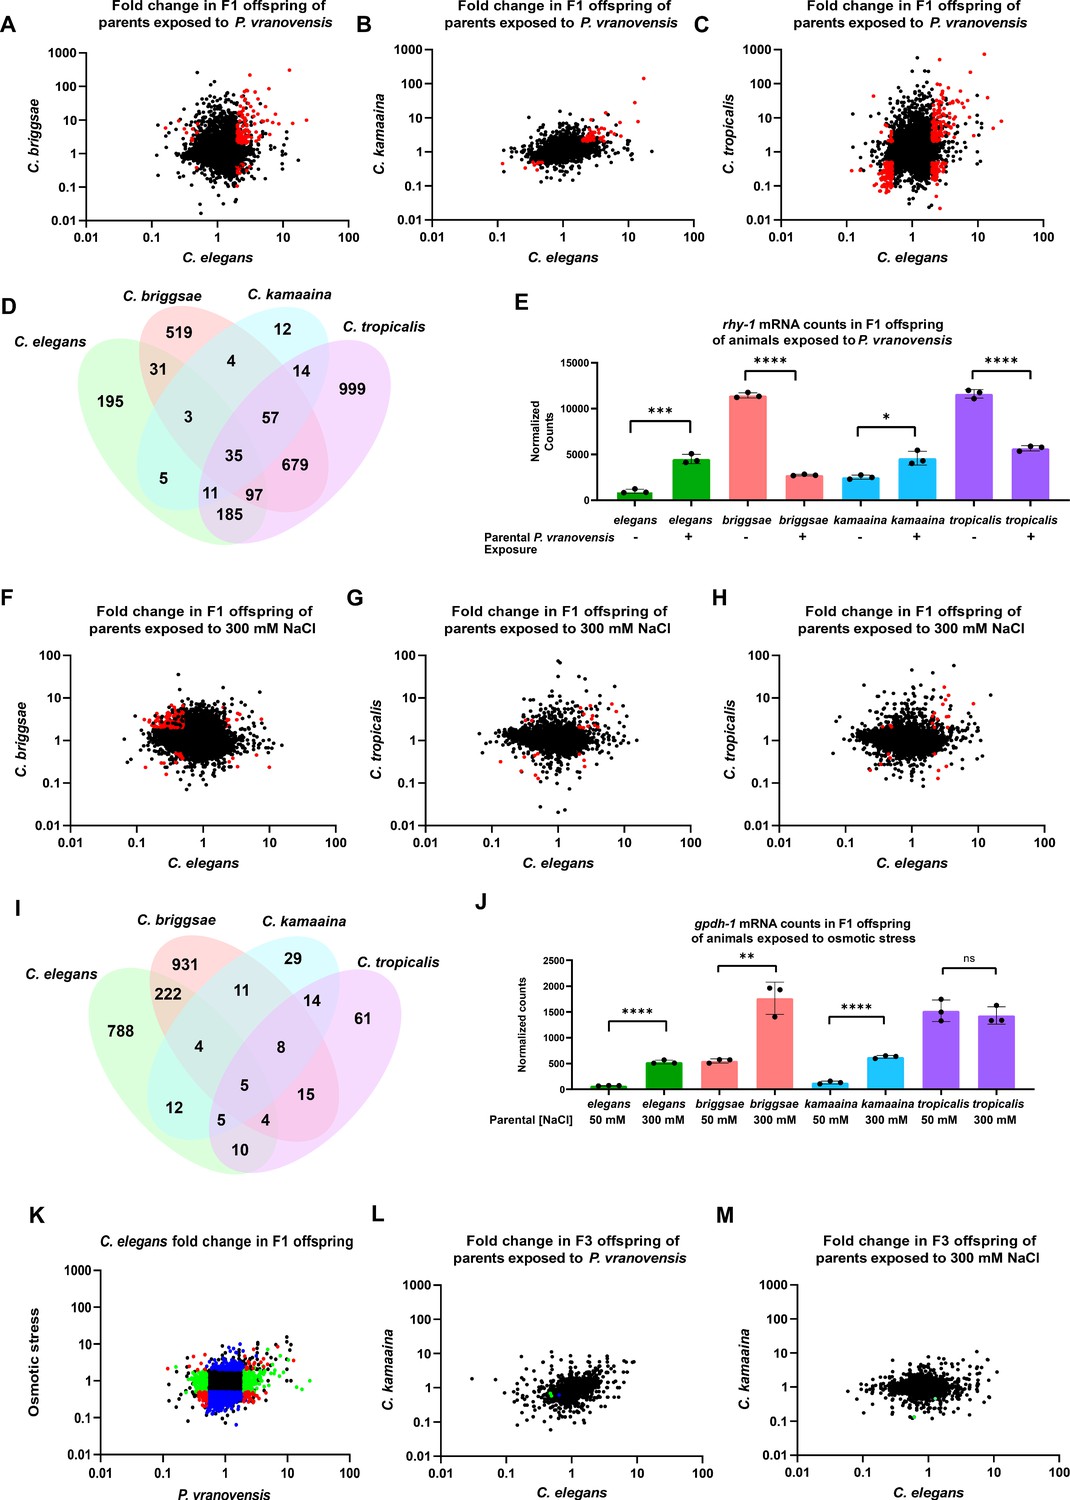
Parental exposure to P. vranovensis and osmotic stress have overlapping effects on offspring gene expression across multiple species.
(A) Average fold change of 7587 single-copy ortholog genes in F1 progeny of C. elegans and C. briggsae parents fed P. vranovensis BIGb0446 when compared to parents fed E. coli HB101. Average fold change from three replicates. Red dots represent genes that exhibit >twofold (padj <0.01) changes in expression in both species. (B) Average fold change of 7587 single-copy ortholog genes in F1 progeny of C. elegans and C. kamaaina parents fed P. vranovensis BIGb0446 when compared to parents fed E. coli HB101. Average fold change from three replicates. Red dots represent genes that exhibit >twofold (padj <0.01) changes in expression in both species. (C) Average fold change of 7587 single-copy ortholog genes in F1 progeny of C. elegans and C. tropicalis parents fed P. vranovensis BIGb0446 when compared to parents fed E. coli HB101. Average fold change from three replicates. Red dots represent genes that exhibit > twofold (padj <0.01) changes in expression in both species (D) Venn diagram of the number of genes that exhibit overlapping >2 fold (padj <0.01) changes in expression in F1 progeny of animals exposed to P. vranovensis BIGb0446 in each species. (E) Normalized counts of reads matching orthologs of rhy-1 in the F1 offspring of parents fed either E. coli HB101 or P. vranovensis BIGb0446. Data from Supplementary file 2. n = 3 replicates. (F) Average fold change of 7587 single-copy ortholog genes in F1 progeny of C. elegans and C. briggsae parents grown at 300 mM NaCl when compared to parents grown at 50 mM NaCl. Average fold change from three replicates. Red dots represent genes that exhibit >twofold (padj <0.01) changes in expression in both species. (G) Average fold change of 7587 single-copy ortholog genes in F1 progeny of C. elegans and C. kamaaina parents grown at 300 mM NaCl when compared to parents grown at 50 mM NaCl. Average fold change from three replicates. Red dots represent genes that exhibit >twofold (padj <0.01) changes in expression in both species in both species. (H) Average fold change of 7587 single-copy ortholog genes in F1 progeny of C. elegans and C. tropicalis parents grown at 300 mM NaCl when compared to parents grown at 50 mM NaCl. Average fold change from three replicates. Red dots represent genes exhibit >twofold (padj <0.01) changes in expression in both species. (I) Venn diagram of the number of genes that exhibit overlapping >twofold (padj <0.01) changes in expression in F1 progeny of animals grown at 300 mM NaCl in each species. (J) Normalized counts of reads matching orthologs of gpdh-1 in the F1 progeny of parents grown at either 300 mM NaCl or 50 mM NaCl. Data from Supplementary file 3. n = 3 replicates. (K) Average fold change for 7587 ortholog genes in F1 progeny of C. elegans parents fed P. vranovensis or exposed to 300 mM NaCl when compared to naive parents. Average fold change from three replicates. Red dots – genes that change in expression in response to both stresses. Blue dots – genes that change in expression in response to only osmotic stress. Green dots – genes that change in expression in response to only P. vranovensis. (L) Average fold change of 7512 single-copy ortholog genes in F3 progeny of C. elegans and C. kamaaina fed P. vranovensis BIGb0446 when compared to those fed E. coli HB101. Average fold change from three replicates. Blue dots represent genes that exhibited >twofold (padj <0.01) changes in expression in C. elegans. Green dots represent genes that exhibited >twofold (padj <0.01) changes in expression in C. kamaaina. (M) Average fold change of 7512 single-copy ortholog genes in F1 progeny of C. elegans and C. kamaaina parents grown at 300 mM NaCl when compared to parents grown at 50 mM NaCl. Average fold change from three replicates. Green dots represent genes that exhibited >twofold (padj <0.01) changes in expression in C. kamaaina. *p < 0.05, **p < 0.01, ***p < 0.0001, ****p < 0.0001.
Figure 2—figure supplement 1
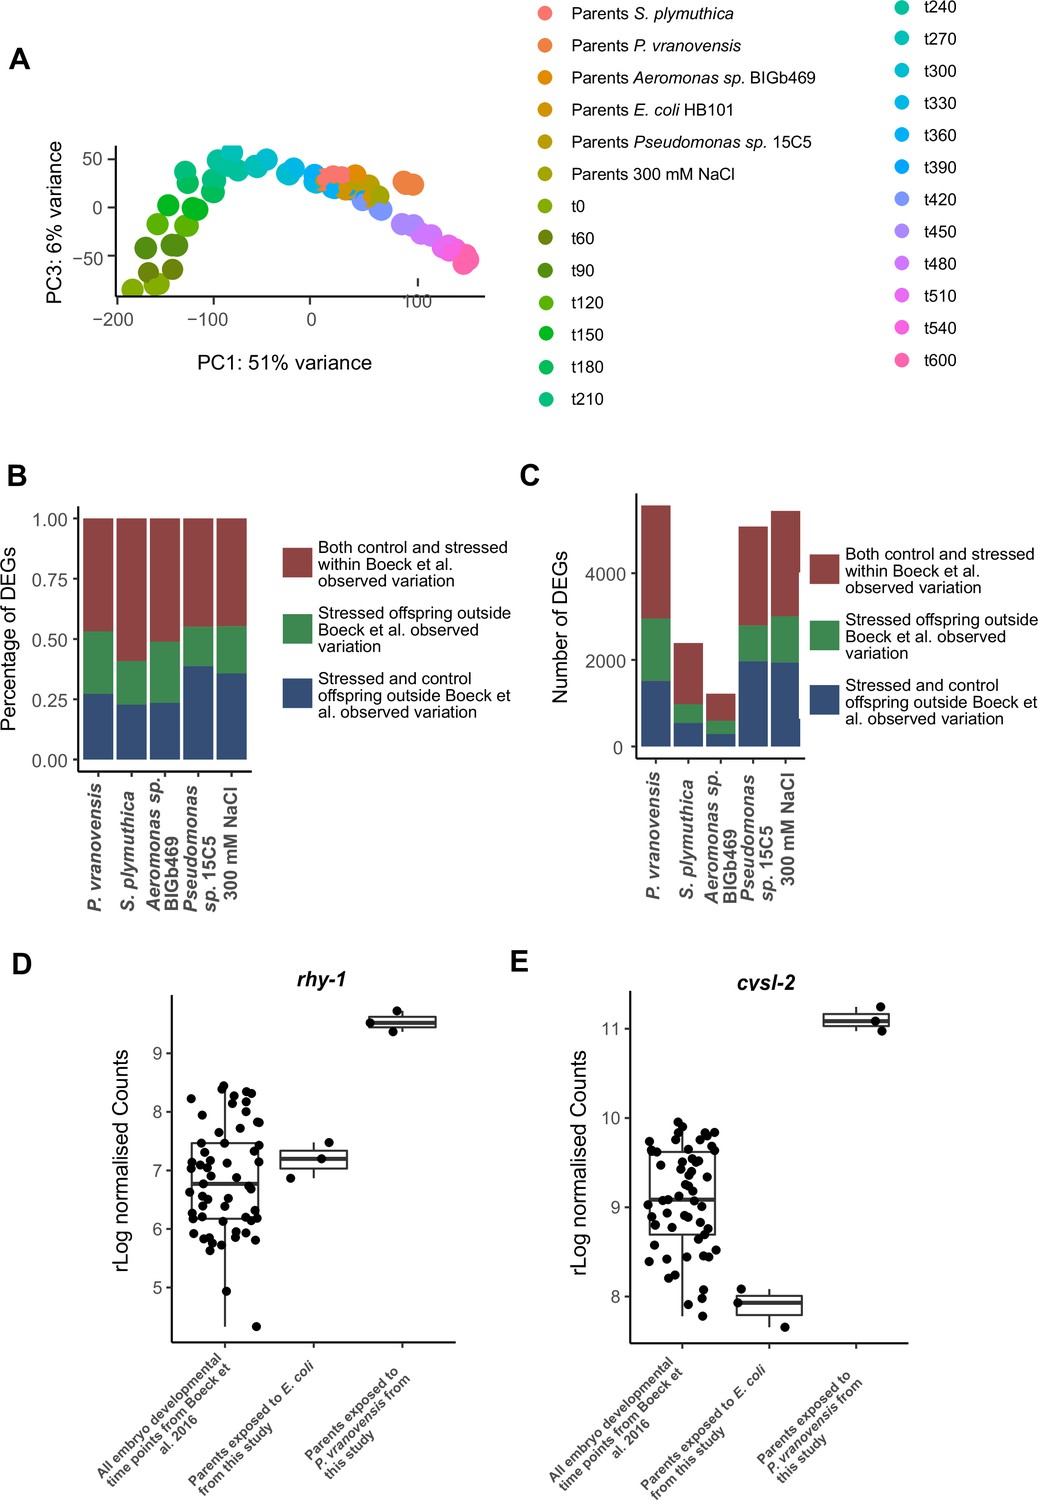
Differences in developmental timing are insufficient to explain a majority of the observed differences in gene expression in the offspring of stressed parents.
(A) PCA of gene expression from Boeck et al., 2016 compared to RNA-seq data reported in the study. Time points of development are in minutes, t60 = 60 min postfertilization. (B) Percentage of genes differentially expressed in the offspring of parents exposed to different stresses that exhibit DESeq2 normalized counts that fall within or outside one standard deviation of the average normalized counts observed throughout all developmental time points from Boeck et al., 2016. (C) Total number of genes differentially expressed in the offspring of parents exposed to different stresses that exhibit DESeq2 normalized counts that fall within or outside one standard deviation of the average normalized counts observed throughout all developmental time points from Boeck et al., 2016. (D) rhy-1 normalized counts from all time points during development from Boeck et al., 2016, the offspring of parents exposed to E. coli HB101 (this study), or the offspring of parents exposed to P. vranovensis (this study). (E) cysl-2 normalized counts from all time points during development from Boeck et al., 2016, the offspring of parents exposed to E. coli HB101 (this study), or the offspring of parents exposed to P. vranovensis (this study).
Figure 3

Intergenerational adaptations to stress are stress-specific and have deleterious tradeoffs.
(A) Percent of wild-type C. elegans mobile and developing at 500 mM NaCl after 24 hr. Data presented as mean values ± s.d. n = 3 experiments of >100 animals. (B) Percent of wild-type C. elegans surviving after 24 hr of exposure to P. vranovensis BIGb0446. Data presented as mean values ± s.d. n = 3 experiments of >100 animals. (C) Percent of wild-type and osm-8(n1518) C. elegans surviving after 24 hr of exposure to P. vranovensis BIGb0446. Data presented as mean values ± s.d. n = 3 experiments of >100 animals. (D) Percent of wild-type C. elegans mobile and developing at 420 mM NaCl after 48 hr. Data presented as mean values ± s.d. n = 3 experiments of >100 animals. (E) N. parisii parasite burden of individual C. elegans after 72 hr (as determined by percentage fluorescence from DY96-stained spores after 72 hr). Data presented as mean values ± s.e.m. n = 4 experiments of 25 animals (F) N. parisii parasite burden of individual C. elegans after 72 hr (as determined by percentage fluorescence from DY96-stained spores after 72 hr). Data presented as mean values ± s.e.m. n = 3 experiments of 25 animals. (G) Percent of wild-type C. elegans surviving after 24 hr of exposure to P. vranovensis BIGb0446. Data presented as mean values ± s.e.m. n = 3 experiments of >100 animals. *p < 0.05, **p < 0.01, ***p < 0.0001, ****p < 0.0001.
-
Figure 3—source data 1
Statistics source data for Figure 3.
- https://cdn.elifesciences.org/articles/73425/elife-73425-fig3-data1-v2.xlsx
Figure 4 with 1 supplement
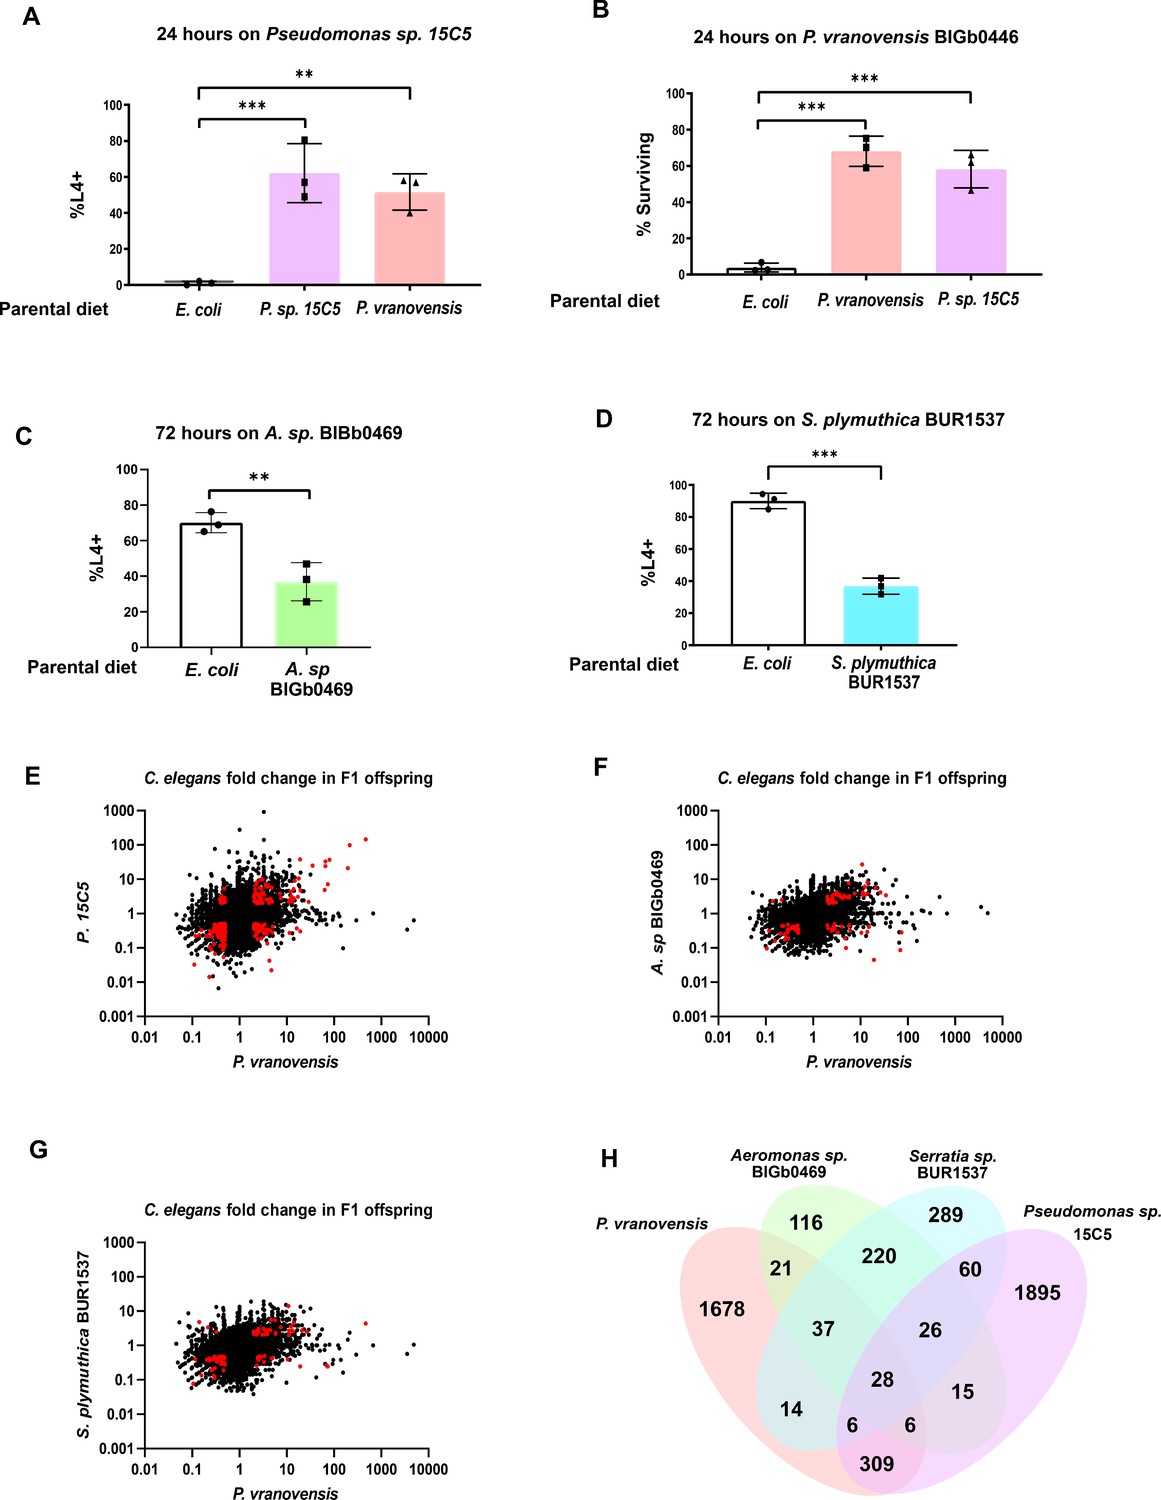
Many of the intergenerational effects of parental exposure to bacterial pathogens on offspring gene expression are pathogen specific.
(A) Percent of wild-type C. elegans that developed to the L4 larval stage after 48 hr of feeding on Pseudomonas sp. 15C5. Data presented as mean values ± s.d. n = 3 experiments of >100 animals. (B) Percent of wild-type C. elegans surviving after 24 hr of exposure to P. vranovensis BIGb0446. Data presented as mean values ± s.d. n = 3 experiments of >100 animals. (C) Percent of wild-type C. elegans that developed to the L4 larval stage after 48 hr of feeding on Aeromonas sp. BIGb0469. Data presented as mean values ± s.d. n = 3 experiments of >100 animals. (D) Percent of wild-type C. elegans that developed to the L4 larval stage after 48 hr of feeding on Serratia plymuthica BUR1537. Data presented as mean values ± s.d. n = 3 experiments of >100 animals. (E) Average fold change of genes in F1 progeny of C. elegans fed either Pseudomonas sp. 15C5 or P. vranovensis BIGb0446 when compared to parents fed E. coli HB101. Average fold change from three replicates. Red dots represent genes that exhibit statistically significant (padj <0.01) changes in the F1 offspring of parents fed both Pseudomonas sp. 15C5 and P. vranovensis BIGb0446. (F) Average fold change of genes in F1 progeny of C. elegans fed either Aeromonas sp. BIGb0469 or P. vranovensis BIGb0446 when compared to parents fed E. coli HB101. Average fold change from three replicates. Red dots represent genes that exhibit statistically significant (padj <0.01) changes in the F1 offspring of parents fed both Aeromonas sp. BIGb0469 and P. vranovensis BIGb0446. (G) Average fold change of genes in F1 progeny of C. elegans fed either S. plymuthica BUR1537 or P. vranovensis BIGb0446 when compared to parents fed E. coli HB101. Average fold change from three replicates. Red dots represent genes that exhibit statistically significant (padj <0.01) changes in the F1 offspring of parents fed both S. plymuthica BUR1537 and P. vranovensis BIGb0446. (H) Venn diagram of the number of genes that exhibit overlapping statistically significant (padj <0.01) changes in expression in F1 progeny of C. elegans parents fed each different bacterial species. **p < 0.01, ***p < 0.0001.
-
Figure 4—source data 1
Statistics source data for Figure 4.
- https://cdn.elifesciences.org/articles/73425/elife-73425-fig4-data1-v2.xlsx
Figure 4—figure supplement 1
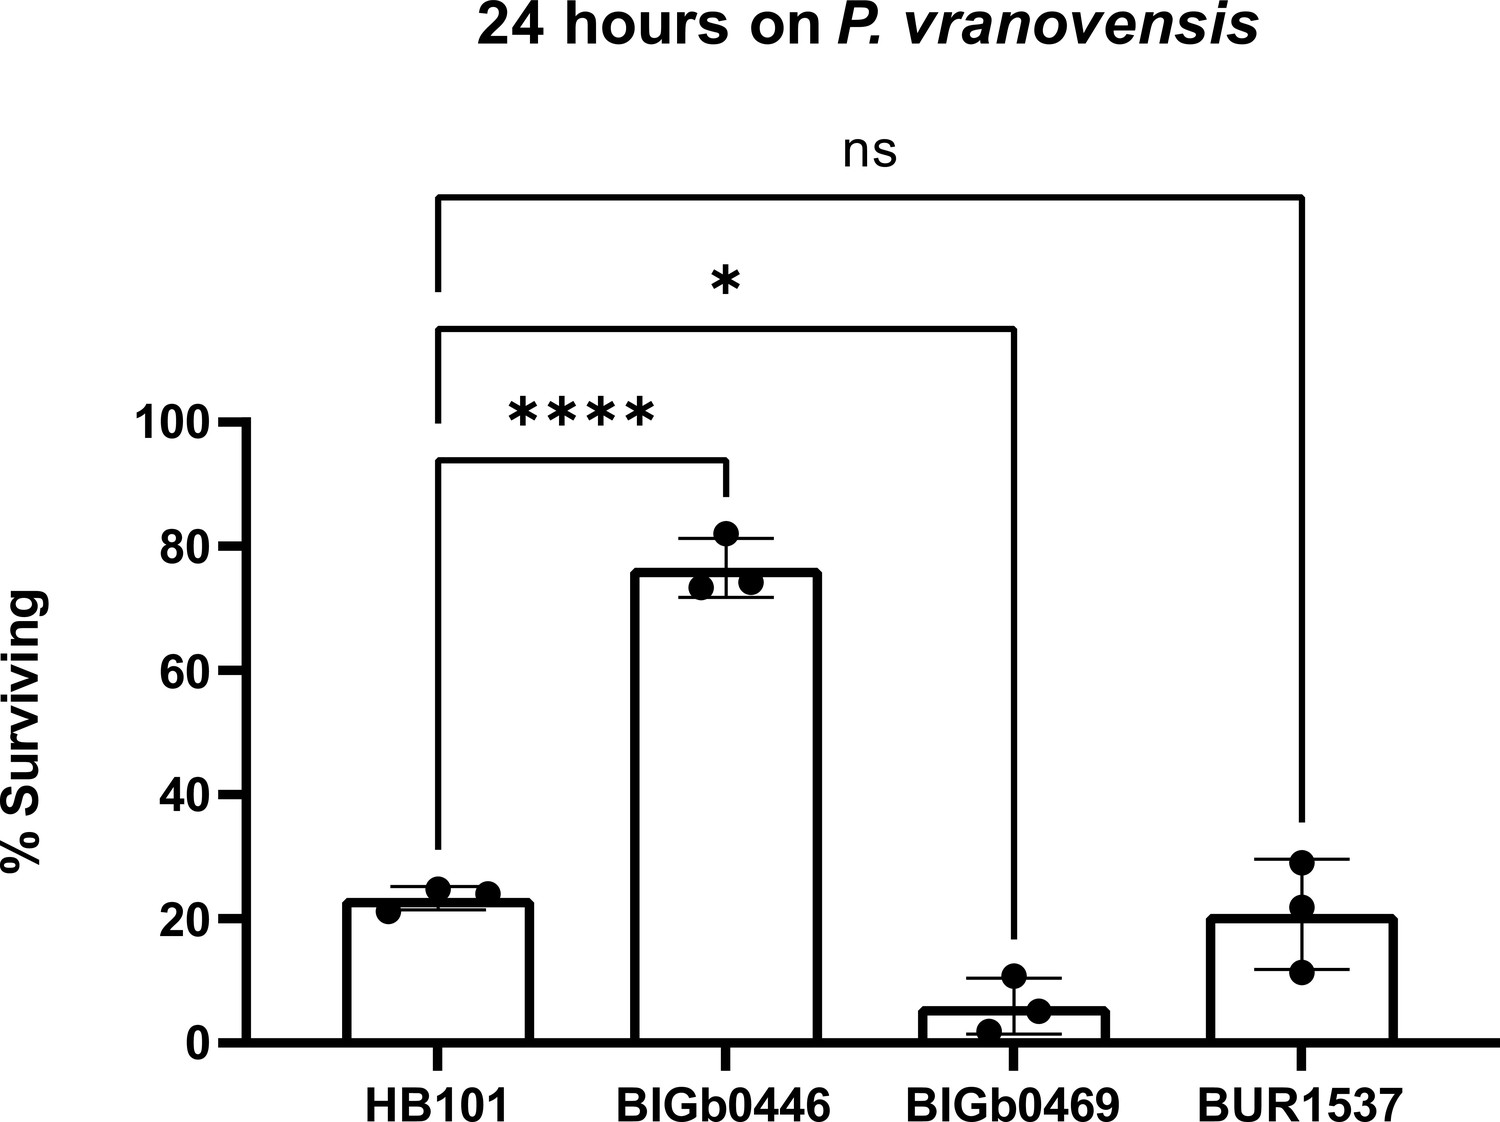
Parental exposure to Aeromonas sp. BIGb0469 and S. plymuthica BUR1537 does not protect offspring from P. vranovensis.
Percent of wild-type C. elegans (N2) animals surviving after 24 hr on plates seeded with P. vranovensis BIGb0446. Data presented as mean values ± s.d. n = 3 experiments of >100 animals. * p < 0.05, **** p < 0.0001.
Tables
Table 1
Complete list of genes that exhibited a greater than twofold change in expression in the F1 progeny of parents exposed to P. vranovensis or osmotic stress in all four species tested.
| Genes that change in F1 progeny of all species exposed to P. vranovensis | Predicted function |
|---|---|
| C18A11.1 | Unknown |
| R13A1.5 | Unknown |
| D1053.3 | Unknown |
| pmp-5 | ATP-binding activity and ATPase-coupled transmembrane transporter activity, ortholog of human ABCD4 |
| C39E9.8 | Unknown |
| nit-1 | Nitrilase ortholog – predicted to enable hydrolase activity |
| lips-10 | Lipase related |
| srr-6 | Serpentine receptor, class R |
| Y51B9A.6 | Predicted to enable transmembrane transporter activity |
| gst-33 | Glutathione S-transferase |
| ptr-8 | Patched domain containing, ortholog of human PTCHD1, PTCHD3, and PTCHD4 |
| ZC443.1 | Predicted to enable D-threo-aldose 1-dehydrogenase activity |
| cri-2 | Conserved regulator of innate immunity, ortholog of human TIMP2 |
| Y42G9A.3 | Unknown |
| ttr-21 | Transthyretin-related, involved in response to Gram-negative bacteria |
| F45E4.5 | Involved in defense against Gram-negative bacteria |
| C42D4.1 | Domain of unknown function DUF148 |
| asp-14 | Predicted to enable aspartic-type endopeptidase activity. Involved in innate immune response |
| cyp-32B1 | Cytochrome P450 family. Ortholog of human CYP4V2 |
| nas-10 | Predicted to enable metalloendopeptidase activity and zinc ion-binding activity |
| W01F3.2 | Unknown |
| nhr-11 | Nuclear hormone receptor |
| F26G1.2 | Unknown |
| F48E3.2 | Predicted to enable transmembrane transporter activity |
| hpo-26 | Unknown, hypersensitive to pore forming toxin |
| R05H10.1 | Unknown |
| C08E8.4 | Involved in innate immune response |
| C11G10.1 | Unknown |
| Y73F4A.2 | Unknown, DOMON domain containing |
| bigr-1 | Predicted to enable hydrolase activity |
| nlp-33 | Neuropeptide like, involved in innate immune response |
| far-3 | Predicted to enable lipid-binding activity |
| Genes that change in F1 progeny of all species exposed to both osmotic stress and P. vranovensis | |
| C30B5.6 | Unknown |
| hphd-1 | Predicted to enable hydroxyacid–oxoacid transhydrogenase activity. Ortholog of human ADHFE1 |
| C42D4.3 | Unknown, DB module and domain of unknown function DB |
| Genes that change in F1 progeny of all species exposed to osmotic stress | |
| ttr-15 | Transthyretin-like family |
| F08F3.4 | Predicted to enable catalytic activity. Involved in innate immune response.Ortholog of human TDH |
Table 2
Complete list of genes that exhibited a consistent and greater than twofold change in expression in the F1 progeny of parents exposed to P. vranovensisor osmotic stress in only species that intergenerationally adapted to stress.
Genes listed for P. vranovensis were identified by comparing genes that change consistently in C. elegans and C. kamaaina, but not C. briggsae. Genes listed for osmotic stress were identified by comparing genes that change consistently in C.elegans, C. briggsae, and C. kamaaina, but not in C. tropicalis. Bold font indicates genes that have already been demonstrated to be involved in C. elegans adaption to these stresses.
| Genes that change consistently in F1 progeny of only species that adapt to P. vranovensis | Predicted function |
|---|---|
| daf-18 | Lipid phosphatase, homologous to human PTEN tumor suppressor |
| gst-38 | Glutathione S-transferase |
| H04M03.3 | Predicted to enable oxidoreductase activity. |
| oops-1 | Oocyte partner of SPE-11 |
| F09G8.10 | Unknown |
| glb-1 | Globin -related |
| F57H12.6 | Unknown |
| elo-6 | Predicted to enable transferase activity, transferring acyl groups, ortholog of human ELOVL3 and ELOVL6 |
| cpr-5 | Predicted to enable cysteine-type peptidase activity |
| xpo-2 | Exportin involved in nuclear export, ortholog of human CSE1L |
| cysl-1 | Cysteine synthase known to be involved in adaptation to P. vranovensis |
| rhy-1 | Regulator of HIF-1 known to be involved in adaptation to P. vranovensis |
| cdc-25.1 | Homolog of human CDC25 phosphatase |
| imb-1 | Importin beta family, ortholog of human KPNB1 |
| VZK882L.2 | Unknown |
| cysl-2 | Cysteine synthase known to be involved in adaptation to P. vranovensis |
| cyk-7 | Involved in intercellular bridge organization |
| Genes that change consistently in F1 progeny of only species that adapt to osmotic stress | |
| T05F1.9 | Unknown |
| grl-21 | Unknown, Ground-like domain containing |
| gpdh-1 | Glycerol-3-phosphate dehydrogenase known to be involved in osmotic stress resposne |
| T22B7.3 | Amidinotransferase, ortholog of human DDAH1 and DDAH2 |
Table 3
Details of N. parisii doses employed.
| N. parisii dose | Plate concentration (spores/cm2) | Millions of spores used | |
|---|---|---|---|
| 6 cm plate | 10 cm plate | ||
| Low | ~32,000 | 2.5 | |
| High | ~88,000 | 2.5 | |
Additional files
-
Supplementary file 1
List of 7587 single-copy orthologous genes conserved among C. elegans, C. briggsae, C. kamaaina, and C. tropicalis.
- https://cdn.elifesciences.org/articles/73425/elife-73425-supp1-v2.xlsx
-
Supplementary file 2
Expression of single-copy orthologous genes in F1 progeny of animals exposed to P. vranovensis.
- https://cdn.elifesciences.org/articles/73425/elife-73425-supp2-v2.xlsx
-
Supplementary file 3
Expression of single-copy orthologous genes in F1 progeny of animals exposed to osmotic stress.
- https://cdn.elifesciences.org/articles/73425/elife-73425-supp3-v2.xlsx
-
Supplementary file 4
Expression of single-copy orthologous genes in F3 progeny of animals exposed to P. vranovensis and osmotic stress.
- https://cdn.elifesciences.org/articles/73425/elife-73425-supp4-v2.xlsx
-
Supplementary file 5
List of bacteria isolated from United Kingdom.
- https://cdn.elifesciences.org/articles/73425/elife-73425-supp5-v2.xlsx
-
Supplementary file 6
PCR sequences of Pseudomonas 15C5 16 S rRNA and rpoD.
- https://cdn.elifesciences.org/articles/73425/elife-73425-supp6-v2.txt
-
Supplementary file 7
Expression of single-copy orthologous genes in F1 progeny of C. elegans exposed to P. vranovensis, Pseudomonas sp. 15C5, Serratia plymuthica BUR1537, or Aeromonas sp. BIGb0469.
- https://cdn.elifesciences.org/articles/73425/elife-73425-supp7-v2.xlsx
-
Transparent reporting form
- https://cdn.elifesciences.org/articles/73425/elife-73425-transrepform1-v2.pdf
Download links
A two-part list of links to download the article, or parts of the article, in various formats.
Downloads (link to download the article as PDF)
Open citations (links to open the citations from this article in various online reference manager services)
Cite this article (links to download the citations from this article in formats compatible with various reference manager tools)
Intergenerational adaptations to stress are evolutionarily conserved, stress-specific, and have deleterious trade-offs
eLife 10:e73425.
https://doi.org/10.7554/eLife.73425


