Constructing the hierarchy of predictive auditory sequences in the marmoset brain
- Institute of Neuroscience, Key Laboratory of Primate Neurobiology, CAS Center for Excellence in Brain Science and Intelligence Technology, Chinese Academy of Sciences, China
- Laboratory for Molecular Analysis of Higher Brain Function, Center for Brain Science, RIKEN, Japan
Figures
Figure 1
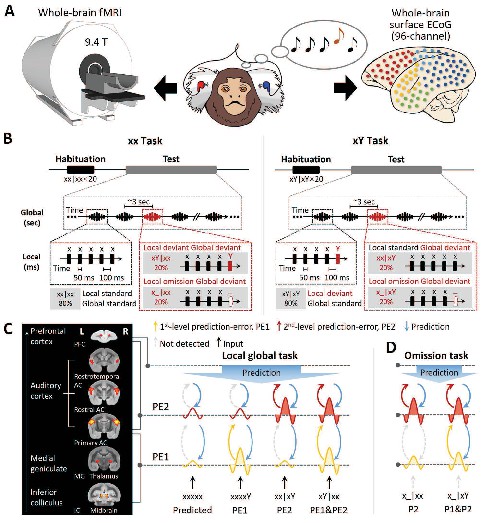
Experimental setup and local-global paradigm.
(A) Experimental setup of whole-brain fMRI (9.4-T) and ECoG (96-channel); awake marmosets passively listen to auditory stimuli. (B) Schematic of local-global paradigm (for details, see Materials and methods). (C) Left, fMRI activations for auditory sounds relative to baseline, along the auditory pathway, in marmosets. Right, hypothesized predictive processing model of the local-global paradigm, corresponding to the auditory pathway. (D) Hypothesized predictive processing model of the local-global omission paradigm. P1, 1st-level prediction; P2, 2nd-level prediction; PE1, 1st-level prediction-error; PE2, 2nd-level prediction-error.
Figure 2 with 2 supplements
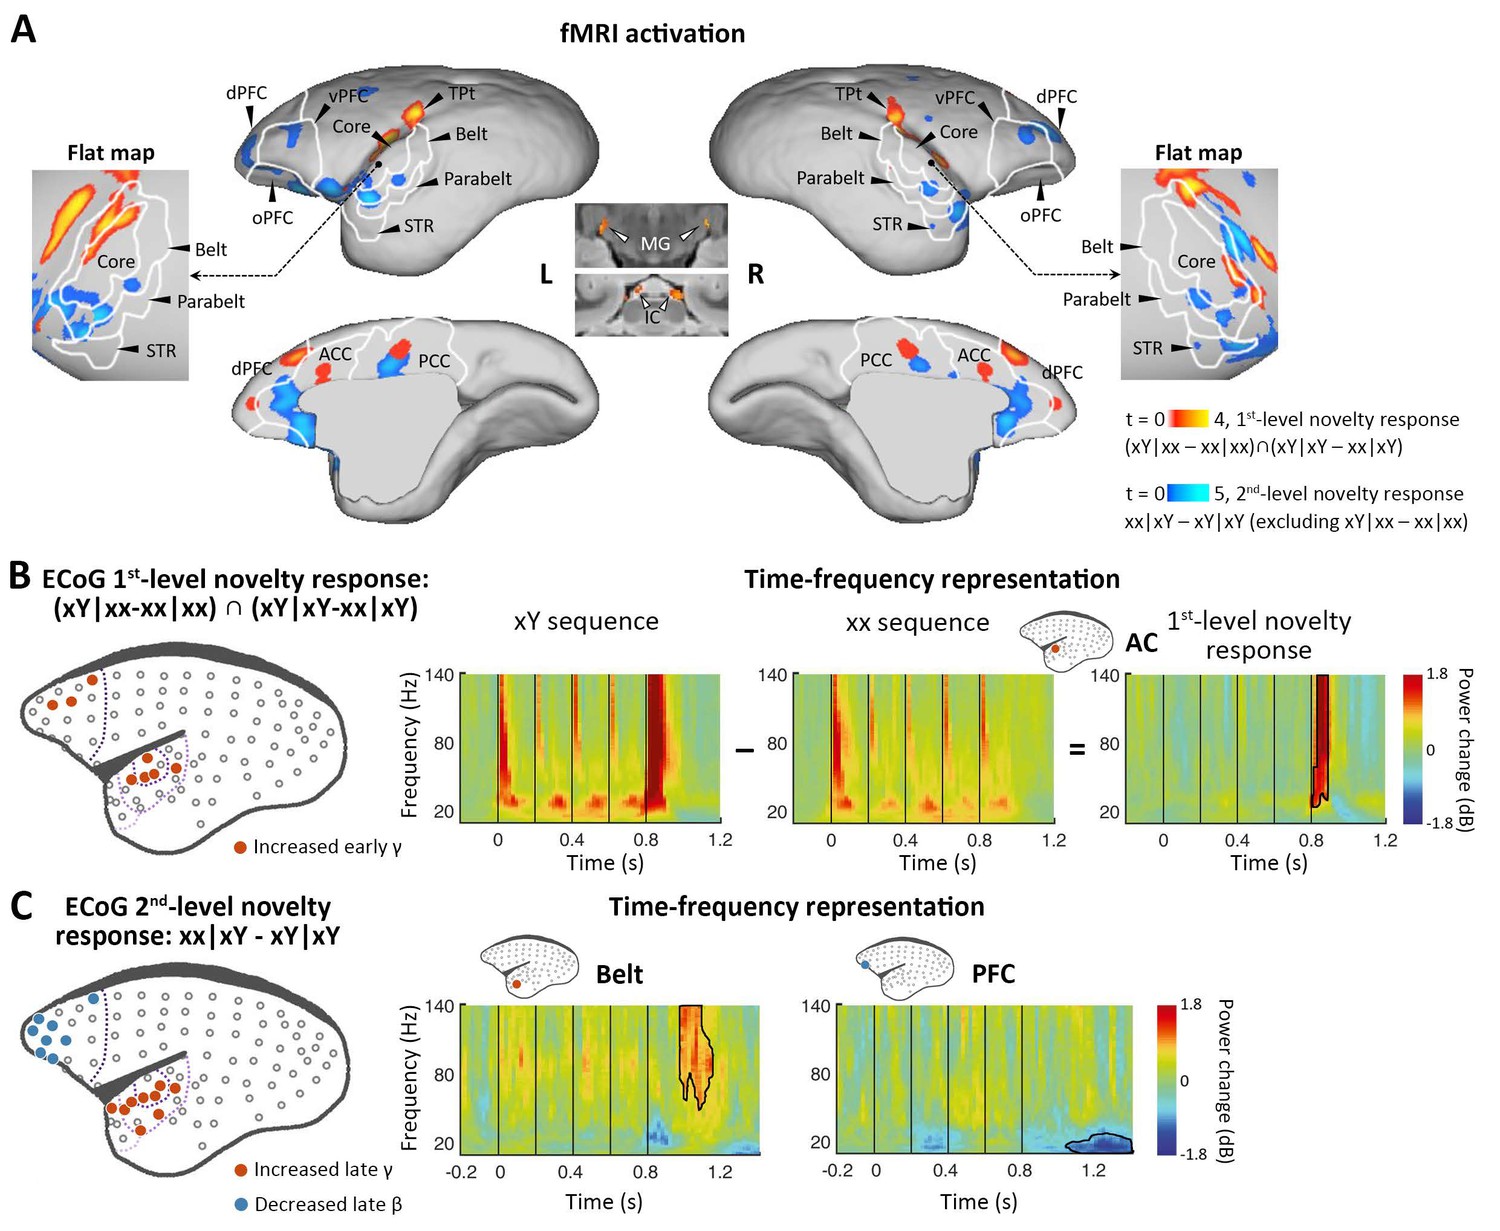
Neural activations to the 1st-level local and 2nd-level global novelties, respectively.
(A) Red-yellow, group-level fMRI activations to 1st-level novelty identified by subtraction in both xx and xY tasks; blue-light blue, group-level fMRI activations to the 2nd-level novelty identified by subtraction only in the xY task (p<0.05, FDR-corrected). Color scales represent the t values. (B) Left, localization of ECoG electrodes for local novelties (marmoset J, p<0.05, cluster-corrected). The gray dots represent all 96 electrodes. The dotted lines from dark to light violet indicate frontal, auditory core, auditory belt/parabelt, and STR. Right, Time-frequency representation (TFR) of representative AC electrodes with 1st-level novelty response, generated by comparing local deviants (xY sequence) with local standards (xx sequence). The vertical lines indicate the onset times of five tones in each sequence. (C) Left, localization of ECoG electrodes for global novelties (marmoset J, p<0.05, cluster-corrected). Right, TFR of representative electrodes in the auditory belt cortex and PFC. ACC, anterior cingulate cortex; dPFC, dorsal prefrontal cortex; ECoG, electrocorticography; FDR, false-discovery rate; fMRI, functional magnetic resonance imaging; IC, inferior colliculus; L, left; MG, medial geniculate nucleus; oPFC, orbital PFC; PCC, posterior cingulate cortex; R, right; STR, superior temporal rostral area; TPt, temporoparietal transitional area; vPFC, ventral PFC.
Figure 2—figure supplement 1
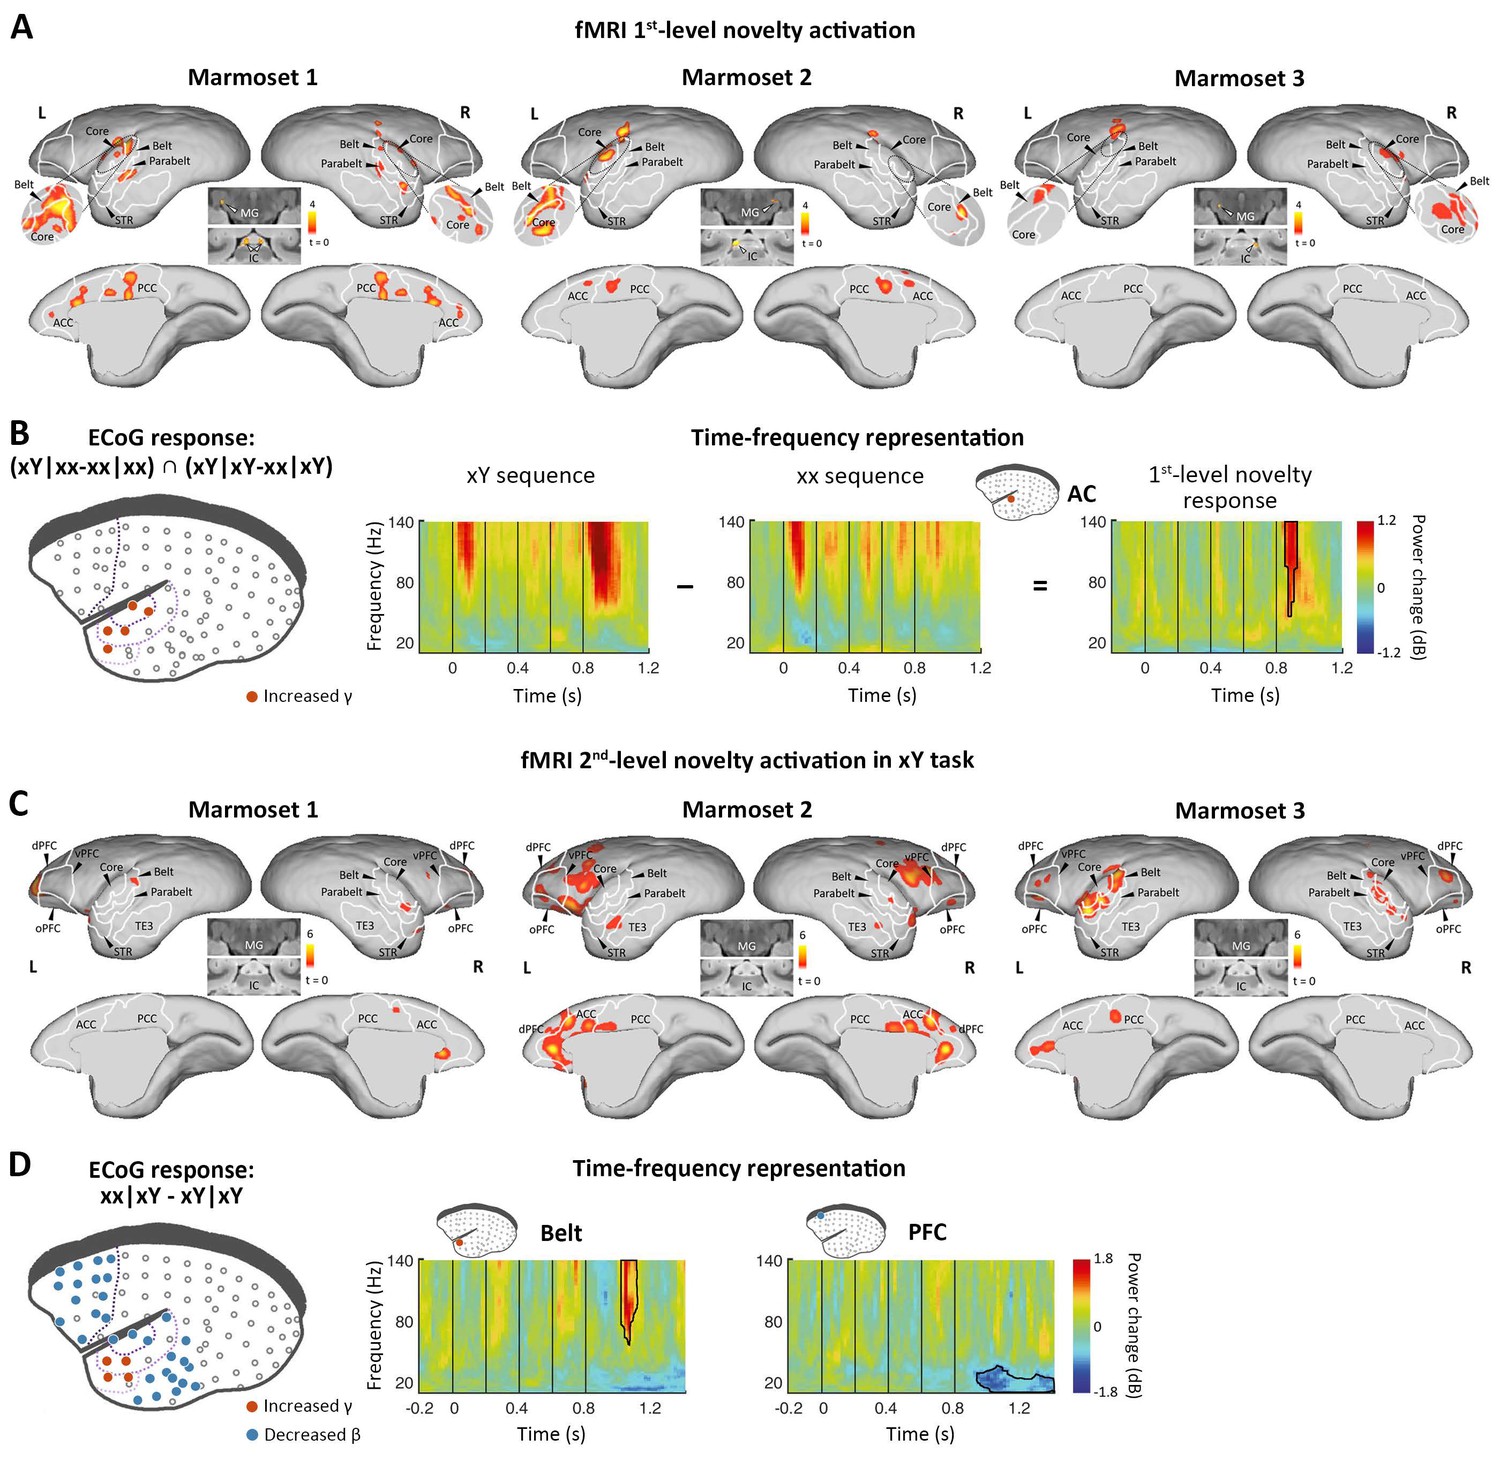
Neural activations to the 1st-level local and 2nd-level global novelties in individual marmosets.
(A) fMRI activated areas for 1st-level novelties (p<0.005, uncorrected, cluster size>10) in three individual marmosets. Color scales represent the t values. (B) Left, localization of ECoG electrodes with significant responses to 1st-level novelties (marmoset N, p<0.05, cluster-corrected). Right, time-frequency representation of representative electrodes. (C) fMRI activated areas for 2nd-level novelties in xY task (p<0.001, uncorrected, cluster size>10) in three individual marmosets. (D) Significant ECoG responses to 2nd-level novelties (marmoset N, p<0.05, cluster-corrected). (A and C) are in the same format as Figure 2A. (B and D) are in the same format as Figure 2B and C. ECoG, electrocorticography; fMRI, functional magnetic resonance imaging.
Figure 2—figure supplement 2
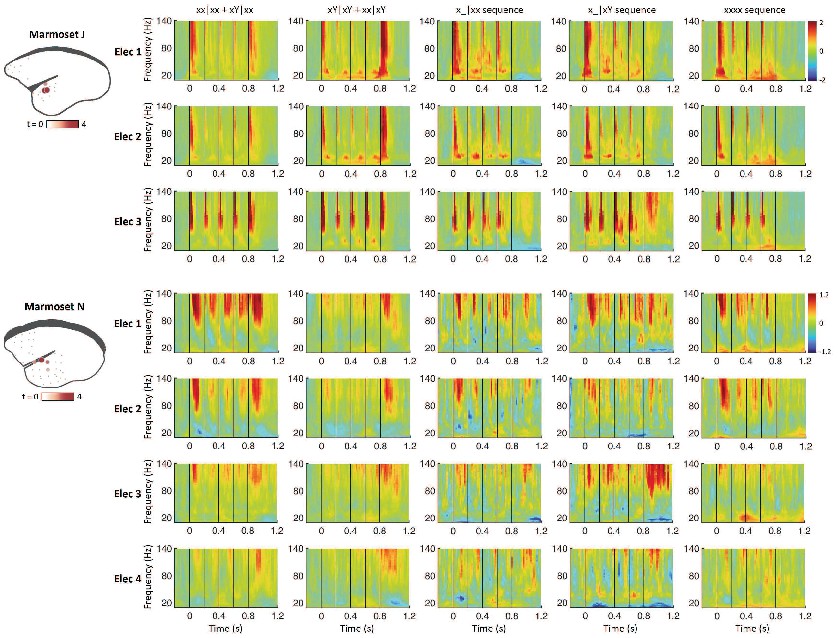
Responses to different sequence types from electrodes with significant auditory response.
Left, the electrodes showed significant response to auditory stimuli, when compared all auditory sequences with baseline, regardless of the sequence type. The color and size of each dot indicate the level of activation. Right, illustration of different type time-frequency representations (TFRs) of the electrodes with significant auditory response. The TFRs are the averaged activation in all sequences in the test period in xx task (xx|xx and xY|xx, column 1), all sequences in the test period in xY task (xY|xY and xx|xY column 2), all x_|xx sequences (column 3), all x_|xY sequences (column 4), and all sequences in omission block (column 5). Electrode (Elec) number indicates the strength order of activation.
Figure 3 with 1 supplement
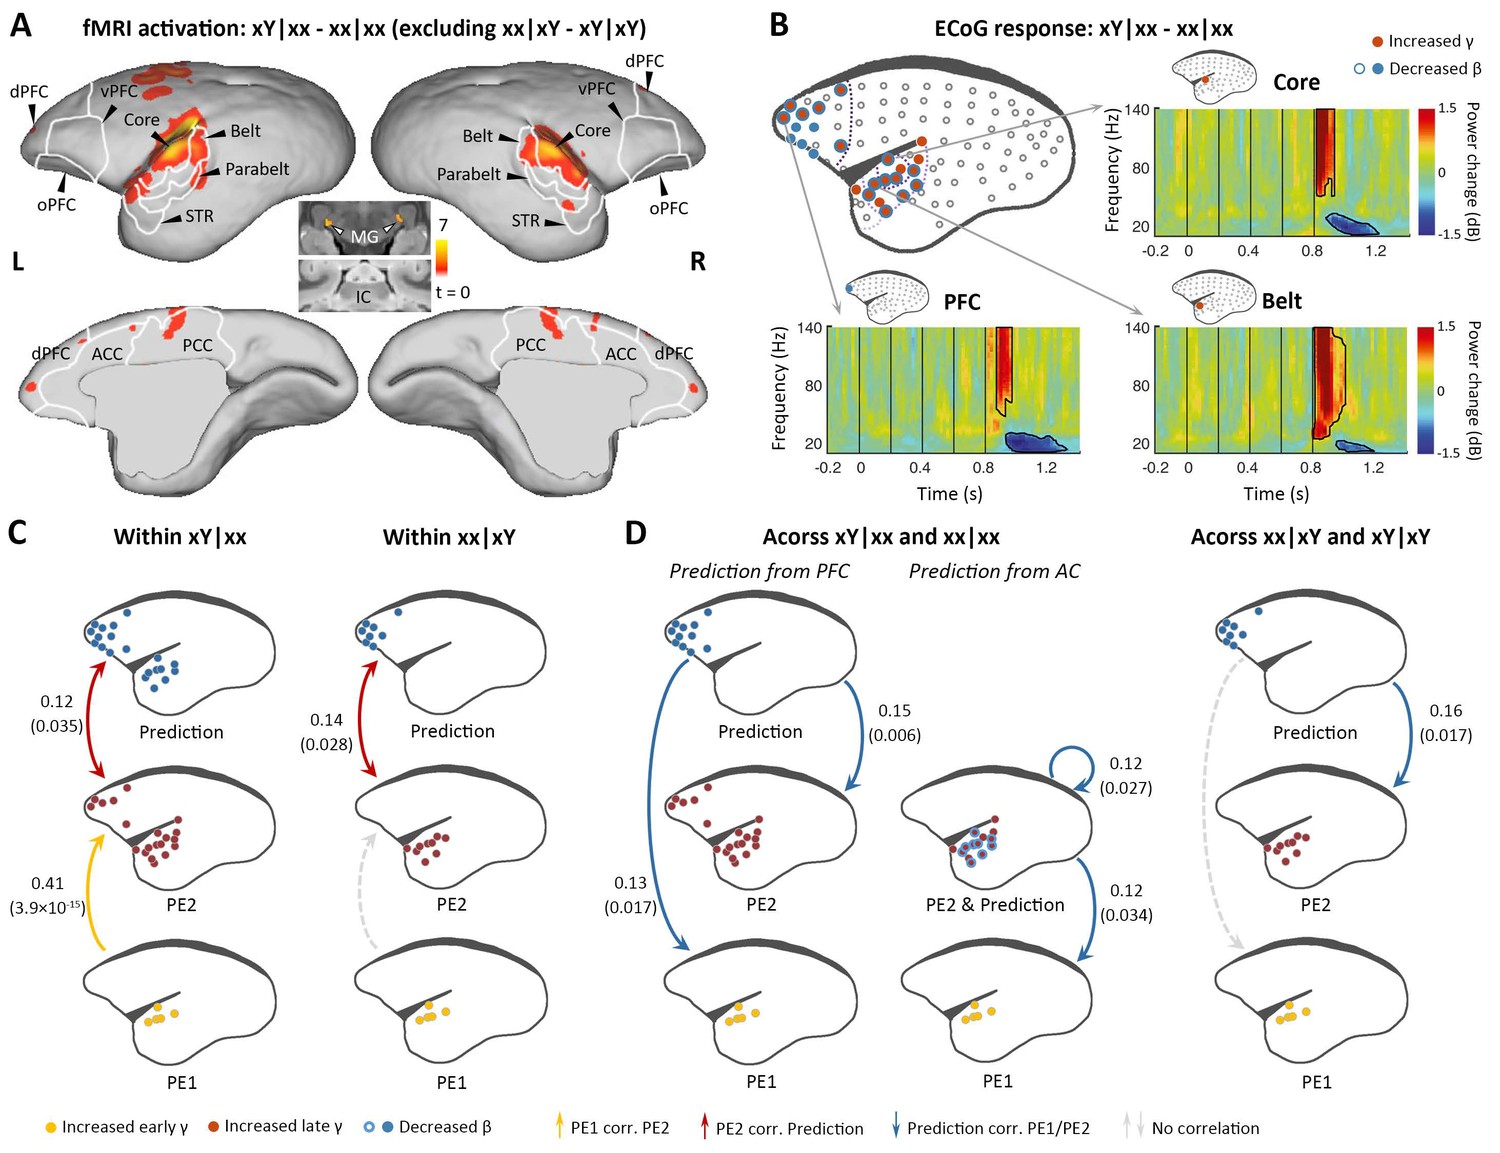
Brain activations to the two successive (local and global) novelties.
(A) Group-level fMRI activations to both local and global novelties (p<0.01, FDR-corrected). Color scale represents the t values. (B) Significant ECoG responses detected by xY minus xx sequences in the xx task (marmoset J, p<0.05, cluster-corrected). (C) Diagram of the functional correlation among ECoG signals of 1st- and 2nd-level prediction-errors (PE1 and PE2, respectively) and prediction within deviants in the xx task (left, xY|xx) and xY task (right, xx|xY) (marmoset J). The color dots in the brain diagrams indicate the electrodes with significant responses found in corresponding comparisons, which were subsequently used in the functional correlation test (see Materials and methods). Lines represent significant functional correlations between signals from the paired brain diagrams. Labeled values close to lines provide the Pearson correlation coefficient (p value) of the corresponding correlations. Unidirectional arrows indicate relative temporal orders at which the signals appear, while bidirectional arrows indicate uncertain temporal orders of the signals. (D) Left, diagram of the functional correlation across trials, showing the correlation between prediction signals on xY|xx and PE1/PE2 signals on subsequent standards (xx|xx directly appeared after xY|xx). Right, the functional correlation across xx|xY and the subsequent xY|xY trials (marmoset J). (D) same format as (C). ECoG, electrocorticography; FDR, false-discovery rate; fMRI, functional magnetic resonance imaging.
Figure 3—figure supplement 1
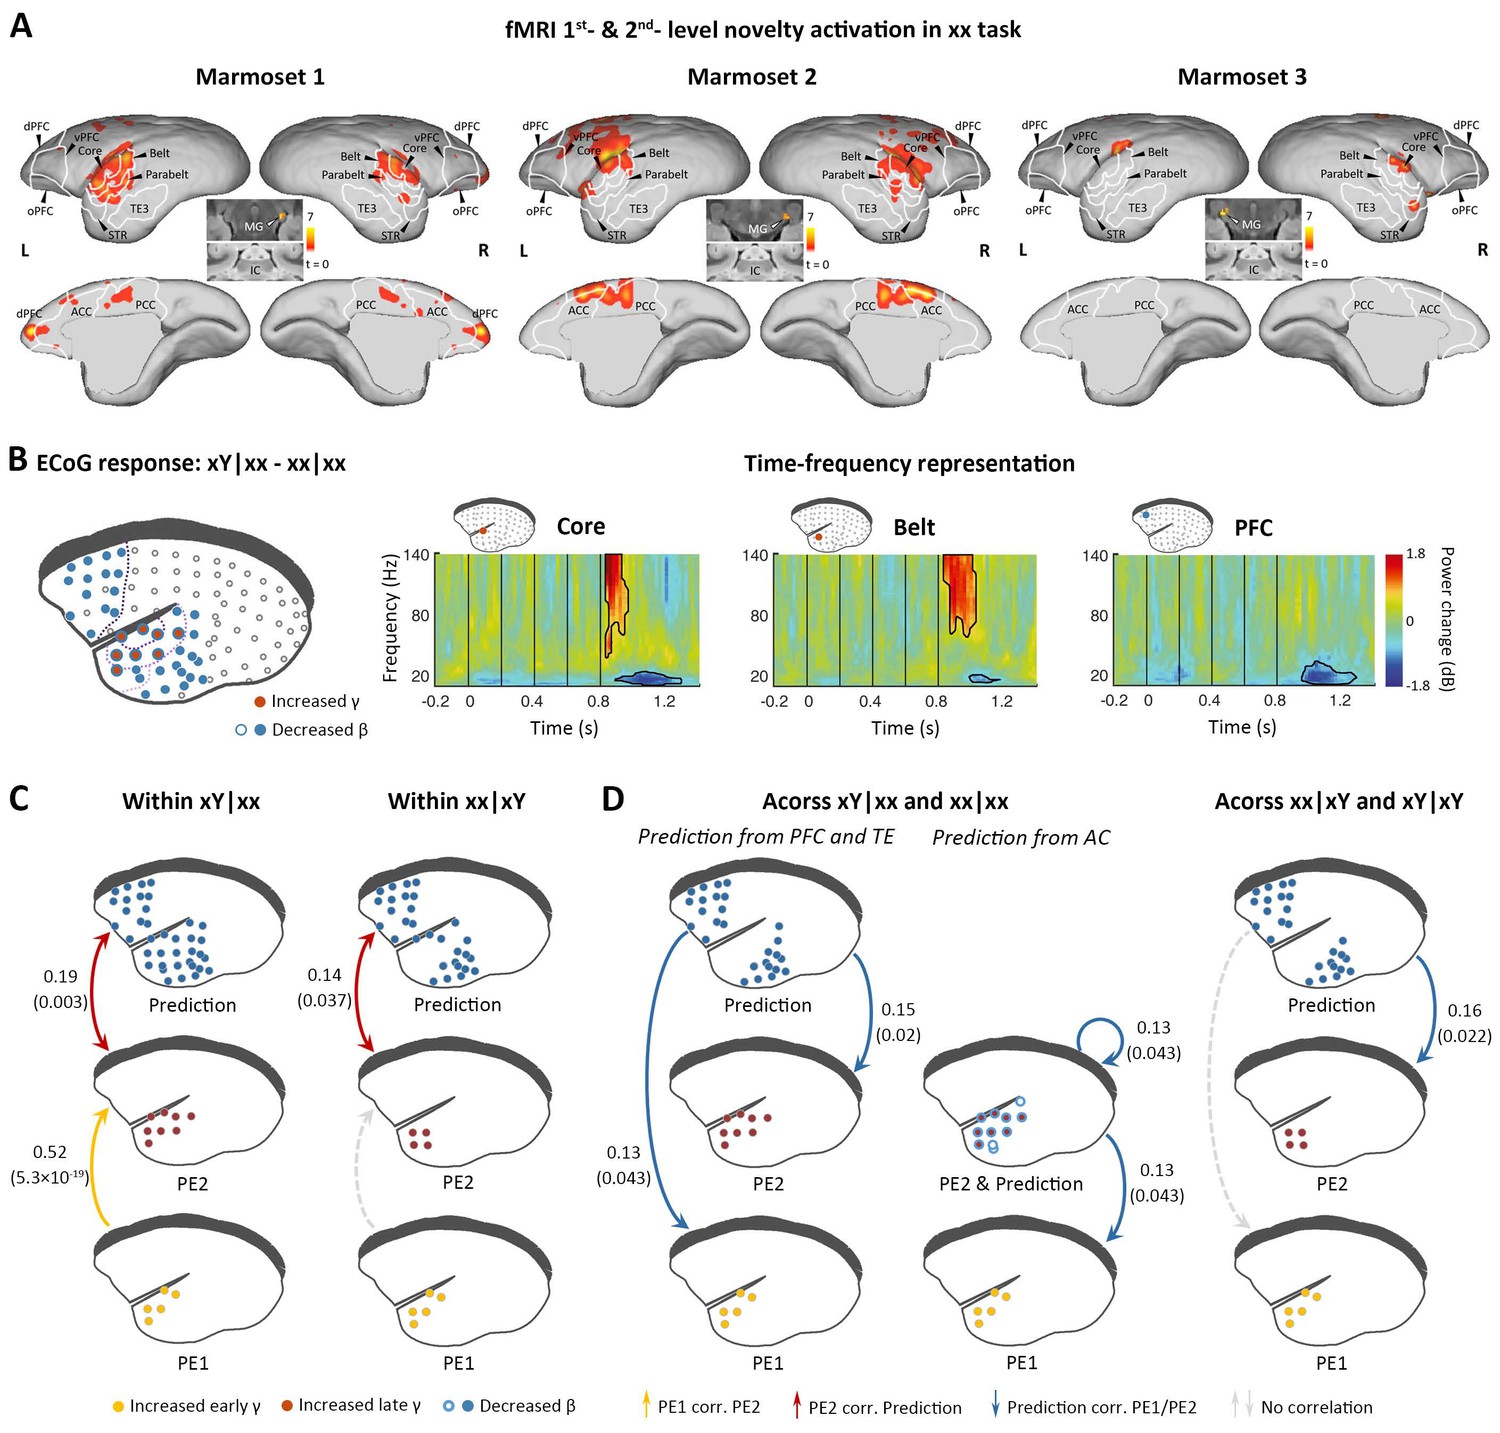
Brain activations to the two successive (local and global) novelties in individual marmosets.
(A) fMRI activated areas for both 1st- and 2nd-level novelties in xx task (p<0.001, uncorrected, cluster size>10) in three individual marmosets. Color scales represent the t values. (B) Significant ECoG responses to successive 1st- and 2nd-level novelties (marmoset N, p<0.05, cluster-corrected). (C) The functional correlation within xY|xx (left) and within xx|xY (right) trials (marmoset N). (D) The functional correlation across xY|xx and subsequent xx|xx (left) trials, and across xx|xY and subsequent xY|xY (right) trials (marmoset N). The same format is used as in Figure 3. fMRI, functional magnetic resonance imaging; ECoG, electrocorticography.
Figure 4 with 1 supplement
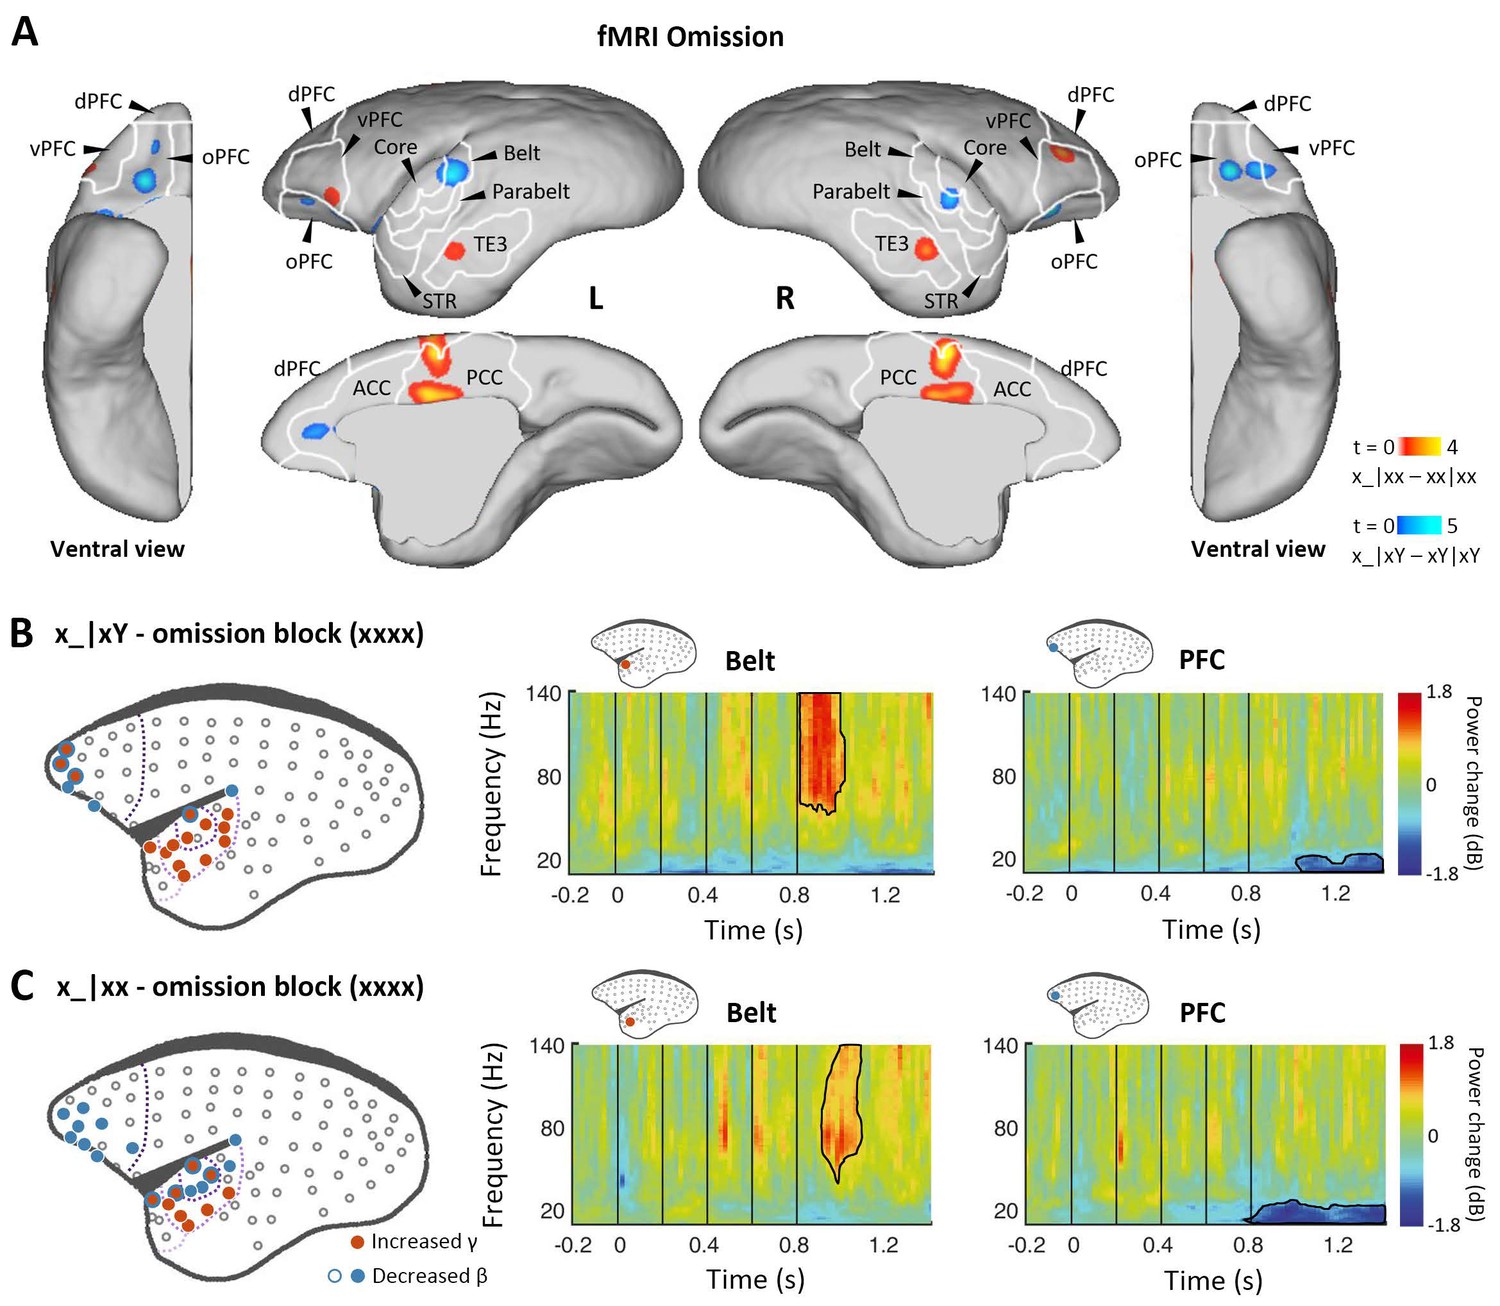
Prediction-error and prediction responses to omission of the 5th tone.
(A) Group-level fMRI revealed areas responsive to an omission of the 5th tone in the xx (red-yellow, p<0.001, uncorrected) and xY tasks (blue-light blue, p<0.05, FDR-corrected). Color scales represent the t values. TE3, inferior temporal cortex. (B) Left, localization of ECoG electrodes with significant responses when comparing rare omissions in the xY task with frequent omissions in the omission block (consisting of xxxx sequences, where an omission is expected, marmoset J, p<0.05, cluster-corrected). Right, examples of respective electrode response in the auditory belt area and PFC. (C) Significant ECoG responses to the omission of the 5th tone when comparing rare omissions in the xx task with frequent omissions in the omission block (marmoset J, p<0.05, cluster-corrected), same format as for (B). ECoG, electrocorticography; FDR, false-discovery rate; fMRI, functional magnetic resonance imaging; PFC, prefrontal cortex.
Figure 4—figure supplement 1
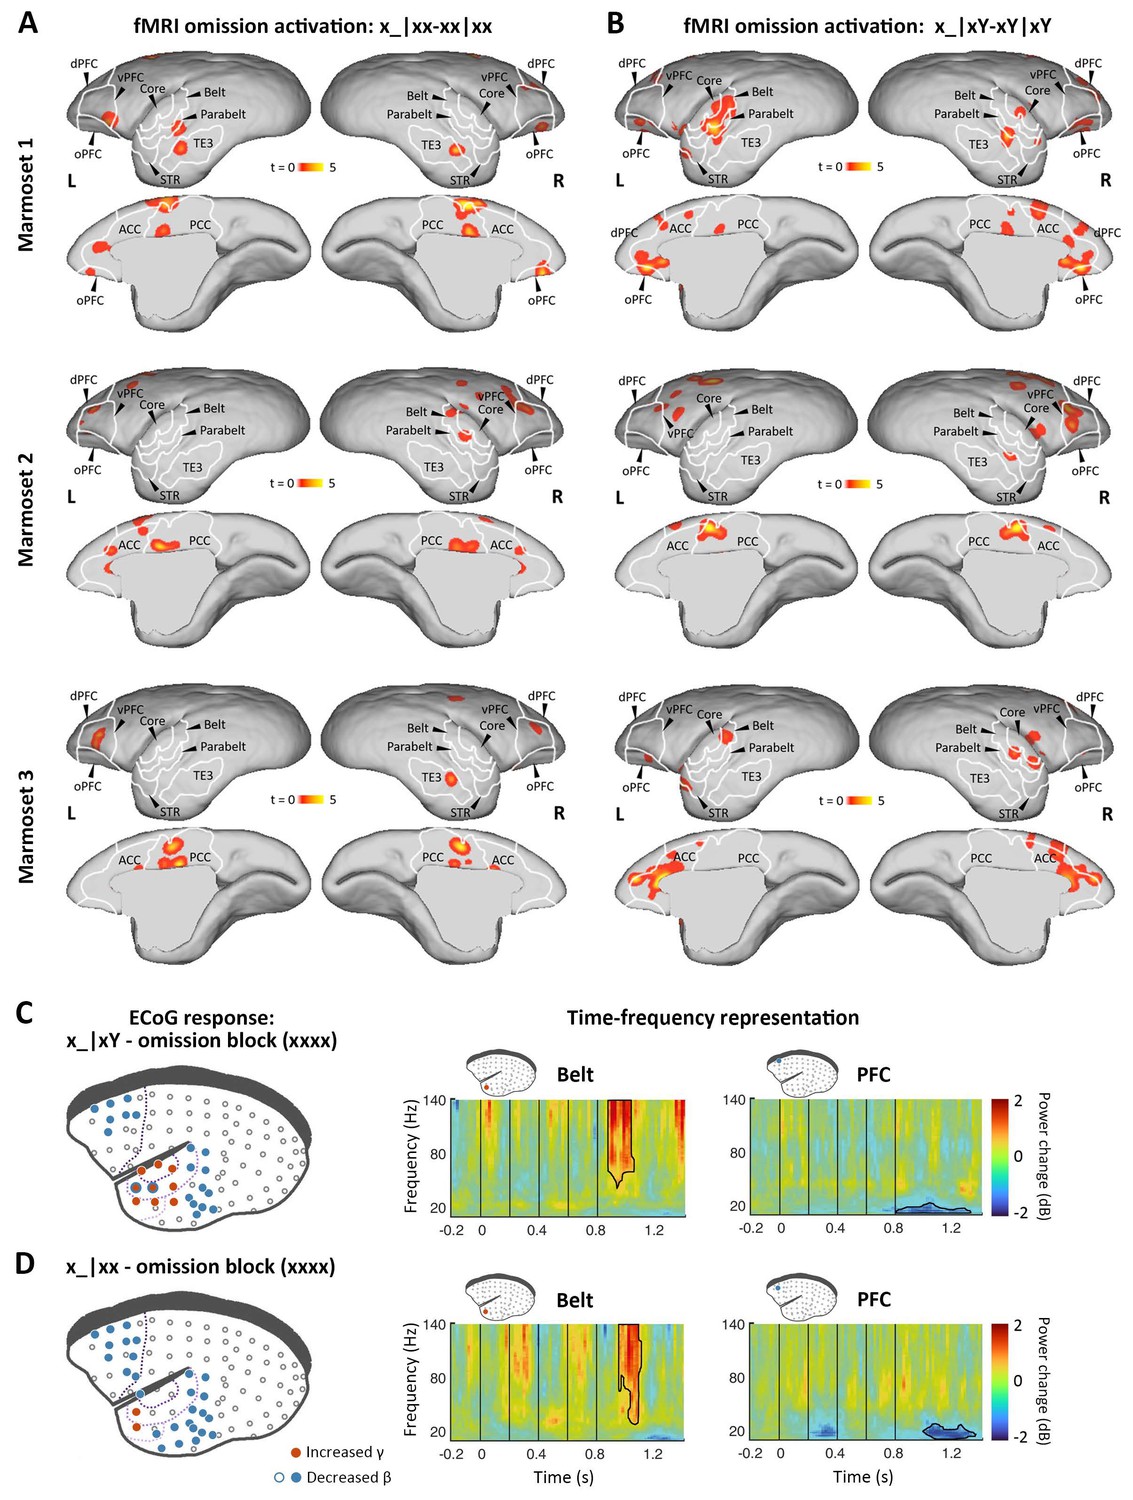
Prediction-error and prediction responses to omission of the 5th tone in individual marmosets.
(A) fMRI activated areas for omission of the 5th tone of local standards (p<0.005, uncorrected, cluster size>10) in three individual marmosets. Color scales represent the t values. (B) fMRI activated areas for omission of the 5th tone of local deviants (p<0.005, uncorrected, cluster size>10) in three individual marmosets. (A and B) are in the same format as Figure 4A. (C) Significant ECoG responses to omission of the 5th tone of local deviants (marmoset N, p<0.05, cluster-corrected). (D) Significant ECoG responses to omission of the 5th tone of local standards (marmoset N, p<0.05, cluster-corrected). (C and D) are in the same format as Figure 4B and C. ECoG, electrocorticography; fMRI, functional magnetic resonance imaging.
Figure 5 with 1 supplement
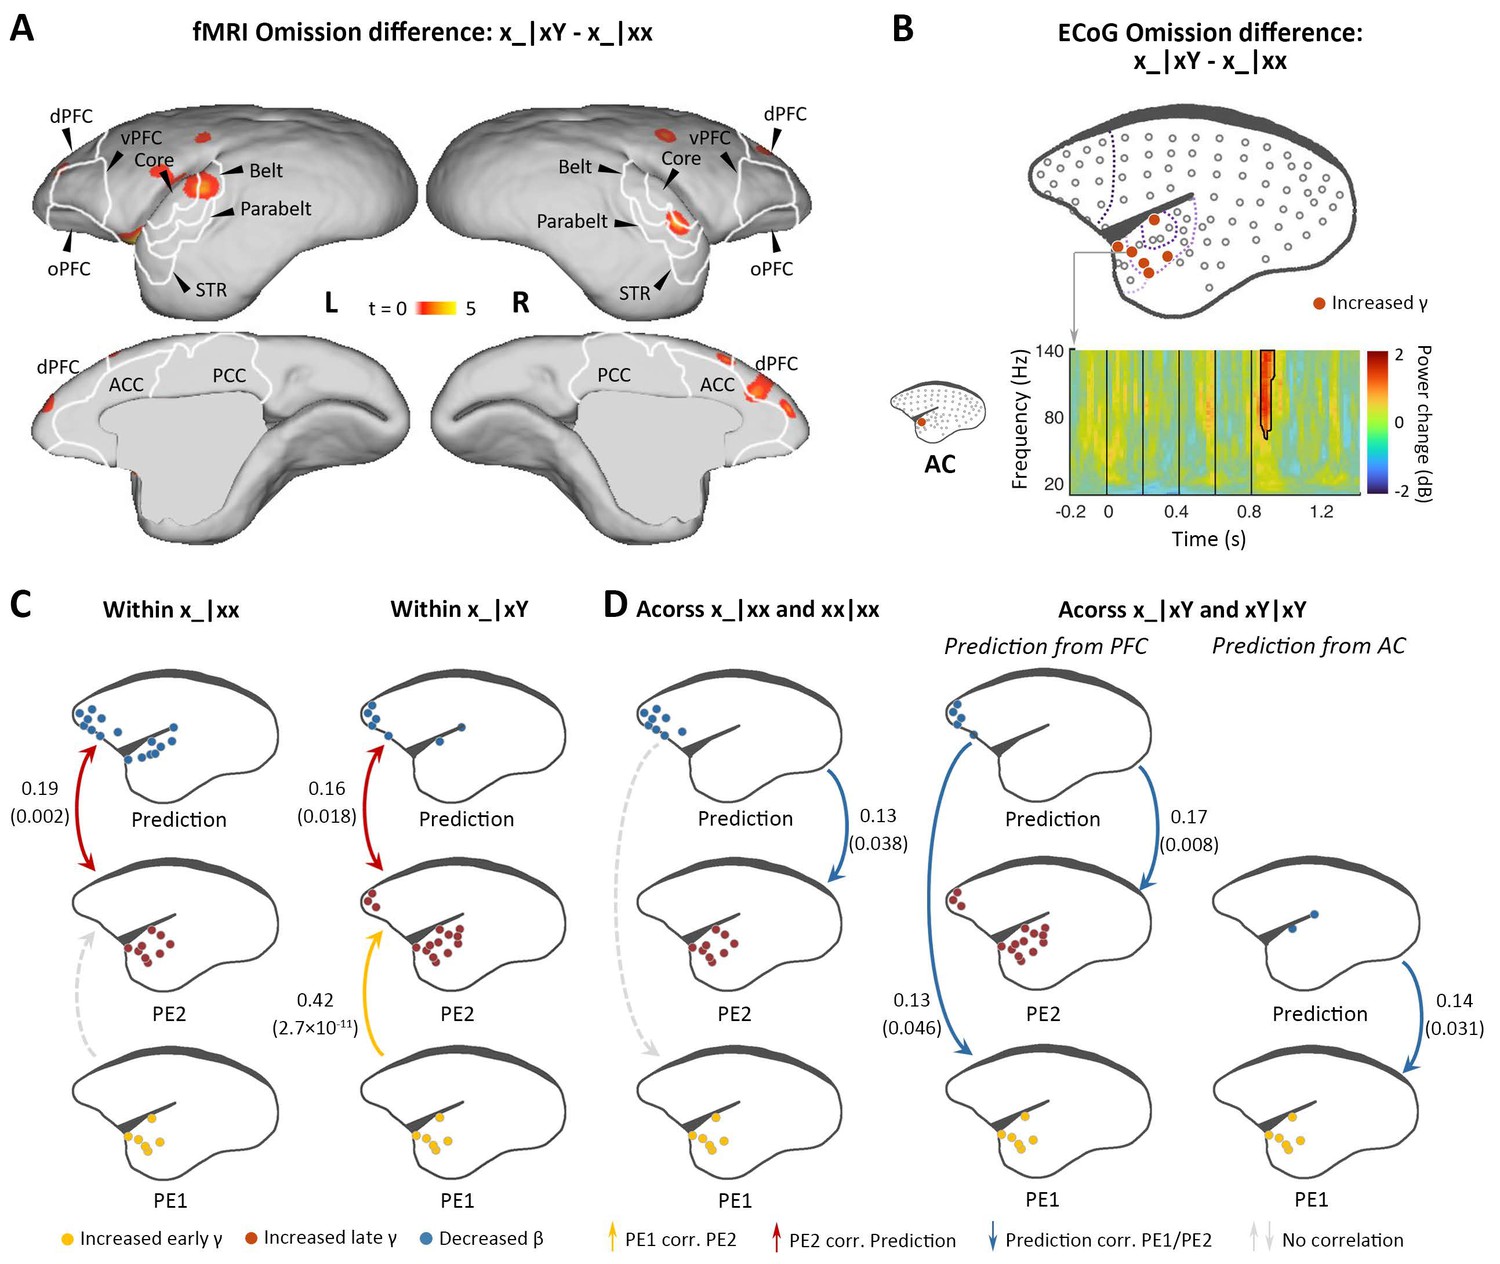
Difference in responses between local deviant omission and local standard omission.
(A) Group-level fMRI revealed areas activated differently between local deviant omission (x_|xY) and local standard omission (x_|xx) (p<0.05, FDR-corrected). Color scale represents the t values. (B) Top, localization of ECoG electrodes with significant differences between x_|xY and x_|xx omissions. Bottom, an example of electrode showing significant early γ-band power increases in x_|xY omissions compared with that for x_|xx. (C) Diagram of the functional correlation results among ECoG signals within omission deviants in the xx task (left, x_|xx) and xY task (right, x_|xY) (marmoset J). The color dots in the brain diagrams indicate the electrodes with significant responses found in corresponding comparisons, which were subsequently used in the functional correlation test. Lines represent significant functional correlations between signals from the paired brain diagrams. Labeled values close to lines provide the Pearson correlation coefficient (p value) of the corresponding correlations. Unidirectional arrows indicate relative temporal orders at which the signals appear, while bidirectional arrows indicate uncertain temporal orders of the signals. (D) Left, diagram of the functional correlation results across trials, showing the correlation between prediction signals on x_|xx and PE1/PE2 signals on subsequent xx|xx trials. Right, the functional correlation across x_|xY and the subsequent xY|xY trials (marmoset J). (D) same format as (C). ECoG, electrocorticography; FDR, false-discovery rate; fMRI, functional magnetic resonance imaging.
Figure 5—figure supplement 1
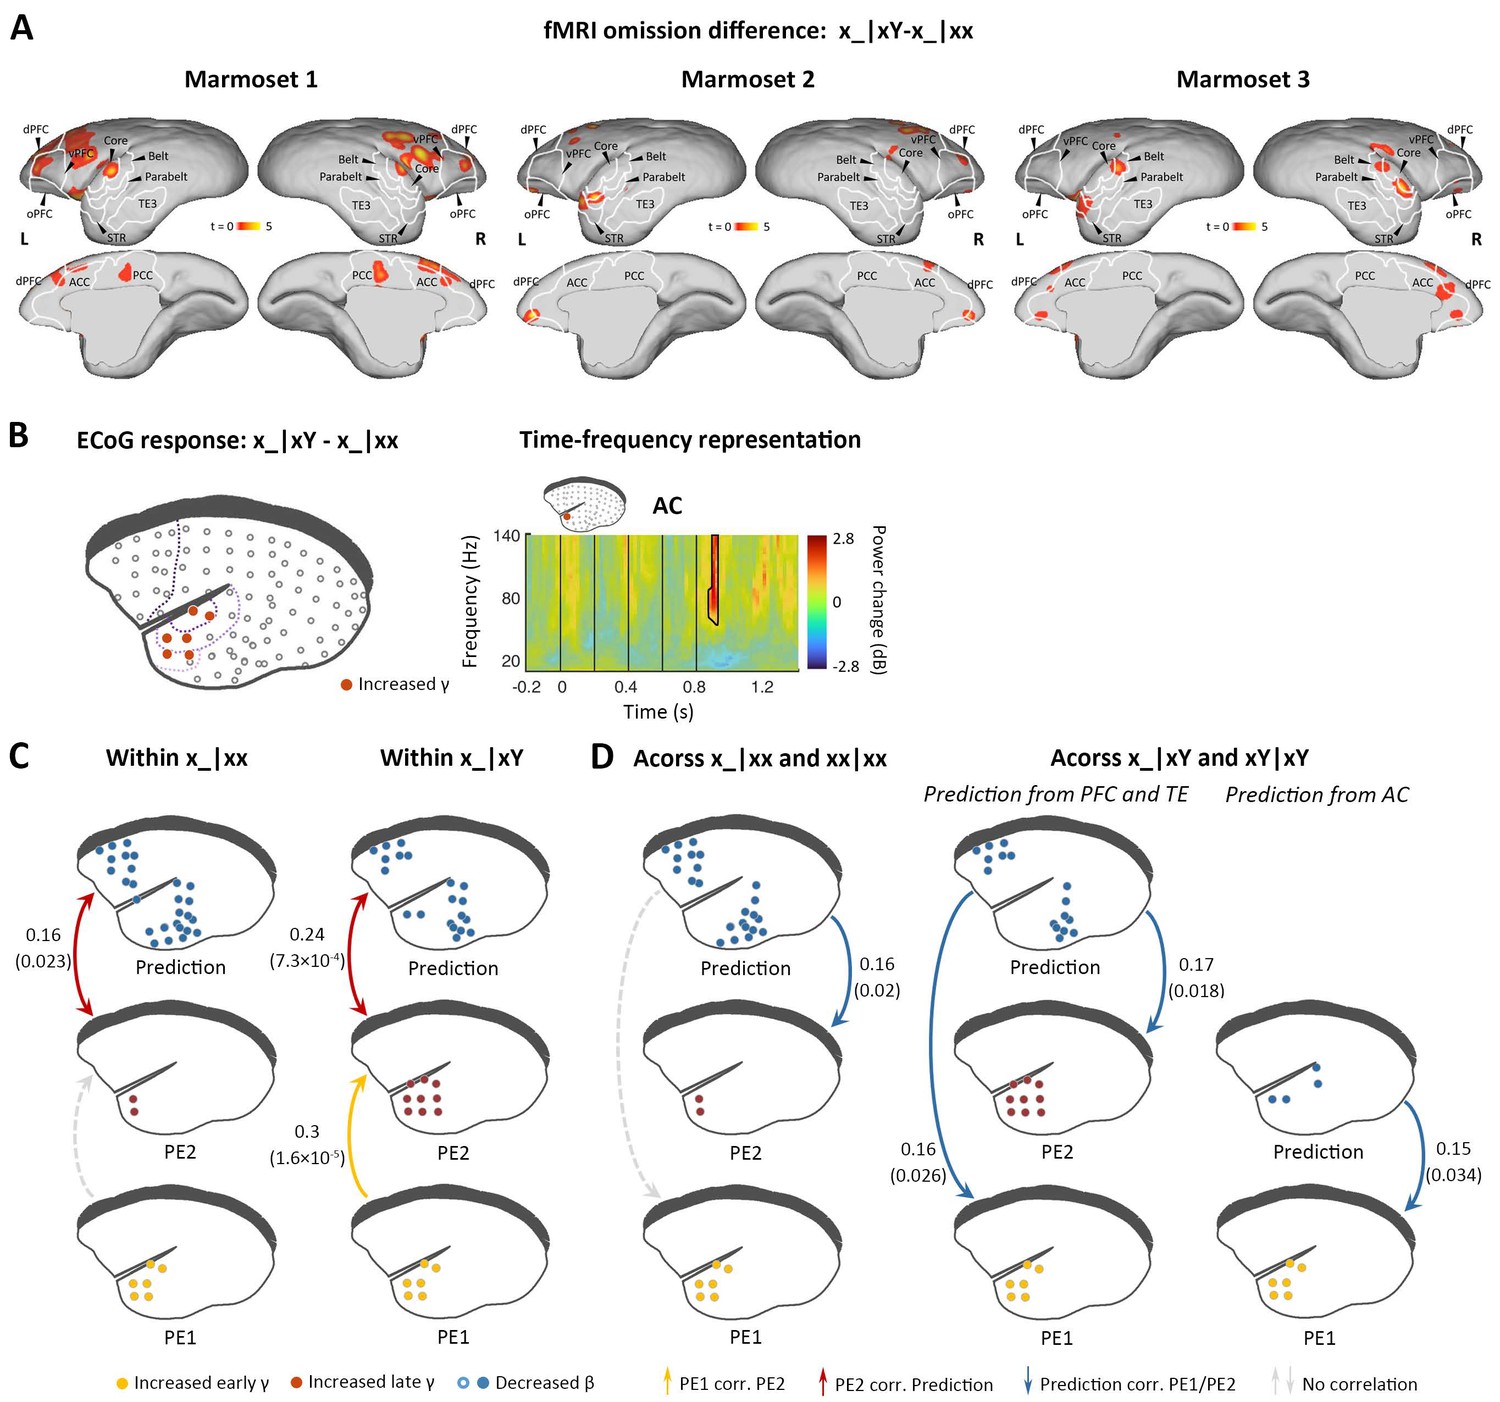
Difference in responses between local deviant omission and local standard omission in individual marmosets.
(A) fMRI activated areas for difference between local deviant and local standard omissions (p<0.005, uncorrected, cluster size>10) in three individual marmosets. Color scales represent the t values. (B) Significant ECoG responses to difference between local deviant and local standard omissions (marmoset N, p<0.05, cluster-corrected). (C) The functional correlation within x_|xx (left) and within x_|xY (right) trials (marmoset N). (D) The functional correlation across x_|xx and subsequent xx|xx (left) trials, and across x_|xY and subsequent xY|xY (right) trials (marmoset N). The same format is used as in Figure 5. ECoG, electrocorticography; FDR, false-discovery rate; fMRI, functional magnetic resonance imaging.
Tables
Key resources table
| Reagent type (species) or resource | Designation | Source or reference | Identifiers | Additional information |
|---|---|---|---|---|
| Software, algorithm | Matlab | Mathworks (http://www.mathworks.com) | RRID:SCR_001622 | Version R2017b |
| Software, algorithm | Psychophysics Toolbox | Psychophysics Toolbox (http://psychtoolbox.org) | RRID:SCR_002881 | Version 3.0.12 |
| Software, algorithm | SPM Toolbox | Statistical Parametric Mapping (http://www.fil.ion.ucl.ac.uk/spm) | RRID:SCR_007037 | Version 12 |
| Software, algorithm | FieldTrip Toolbox | FieldTrip (http://www.fieldtriptoolbox.org) | RRID:SCR_004849 | |
| Software, algorithm | N-way Toolbox | N-way (http://www.modelslife.ku.dk/nwaytoolbox) | Version 3.30 |
Additional files
-
Supplementary file 1
Details of fMRI results for brain regions of interest.
(a): The peak fMRI activations of brain regions for 1st-level novelty. The image results were zoomed into human brain size for visualization and using MNI coordinates. IC, inferior colliculus; MG, medial geniculate nucleus; AuA1, primary auditory area; AuR, rostral auditory area; AuCM, caudomedial auditory area. L, left; R, right. (b): The peak fMRI activations of brain regions for 2nd-level novelty by comparing xx|xY with xY|xY. The image results were zoomed into human brain size for visualization and using MNI coordinates. AuAL, anterolateral auditory area; STR, superior temporal rostral area. (c): The peak fMRI activations of brain regions for both 1st- and 2nd-level novelty by comparing xY|xx with xx|xx. The image results were zoomed into human brain size for visualization and using MNI coordinates. AuRT, rostrotemporal auditory area; AuRTM, rostrotemporal medial auditory area; AuRPB, rostral parabelt auditory area; PE, parietal area. (d): The peak fMRI activations of brain regions for omission of the 5th tone in xx task by comparing x_|xx with xx|xx. The image results were zoomed into human brain size for visualization and using MNI coordinates. TE3, inferior temporal cortex. (e): The peak fMRI activations of brain regions for omission of the 5th tone in xY task by comparing x_|xY with xY|xY. The image results were zoomed into human brain size for visualization and using MNI coordinates. AuML, middle lateral auditory area. (f): The peak fMRI activations of brain regions for difference between local deviant and local standard omissions by comparing x_|xY with x_|xx. The image results were zoomed into human brain size for visualization and using MNI coordinates.
- https://cdn.elifesciences.org/articles/74653/elife-74653-supp1-v2.docx
-
Transparent reporting form
- https://cdn.elifesciences.org/articles/74653/elife-74653-transrepform1-v2.docx
Download links
A two-part list of links to download the article, or parts of the article, in various formats.
Downloads (link to download the article as PDF)
Open citations (links to open the citations from this article in various online reference manager services)
Cite this article (links to download the citations from this article in formats compatible with various reference manager tools)
Constructing the hierarchy of predictive auditory sequences in the marmoset brain
eLife 11:e74653.
https://doi.org/10.7554/eLife.74653


