H3K9me1/2 methylation limits the lifespan of daf-2 mutants in C. elegans
- The USTC RNA Institute, Ministry of Education Key Laboratory for Membraneless Organelles & Cellular Dynamics, Department of Obstetrics and Gynecology, The First Affiliated Hospital of USTC, School of Life Sciences, Division of Life Sciences and Medicine, Biomedical Sciences and Health Laboratory of Anhui Province, University of Science and Technology of China, China
- State Key Laboratory of Pharmaceutical Biotechnology and MOE Key Laboratory of Model Animals for Disease Study, Model Animal Research Center, Institute for Brain Sciences, Nanjing University, China
- CAS Center for Excellence in Molecular Cell Science, Chinese Academy of Sciences, China
Figures
Figure 1 with 1 supplement
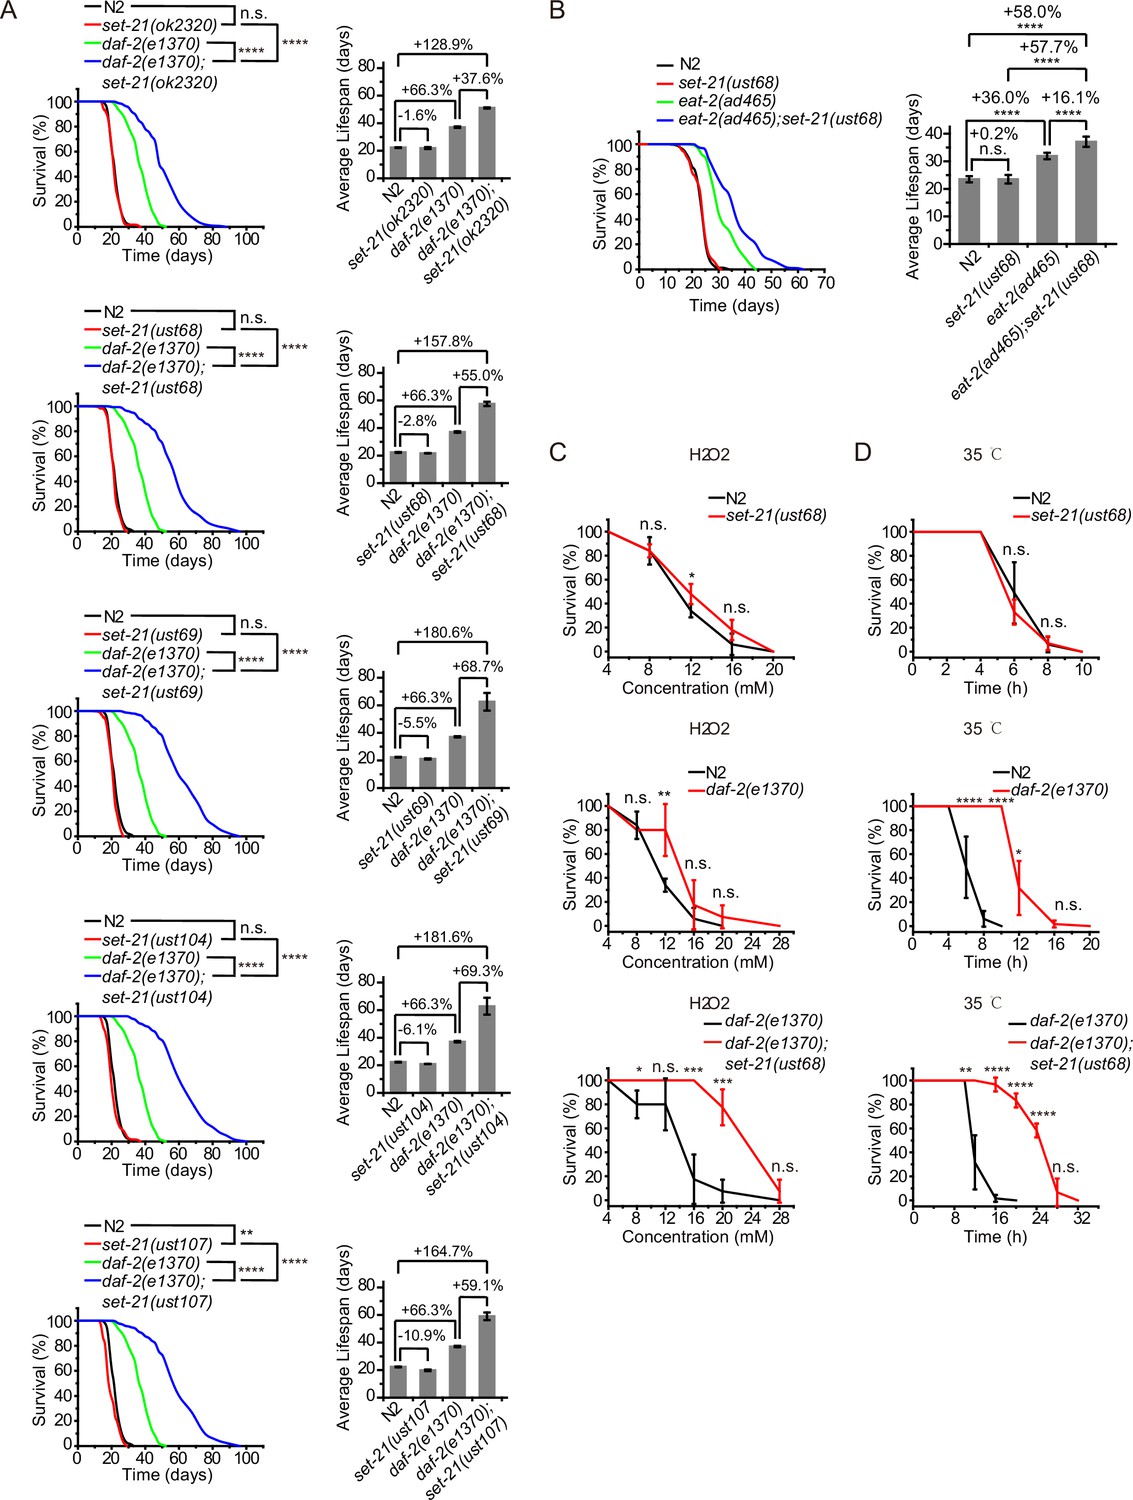
Synergistic lifespan extension and stress resistance in daf-2;set-21 mutants.
(A) (Left) Survival curves of indicated animals. (Right) Histogram displaying the average lifespan of the indicated animals. Mean ± s.e.m. of two independent experiments. The percentage of change was compared to the average lifespan of control animals. Asterisks indicate significant differences using log rank tests. ** 0.001< p < 0.01; ****p<0.0001. n.s., not significant, p>0.05. Lifespan data were summarized in Supplementary file 1. (B) (Left) Survival curves of indicated animals. (Right) Histogram displaying the average lifespan of the indicated animals. Mean ± s.e.m. of two independent experiments. Asterisks indicate significant differences using log rank tests. ****p<0.0001. Lifespan data were summarized in Supplementary file 1. (C, D) Survival curves of the indicated animals. (C) Oxidative and (D) heat stress. Data in each panel are presented as the mean ± s.e.m. of five independent experiments. Asterisks indicate significant differences using two-tailed t tests. *p<0.05; **p<0.01; ***p<0.001; ****p<0.0001; n.s., not significant, p>0.05. The same oxidative stress data of control N2 and daf-2 animals were used in (C) Figures 2 and 3 and Figure 3—figure supplement 3A. The same heat stress data of control N2 and daf-2 animals were used in (D) Figures 2 and 3 and Figure 3—figure supplement 3B.
Figure 1—figure supplement 1
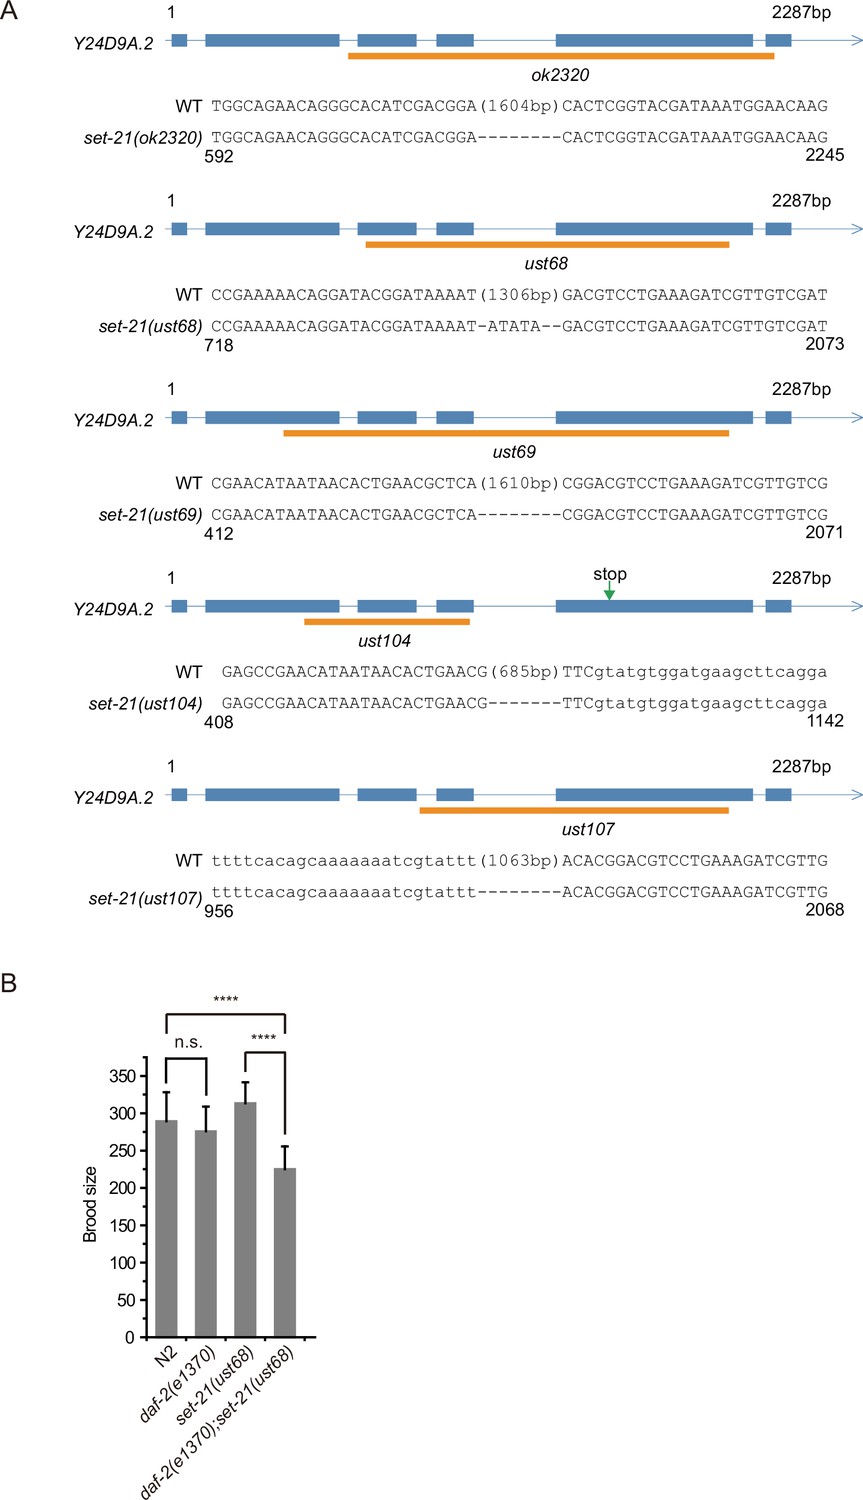
Alleles of set-21.
(A) Gene structure and the alleles of set-21. The ust alleles were generated by dual sgRNA-mediated CRISPR/Cas9 technology. Orange bars indicate deleted regions in gene loci. (B) The brood size of indicated animals. Data are presented as the mean ± s.e.m. of at least 20 worms. Asterisks indicate significant differences using two-tailed t tests. ****p<0.0001; n.s., not significant. The same brood size data of control N2 and daf-2 animals were used in (B) and Figure 3—figure supplement 2.
Figure 2
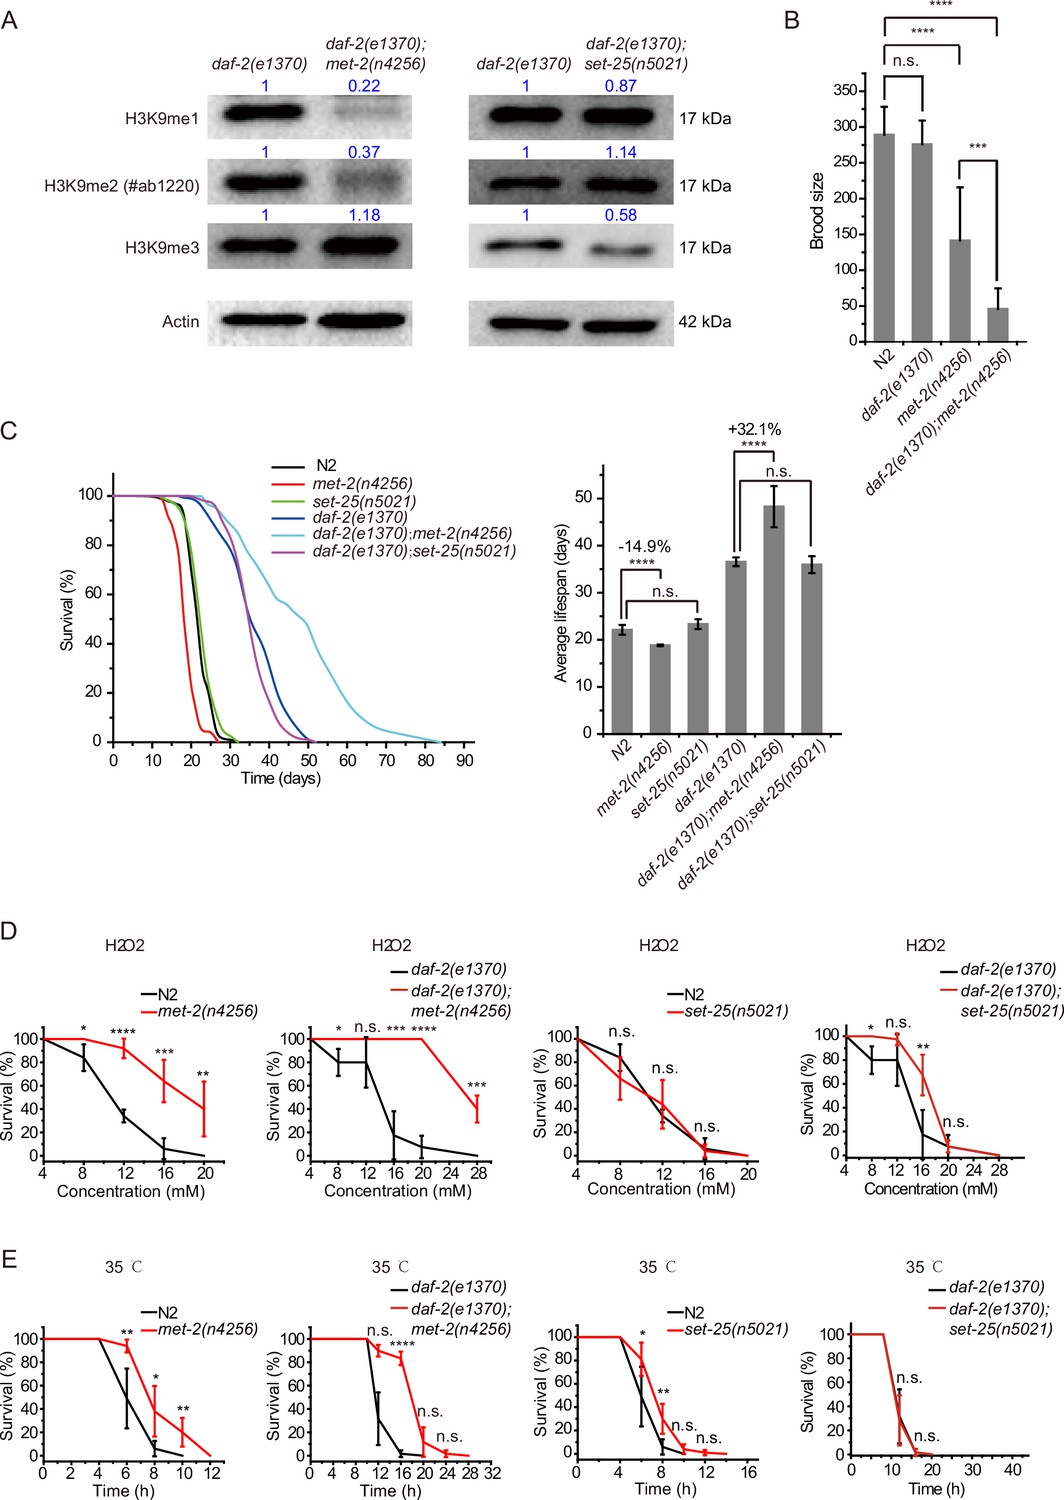
daf-2;met-2 mutants revealed extended lifespan and increased resistance to oxidative and heat stress compared to daf-2 animals.
(A) Western blotting of L4 stage animals with the indicated antibodies. Numbers indicate the scanned density by ImageJ. (B) Brood size of indicated animals at 20°C. (C) (Left) Survival curves of indicated animals. (Right) Histogram displaying the average lifespan of the indicated animals. Mean ± s.e.m. of three independent experiments. Asterisks indicate significant differences using log rank tests. ****p<0.0001. Lifespan data were summarized in Supplementary file 1. (D, E) Survival curves of the indicated animals. (D) Oxidative and (E) heat stress. Data in each panel are presented as the mean ± s.e.m. of five independent experiments. Asterisks indicate significant differences using two-tailed t tests. *p<0.05; **p<0.01; ***p<0.001; ****p<0.0001; n.s., not significant, p>0.05.
-
Figure 2—source data 1
Original files and figures of the blots in Figure 2A.
- https://cdn.elifesciences.org/articles/74812/elife-74812-fig2-data1-v2.zip
Figure 3 with 3 supplements
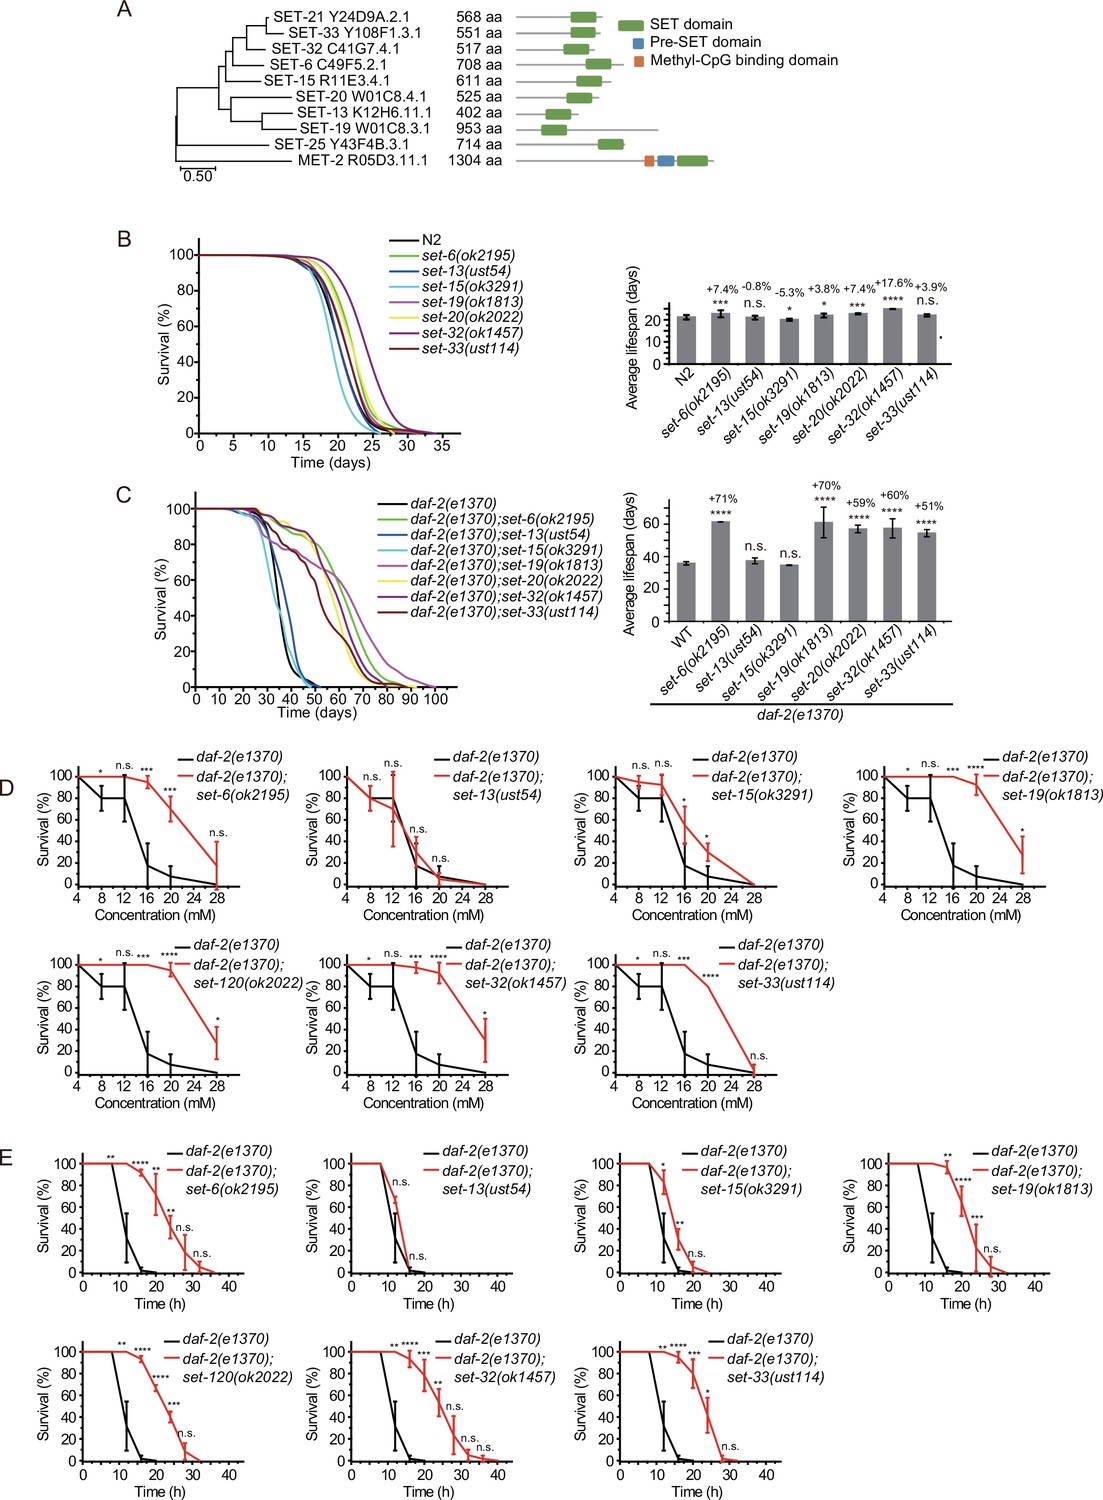
Synergistic lifespan extension of set-6, set-19, set-20, set-32, and set-33 with daf-2 animals.
(A) Dendrogram comparing the protein sequences of SET proteins that are putative H3K9 methyltransferases or methyltransferases that may indirectly regulate H3K9me in Caenorhabditis elegans. The numbers indicate the length of each protein. (B) (Left) Survival curves of indicated animals. (Right) Histogram displaying the average lifespan of the indicated animals. Mean ± s.e.m. of two independent experiments. The percentage of change was compared to the average lifespan of N2 animals. Asterisks indicate significant differences using log rank tests. *p<0.05; **p<0.01; ***p<0.001; ****p<0.0001; n.s., not significant, p>0.05. Lifespan data were summarized in Supplementary file 1. (C) (Left) Survival curves of indicated animals. (Right) Histogram displaying the average lifespan of the indicated animals. Mean ± s.e.m. of two independent experiments. The percentage of change was compared to the average lifespan of daf-2 animals. Asterisks indicate significant differences using log rank tests. *p<0.05; **p<0.01; ***p<0.001; ****p<0.0001; n.s., not significant, p>0.05. (D, E) Survival curves of the indicated animals. (D) Oxidative and (E) heat stress. Data are presented as the mean ± s.e.m. of five independent experiments. Asterisks indicate significant differences using two-tailed t tests. *p<0.05; **p<0.01; ***p<0.001; ****p<0.0001; n.s., not significant, p>0.05.
Figure 3—figure supplement 1
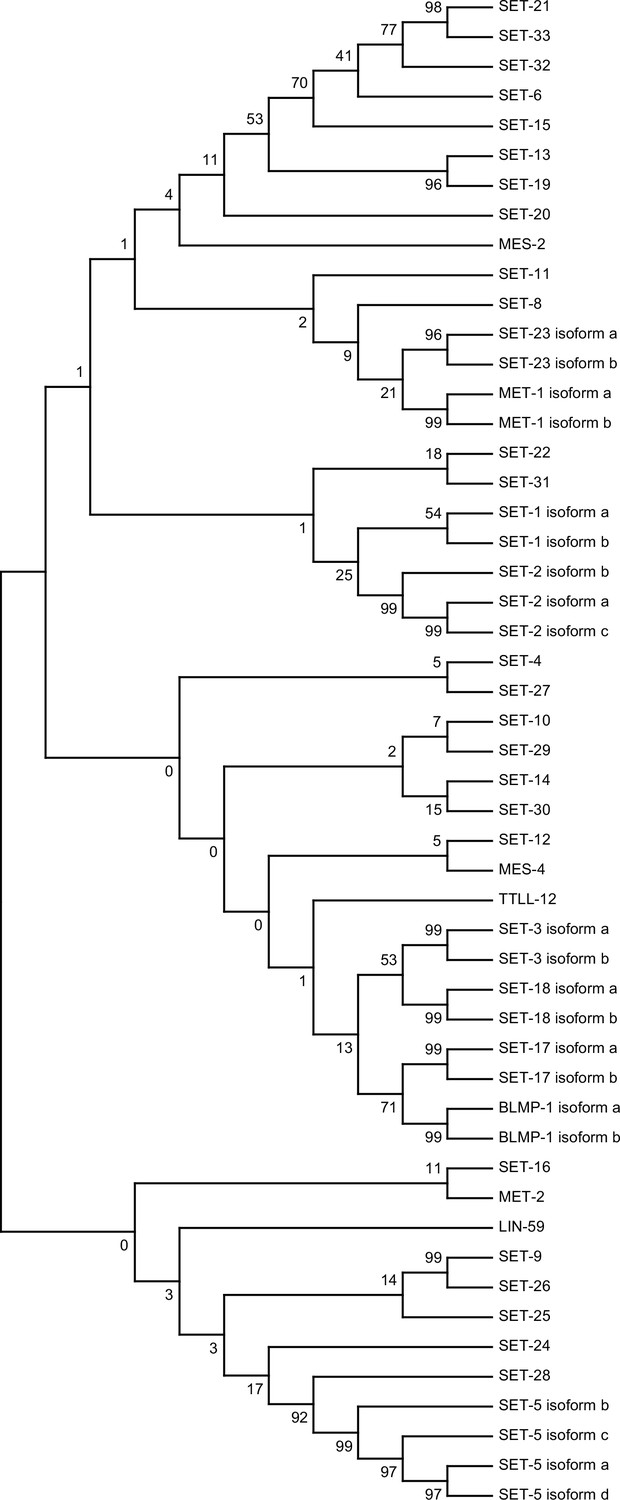
Dendrogram comparing the protein sequences of all SET proteins in Caenorhabditis elegans.
Figure 3—figure supplement 2
Alleles of set genes and the brood size of set mutants.
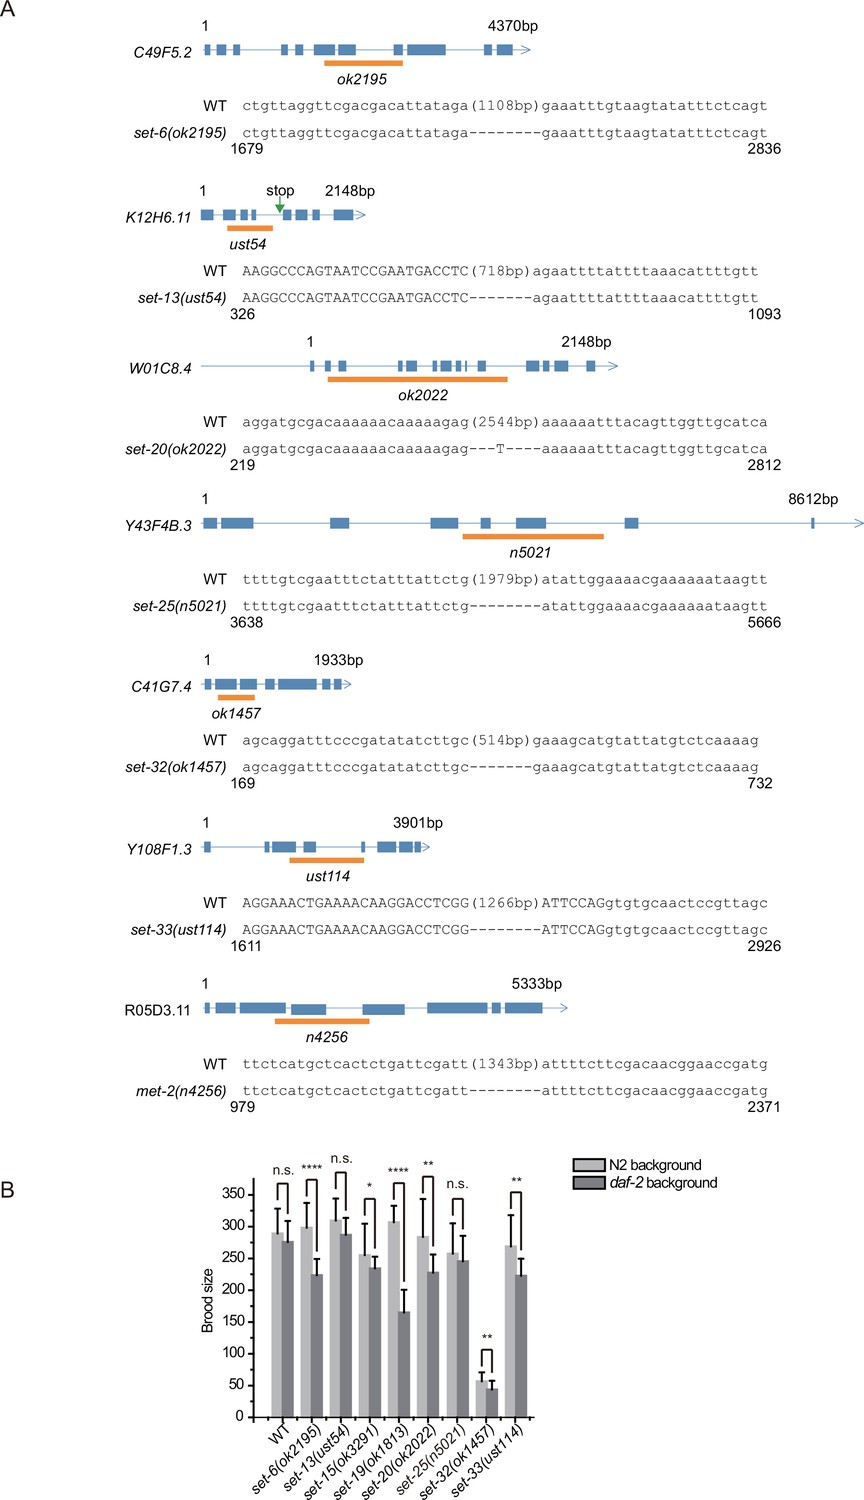
(A) Gene structure and the alleles of set genes. The ust alleles were generated by dual sgRNA-mediated CRISPR/Cas9 technology. Orange bars indicate deleted regions in gene loci. (B) Brood size of indicated animals. Data are presented as the mean ± s.e.m. of at least 20 worms. Asterisks indicate significant differences using two-tailed t tests. *p<0.05; **p<0.01; ***p<0.001; ****p<0.0001; n.s., not significant, p>0.05.
Figure 3—figure supplement 3
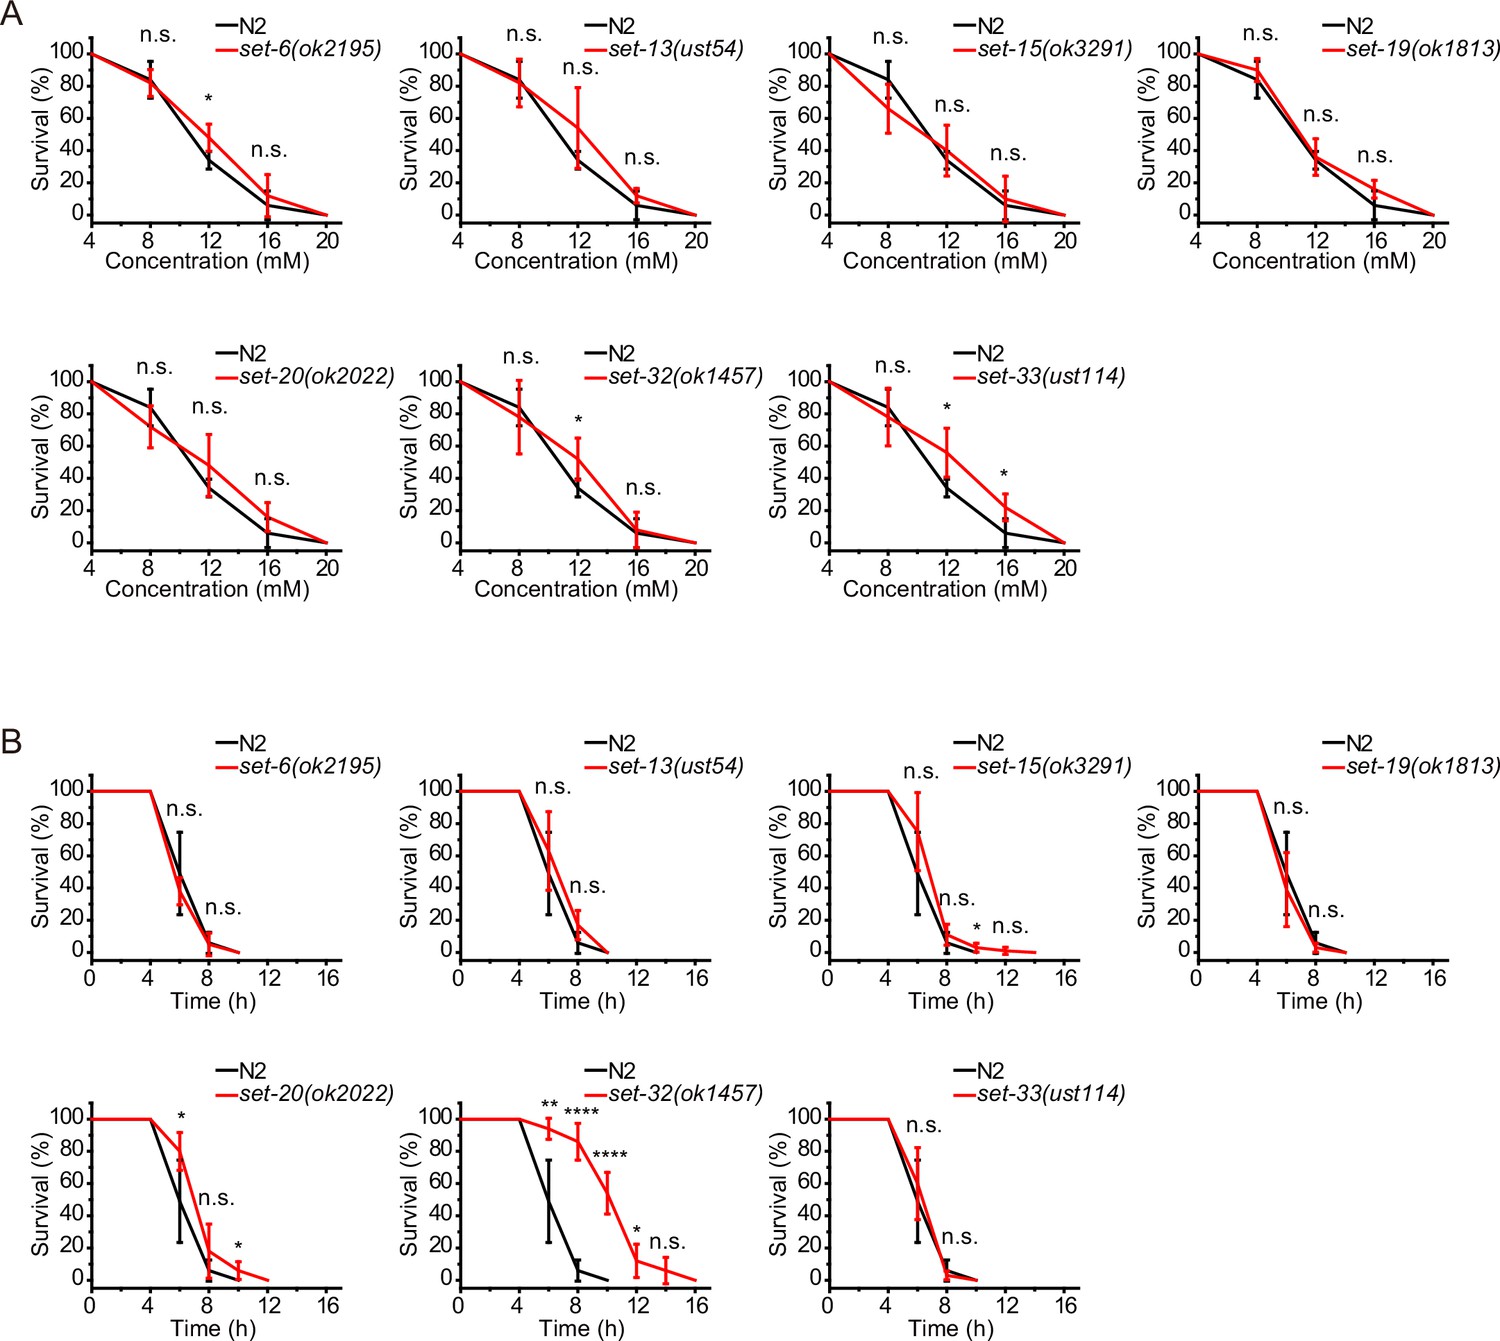
The depletion of set genes did not induce significant stress resistance in N2 background animals.
(A, B) Survival curves of the indicated animals. (A) Oxidative and (B) heat stress. Data are presented as the mean ± s.e.m. of five independent experiments (n=50 animals). Asterisks indicate significant differences using two-tailed t tests. *p<0.05; **p<0.01; ***p<0.001; ****p<0.0001; n.s., not significant, p>0.05.
Figure 4 with 1 supplement
Genetic pathway analysis of set genes in lifespan regulation in daf-2 mutants.
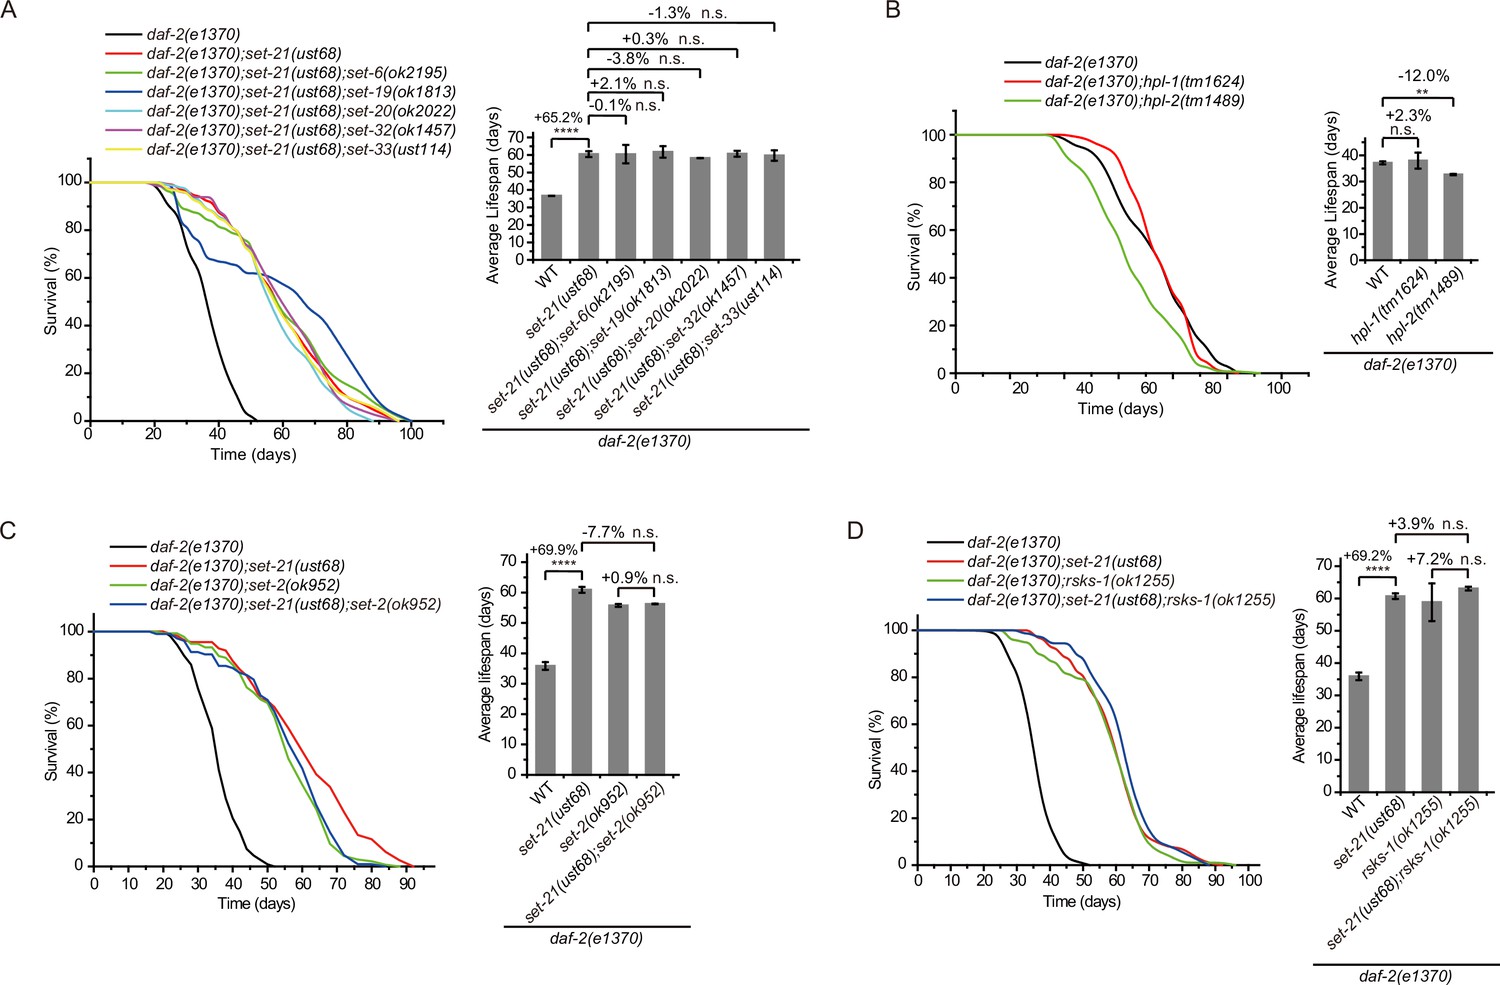
(A–D) (Left) Survival curves of the indicated animals. (Right) Histogram displaying the average lifespan of the indicated animals. Means ± s.e.m. of two independent experiments. The percentage change was compared to the lifespan of control animals. Asterisks indicate significant differences using log rank tests. ** 0.001< p < 0.01; ****p<0.0001; n.s., not significant, p>0.05. Lifespan data were summarized in Supplementary file 1.
Figure 4—figure supplement 1
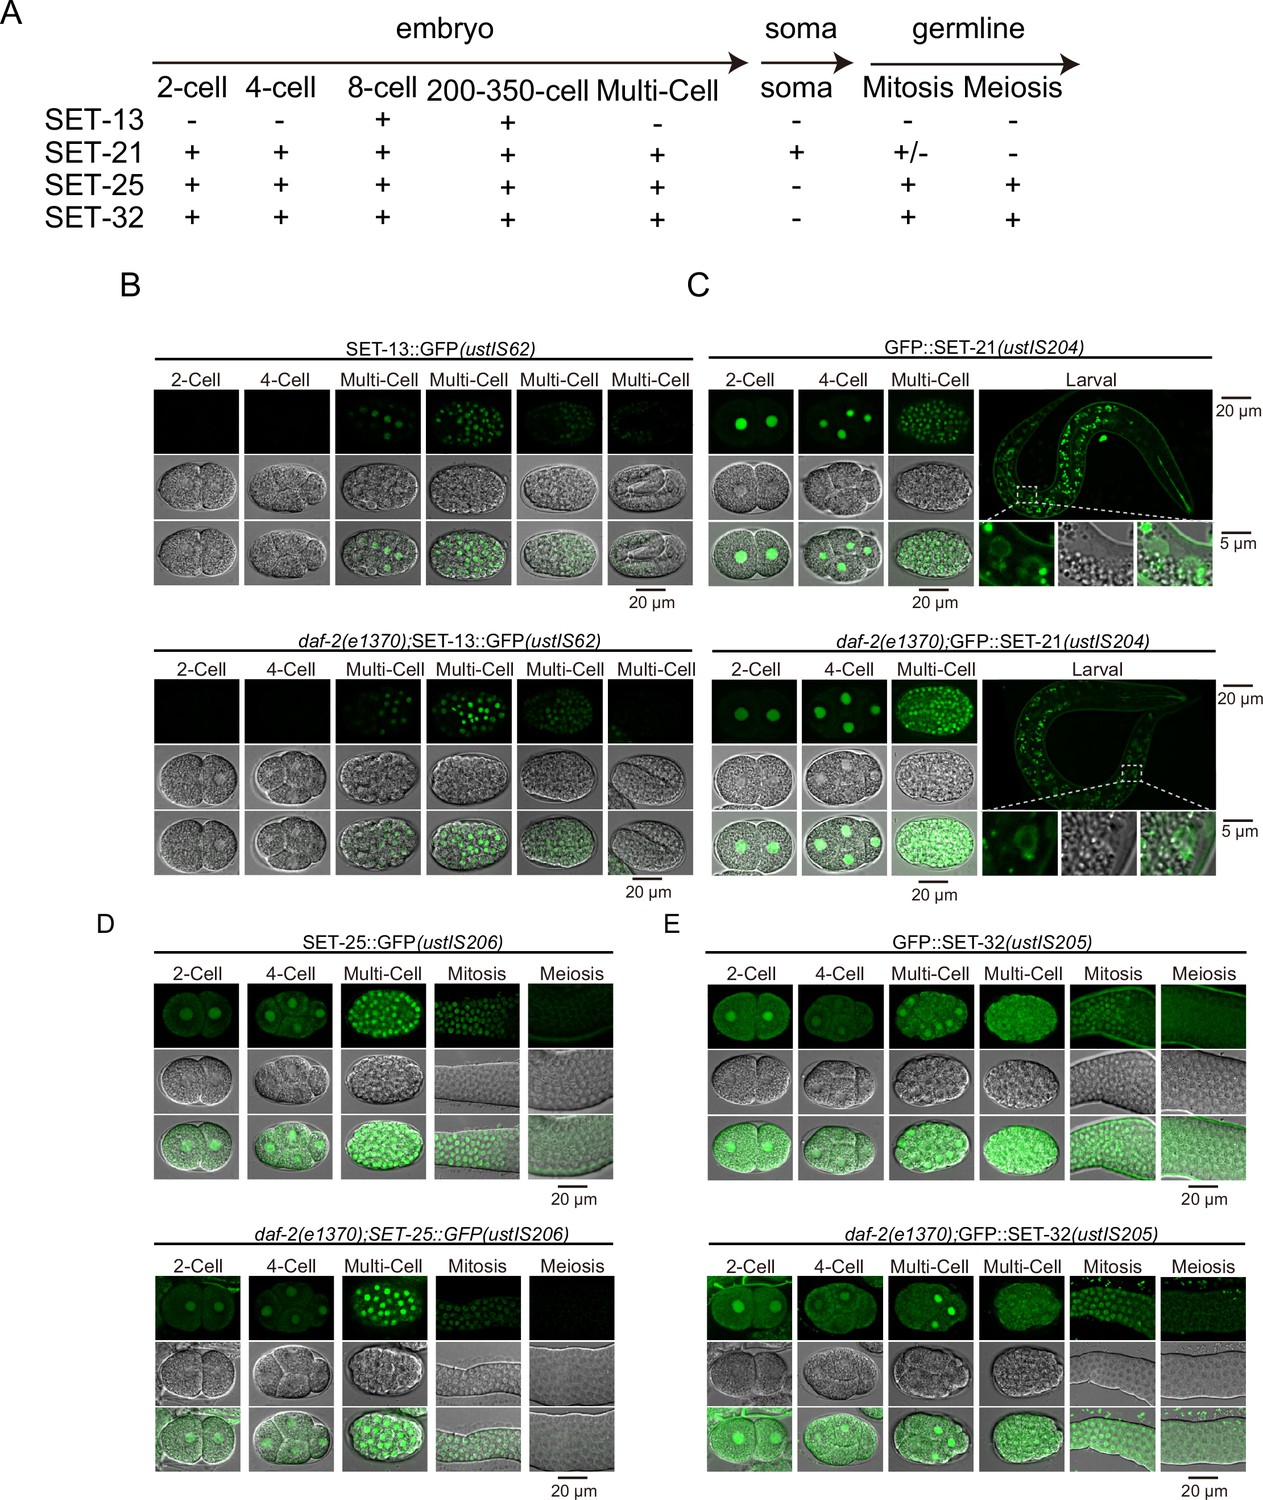
Expression pattern of selected SET proteins.
(A) Summary of the expression patterns of selected SET proteins. (B, C, D, E) Fluorescent images of indicated GFP-tagged SET transgenes.
Figure 5 with 2 supplements
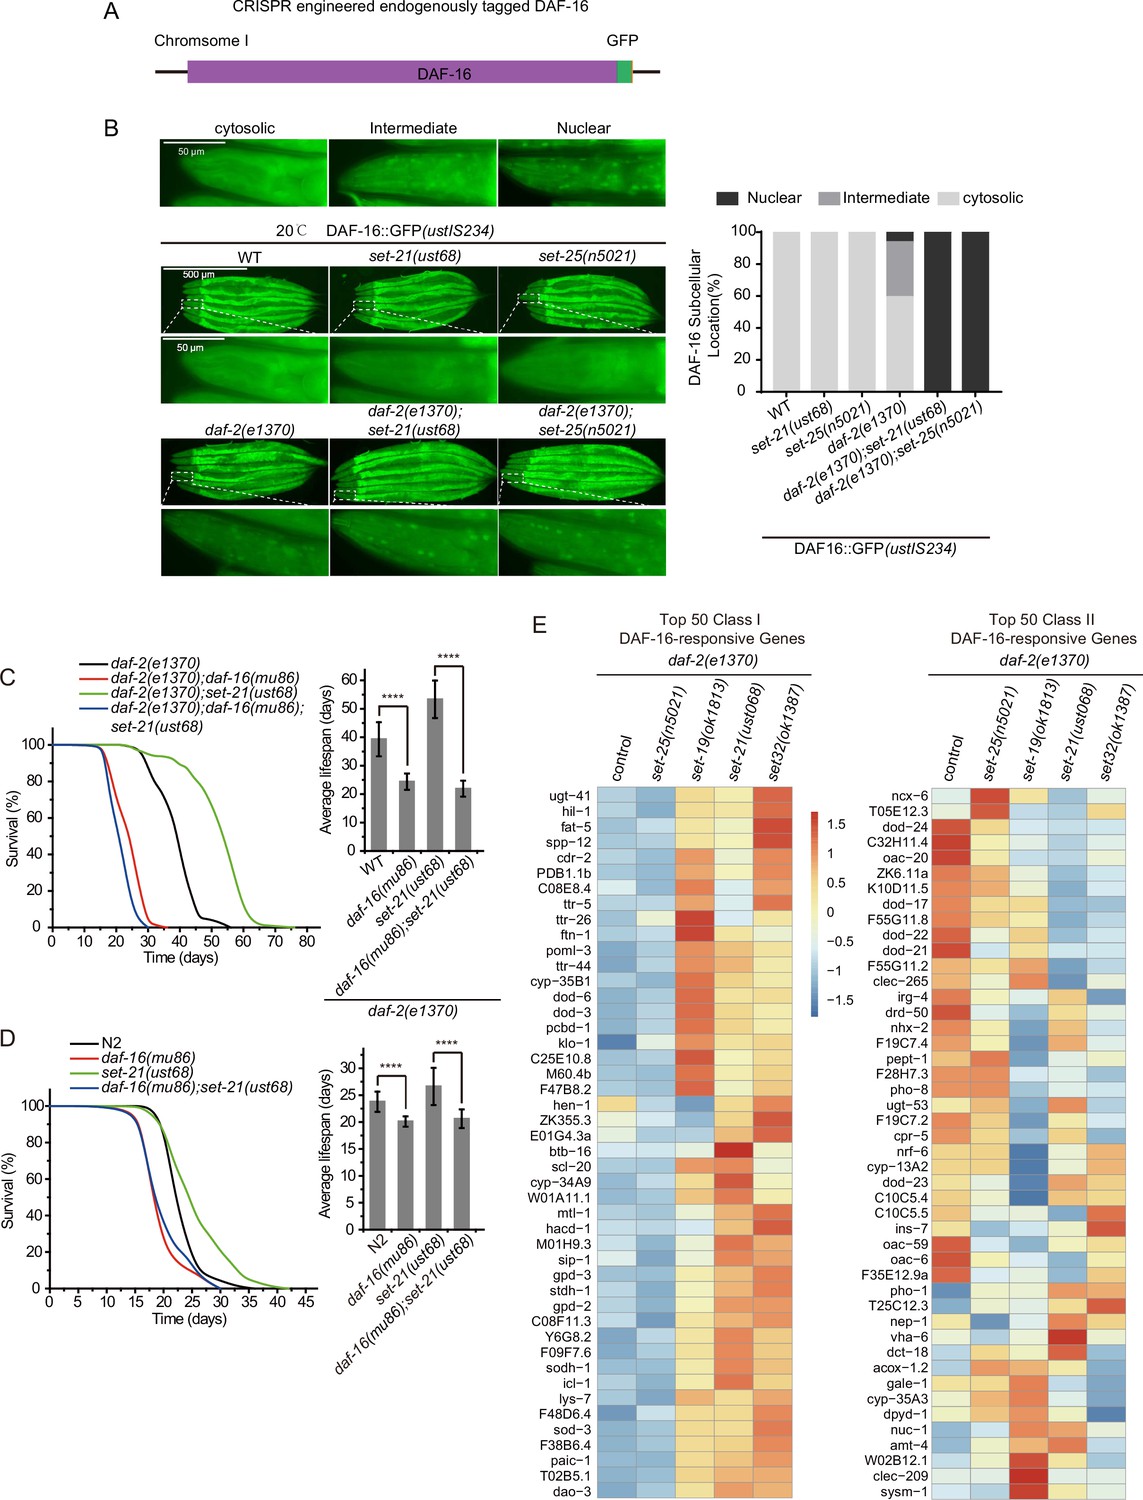
The lifespan-limiting SET proteins regulate DAF-16 Class I genes in daf-2 mutants.
(A) Construction of an in situ GFP-tagged DAF-16 transgene by CRISPR/Cas9 technology. The subcellular localization of DAF-16::GFP was scored at the pharynx in young adult animals. (B) (Left) Fluorescent images of the single-copied DAF-16::GFP transgene in indicated animals at 20°C. (Right) The subcellular localization of the single-copied DAF-16::GFP transgene was scored in indicated animals. (C, D) (Left) Survival curves of indicated animals. (Right) Histogram displaying the average lifespan of the indicated animals. Mean ± s.e.m. of three independent experiments. Asterisks indicate significant differences using log rank tests. ****p<0.0001. Lifespan data were summarized in Supplementary file 1. (E) Heatmap of the standardized fragments per kilobase of transcript per million mapped reads (FPKM) of reported top 50 DAF-16 Class I and Class II genes by mRNA-seq in the indicated animals. Statistical analysis was performed to obtain the expression levels of each gene in each strain and the average of the expression levels in the five strains. The gene expression levels in a single strain were compared with the average of the five strains, and the ratio obtained was processed by log2. The resulting value>0 means the expression level of the gene in the indicated strain is higher than the average expression levels of this gene in the five strains, as shown from yellow to red. The resulting value<0 means the expression level of the gene in the indicated strain is lower than the average expression levels of this gene in the five strains, as shown in blue. The expression levels are indicated by the color bar. The mRNA-seq was conducted in single replicate and validated by quantitative real-time PCR in Figure 7A. The 50 most significant positive (Class I) and negative (Class II) targets of DAF-16 were selected according to their responsiveness to DAF-16 (Tepper et al., 2013).
Figure 5—figure supplement 1
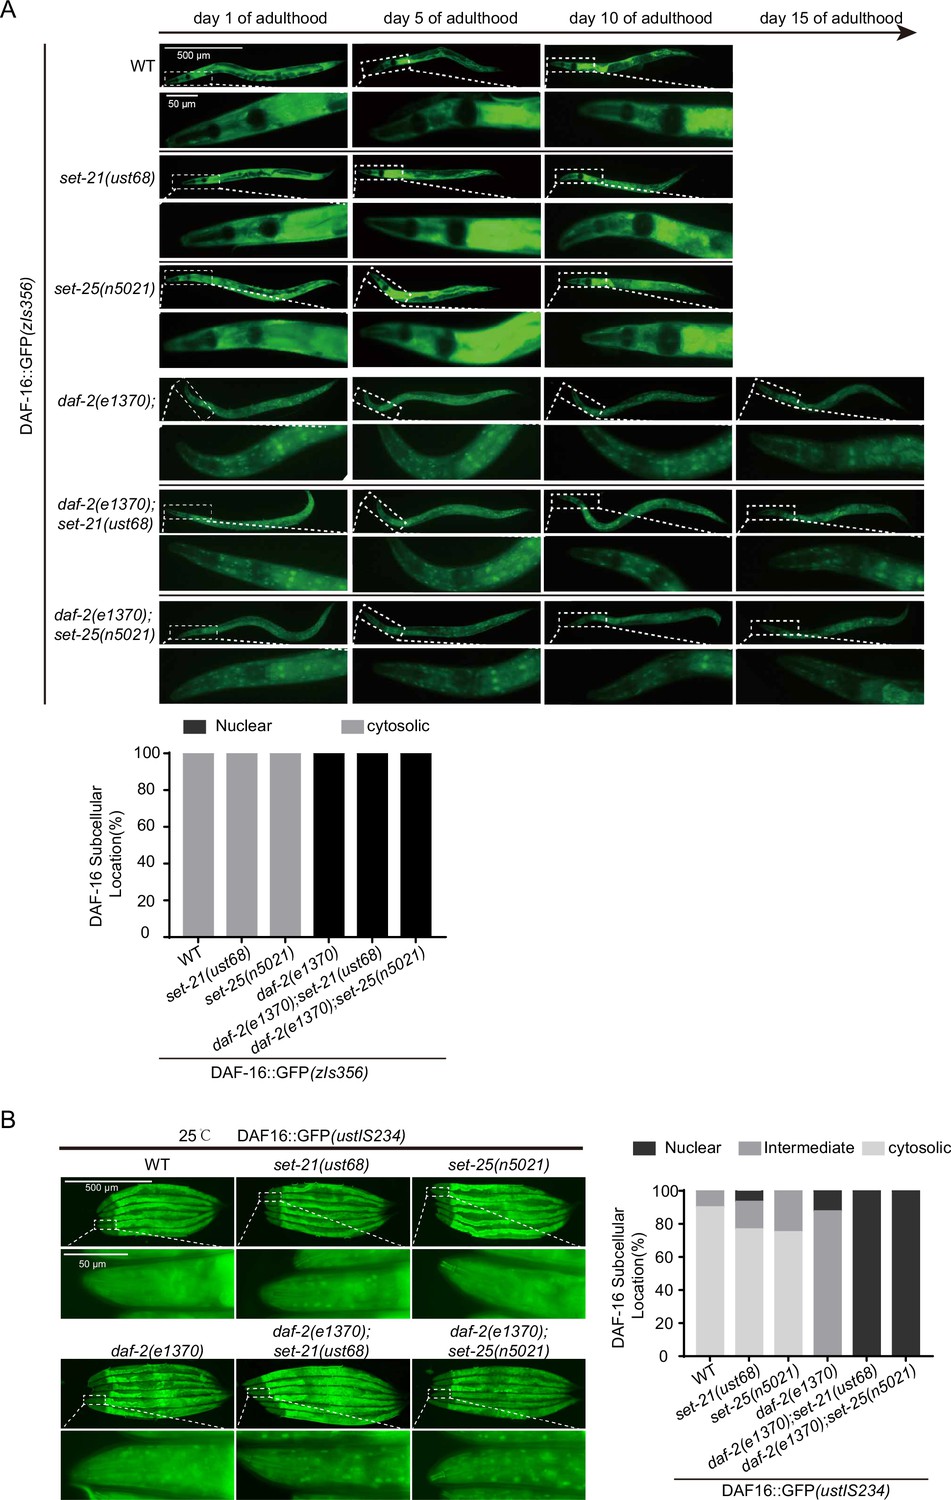
Fluorescent images of GFP-tagged DAF-16 in the indicated young adult animals.
(A) (Top) Fluorescent images of a widely used high-copied GFP-tagged DAF-16 in the indicated adult animals at 20°C. (Bottom) The subcellular localization of DAF-16::GFP was scored in indicated animals. (B) (Left) Fluorescent images of the single-copied DAF-16::GFP transgene in indicated young adult animals at 25°C. (Right) The subcellular localization of DAF-16::GFP was scored in indicated animals.
Figure 5—figure supplement 2
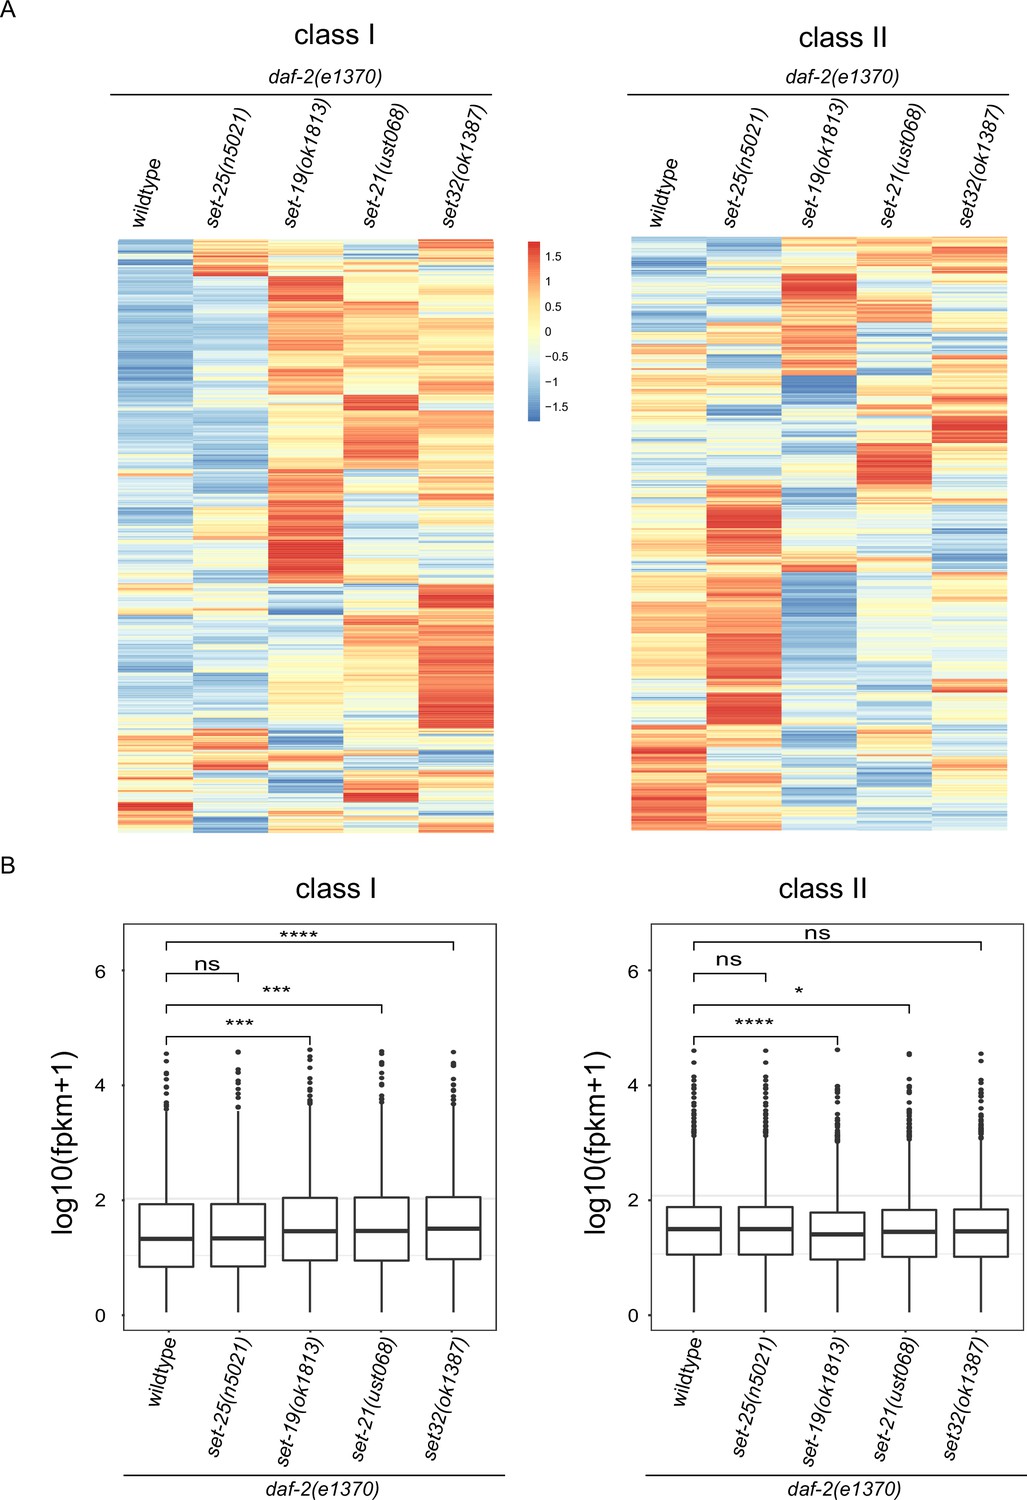
Class I DAF-16 genes were upregulated in daf-2;set-19, daf-2;set-21, and daf-2;set-32 worms.
(A) Heatmap of the standardized fragments per kilobase of transcript per million mapped reads (FPKM) for reported 1576 DAF-16 Class I and 1653 Class II genes by mRNA-seq in the indicated animals. Statistical analysis was performed to obtain the expression levels of each gene in each strain and the average of the expression levels in the five strains. The gene expression levels in a single strain were compared with the average of the five strains, and the ratio obtained was processed by log2. The resulting value>0 means the expression level of the gene in the indicated strain is higher than the average expression levels of this gene in the five strains, as shown from yellow to red. The resulting value<0 means the expression level of the gene in the indicated strain is lower than the average expression levels of this gene in the five strains, as shown in blue. The expression levels are indicated by the color bar. (B) Boxplot showing the reported Class I (n=1576) and Class II (n=1653) DAF-16 genes expression profiles in the indicated animals. Significance was tested with the Wilcoxon test, n.s., not significant, p>0.05, *p ≤ 0.05, ***p ≤ 0.001, ****p ≤ 0.0001.
Figure 6 with 1 supplement

mRNA-seq identified differentially expressed genes co-regulated by the lifespan-limiting SET proteins in daf-2 animals.
(A) Venn diagrams showing the overlapped genes upregulated or downregulated between daf-2(e1370);set-25(n5021), daf-2(e1370);set-19(ok1813), daf-2(e1370);set-21(ust068), daf-2(e1370);set-32(ok1387) compared with daf-2(e1370). Upregulated genes were defined as fold change ≥ 2and p<0.05. Downregulated genes were defined as fold change ≤ 0.5and p<0.05. (B) Heatmap of the standardized fragments per kilobase of transcript per million mapped reads (FPKM) for the 49 co-upregulated genes and 11 co-downregulated genes in the indicated animals. The expression levels are indicated by the color bar. (C, D) Profile plots showing the chromatin immunoprecipitation sequencing (ChIP-seq) signals of seven transcription factors around transcription start sites (TSSs) of (C) 49 co-upregulated genes and (D) 11 co-downregulated genes. The ChIP-seq datasets were downloaded from the ENCODE or NCBI GEO databases (Supplementary file 6).
Figure 6—figure supplement 1
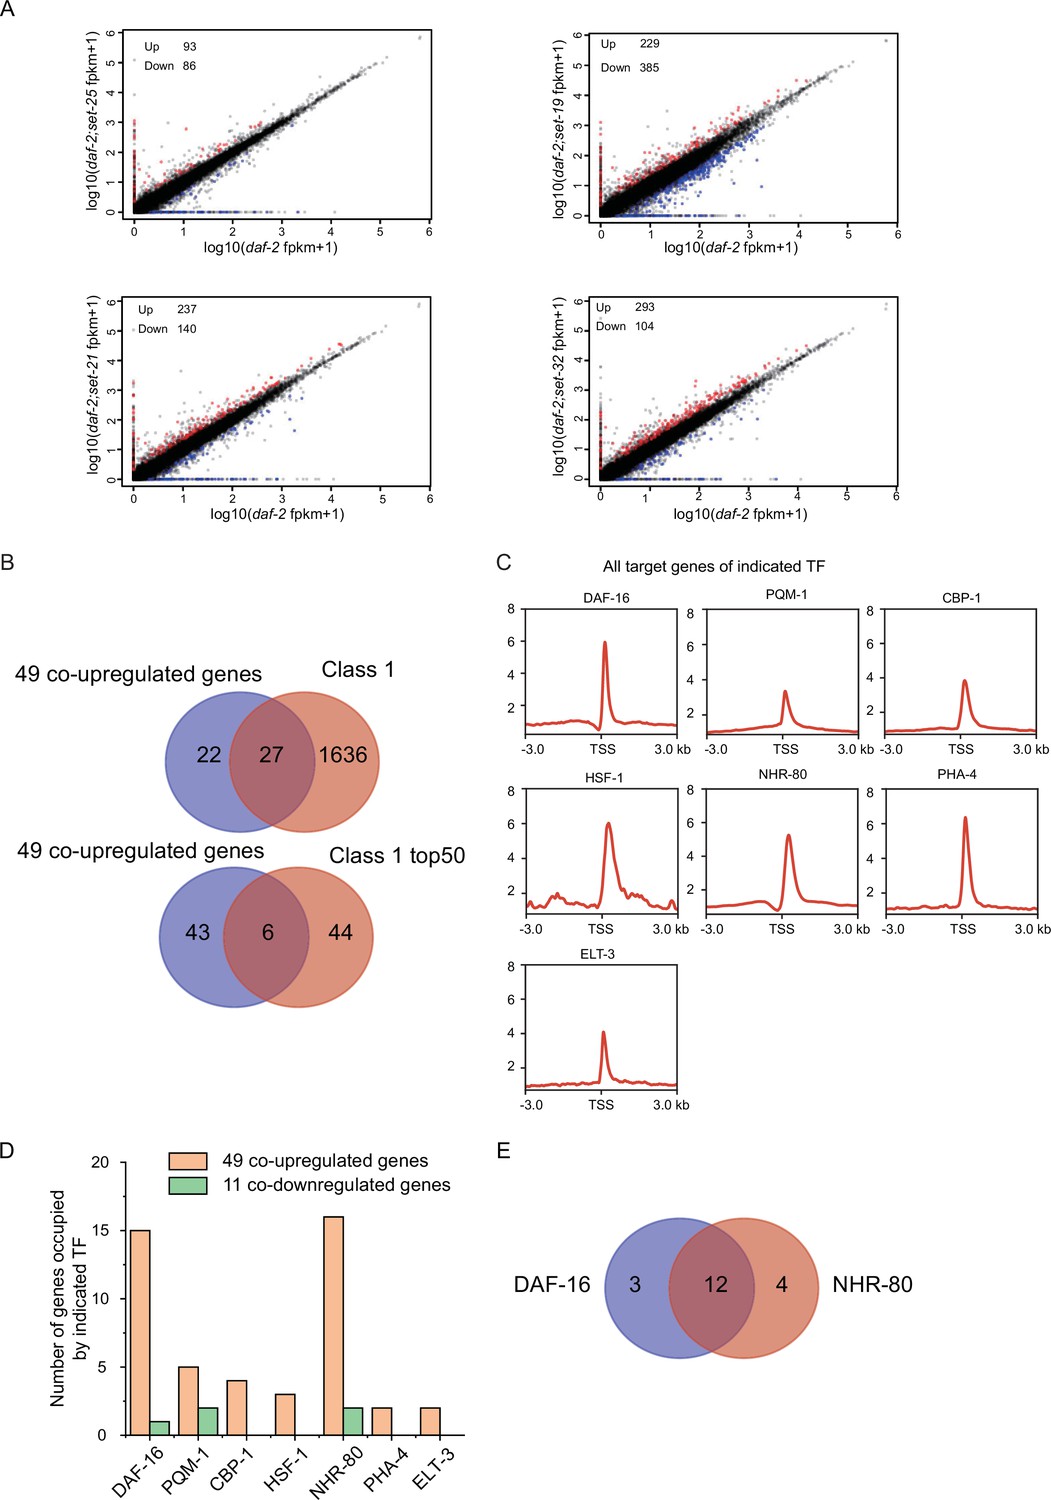
The co-upregulated genes by the lifespan-limiting SET proteins are targeted by DAF-16 and NHR-80.
(A) Scatterplots comparing gene expression between indicated double mutants and daf-2(e1370). The upregulated genes were defined as fold change ≥ 2and p<0.05. The down-regulated genes were defined as fold change ≤ 0.5and p<0.05. (B) (Top) Venn diagrams showing the overlap between 49 co-upregulated genes and Class 1 DAF-16 genes. (Bottom) Venn diagrams showing the overlap between 49 co-upregulated genes and top 50 Class I DAF-16 genes. (C) Profile plots showing the chromatin immunoprecipitation sequencing (ChIP-seq) signals of seven transcription factors around transcription start sites (TSSs) of their target genes. The ChIP-seq datasets were downloaded from the ENCODE or the NCBI GEO databases (Supplementary file 6). (D) Bar diagrams showing the number of genes occupied by indicated TFs among the 49 co-upregulated genes or 11 co-downregulated genes. (E) Venn diagrams showing the overlap between DAF-16 target genes and NHR-80 target genes in the 49 co-upregulated genes.
Figure 7 with 1 supplement

Class I DAF-16 genes are required for the synergistic lifespan extension in daf-2;set-21 animals.
(A) Quantitative real-time PCR analysis of the indicated mRNAs. Levels of ama-1 mRNA were used as an internal control for sample normalization. Data were expressed as fold changes relative to those of daf-2 (e1370) animals. Data are presented as the mean ± s.e.m. of three independent experiments. Asterisks indicate significant differences using two-tailed t tests. *p<0.05; **p<0.01; ***p<0.001; ****p<0.0001; n.s., not significant, p>0.05. (B) Survival curves of indicated animals. Asterisks indicate significant differences using log rank tests. *p<0.05; **p<0.01; ***p<0.001; ****p<0.0001; n.s., not significant, p>0.05. Lifespan data were summarized in Supplementary file 1.
Figure 7—figure supplement 1
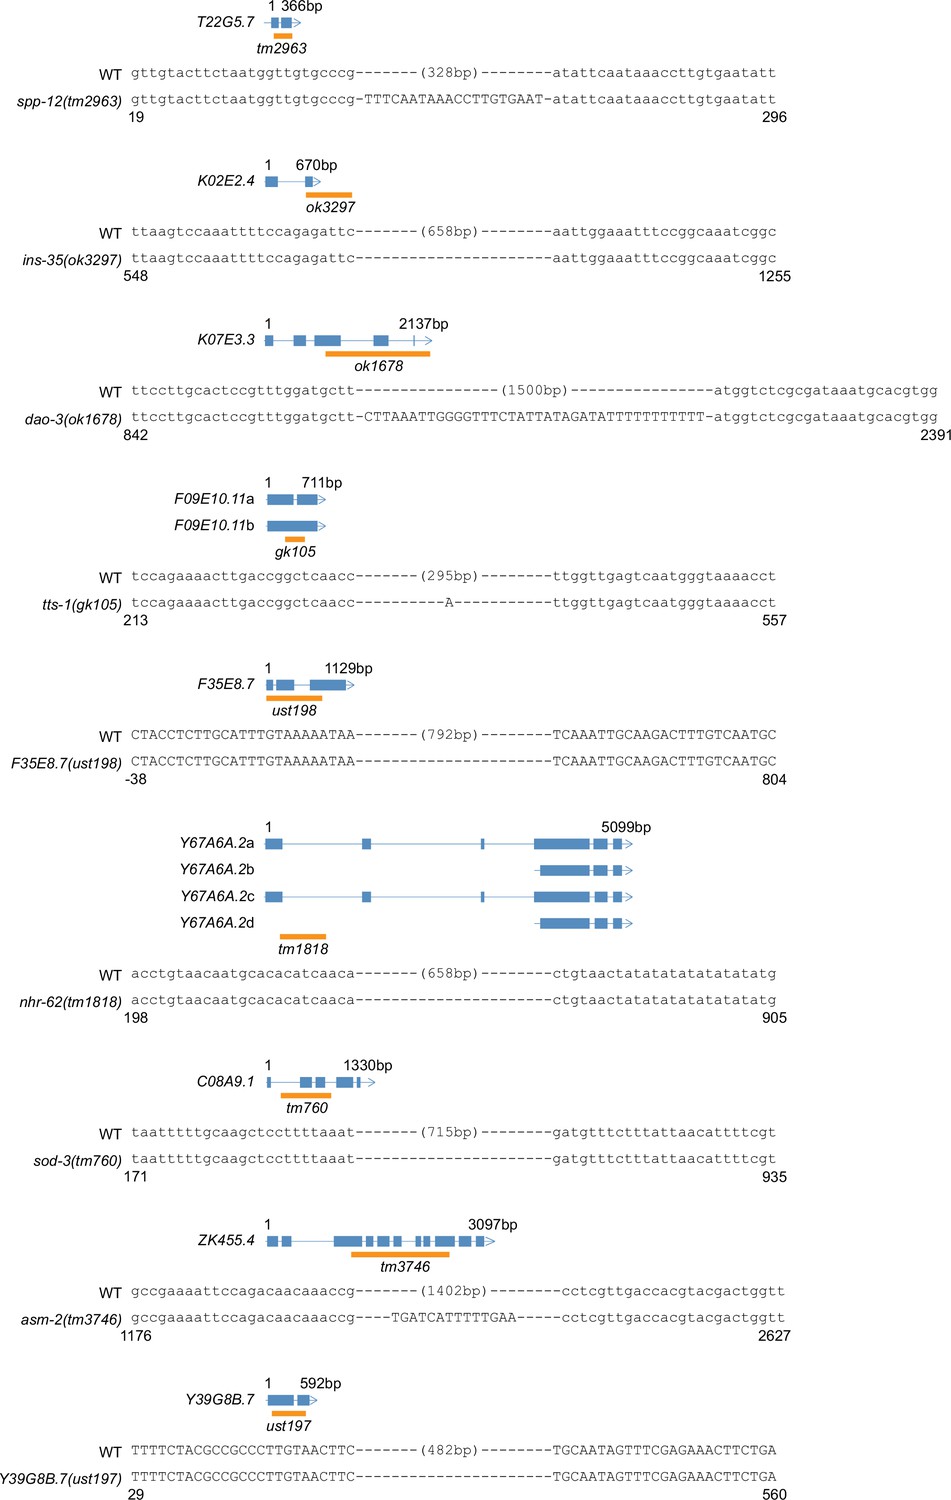
Gene structure and the alleles of indicated genes.
The ust alleles were generated by dual sgRNA-mediated CRISPR/Cas9 technology. Orange bars indicate deleted regions in gene loci.
Figure 8 with 4 supplements

H3K9me1/2 methylation limits the lifespan and stress resistance of daf-2 mutants.
(A) (Top) Western blotting of L4 stage animals with the indicated antibodies (also see Figure 8—figure supplement 1). (Bottom) The histogram displayed means + s.e.m. of scanned density by ImageJ from three independent experiments. (B) The G9a (EHMT2) inhibitor A-366 reduced H3K9me2 levels in daf-2 animals. (Left) Western blotting of L4 stage animals with the indicated antibodies. (Right) The histogram displayed means + s.e.m. of scanned density by ImageJ from three independent experiments. Data are expressed as fold changes relative to those of daf-2(e1370) animals without A-366. Asterisks indicate significant differences using two-tailed t tests. ***p<0.001. Also see Figure 8—figure supplement 4A-B for replicates. (C) (Top) Survival curves of indicated animals. (Bottom) Histogram displaying the average lifespan of the indicated animals. mean ± s.e.m. of three independent experiments. The percentage of change was compared to the average lifespan of the daf-2 mutant. Asterisks indicate significant differences using log rank tests. 0.001 < **p<0.01; ***p<0.001; ****p<0.0001. Lifespan data were summarized in Supplementary file 1. (D, E) Survival curves of G9a(EHMT2) inhibitor A-366-treated daf-2 animals upon (D) oxidative and (E) heat stress. Data are presented as the mean ± s.e.m. of five independent experiments (n=50 animals). Asterisks indicate significant differences using two-tailed t tests. *p<0.05; **p<0.01; ***p<0.001; ****p<0.0001; n.s., not significant, p>0.05.
-
Figure 8—source data 1
Original files and figures of the blots in Figure 8A and B.
- https://cdn.elifesciences.org/articles/74812/elife-74812-fig8-data1-v2.zip
Figure 8—figure supplement 1
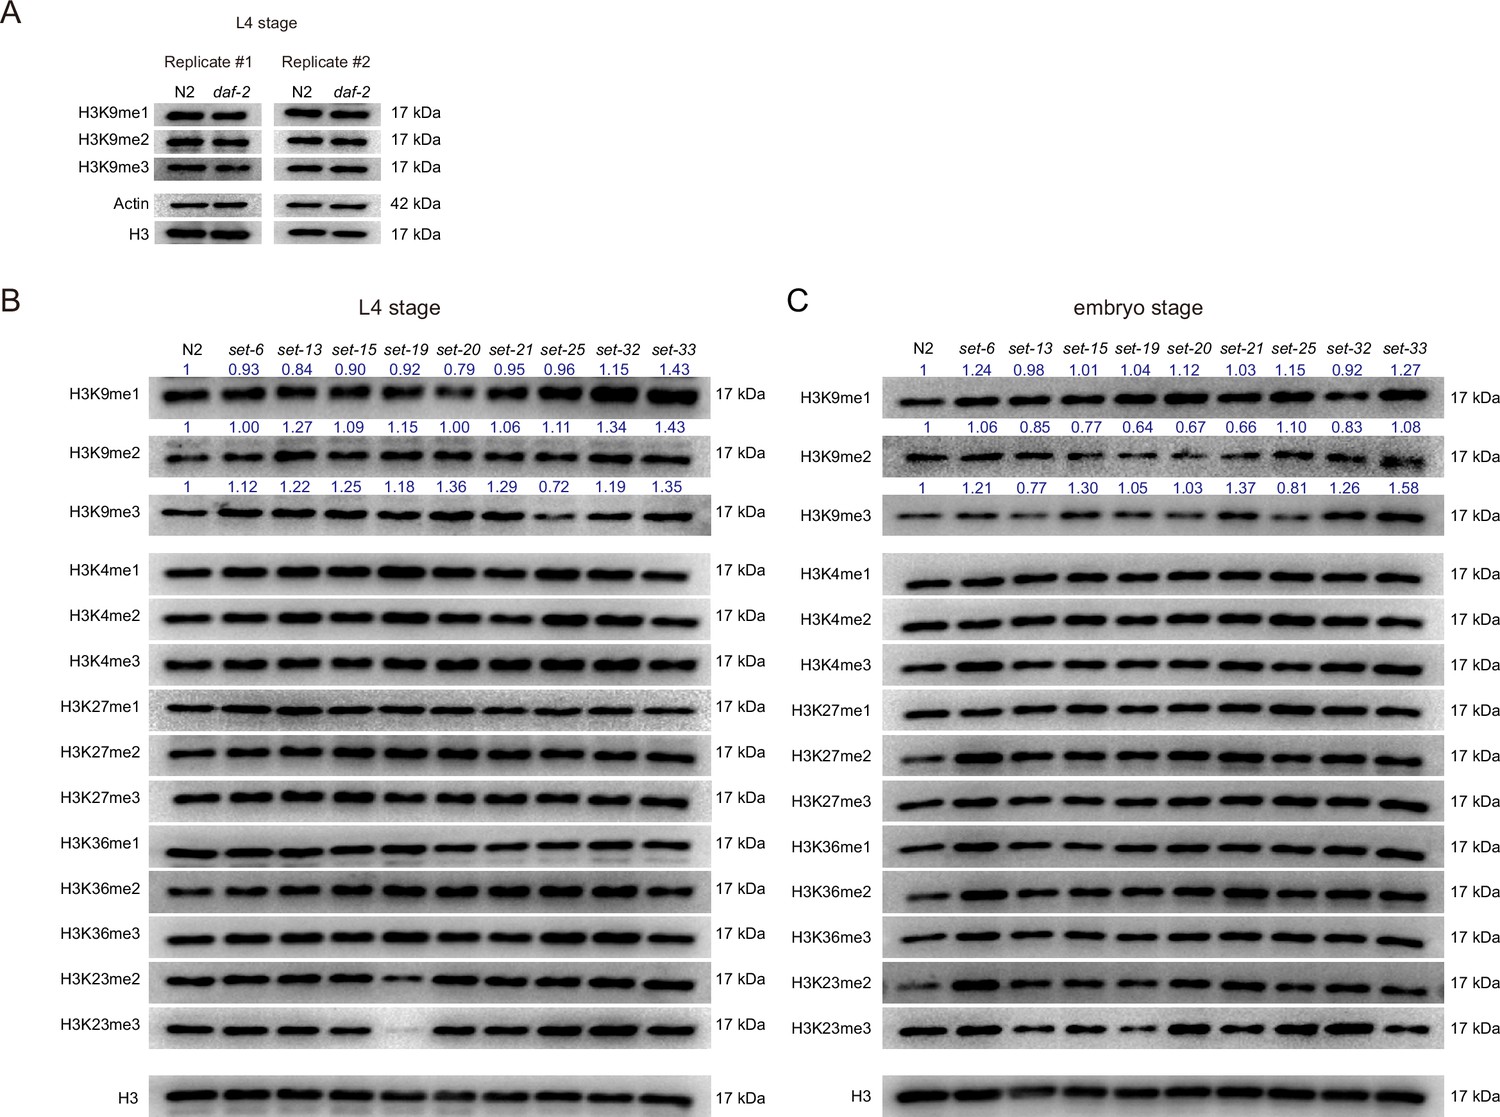
Western blotting of (A and B) L4 and (C) embryos with indicated antibodies.
Numbers in the picture indicate the density of bands measured by ImageJ.
Figure 8—figure supplement 2
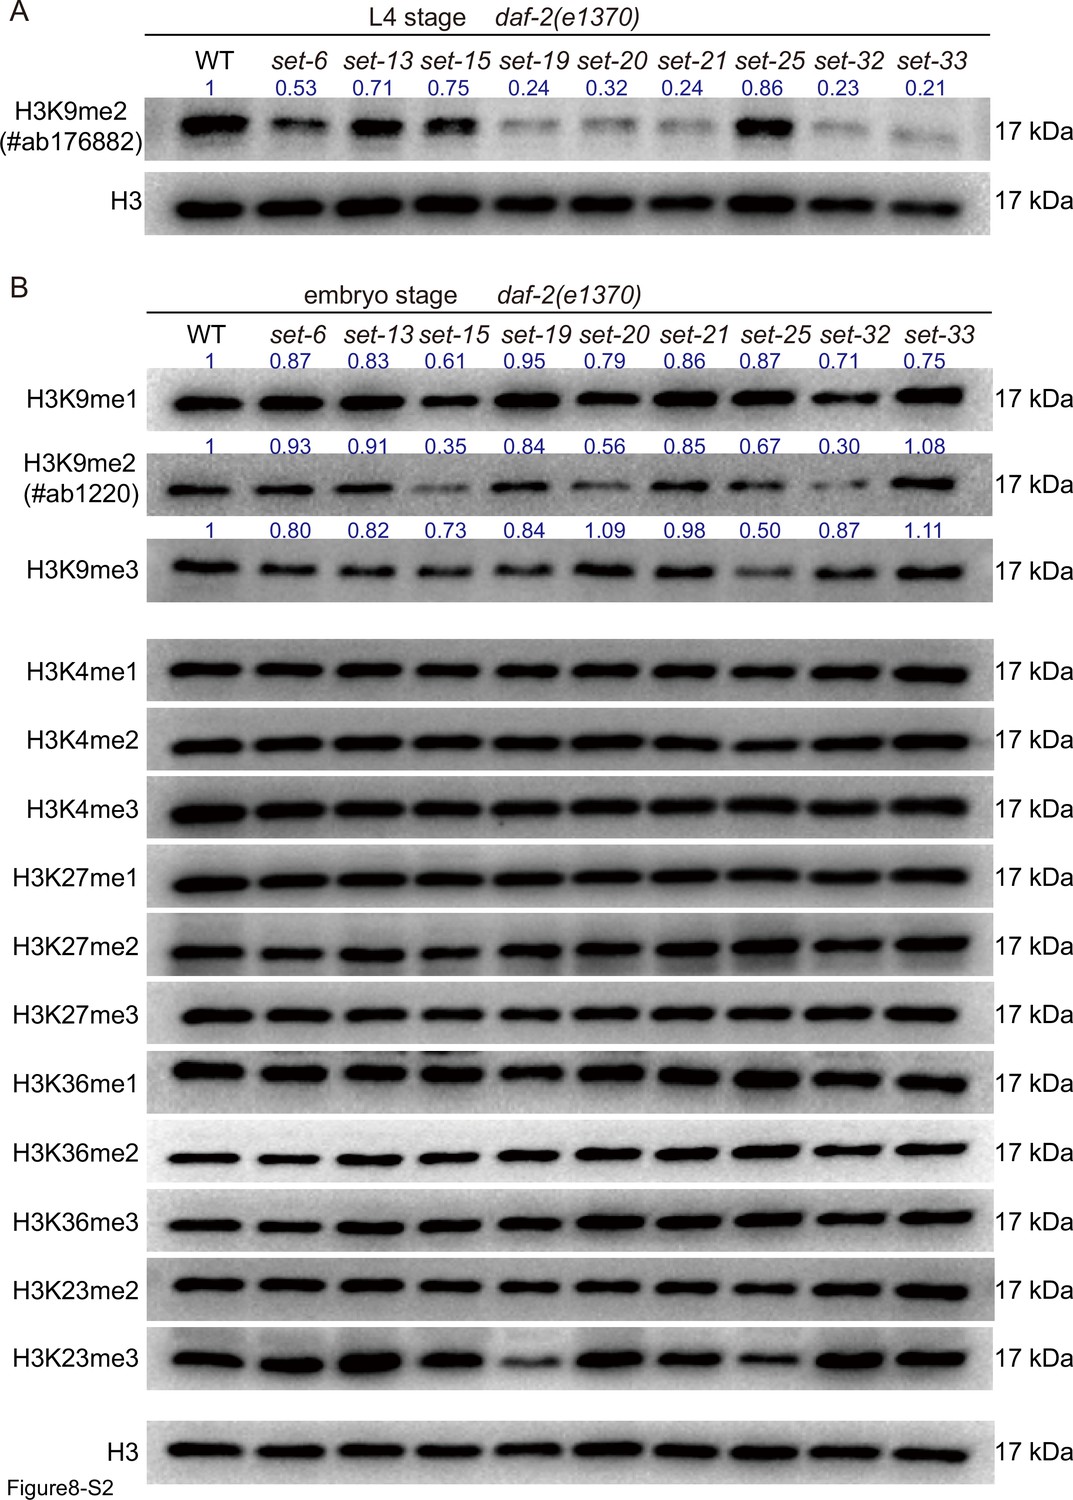
Western blotting of (A) L4 and (B) embryos with indicated antibodies.
Numbers in the picture indicate the density of bands measured by ImageJ.
Figure 8—figure supplement 3
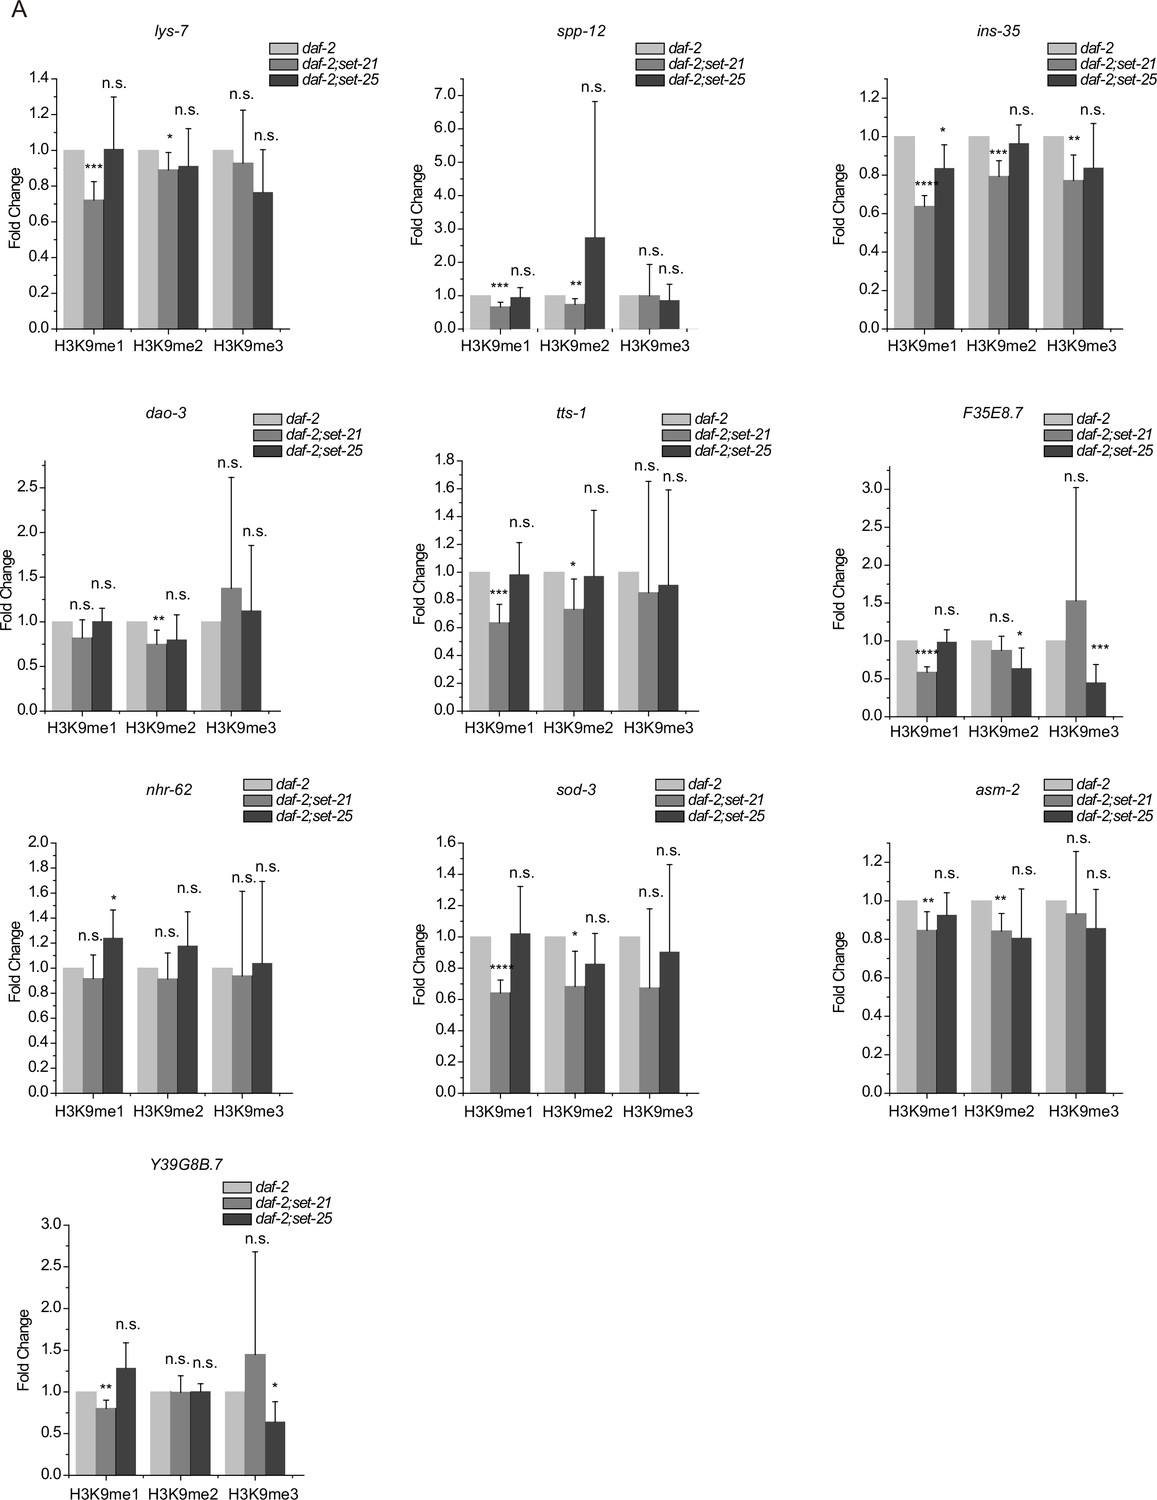
Chromatin immunoprecipitation (ChIP) of histone methylation marks in the indicated genes at the L4 stage.
Data are presented as ratios of H3K9 methylation levels in daf-2;set-21 and daf-2;set-25 versus daf-2 animals. H3K9 signals from ama-1 were used as an internal control for ChIP normalization. Data are presented as the mean ± s.e.m. of five independent experiments. Asterisks indicate significant differences using two-tailed t tests. *p<0.05; **p<0.01; ***p<0.001; ****p<0.0001; n.s., not significant, p>0.05.
Figure 8—figure supplement 4
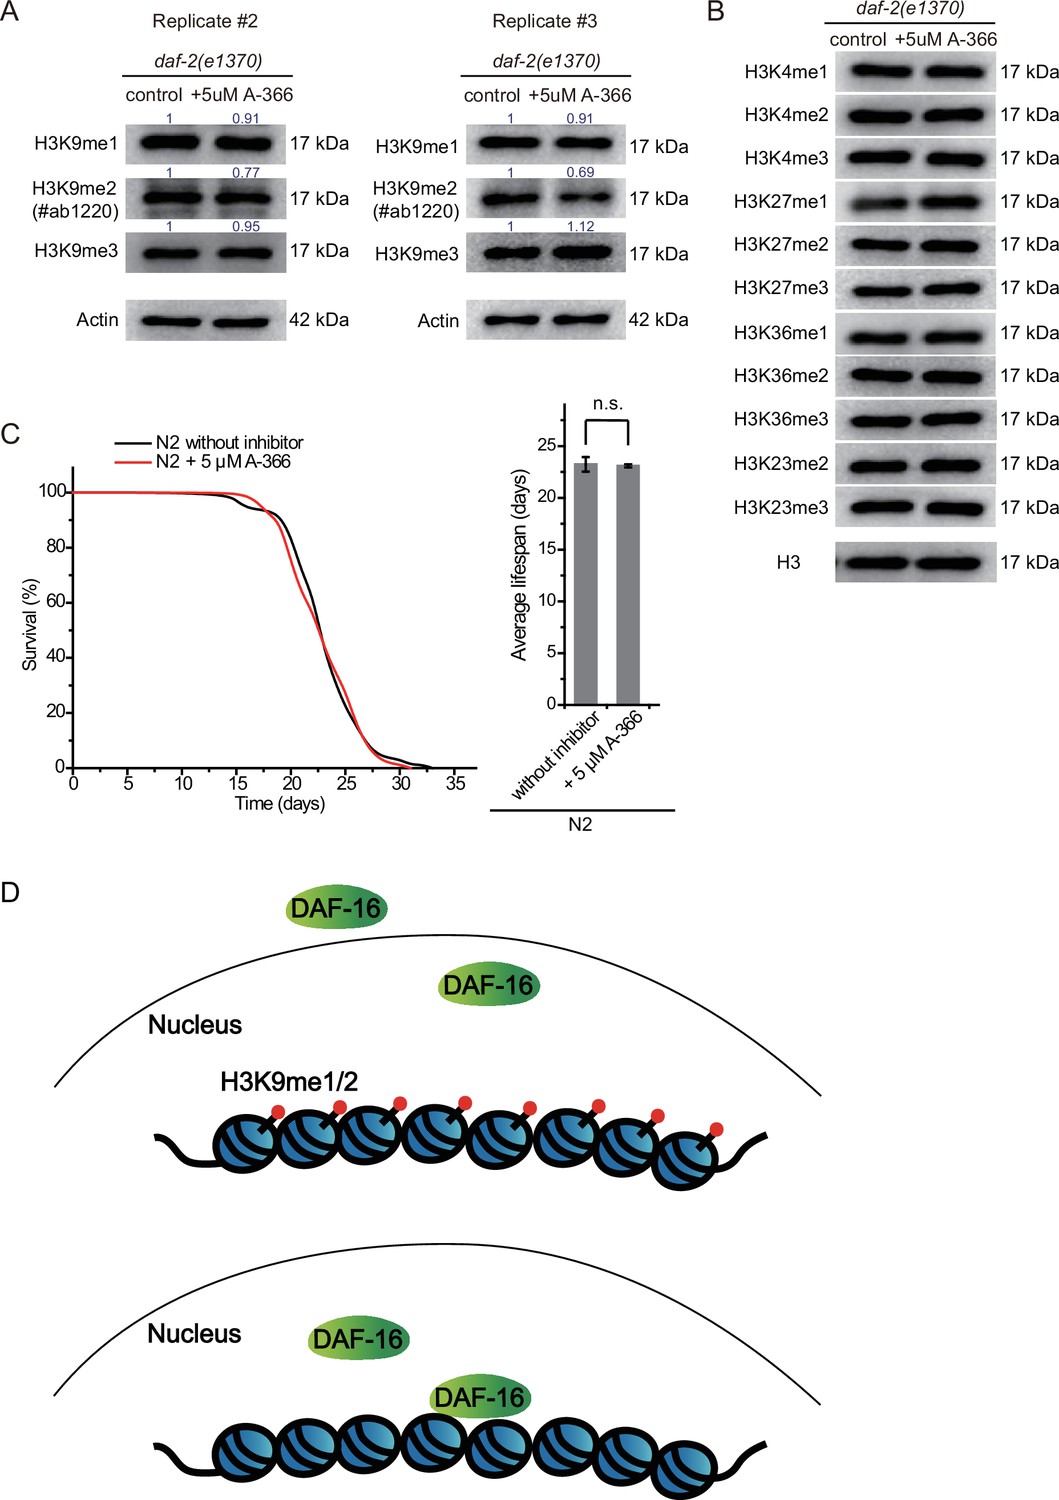
A-366 treatment reduced H3K9me2 levels in daf-2 animals.
(A and B) Western blotting of L4 animals with the indicated antibodies. Numbers in the picture indicate the density of bands measured by ImageJ. (C) (Left) Survival curves of indicated animals. (Right) Histogram displaying the average lifespan of the indicated animals. Mean ± s.e.m. of two independent experiments. Asterisks indicate significant differences using two-tailed t tests. n.s., not significant, p>0.05. Lifespan data were summarized in Supplementary file 1. (D) A working model of H3K9me1/2 marks regulating lifespan in daf-2 animals of Caenorhabditis elegans via modulating the association of DAF-16 to targeted genes. The loss of H3K9me1/2 increases the nuclear accumulation of DAF-16 and promotes the expression of Class I DAF-16 genes in daf-2 animals.
Additional files
-
Supplementary file 1
Statistical analyses of lifespan experiments.
- https://cdn.elifesciences.org/articles/74812/elife-74812-supp1-v2.xlsx
-
Supplementary file 2
List of strains used in this study.
- https://cdn.elifesciences.org/articles/74812/elife-74812-supp2-v2.docx
-
Supplementary file 3
sgRNA sequences for CRISPR/Cas9-directed gene editing technology.
- https://cdn.elifesciences.org/articles/74812/elife-74812-supp3-v2.docx
-
Supplementary file 4
List of primers used in mRNA qPCR.
- https://cdn.elifesciences.org/articles/74812/elife-74812-supp4-v2.docx
-
Supplementary file 5
List of primers used in chromatin immunoprecipitation (ChIP)-qPCR.
- https://cdn.elifesciences.org/articles/74812/elife-74812-supp5-v2.docx
-
Supplementary file 6
Published chromatin immunoprecipitation sequencing (ChIP-seq) datasets used in the study.
- https://cdn.elifesciences.org/articles/74812/elife-74812-supp6-v2.docx
-
Transparent reporting form
- https://cdn.elifesciences.org/articles/74812/elife-74812-transrepform1-v2.docx
-
Source code 1
Code used to convert BAM files to BigWig format in ChIP-seq data analysis.
- https://cdn.elifesciences.org/articles/74812/elife-74812-code1-v2.zip
Download links
A two-part list of links to download the article, or parts of the article, in various formats.
Downloads (link to download the article as PDF)
Open citations (links to open the citations from this article in various online reference manager services)
Cite this article (links to download the citations from this article in formats compatible with various reference manager tools)
H3K9me1/2 methylation limits the lifespan of daf-2 mutants in C. elegans
eLife 11:e74812.
https://doi.org/10.7554/eLife.74812


