Dopaminergic challenge dissociates learning from primary versus secondary sources of information
- Centre for Human Brain Health, School of Psychology, University of Birmingham, United Kingdom
Figures
Figure 1
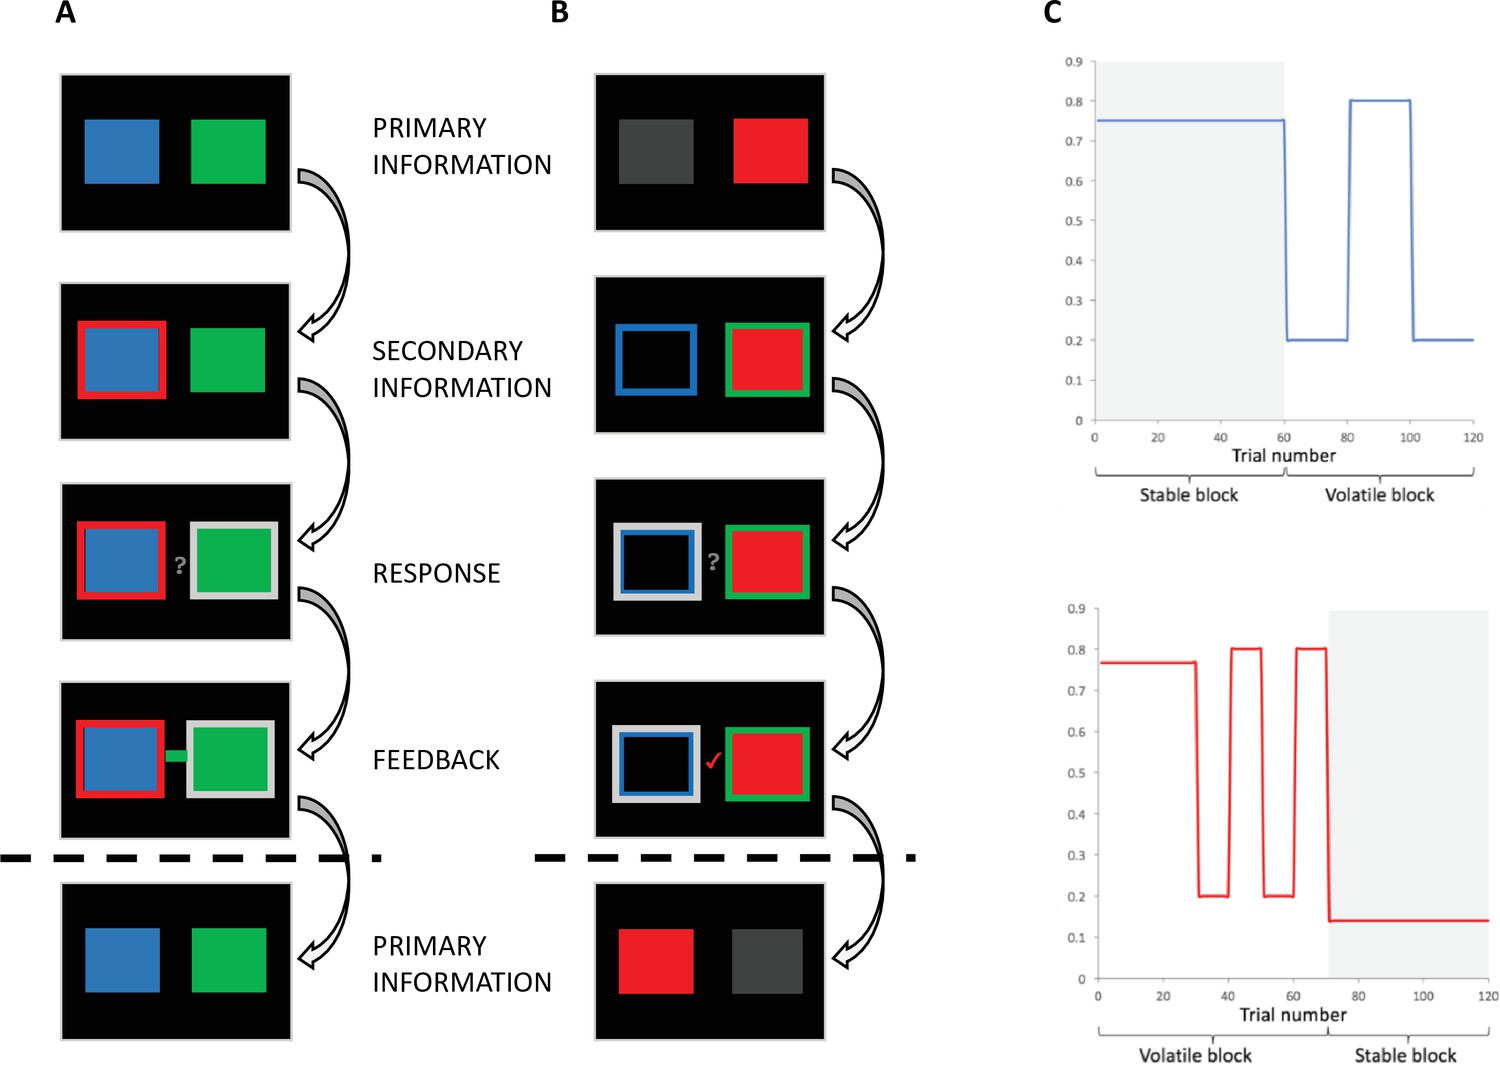
Behavioural task.
(A) Individual-primary group. Participants selected between a blue and a green box to gain points. On each trial, the blue and green boxes were presented first. After 1-4 seconds (s), one of the boxes was highlighted with a red frame, representing the social information. After 0.5–2s, a question mark appeared, indicating that participants were able to make their response. Response was indicated by a silver frame surrounding their choice. After a 1-3s interval, participants received feedback in the form of a green or blue box in the middle of the screen. (B) Social-primary group. Participants selected between going with, or against a red box, which represented the social information. On each trial, the red box was displayed. After 1-4s, blue and green frames appeared. After 0.5–2s, a question mark appeared, indicating that participants were able to make their response. Response was indicated by a silver frame surrounding their choice. After a 1-3s interval, participants received feedback in the form of a tick or a cross. This feedback informed participants if going with the group was correct or incorrect, from this feedback participants could infer whether the blue or green frame was correct. (C) Example of pseudo-randomised probabilistic schedule. The probability of reward varied according to probabilistic schedules, including stable and volatile blocks for both the probability of the blue box/frame being correct (top) and the probability of the red (social) box/frame being correct (bottom).
Figure 2
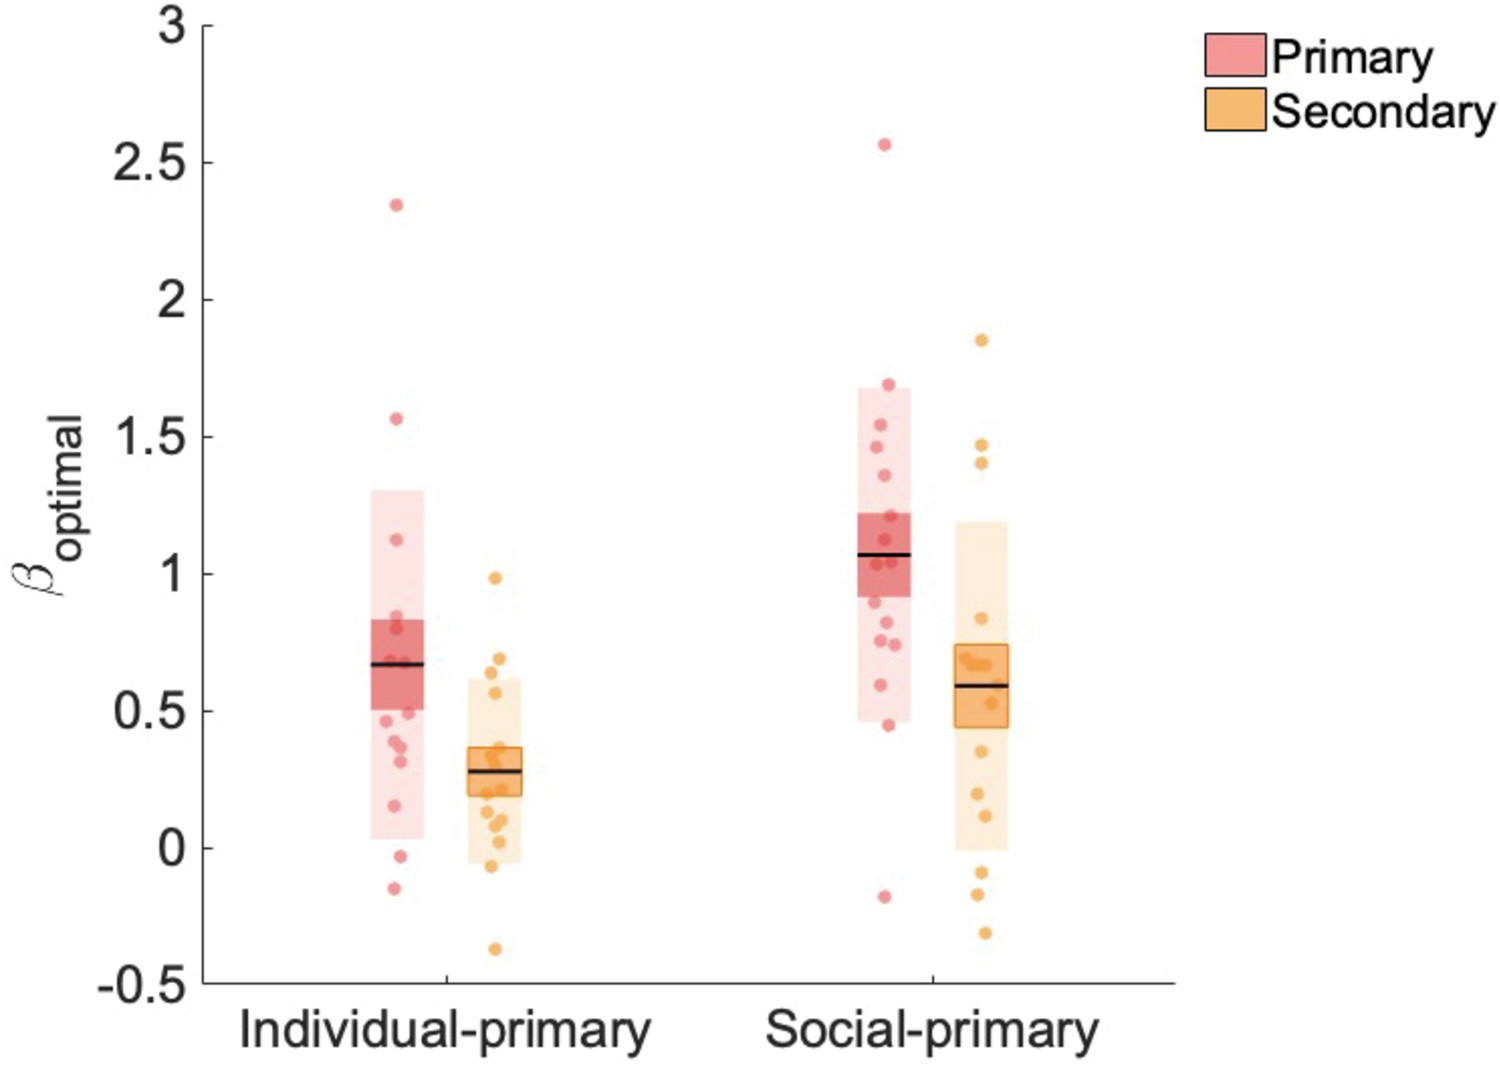
Beta weights (β_optimal) for primary and secondary information.
βoptimal values were significantly higher for the primary, compared to secondary, information source and for the social-primary, compared with the individual-primary, group. Data points indicate estimated weights for individual participants (n = 31, placebo data only), bold point indicates the mean, and bold line indicates standard error of the mean (1 SEM).
Figure 3
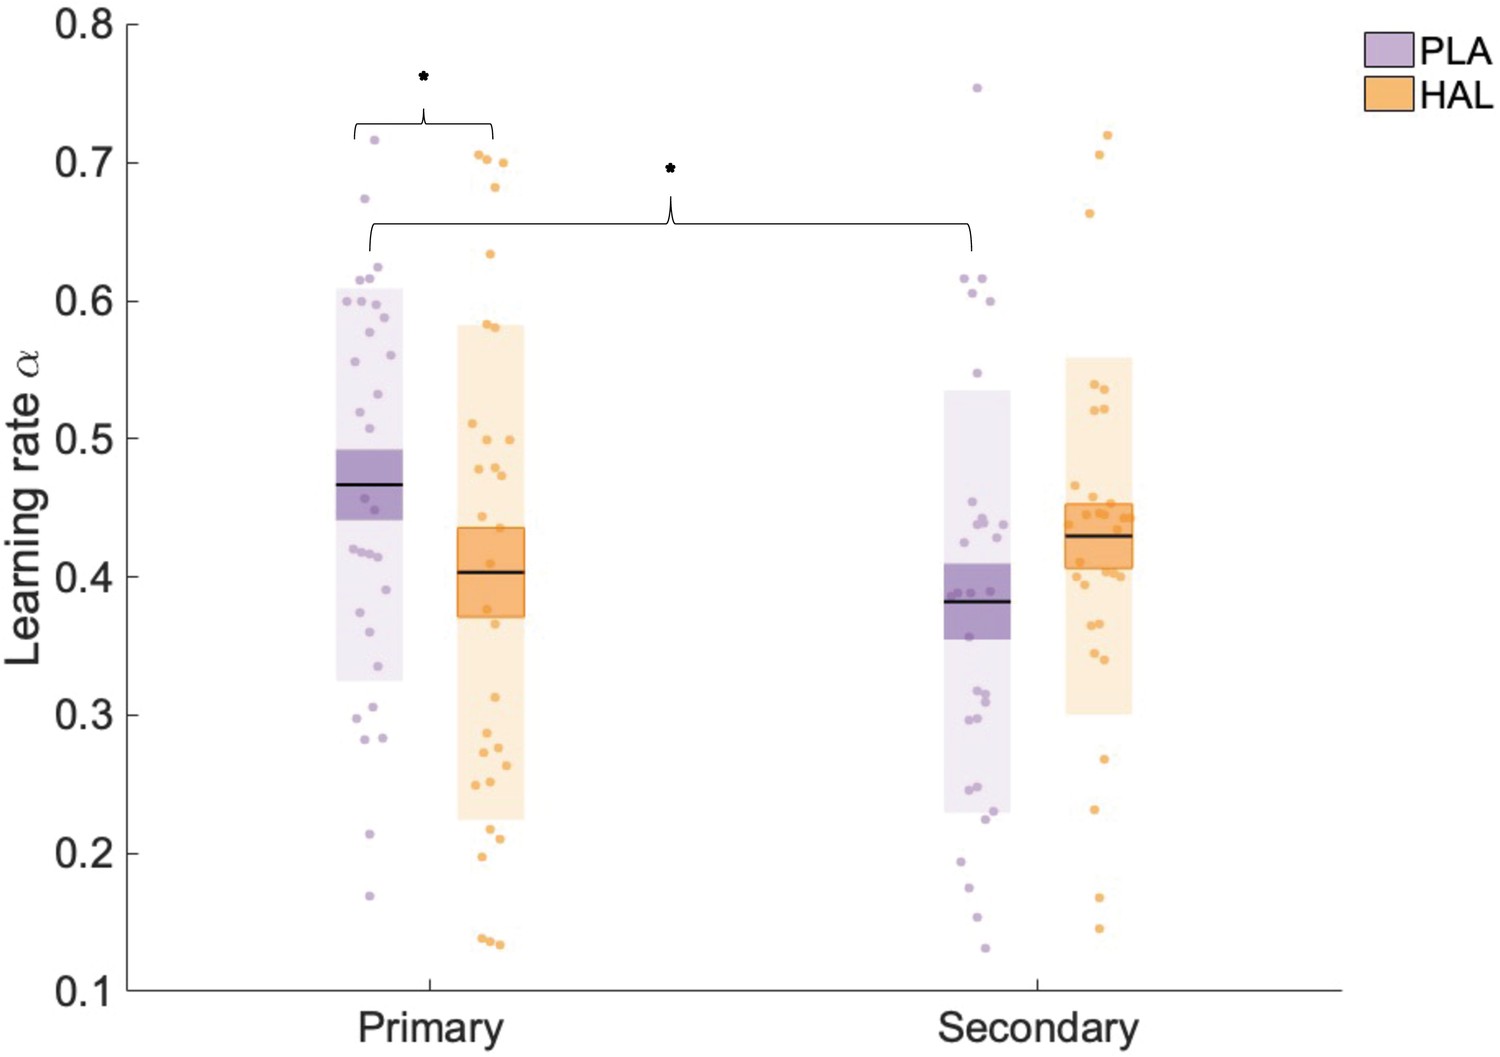
Learning rate (α) estimates for learning from primary and secondary information across all trials (averaged across volatile and stable phases).
There was a significant interaction between information and drug, with α estimates significantly lower under haloperidol (HAL; orange), relative to placebo (PLA; purple), for primary information only. Data points indicate square-root transformed α estimates for individual participants (n = 31). Boxes: standard error of the mean; shaded region: standard deviation. * indicates statistical significance (p<0.05).
Figure 4
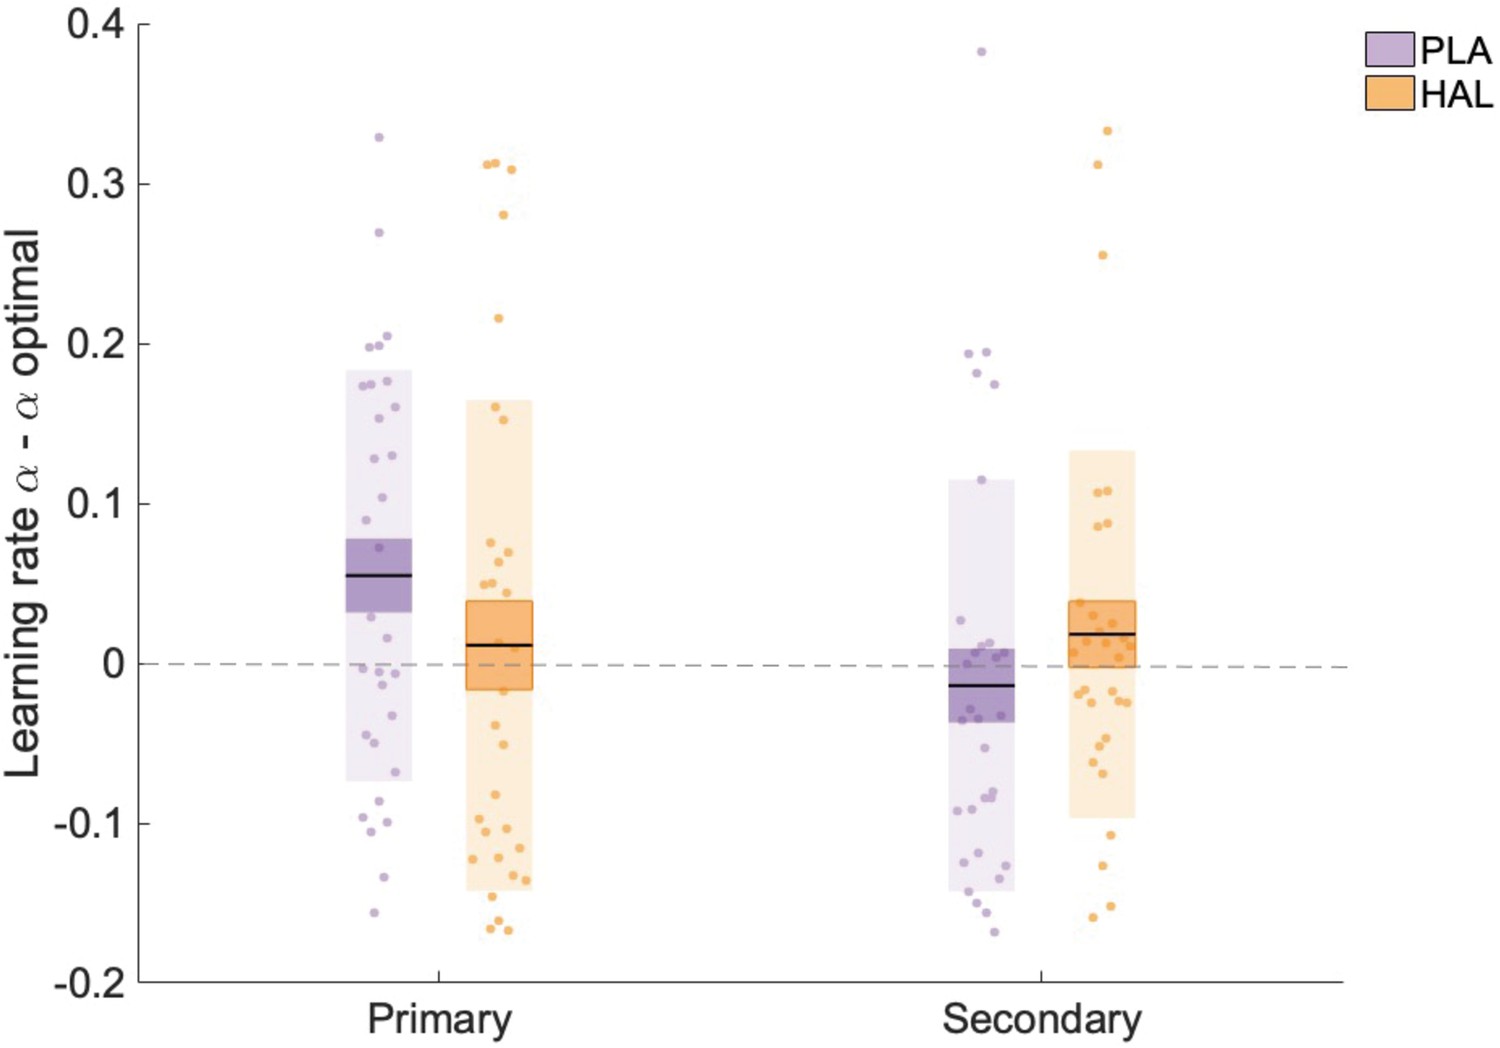
Learning rate estimates minus optimal learning rates.
There was a significant interaction between information and drug, with αprimary scores significantly higher than optimal estimates under placebo (PLA) but not under haloperidol (HAL). Data points indicate optimal values for individual participants (n = 31) across all trials (averaged across volatile and stable phases), Boxes: standard error of the mean; shaded region: standard deviation.
Appendix 2—figure 1
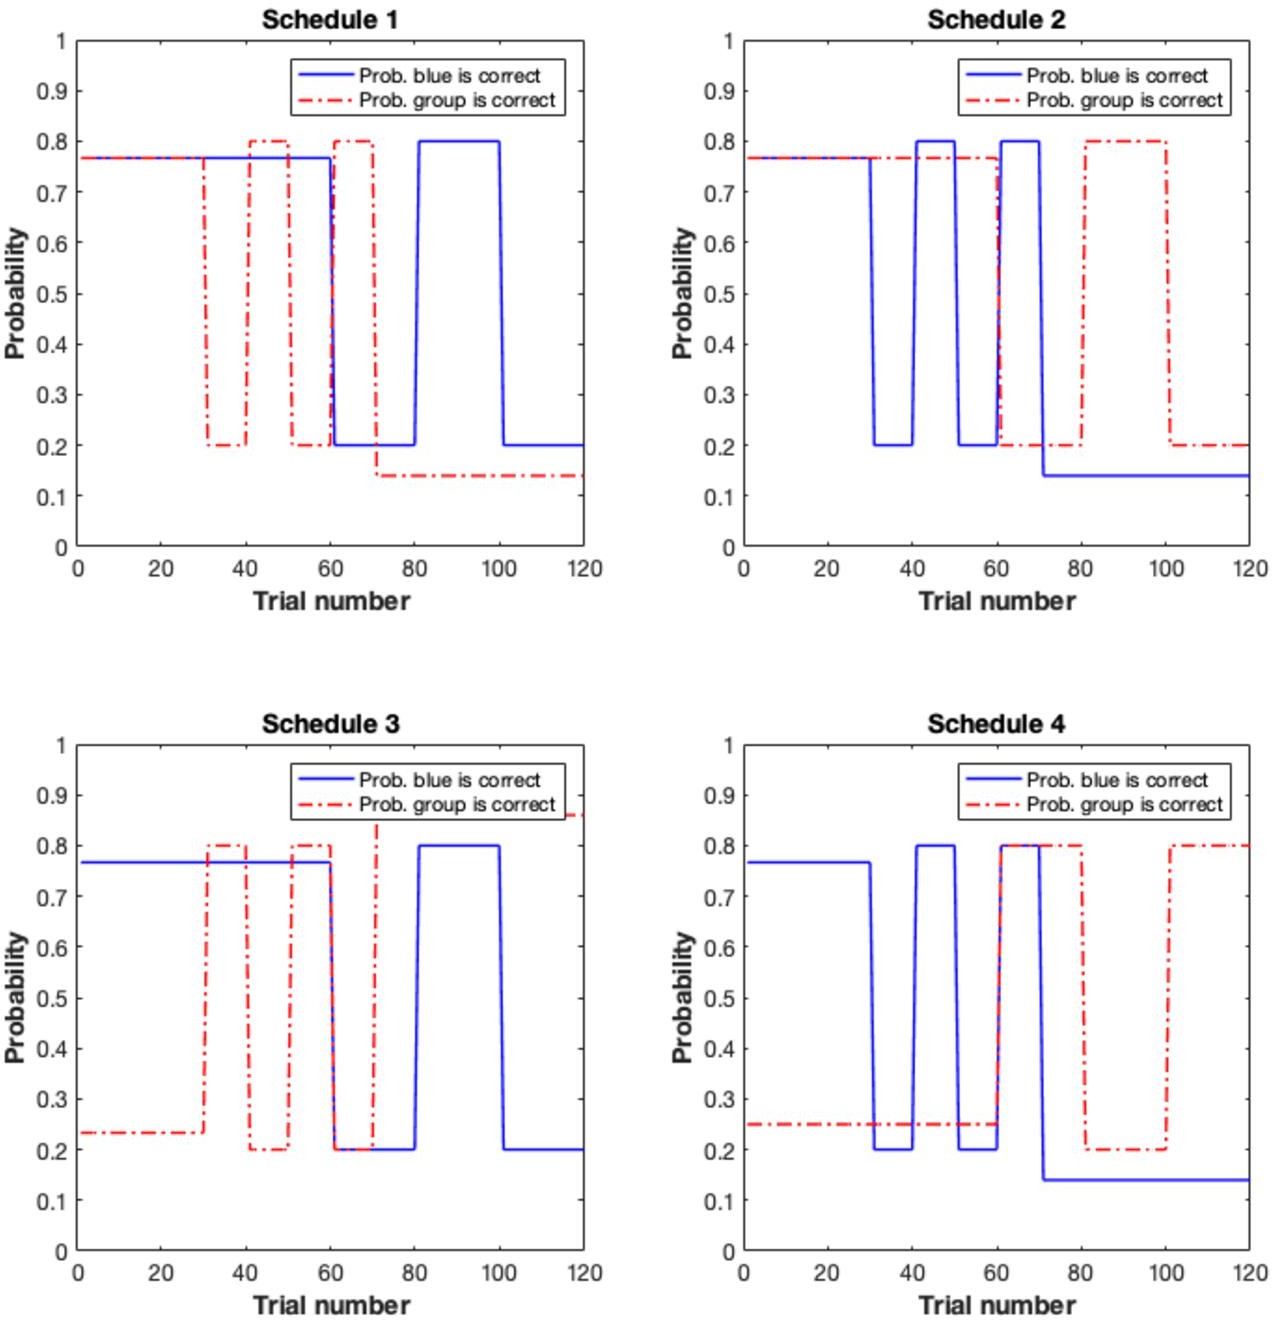
Randomisation schedules.
The probability of reward varied according to probabilistic schedules, including stable and volatile blocks for both the probability of blue being correct and the probability of the social information indicating the correct answer. Probability schedules were counterbalanced between participants. Solid blue lines show the probability of blue being the correct choice, and dashed red lines show the probability of the social information being correct. Schedules 1–4 are displayed here.
Appendix 3—figure 1
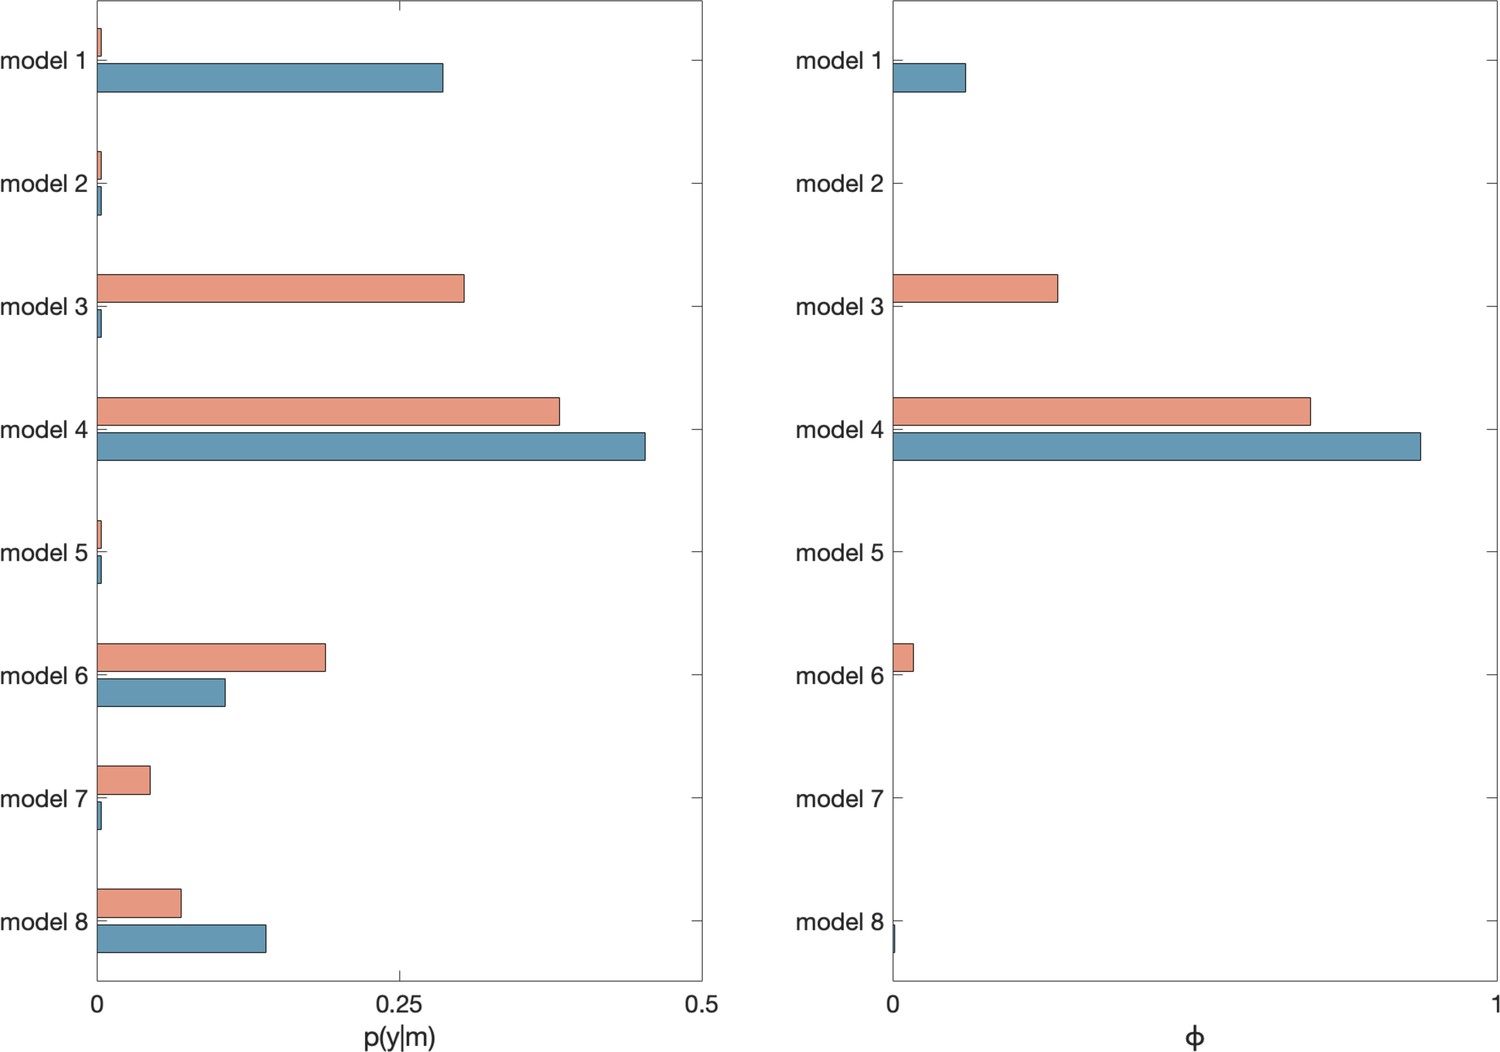
Model comparison.
Results from random effects Bayesian model selection. Exceedance probability and posterior model probability for models 1–8. p(y|m): posterior model probability; ϕ: exceedance probability; haloperidol (HAL): blue; placebo (PLA): red.
Appendix 3—figure 2
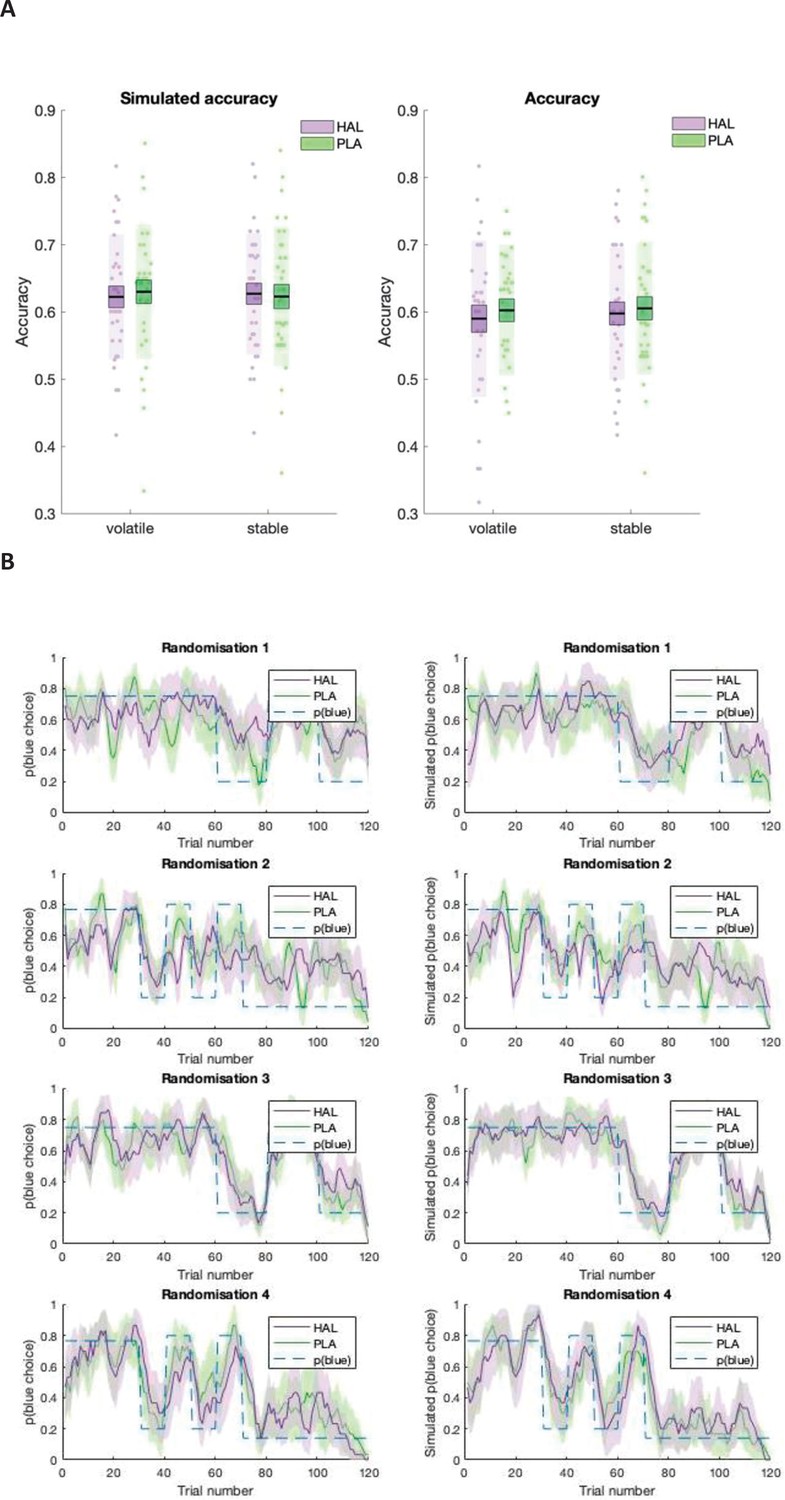
Model validation.
(A) Model simulations (left) and participant response data (right). Mean accuracy is displayed separately for volatile and stable environmental phases, under haloperidol (HAL; purple) and placebo (PLA; green). Boxes: standard error of the mean; shaded region: standard deviation; individual datapoints are displayed. (B) Participant data (left) juxtaposed against model simulations (right). Running average, across five trials of blue choices for probabilistic randomisation schedules 1–4. Shaded region: standard error of the mean.
Tables
Table 1
Participant information.
| Individual-primary group(n = 15)Mean (SD) | Social-primary group(n = 16)Mean (SD) | t (1,29) | X2 (1, N = 31) | p-Value | |
|---|---|---|---|---|---|
| Gender (n males: n females) | 7:8 | 8:8 | 0.034 | 0.853 | |
| Age | 25.600 (5.448) | 25.625 (4.745) | 0.014 | 0.989 | |
| VWM | 80.333 (6.016) | 76.354 (7.823) | 1.580 | 0.125 | |
| BMI | 24.016 (2.807) | 22.625 (2.606) | 1.431 | 0.114 |
-
Age, gender, BMI, and VWM did not significantly differ between the groups.
-
SD: standard deviation; VWM: verbal working memory span; BMI: body mass index.
Table 2
Untransformed estimated learning rates.
| αprimary_volatile | αprimary_stable | αsecondary_volatile | αsecondary_stable | ||
|---|---|---|---|---|---|
| PLA | 0.184 (0.018) | 0.290 (0.041) | 0.187 (0.028) | 0.151 (0.025) | |
| Range | 0.024–0.477 | 0.027–0.721 | 0.011–0.591 | 0.004–0.612 | |
| HAL | 0.169 (0.029) | 0.218 (0.033) | 0.200 (0.023) | 0.202 (0.026) | |
| Range | 0.010–0.578 | 0.013–0.699 | 0.014–0.481 | 0.011–0.584 |
-
: mean (standard error of the mean); PLA: placebo; HAL: haloperidol.
Appendix 1—table 1
Self-report questionnaire scores (n = 31).
| Self-report questionnaires | Individual-primary group | Social-primary group | t (29) | p-Value | |
|---|---|---|---|---|---|
| AQ | 9.412 (4.556) | 6.500 (4.179) | 1.910 | 0.065 | |
| TAS-20 | 39.529 (6.947) | 40.313 (7.981) | –0.301 | 0.765 | |
| BIS-BAS | 50.647 (6.855) | 51.125 (5.536) | –0.219 | 0.828 | |
| DASS-Stress | 3.176 (4.231) | 3.875 (2.306) | –0.583 | 0.723 | |
| DASS-Anxiety | 1.353 (2.178) | 1.938 (2.516) | –0.715 | 0.564 | |
| DASS-Depression | 1.706 (1.863) | 2.313 (3.005) | –0.702 | 0.480 | |
| IRI | 66.235 (15.114) | 66.375 (10.645) | –0.031 | 0.976 | |
| BDI | 3.176 (3.746) | 3.438 (2.732) | –0.227 | 0.822 | |
| BPQ | 52.176 (29.473) | 46.688 (18.650) | 0.635 | 0.221 |
-
Mean (standard deviation) scores are reported. Significance level for the between-group differences are reported. Autism Spectrum quotient (AQ) (Baron-Cohen et al., 2001), Toronto Alexithymia Scale (TAS 20) (Bagby et al., 1994), Behavioural Inhibition/Activation Scale (BIS-BAS) (Carver and White, 1994), the Depression Anxiety and Stress Scale (DASS 21) (Lovibond and Lovibond, 1995), Interpersonal Reactivity Index (IRI) (Davis, 1983), Beck’s Depression Inventory (BDI) (Beck et al., 1996), and Body Perception Questionnaire (BPQ) (Porges, 1993).
Appendix 4—table 1
Coefficients from regression model with haloperidol (HAL) accuracy as the dependent variable.
| β | β (SEM) | Standardised β | t | p-Value | |
|---|---|---|---|---|---|
| Constant | 0.431 | 0.089 | 4.840 | <0.001 | |
| αprimary | 0.195 | 0.077 | 0.431 | 2.532 | 0.018* |
| αsecondary | 0.076 | 0.119 | 0.127 | 0.642 | 0.527 |
| 0.121 | 0.090 | 0.230 | 1.342 | 0.192 | |
| 0.033 | 0.131 | 0.050 | 0.249 | 0.806 | |
| β | 0.002 | 0.001 | 0.329 | 1.698 | 0.102 |
| ζ | 0.045 | 0.043 | 0.189 | 1.066 | 0.297 |
-
* indicates statistical significance.
Additional files
Download links
A two-part list of links to download the article, or parts of the article, in various formats.
Downloads (link to download the article as PDF)
Open citations (links to open the citations from this article in various online reference manager services)
Cite this article (links to download the citations from this article in formats compatible with various reference manager tools)
Dopaminergic challenge dissociates learning from primary versus secondary sources of information
eLife 11:e74893.
https://doi.org/10.7554/eLife.74893


