Distinct elongation stalls during translation are linked with distinct pathways for mRNA degradation
- Department of Molecular Biology and Genetics, Howard Hughes Medical Institute, Johns Hopkins University School of Medicine, United States
- Department of Biochemistry and Donnelly Centre, University of Toronto, Canada
Figures
Figure 1 with 1 supplement
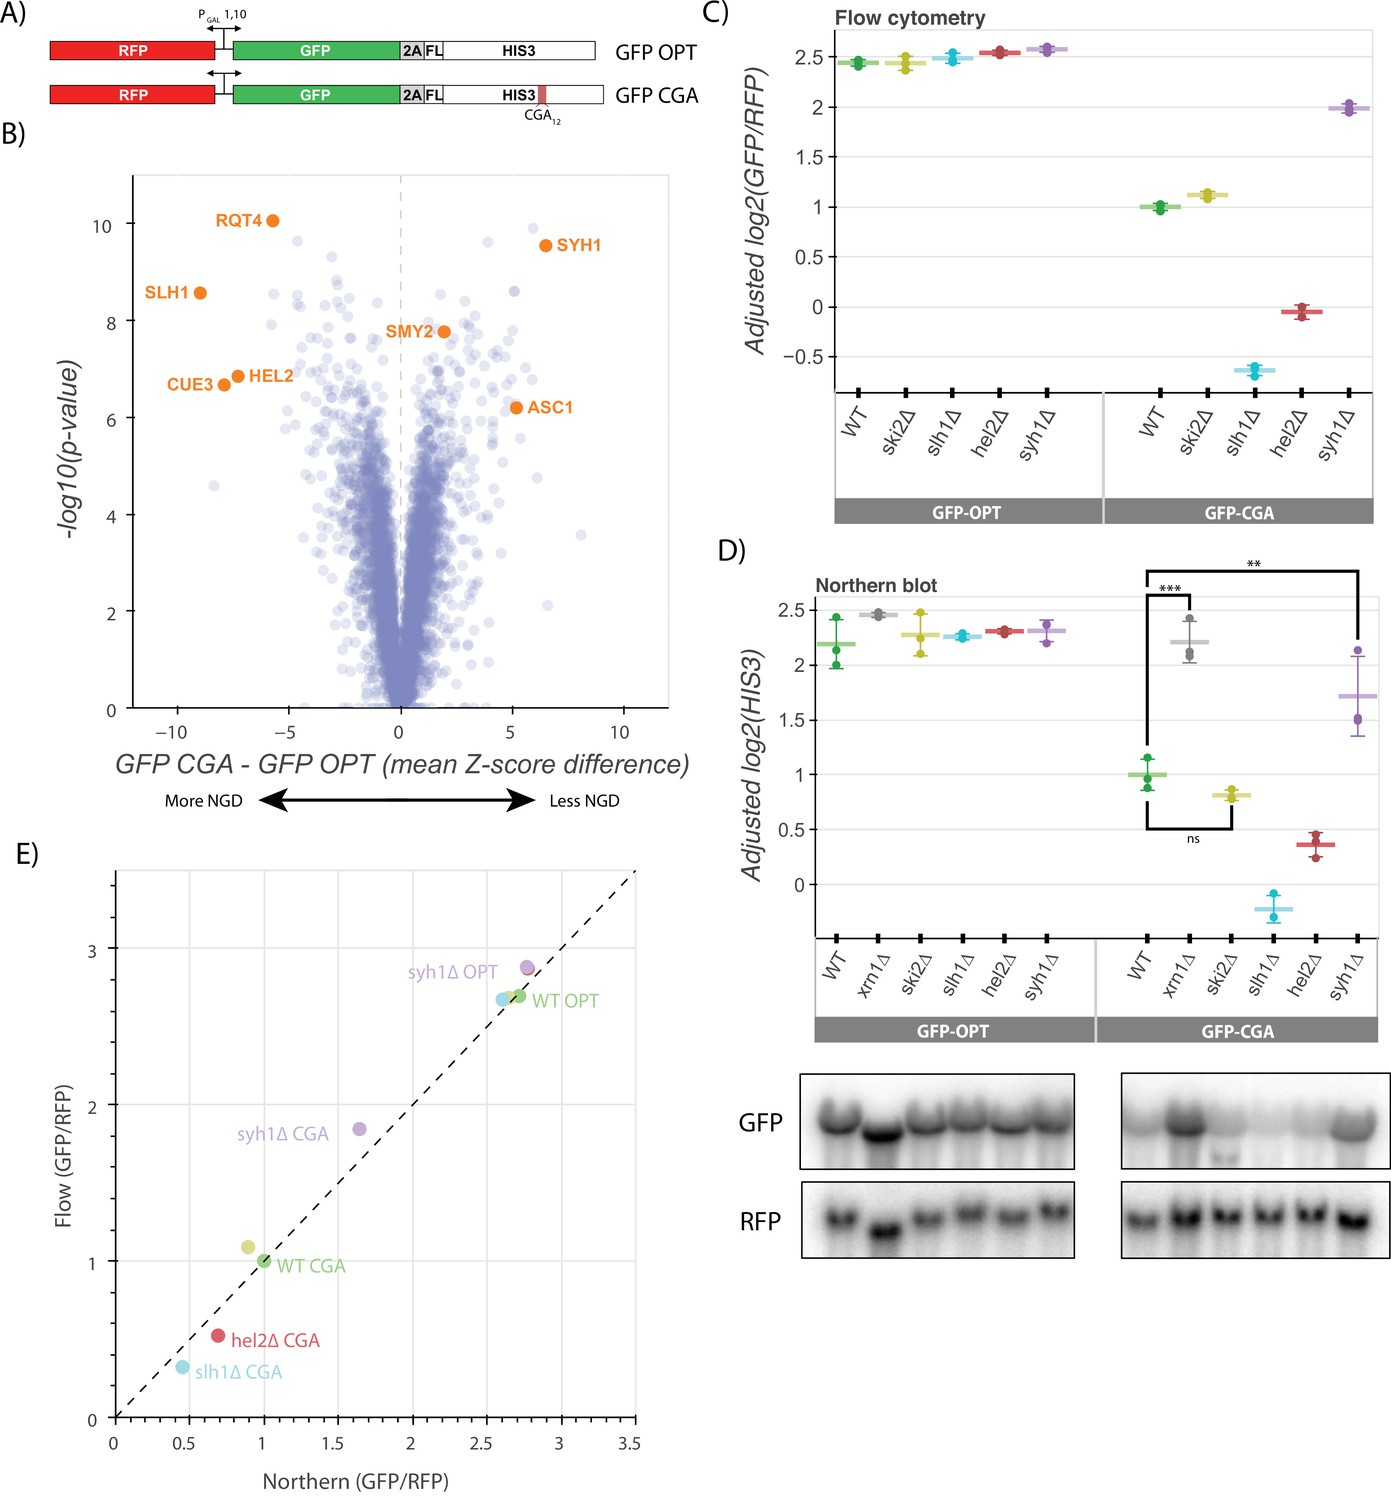
A genetic screen reveals factors that alter levels of an NGD reporter.
(A) Diagrams of GFP-OPT and GFP-CGA reporters. Reporters are expressed from a bidirectional GAL promoter. GFP is separated from the HIS3 ORF by a P2A ‘StopGo’ sequence. The GFP-CGA reporter contains an insert of twelve CGA codons as a stalling sequence. (B) Volcano plot of data from the R-SGA screen. p-Values were calculated from a Fisher’s t-test based on per plate GFP/RFP Z-score differences between the GFP-CGA and GFP-OPT screens. Positive Z-score differences indicate an increase of the GFP-CGA reporter relative to the GFP-OPT reporter and vice versa. Selected genes are labeled. (C) Flow cytometry analysis of GFP-OPT and GFP-CGA protein fluorescence reporter levels normalized to RFP fluorescence in several genetic backgrounds. All log2(GFP/RFP) levels are adjusted by normalizing to the mean of WT CGA and three replicates are plotted for each strain. Error bars indicate standard deviation. (D) Northern blot analysis of GFP-OPT and GFP-CGA GFP mRNA reporter levels quantified by probe hybridization and autoradiography. Three replicates are plotted for each background. All GFP values were fit to a linear mixed model to adjust plotted values for batch and loading effects and levels were normalized to the mean level of WT CGA. Tukey’s honest significant difference test was performed and selected significance indicators are shown. *** indicates p-value <0.001, ** indicates p-vaue <0.01, ns indicates p-value >0.05. Error bars indicate standard deviation. Representative images of the northern blots for one replicate set are shown. (E) The unadjusted reporter levels from the experiments in panels C and D were normalized to RFP and further normalized to the mean WT CGA levels to allow comparison between flow cytometry and northern blot results.
-
Figure 1—source data 1
Raw and labeled northern blot source images for Figure 1D.
- https://cdn.elifesciences.org/articles/76038/elife-76038-fig1-data1-v2.zip
-
Figure 1—source data 2
Raw and labeled northern blot source images for Figure 1C.
- https://cdn.elifesciences.org/articles/76038/elife-76038-fig1-data2-v2.zip
Figure 1—figure supplement 1
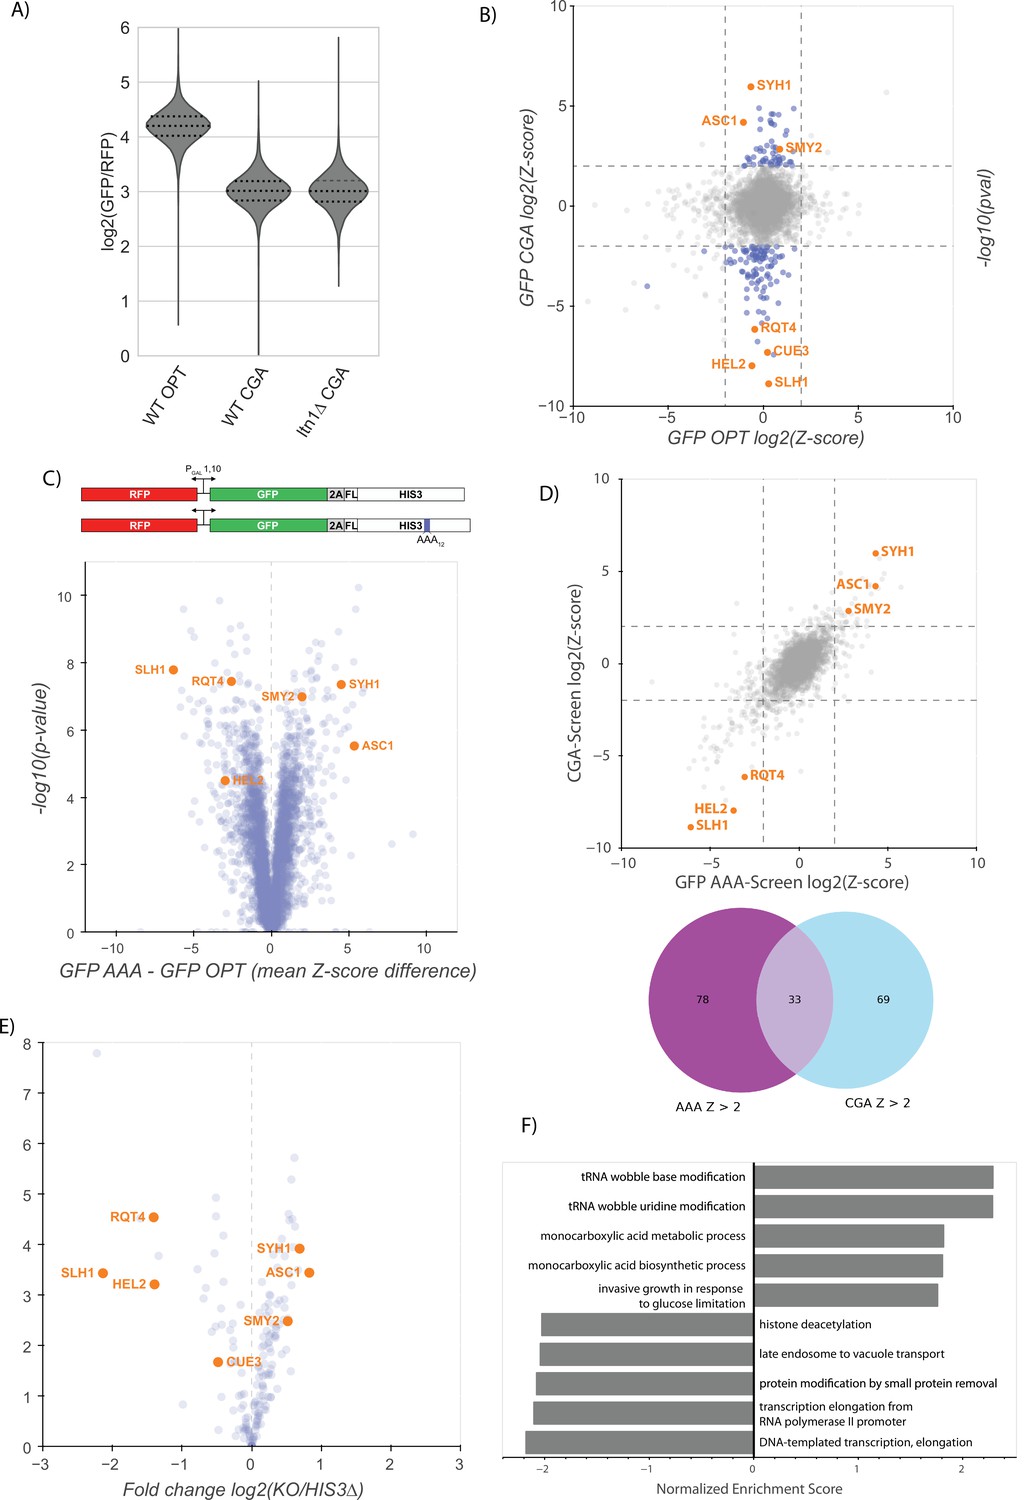
Analysis of R-SGA screens and reporters.
(A) Flow cytometry analysis of GFP-OPT and GFP-CGA GFP protein fluorescence reporter levels normalized to RFP fluorescence in WT and ltn1∆ strains. Distributions represent log2(GFP/RFP) ratios of individual cells. (B) Normalized Z-scores based on data from Figure 1B plotted as per-plate z-scores for each gene in the GFP-OPT and GFP-CGA screens. Genes colored blue (–2>GFP CGA Z-score >2 and –2<GFP OPT Z-score <2) were selected for follow-up validation. Several known NGD factors are highlighted. (C) Gene diagrams comparing the GFP-OPT and GFP-AAA reporters. Similar to the GFP-CGA reporter, a stretch of twelve AAA codons were inserted into the HIS3 ORF. Screening data comparing the GFP-OPT and GFP-AAA screens are plotted as in Figure 1B. Several known NGD factors are highlighted. (D) Normalized Z-scores based on data from Figure 1—figure supplement 1C from the GFP-AAA and GFP-CGA screens plotted against each other as in B to emphasize similarity between data from these screens. A Venn diagram shows the overlap between the genes with a Z-score greater than 2 in the GFP-CGA and GFP-AAA screens. Full table of overlaps is available in Supplementary file 1. (E) Volcano plot of flow cytometry screen validation with reporters freshly reinserted into knockout collection strains. Fold changes were calculated relative to WT his3∆ knockout lines and p-values were obtained from a Fisher’s t-test. Several genes are highlighted. (F) Ranked gene-set enrichment analysis for GO terms was performed. Top enriched GO terms from the GO Biological Process annotations were plotted. Positive enrichment scores indicate enrichment among GFP-CGA screen hits with positive Z-scores (i.e. knockouts causing increased GFP-CGA reporter levels) and vice versa for negative enrichment scores.
-
Figure 1—figure supplement 1—source data 1
Flow cytometry source data for Figure 1—figure supplement 1A.
- https://cdn.elifesciences.org/articles/76038/elife-76038-fig1-figsupp1-data1-v2.zip
Figure 2 with 1 supplement
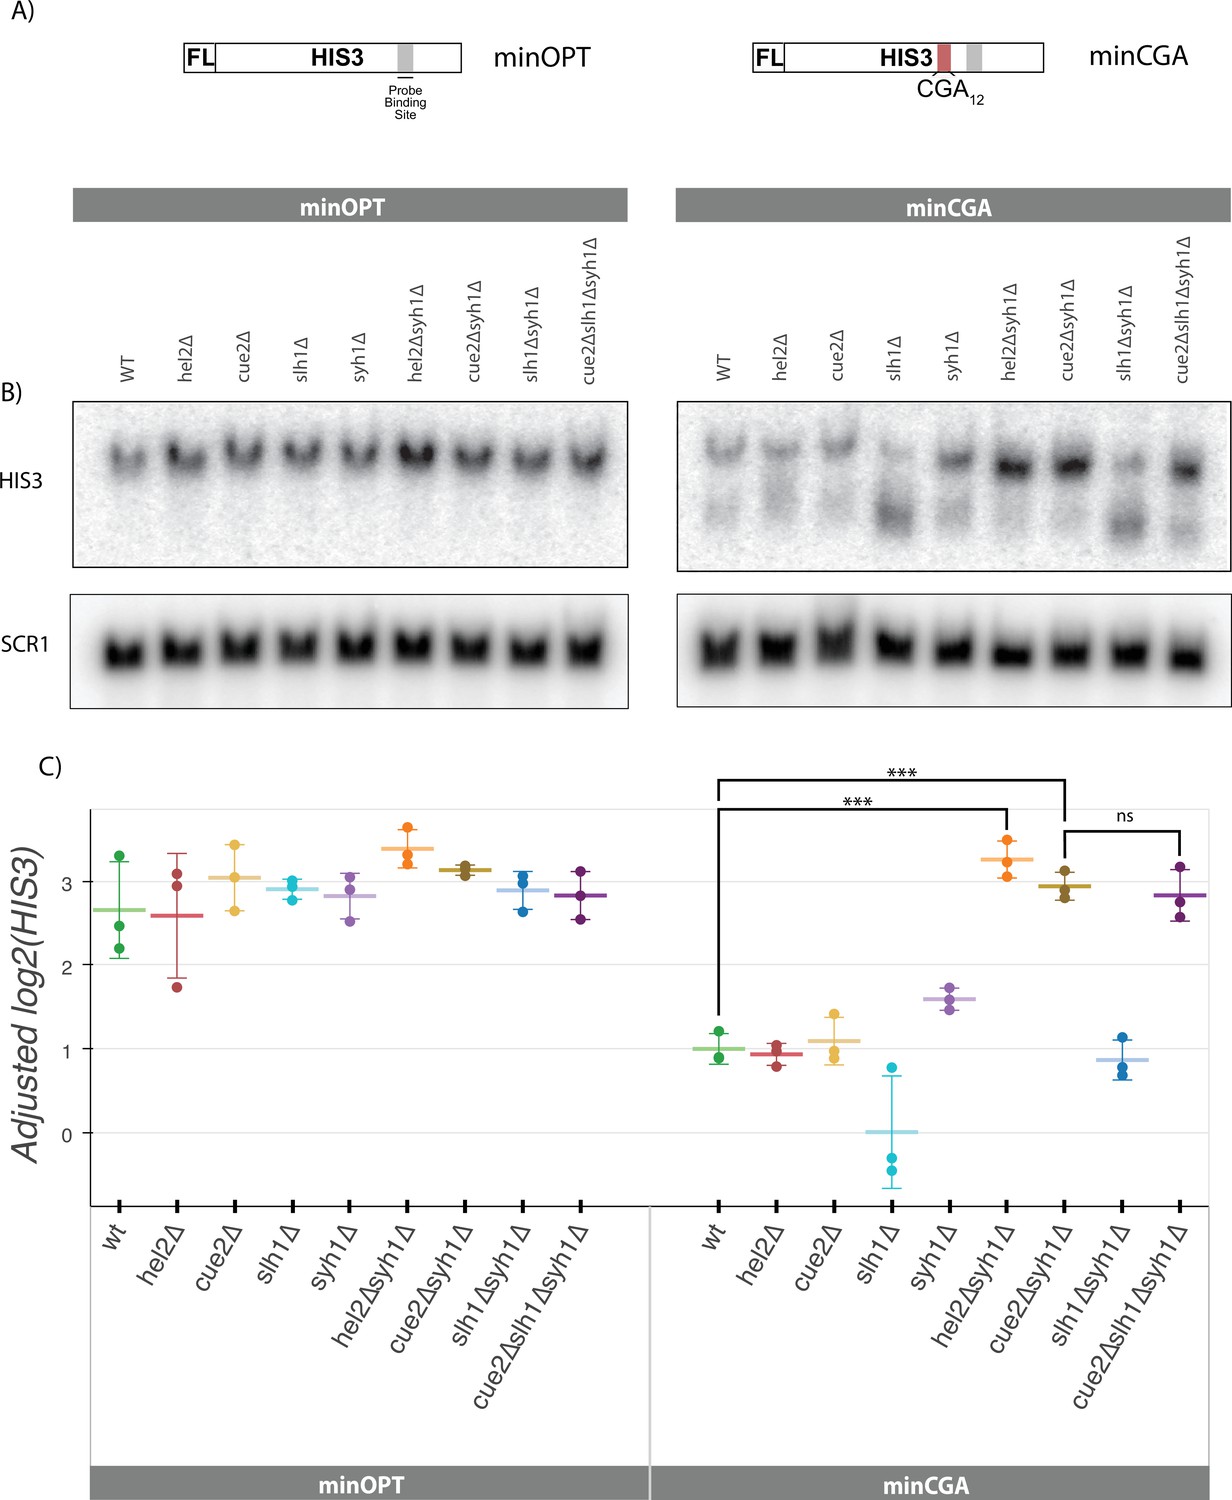
Syh1 is a critical mRNA decay factor for an NGD reporter.
(A) Diagrams of minOPT and minCGA reporters. Reporters are expressed from a GAL promoter and contain only a FLAG tag (FL) and HIS3 ORF. The minOPT reporter contains a fully-optimized ORF, the minCGA reporter contains a CGA12 stalling sequence within the ORF as indicated by red shading. (B) Autoradiograph of northern blot of one representative replicate set of reporter mRNA levels for strains and probes as indicated. (C) Northern blot quantification of minOPT and minCGA HIS3 mRNA reporter levels quantified by probe hybridization and autoradiography in yeast strains containing various NGD factor knockouts. Three replicates are plotted. All HIS3 values were fit to a linear mixed model to adjust plotted values for batch and loading effects and levels were normalized to the mean level of WT minCGA. Tukey’s honest significant difference test was performed and selected significance indicators are shown. *** indicates p-value <0.001, ns indicates p-value >0.05. Error bars indicate standard deviation.
-
Figure 2—source data 1
Raw and labeled northern blot source images and flow cytometry data for Figure 2—figure supplement 1.
- https://cdn.elifesciences.org/articles/76038/elife-76038-fig2-data1-v2.zip
-
Figure 2—source data 2
Raw and labeled northern blot source images for Figure 2B,C and Figure 2—figure supplement 1A.
- https://cdn.elifesciences.org/articles/76038/elife-76038-fig2-data2-v2.zip
Figure 2—figure supplement 1

Analysis of factors affecting NGD.
(A) Quantifications of the 3’ fragment of the minCGA reporter measured by autoradiographic northern blot as in Figure 2C. Means from three biological replicates are plotted. Plotted data were adjusted for batch and loading effects using the fitted model from Figure 2C and levels are normalized to the mean level of WT minCGA. (B) Northern blot quantification of minOPT and minCGA HIS3 mRNA reporter levels quantified by probe hybridization and autoradiography in yeast strains containing various NGD factor knockouts. Three replicates are plotted. All HIS3 values were fit to a linear mixed model to adjust plotted data for batch and loading effects and levels are normalized to the mean level of WT minCGA. Tukey’s honest significant difference test was performed and selected significance indicators are shown. *** indicates p-value <0.001, ns indicates p-value >0.05. Error bars indicate standard deviation. (C) Quantifications of the full-length GFP-CGA reporter normalized to RFP mRNA levels measured by autoradiographic northern blot as in Figure 1D. Error bars indicate standard deviation. (D) Affinity purification-mass spectrometry of Syh1-TAP and Smy2-TAP. LFQ values were calculated using MaxQuant software. Ribosomal (RPS and RPL) proteins are colored orange and blue. (E) Northern blot quantification of minOPT and minCGA HIS3 mRNA reporter levels quantified by probe hybridization and autoradiography in yeast strains containing various NGD factor knockouts. Three replicates are plotted. All HIS3 values were fit to a linear mixed model to adjust plotted data for batch and loading effects and levels are normalized to the mean level of WT HIS3. Tukey’s honest significant difference test was performed and selected significance indicators are shown. ** indicates p-vaue <0.01, ns indicates p-value >0.05. Error bars indicate standard deviation. (F) Flow cytometry analysis in several strains including eap1∆ of GFP-OPT and GFP-CGA protein fluorescence reporter levels normalized to RFP fluorescence. Distributions represent log2(GFP/RFP) ratios of individual cells. (G) Protein multiple sequence alignment produced by structure-aware alignment with T-Coffee Expresso (Notredame et al., 2000). Output diagram was generated by ESPript 3.0 (Robert and Gouet, 2014). The GIGYF1/2 conserved binding motif regions from Weber et al., 2020 are indicated by gray shading.
Figure 3 with 1 supplement
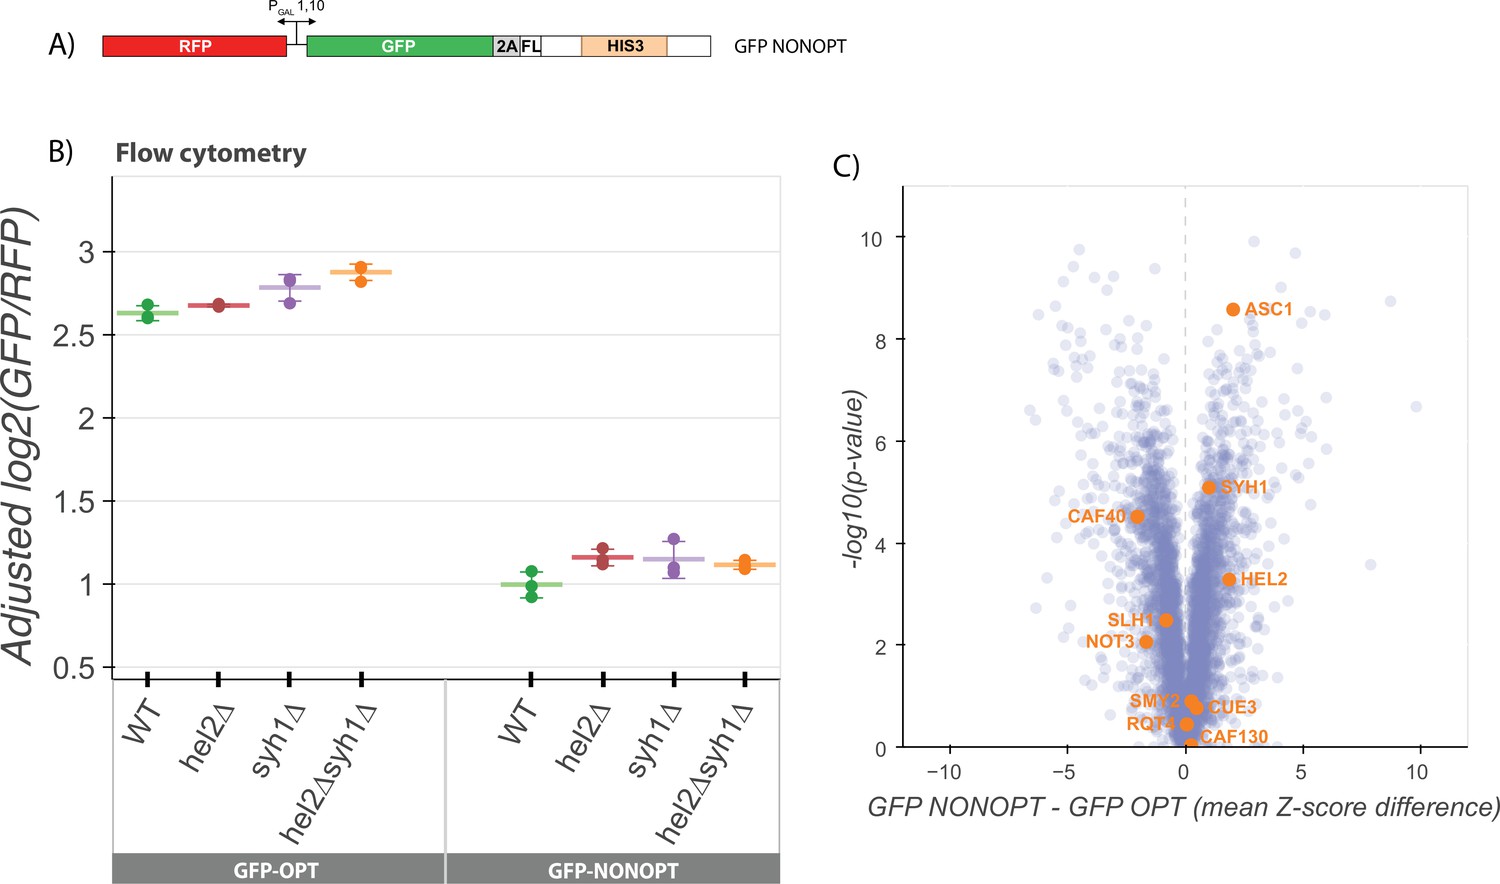
NGD factors do not alter levels of a COMD reporter.
(A) Diagram of the GFP-NONOPT reporter for R-SGA screening and flow cytometry. Reporter is expressed from a bidirectional GAL promoter. GFP is separated from the HIS3 ORF by a P2A ‘StopGo’ sequence followed by a FLAG tag (FL). A portion of the HIS3 ORF is recoded as synonymous codons with low optimality. (B) Flow cytometry analysis of GFP-OPT and GFP-NONOPT GFP protein fluorescence reporter levels normalized to RFP fluorescence in yeast strains containing knockouts of HEL2 and SYH1 individually and in combination. All log2(GFP/RFP) levels are adjusted by normalizing to the mean of WT CGA and three replicates are plotted for each strain. Error bars indicate standard deviation. (C) Volcano plot of the GFP-NONOPT R-SGA screen p-values were calculated from a Fisher’s t-test based on per plate GFP/RFP Z-score differences between the GFP-NONOPT and GFP-OPT screens. Positive Z-score differences indicate an increase of the GFP-NONOPT reporter relative to the GFP-OPT reporter and vice versa. Selected genes are labeled.
-
Figure 3—source data 1
Flow cytometry source data for Figure 3B.
- https://cdn.elifesciences.org/articles/76038/elife-76038-fig3-data1-v2.zip
Figure 3—figure supplement 1
Nonoptimal reporter screen results and comparison with other screens.
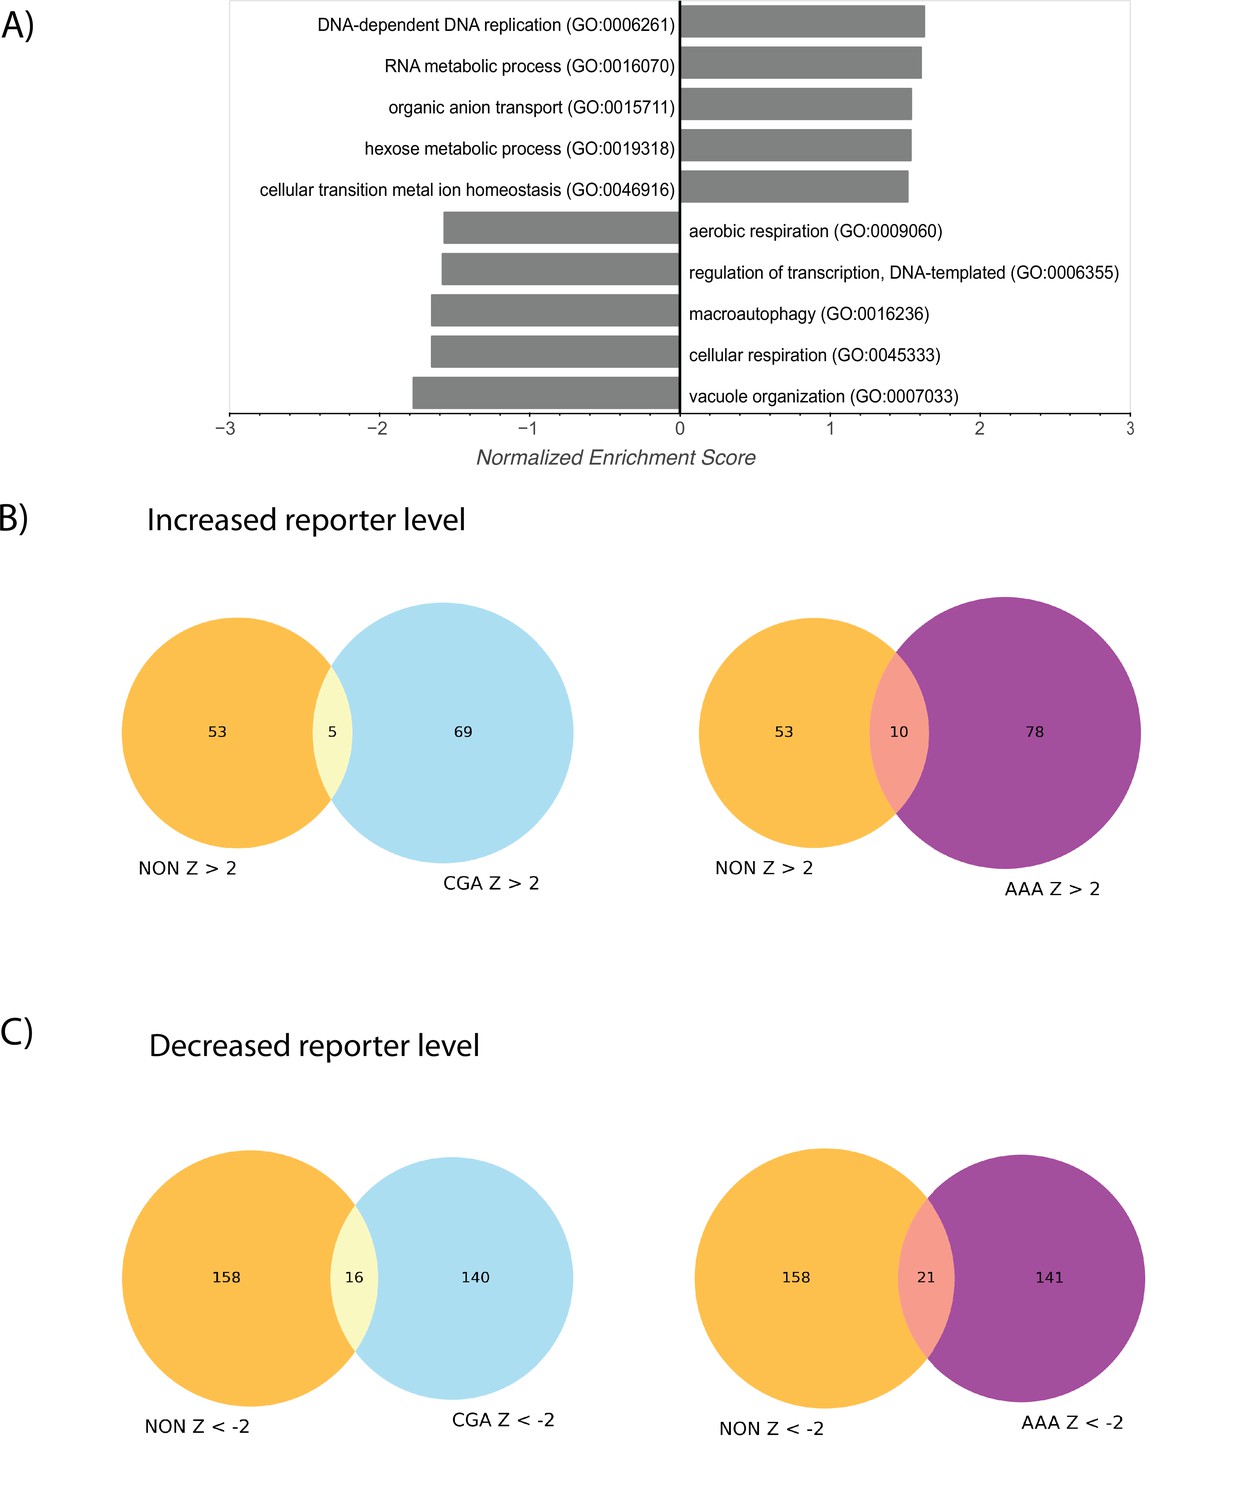
(A) Ranked gene-set enrichment analysis for GO terms was performed. Top enriched GO terms from the GO Biological Process annotations were plotted. Positive enrichment scores indicate enrichment among GFP-NONOPT screen hits with positive Z-scores (i.e. knockouts causing increased GFP-NONOPT reporter levels) and vice versa for negative enrichment scores. (B) Venn diagrams describing the overlap between GFP-NONOPT and GFP-CGA or GFP-NONOPT and GFP-AAA screens for knockouts that increase reporter levels. Full table of overlaps is available in Supplementary file 1. (C) Venn diagrams describing the overlap between GFP-NONOPT and GFP-CGA or GFP-NONOPT and GFP-AAA screens for knockouts that decrease reporter levels. Full table of overlaps is available in Supplementary file 1.
Figure 4 with 1 supplement
Minimal reporter mRNA half-lives are affected by COMD and NGD factor knockouts.
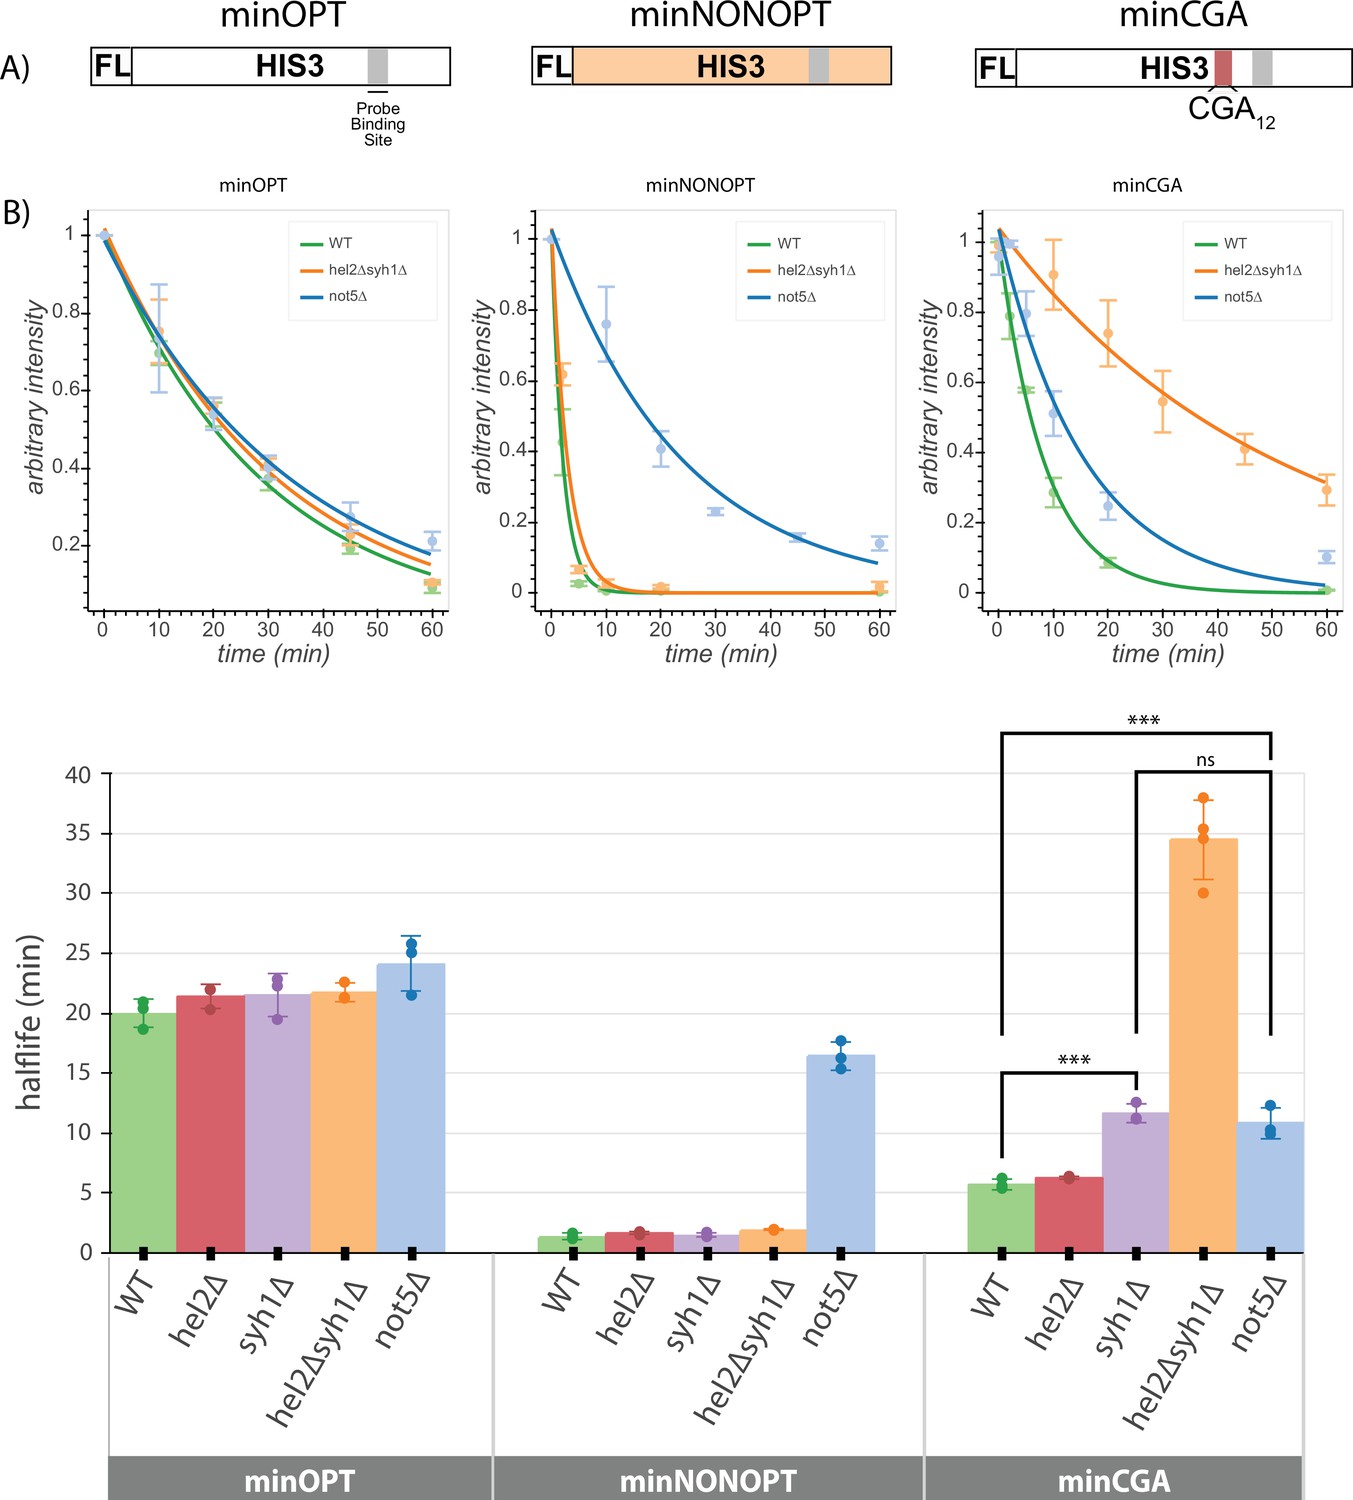
(A) Diagram of the minOPT, minCGA, and minNONOPT reporters. Reporters are expressed from a GAL promoter and contain only a FLAG tag (FL) and HIS3 ORF. The minOPT reporter contains a fully-optimized ORF, the minCGA reporter contains a CGA12 stalling sequence within the ORF (indicated by the red shaded region), and the minNONOPT reporter contains a HIS3 ORF fully recoded as synonymous non-optimal codons. All reporters share a common probe binding region for northern blot analysis (shaded in gray). (B) Reporter mRNA half-lives in distinct genetic backgrounds were measured following transcriptional shut down. Full-length reporter mRNA levels were normalized to endogenous SCR1 levels. Top, reporter mRNA decay curves measured by northern blot analysis after GAL promoter shutoff in different genetic backgrounds. A single exponential decay was fit to means of three or four replicates at each timepoint. Bottom, half-lives were calculated for replicates individually by fitting to a single exponential decay and averaged. Half-lives were fit to a linear model and Tukey’s honest significant difference test was performed. Selected significance indicators are shown. *** indicates p-value <0.001, ns indicates p-value >0.05. All error bars indicate standard deviation.
-
Figure 4—source data 1
Raw and labeled not5∆ strain northern blot source images for Figure 4.
- https://cdn.elifesciences.org/articles/76038/elife-76038-fig4-data1-v2.zip
-
Figure 4—source data 2
Raw and labeled syh1∆ strain northern blot source images for Figure 4.
- https://cdn.elifesciences.org/articles/76038/elife-76038-fig4-data2-v2.zip
-
Figure 4—source data 3
Raw and labeled wild-type strain northern blot source images for Figure 4.
- https://cdn.elifesciences.org/articles/76038/elife-76038-fig4-data3-v2.zip
-
Figure 4—source data 4
Raw and labeled hel2∆ strain northern blot source images for Figure 4.
- https://cdn.elifesciences.org/articles/76038/elife-76038-fig4-data4-v2.zip
-
Figure 4—source data 5
Raw and labeled hel2∆syh1∆ strain northern blot source images for Figure 4.
- https://cdn.elifesciences.org/articles/76038/elife-76038-fig4-data5-v2.zip
Figure 4—figure supplement 1
Galactose shutoff mRNA decay of reporters in knockout backgrounds.
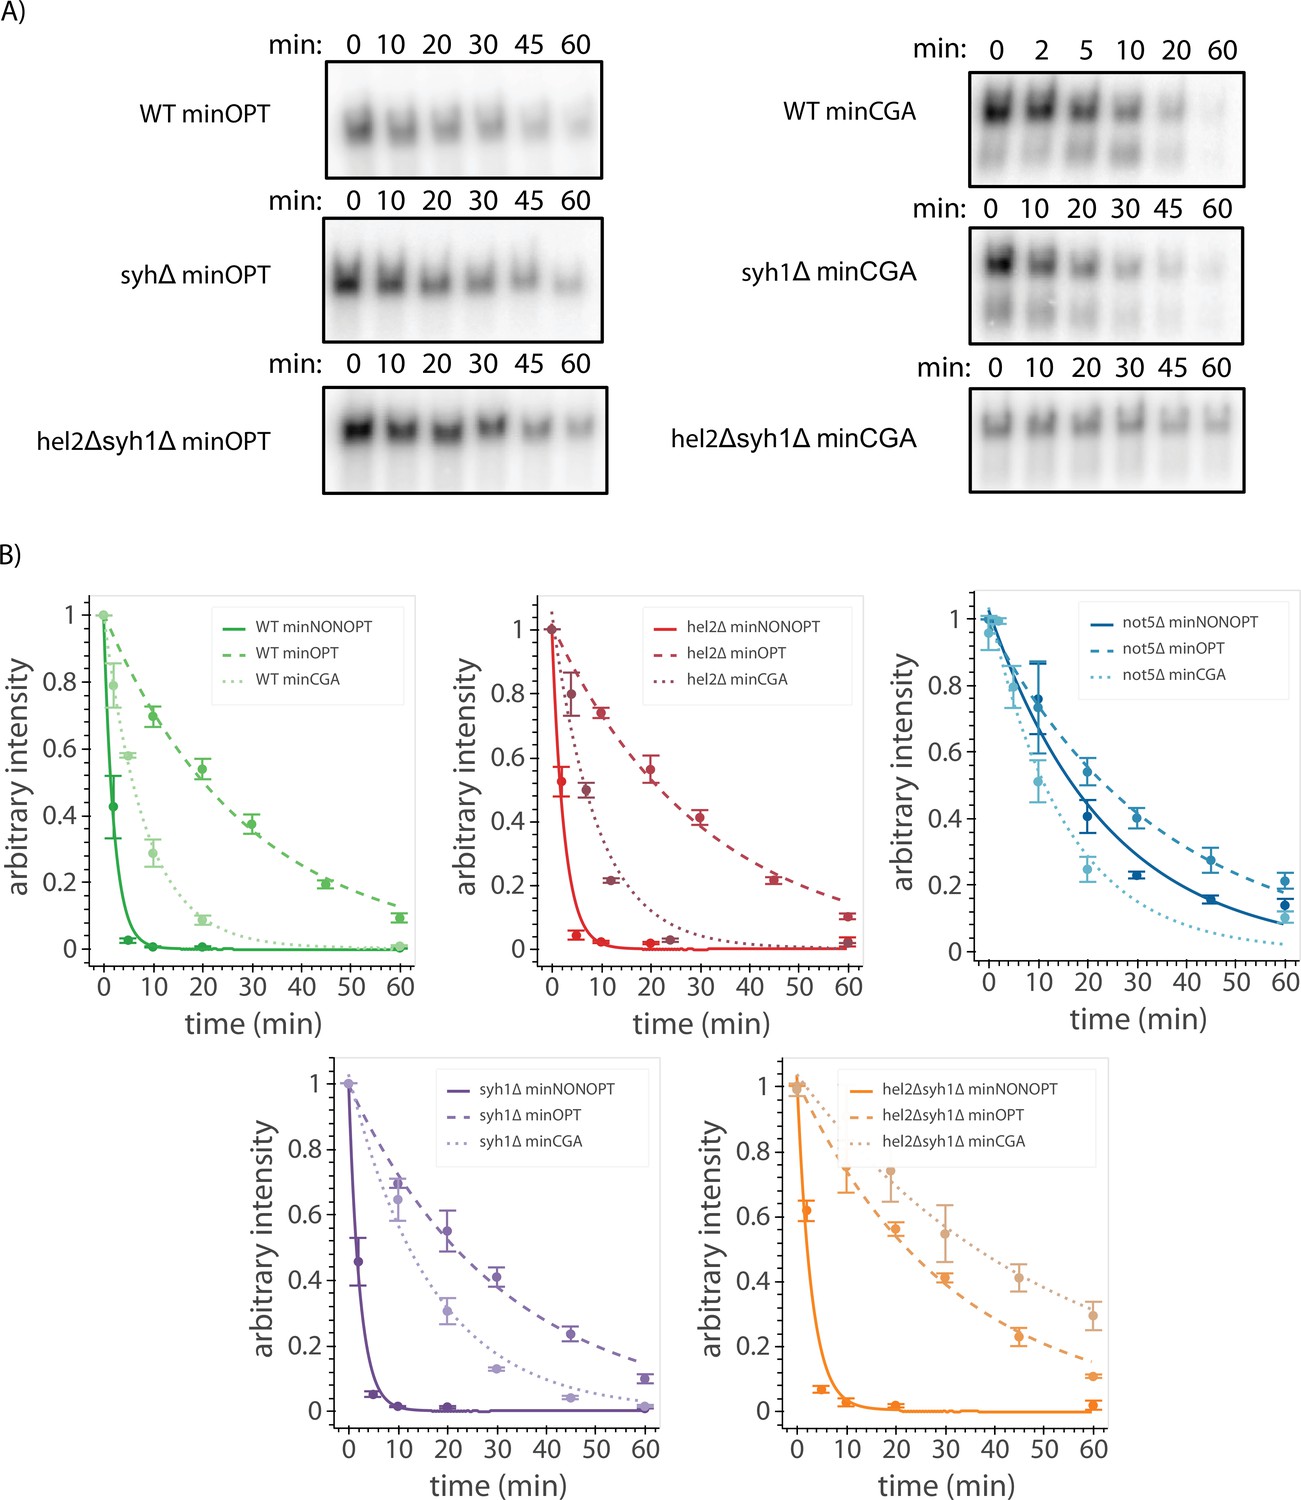
(A) Northern blot autoradiography images for reporter mRNAs in galactose shutoff assays in the indicated genetic backgrounds. Representative images are shown. Full-length bands were used to calculate decay rates. (B) Decay curves for reporters from northern blots are plotted for different backgrounds as in Figure 4B. Full-length reporter mRNA levels were normalized to endogenous SCR1 levels. Reporter mRNA decay curves measured by northern blot analysis after GAL promoter shutoff in different genetic backgrounds. A single exponential decay was fit to means of three or four replicates at each timepoint.
Figure 5 with 1 supplement
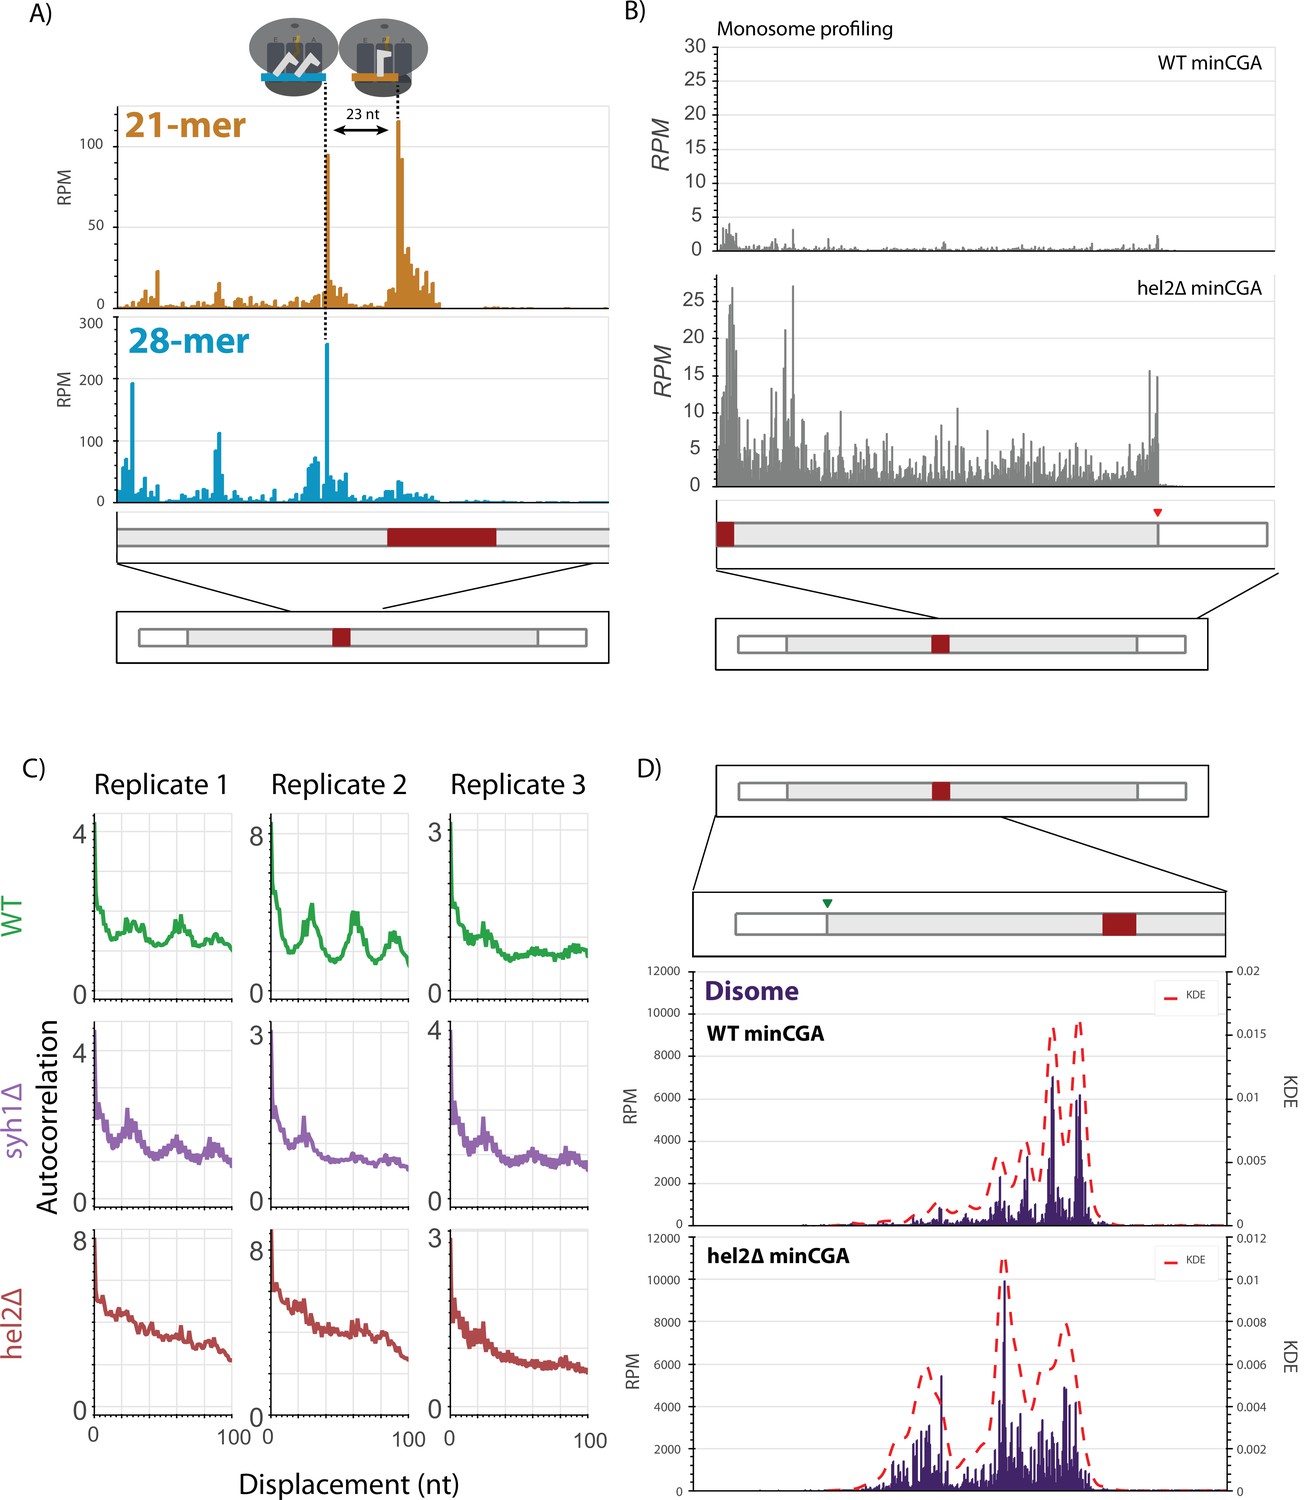
Ribosome profiling reveals translational states that trigger NGD and COMD.
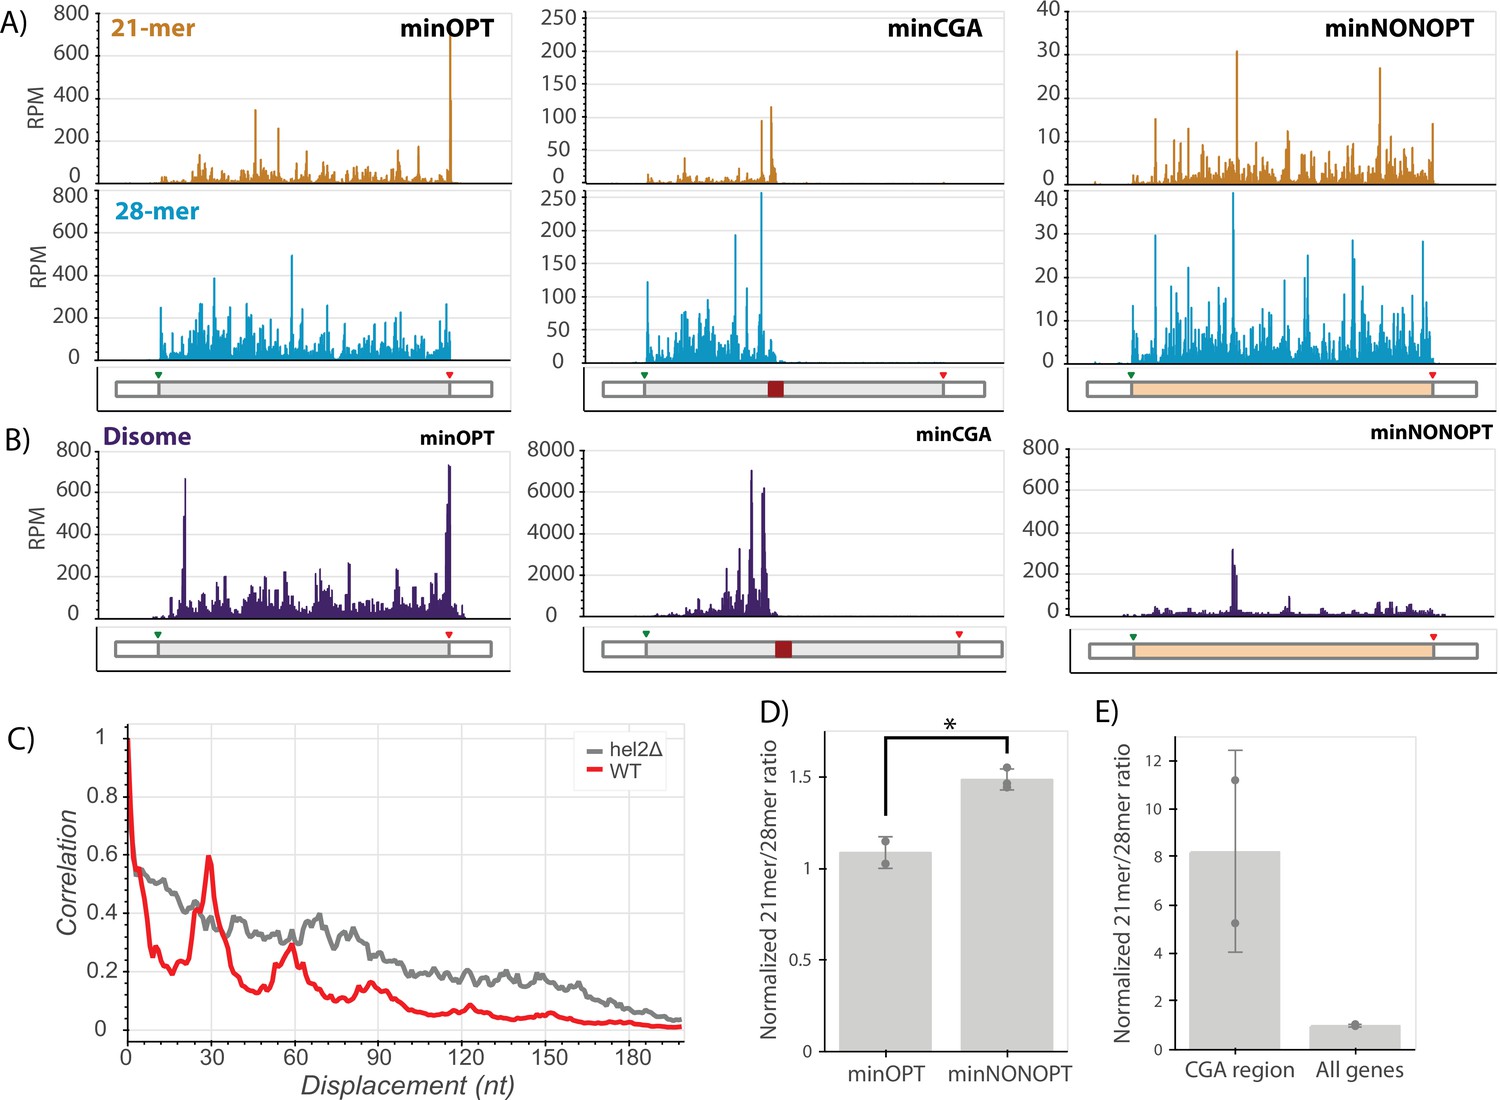
(A) Gene diagrams show reads per million (RPM) at every position of the indicated reporters: minOPT (left), minCGA (center), minNONOPT (right). Top, 21-mer reads are plotted using read lengths 19–26 inclusive. Bottom, 28-mer reads are plotted using read lengths 27–36 inclusive. Beneath each plot, diagrams of the indicated reporter show the locations of important features. (B) Read RPMs from disome footprint profiling are shown for each position of the minOPT (top) and minNONOPT (bottom) reporters. (C) Autocorrelation of the disome footprint RPMs in the region upstream of the CGA repeats for WT minCGA and hel2∆ minCGA samples. (D) Normalized 21-mer to 28-mer ratios of two replicates for the minOPT and minNONOPT reporters. Ratios exclude regions near the start and end of the ORF and the common probe binding region and are normalized to the 21-mer to 28-mer ratio of all genes to control for differences in digestion efficiency between libraries. Error bars indicate standard deviation. Significance was tested with a t-test, * indicates a p-value <0.05. (E) Normalized 21-mer to 28-mer ratios of two replicates for multiply aligned reads within the CGA region of the minCGA reporter. Ratios are normalized to the average of 21-mer to 28-mer ratios for all genes. Error bars indicate standard deviation.
Figure 5—figure supplement 1
Ribosome profiling analysis.
(A) RPMs for each position of the minCGA reporter replotted from Figure 5A enlarged to show the region around the CGA stall sequence. The leading 21-mer peak and the lagging 28-mer peak are approximately one ribosome length apart. (B) RPMs for each position of the reporter in monosome profiling data for the minCGA reporter replotted from Figure 5A as a combination of all reads compared to the monosome profiling data from the hel2∆ strain. (C) Autocorrelation of the footprint RPMs upstream of the stall plotted for three replicates in wild-type, syh1∆, and hel2∆ strains. (D) Read RPMs from disome footprint profiling are shown for each position of the minCGA reporter in the WT (top, replotted from Figure 5B) and hel2∆ strains. A kernel density estimate (KDE) for each sample was superimposed to emphasize the periodicity of reads in the WT strain that is lost in the hel2∆ strain.
Figure 6
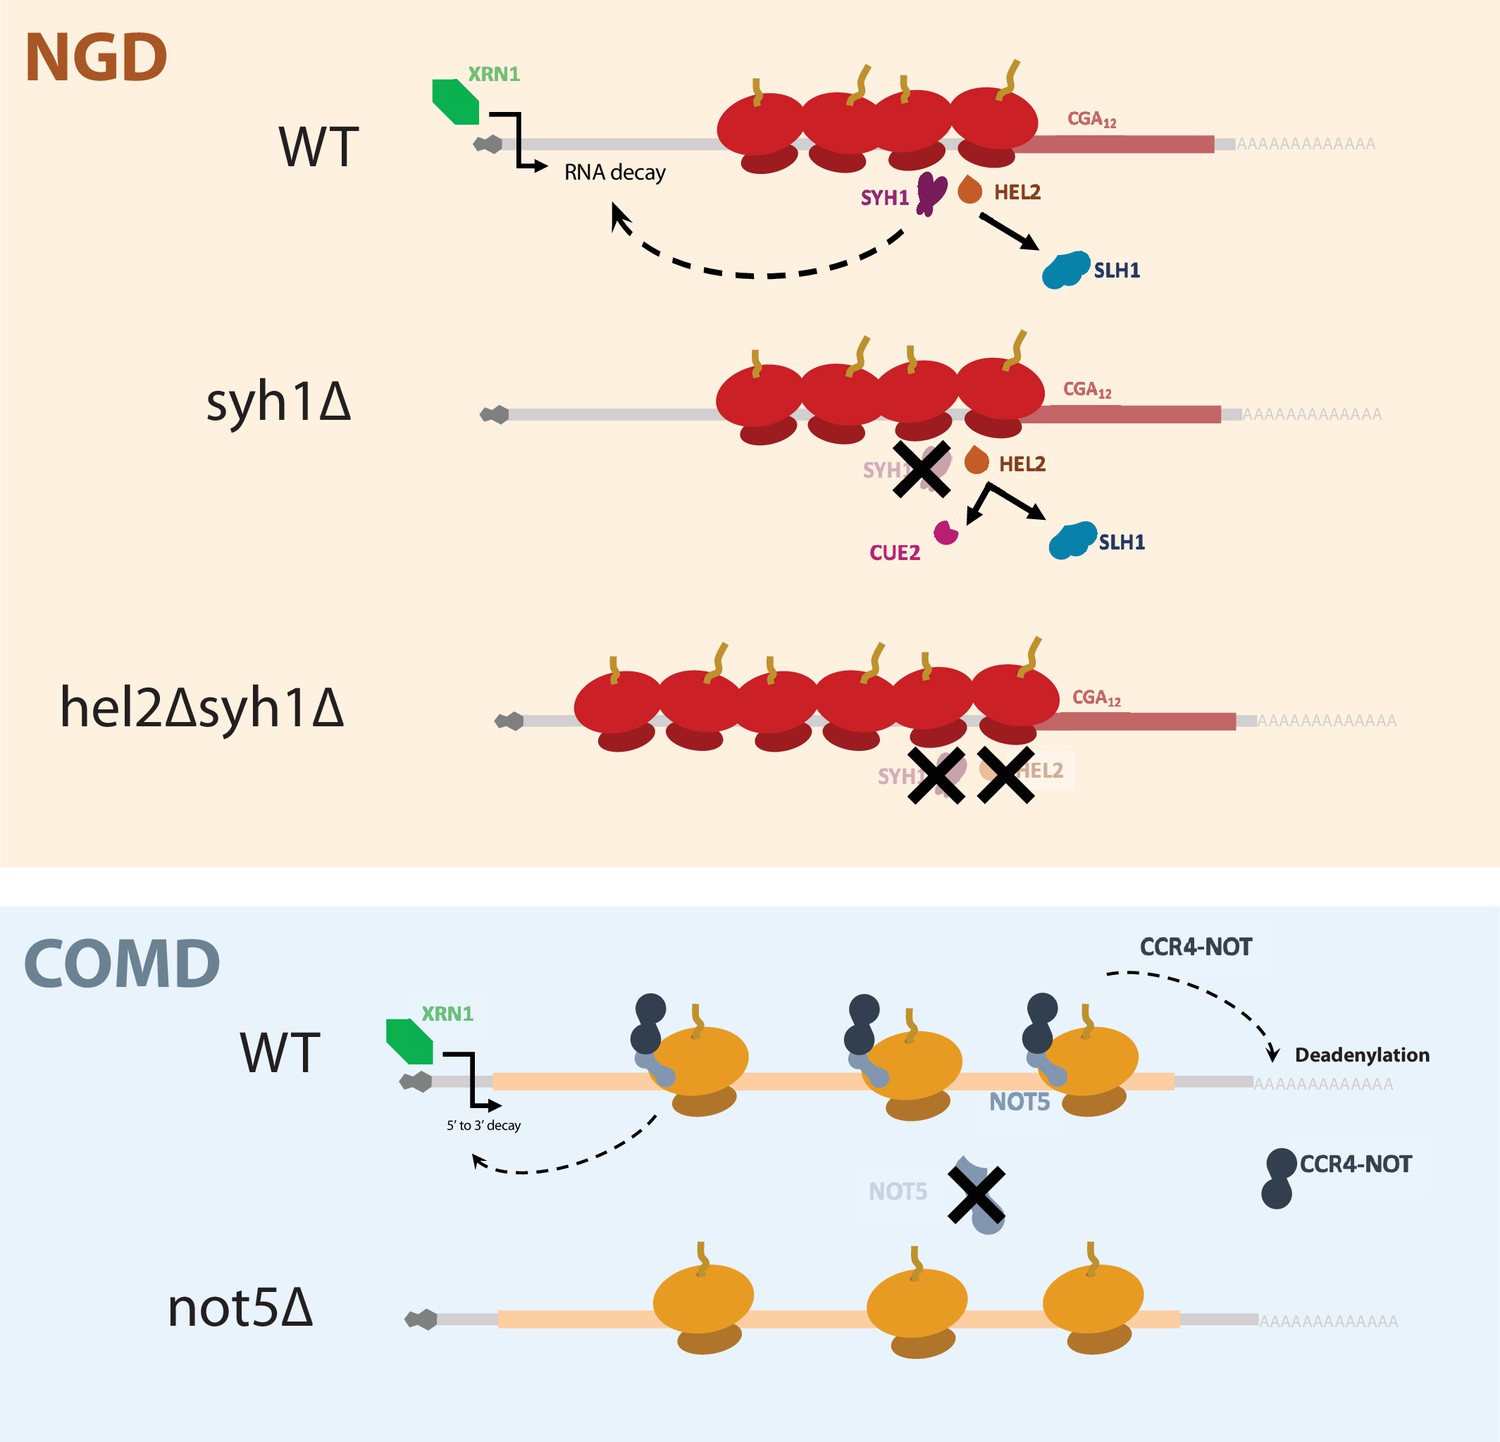
A model for NGD and COMD.
In NGD, Syh1 responds to collided ribosomes, connecting severe translational blocks to mRNA decay. Loss of Syh1 results in activation of Hel2-dependent endonucleolytic NGD by Cue2. Loss of Syh1 and Hel2 causes increased reporter accumulation by blocking both exonucleolytic and endonucleolytic RNA decay pathways. In COMD, Not5 senses slow ribosomes on non-optimal codons and recruits the Ccr4-Not complex, causing deadenylation, decapping, and 5’ to 3’ decay. Loss of Not5 stabilizes non-optimal mRNAs.
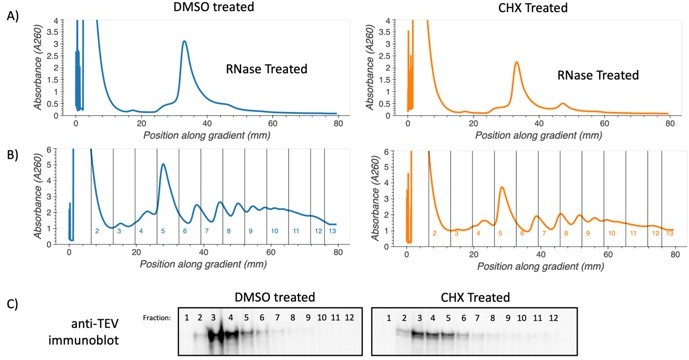
Author response image 1
.
Polysome association of SYH1-TAP protein. Yeast cells containing c-terminally TAP-tagged SYH1 at the endogenous locus were grown to saturation in YPD, diluted to OD600 0.1 and allowed to reach OD600 0.5. Cells were then treated with either 2.8 µg/mL cycloheximide or DMSO in YPD media for 30 minutes. Yeast were collected by vacuum filtration, lysed via freezer mill in polysome lysis buffer. Lysates were thawed, cleared by centrifugation, and either RNase treated and run on 10-35% sucrose gradients to verify increase in disomes (A) or directly fractionated on 10-50% sucrose gradients (B). Protein from undigested fractions was TCA precipitated, resuspended and run on an SDS-PAGE gel. Proteins were transferred to PVDF membrane and immunoblotted using Anti-TEV antibody (Thermo PA1-119) and an HRP conjugated secondary antibody (C).
Author response image 2
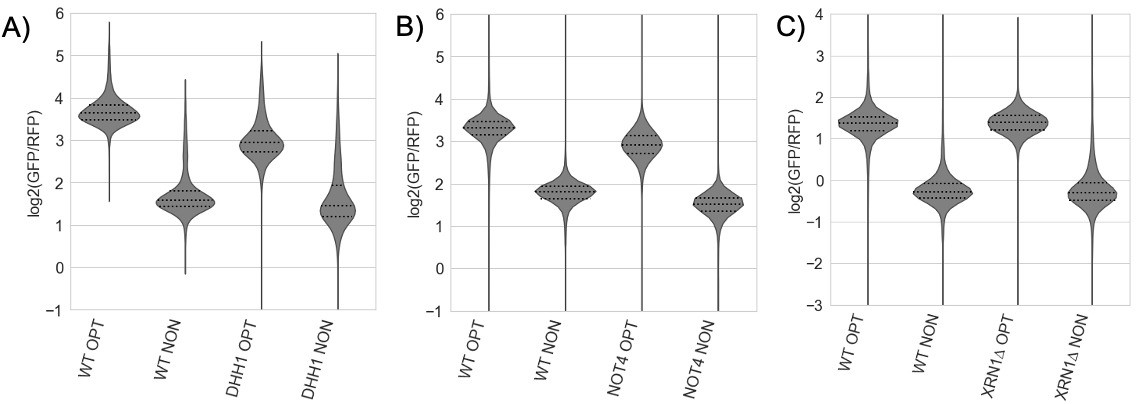
(A-C) Flow cytometry analysis of GFP-containing reporters in the indicated genetic backgrounds.
In all cases, there was little change between the GFP/RFP levels for WT and knockout GFP-NONOPT reporters.
Additional files
-
Supplementary file 1
A Microsoft Excel table containing raw data from the R-SGA GFP-reporter screens, including an additional sheet describing overlaps of screen hits.
- https://cdn.elifesciences.org/articles/76038/elife-76038-supp1-v2.xlsx
-
Supplementary file 2
A CSV table containing GFP/RFP fluorescence ratios for validation flow cytometry from GFP-CGA screen hits.
- https://cdn.elifesciences.org/articles/76038/elife-76038-supp2-v2.csv
-
Supplementary file 3
A CSV table of statistically significant validated GFP-CGA screen hits including p-values and Z-scores.
- https://cdn.elifesciences.org/articles/76038/elife-76038-supp3-v2.csv
-
Supplementary file 4
A CSV table describing the gene-set enrichment analysis (GSEA) of the GFP-CGA screen resulting from analysis with the software gseapy.
- https://cdn.elifesciences.org/articles/76038/elife-76038-supp4-v2.csv
-
Supplementary file 5
A CSV table with p-values for pairwise statistical comparisons for all relevant figures using linear modeling and Tukey’s Honest Significant Difference test.
- https://cdn.elifesciences.org/articles/76038/elife-76038-supp5-v2.csv
-
Supplementary file 6
A CSV table containing LFQ values for mass spectrometry analysis.
- https://cdn.elifesciences.org/articles/76038/elife-76038-supp6-v2.csv
-
Supplementary file 7
A CSV table containing average mRNA half-lives and standard deviations for minOPT, minCGA, and minNONOPT reporters in various knockout strains.
- https://cdn.elifesciences.org/articles/76038/elife-76038-supp7-v2.csv
-
Supplementary file 8
A CSV table of oligos used in the study.
- https://cdn.elifesciences.org/articles/76038/elife-76038-supp8-v2.csv
-
Supplementary file 9
A CSV table of plasmids used in the study.
- https://cdn.elifesciences.org/articles/76038/elife-76038-supp9-v2.csv
-
Supplementary file 10
A CSV table of yeast strains used in the study.
- https://cdn.elifesciences.org/articles/76038/elife-76038-supp10-v2.csv
-
Transparent reporting form
- https://cdn.elifesciences.org/articles/76038/elife-76038-transrepform1-v2.pdf
Download links
A two-part list of links to download the article, or parts of the article, in various formats.
Downloads (link to download the article as PDF)
Open citations (links to open the citations from this article in various online reference manager services)
Cite this article (links to download the citations from this article in formats compatible with various reference manager tools)
Distinct elongation stalls during translation are linked with distinct pathways for mRNA degradation
eLife 11:e76038.
https://doi.org/10.7554/eLife.76038


