Elevated brain-derived cell-free DNA among patients with first psychotic episode – a proof-of-concept study
- Department of Developmental Biology and Cancer Research, Institute for Medical Research Israel-Canada, the Hebrew University-Hadassah Medical School, Israel
- Neuropediatric Unit, Shaare Zedek Medical Center, Israel
- Jerusalem Mental Health Center, Eitanim Psychiatric Hospital, Israel
- Hebrew University-Hadassah School of Medicine, Israel
- Karolinska Institute, Department of Cell and Molecular Biology Stockholm, Sweden
- Endocrinology and Metabolism Service, Hadassah Medical Organization and Faculty of Medicine, Hebrew University of Jerusalem, Israel
Figures
Figure 1 with 2 supplements
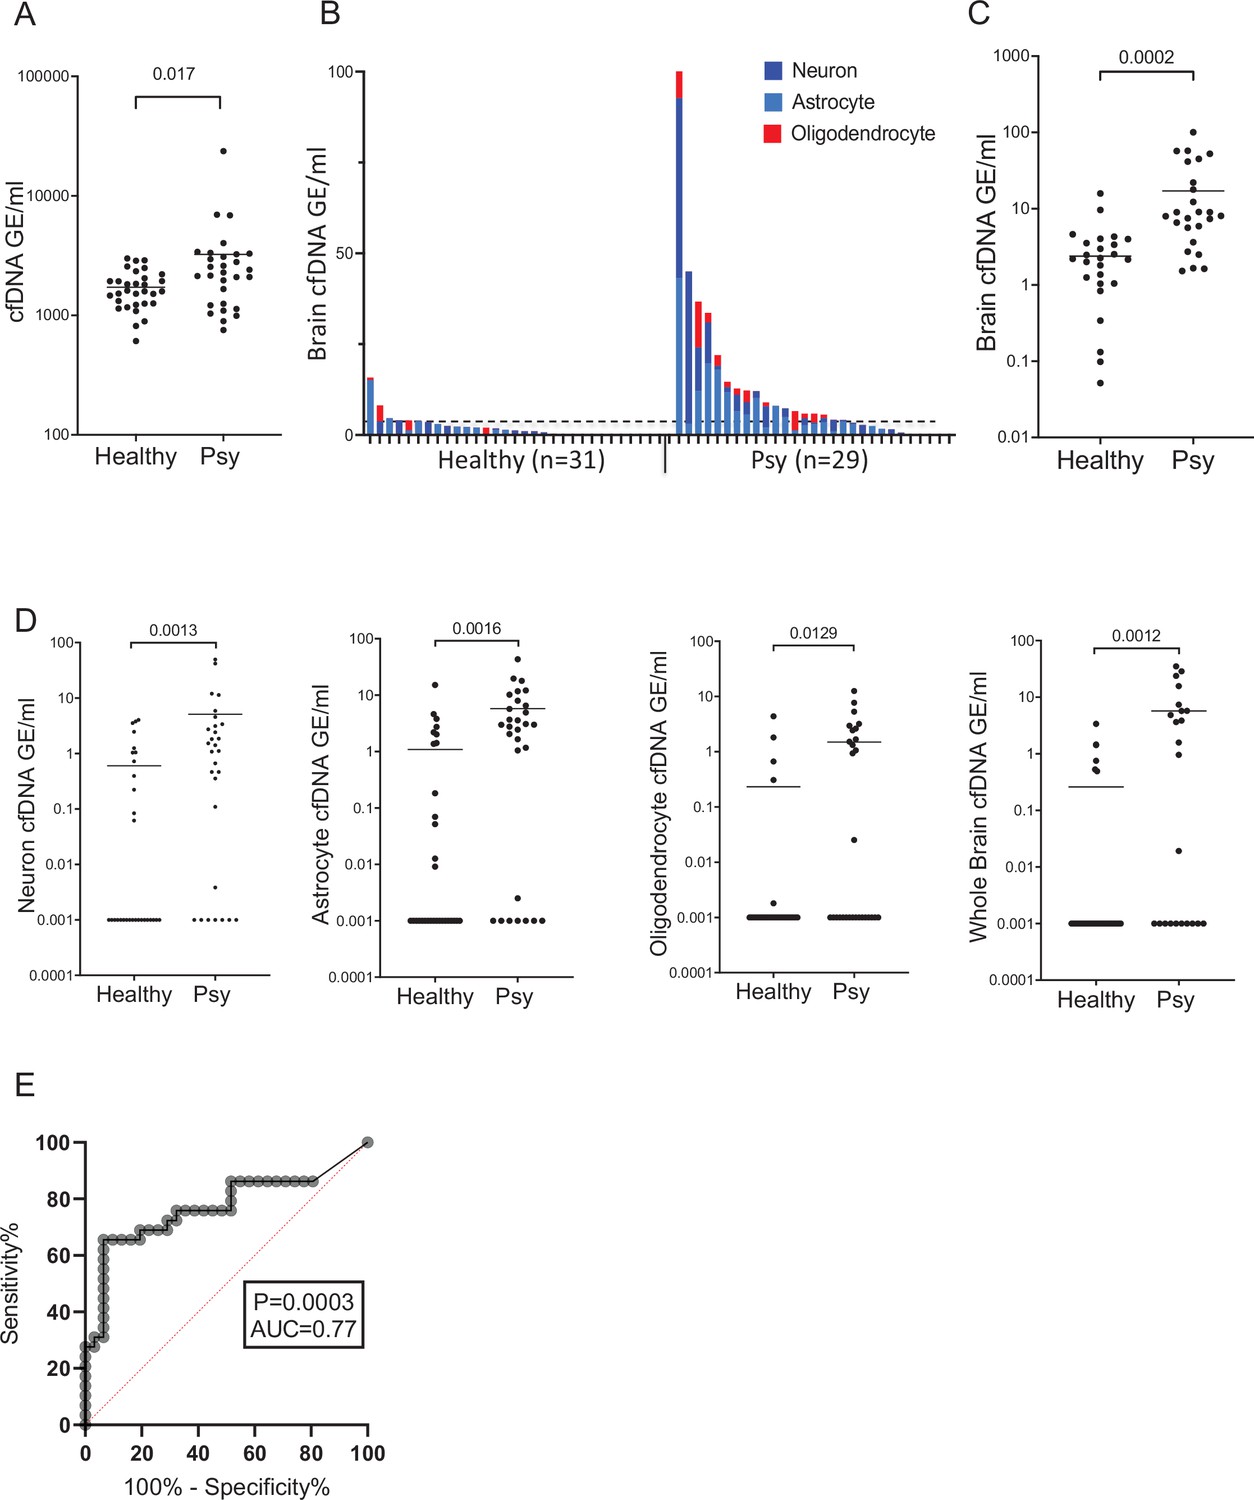
Brain-derived cell-free DNA (cfDNA) in patients with a first psychotic episode.
(A) Plasma concentrations of total cfDNA. Total levels of cfDNA in healthy controls and patients with first psychotic episode. Mann-Whitney test for controls vs. patients, p-value = 0.017. (B–C) Plasma concentrations of brain-derived cfDNA. Brain cfDNA levels in healthy controls (n=31) and patients with first psychotic episode (n=29), represented as the cumulative sum of the average signals from neuron, oligodendrocyte, and astrocyte markers. In panel B, graph retaining the value of each component; in panel C, graph combining all average signals to one value for statistical analysis. (D) Signals from distinct brain cell types. Mann-Whitney test for controls vs. patients, neurons p-value = 0.0013, astrocytes p-value = 0.0016, oligodendrocytes p-value = 0.0129, and whole brain markers p-value = 0.0012. Shown are the average levels in plasma of four neuronal markers, three astrocyte markers, three oligodendrocyte markers, and three general brain markers. cfDNA was treated with bisulfite, PCR amplified, and sequenced, and the molecules that are fully unmethylated were scored. The fraction of brain-specific molecules was multiplied by the total cfDNA concentration. Each dot represents one plasma sample. (E) Receiver operating characteristic (ROC) curve for distinguishing patients with first psychotic episode from healthy controls. A combined score of all brain markers, area under the curve (AUC) 0.77; 95% CI=0.64–0.9; p-value = 0.0003.
Figure 1—figure supplement 1
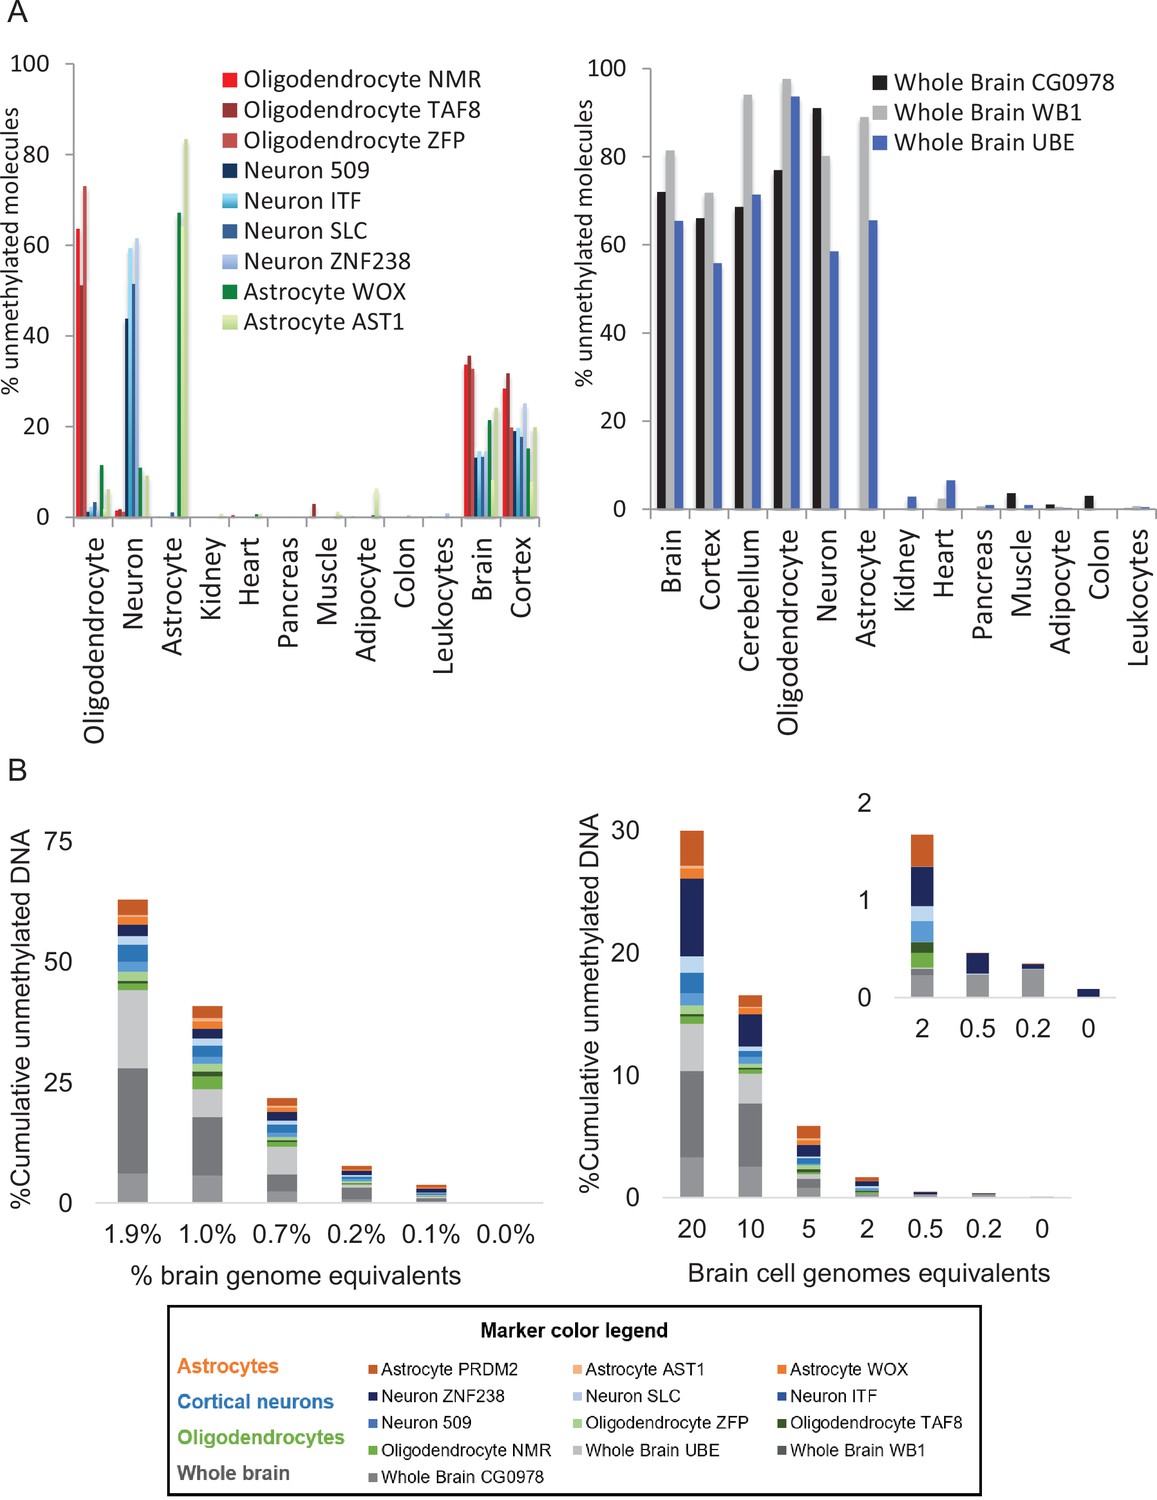
Specificity and sensitivity of brain methylation markers.
(A) Methylation status of 13 brain-derived markers in genomic DNA from multiple human tissues. Each color represents a different locus that is differentially hypomethylated in a specific brain cell type. Shown is the methylation score of multiple CpG sites in each block (i.e. the fraction of molecules that are fully unmethylated in a given sample). (B) Sensitivity of brain-derived methylation markers. Brain DNA was spiked into leukocyte DNA as indicated and the fraction of brain DNA was assessed using bisulfite conversion, multiplex PCR amplification of brain markers, and sequencing. Left: 20 brain cell genome equivalents (GE) (120 pg brain DNA) were mixed with blood DNA (0–10 ng). Right: brain cell DNA (20–0.2 GE) was diluted into 10 ng of blood DNA.
Figure 1—figure supplement 2
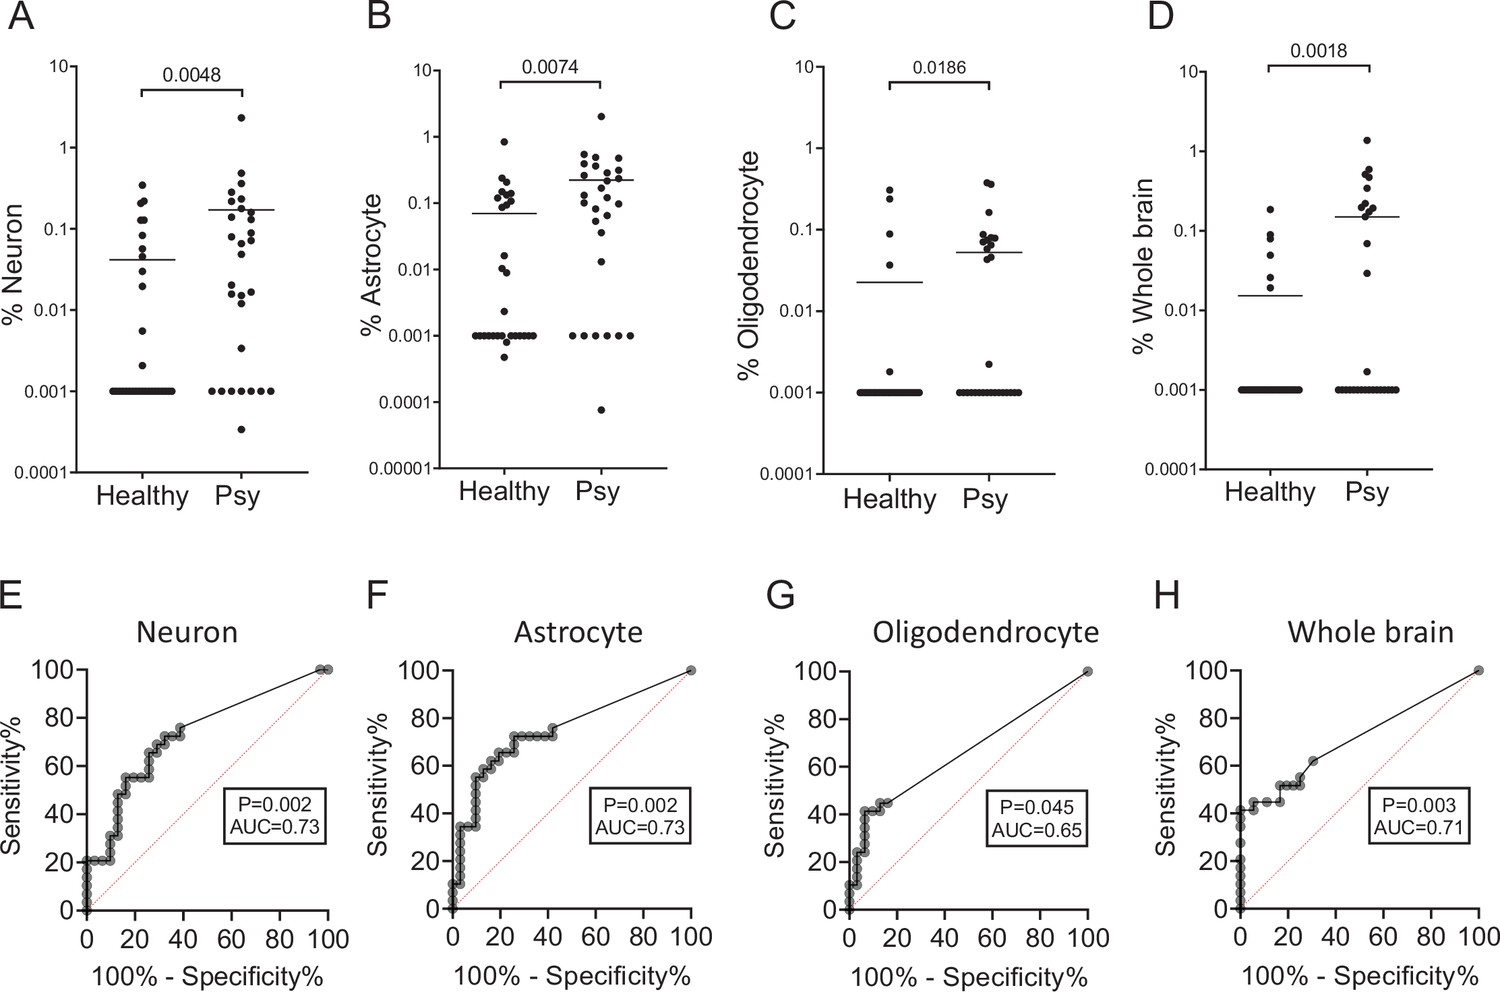
Fractions and receiver operating characteristic (ROC) curves for markers of individual brain cell types.
(A–D) Percentage of brain-derived cfDNA. Brain cfDNA levels expressed as percentage of cfDNA derived from the indicated brain cell type. Mann-Whitney test for controls vs. patients, neurons p-value = 0.0048, astrocytes p-value = 0.0074, oligodendrocytes p-value = 0.0186, and whole brain markers p-value = 0.0018. (E–H) ROC curves for distinguishing patients with first psychotic episode from healthy controls, using markers of individual brain cell types. (E) Neuronal markers; area under the curve (AUC) 0.73, 95% CI = 0.6 to 0.86; p-value. (G) Oligodendrocyte markers; AUC 0.65; 95% CI = 0.51 to 0.79; p-value. (H) Whole brain markers; AUC 0.71; 95% CI = 0.58 to 0.84; p-value.
Additional files
Download links
A two-part list of links to download the article, or parts of the article, in various formats.
Downloads (link to download the article as PDF)
Open citations (links to open the citations from this article in various online reference manager services)
Cite this article (links to download the citations from this article in formats compatible with various reference manager tools)
Elevated brain-derived cell-free DNA among patients with first psychotic episode – a proof-of-concept study
eLife 11:e76391.
https://doi.org/10.7554/eLife.76391


