Functional requirements for a Samd14-capping protein complex in stress erythropoiesis
- Department of Genetics, Cell Biology and Anatomy, University of Nebraska Medical Center, United States
- Proteomics and Metabolomics Facility, University of Nebraska-Lincoln, United States
- Eppley Institute for Research in Cancer and Allied Diseases, University of Nebraska Medical Center, United States
Figures
Figure 1 with 1 supplement
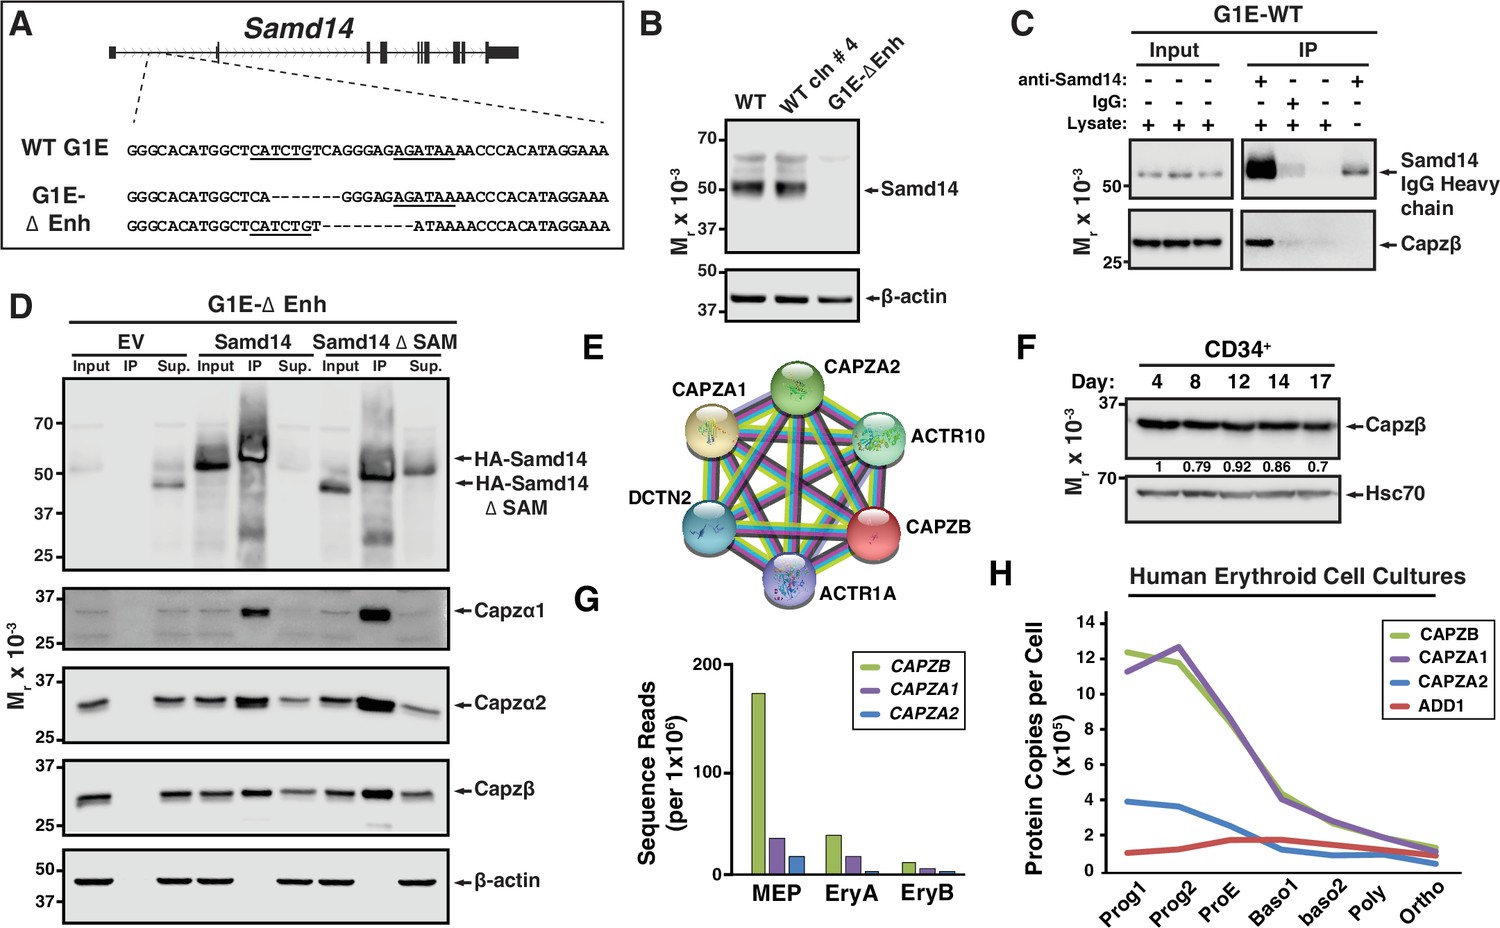
Establishing a Samd14 protein interactome in proerythroblasts.
(A) The mouse sterile alpha motif domain 14 (Samd14) locus contains an E-box-GATA composite element (Samd14-Enh sequence highlighted) in intron 1 (Hewitt et al., 2015). The G1E wild type (WT) sequence and enhancer knockout G1E-derived cell clone sequence following TALEN directed enhancer knockout (G1E-ΔEnh) are shown. (B) Western blot of Samd14 and β-actin expression in G1E, WT clone #4 and G1E-ΔEnh clone. (C) Western blot of WT G1E cell lysates following pulldown with anti-Samd14 or anti-rabbit IgG control antibody. Input corresponds to 5% of immunoprecipitation (IP) lysate. (D) Western blot of G1E-ΔEnh cell lysates expressing empty vector (EV), hemagglutinin (HA)-Samd14 or HA-Samd14 Δ SAM following anti-HA pulldown. Blots were stained with anti-Samd14, anti-Capzα1, -Capzα2, -Capzβ, and β-actin antibodies. Input corresponds to 5% of IP lysate. (E) STRING plot depicting known interactions between capping protein (CP) complex subunits CAPZA1, CAPZA2, and CAPZB (https://string-db.org/). (F) Western blot and semi-quantitative densitometry analysis of human CD34+ cell lysates at 4, 8, 12, 14, and 17 days of differentiation stained with anti-Capzβ and anti-Hsc70 antibodies. (G) Quantitation of Capzb, Capza1, and Capza2 mRNA transcript levels in fluorescence-activated cell sorting (FACS) purified mouse bone marrow-derived hematopoietic cells. . Data from RNA-sequencing in Lara-Astiaso et al., 2014. (H) Quantitation of CAPZB, CAPZA1, CAPZA2, and α-adducin (ADD1) protein copies per cell (Gautier et al., 2016). Relative levels measured by quantitative mass spectrometry to determine absolute protein levels in human erythroid progenitors throughout differentiation stages. Prog1-Band3-CD71medGPA-, Prog2- Band3-CD71highGPA-, ProE- Band3-CD71highGPAlow, Baso1- Band3lowCD71highGPAmed, Baso2- Band3medCD71highGPAhighCD49dhigh, Poly- Band3medCD71highGPAhighCD49dmed, and Ortho-Band3highCD71medGPAhigh. MEP: megakaryocyte erythroid progenitor; EryA: Ter119+CD71+FSChigh; EryB: Ter119+CD71+FSClow.
-
Figure 1—source data 1
Source Western blot images for Figure 1.
- https://cdn.elifesciences.org/articles/76497/elife-76497-fig1-data1-v2.zip
Figure 1—figure supplement 1
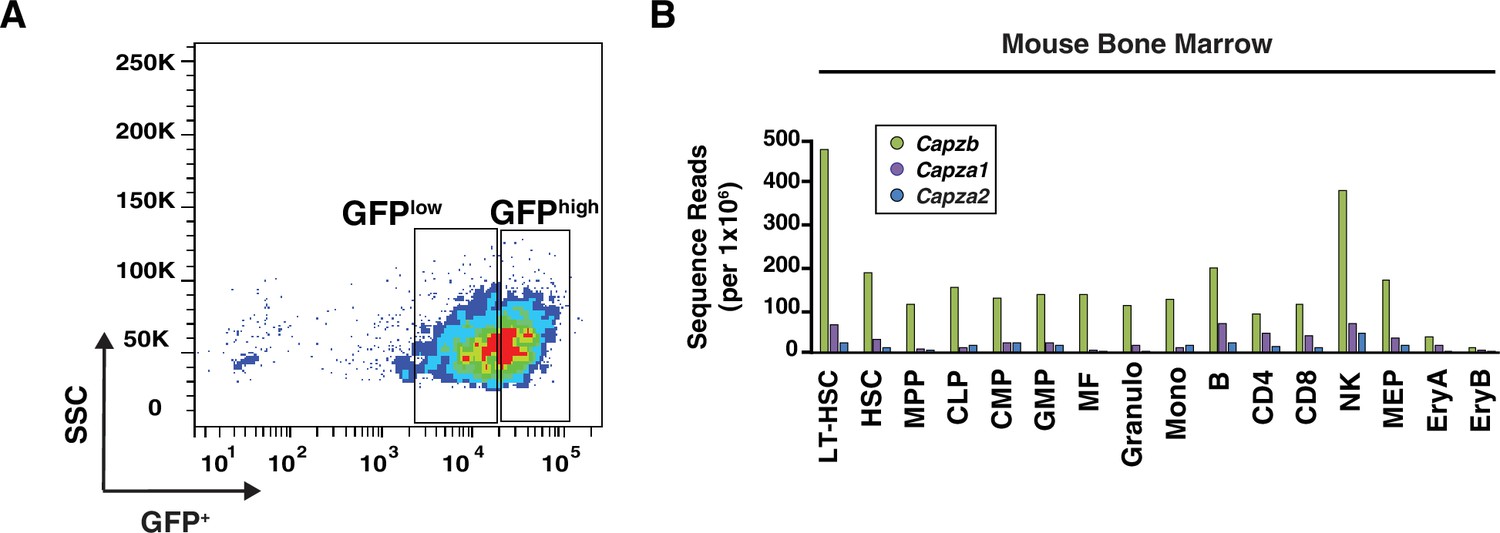
Expression of Samd14 Interacting proteins in hematopoietic stem/progenitor cells and precursors.
(A) Flow cytometry gating strategy to cell sort G1E-ΔEnh cells retrovirally infected with empty vector (EV) and hemagglutinin (HA)-Samd14 for both GFPlow and GFPhigh. (B) Quantitation of Capzb, Capza1, and Capza2 transcript levels in fluorescence-activated cell sorting (FACS) purified mouse bone marrow-derived hematopoietic cells. Data mined from RNA-sequencing in Lara-Astiaso et al., 2014. LT-HSC: long term-hematopoietic stem cells; HSC: hematopoietic stem cells; MPP: multipotent progenitors; CLP: common lymphoid progenitor; CMP: common myeloid progenitor; GMP: granulocyte monocyte progenitor; MF: macrophage; NK: natural killer cells; MEP: megakaryocyte erythroid progenitor, EryA: Ter119+CD71+FSChigh; EryB: Ter119+CD71+FSClow.
Figure 2
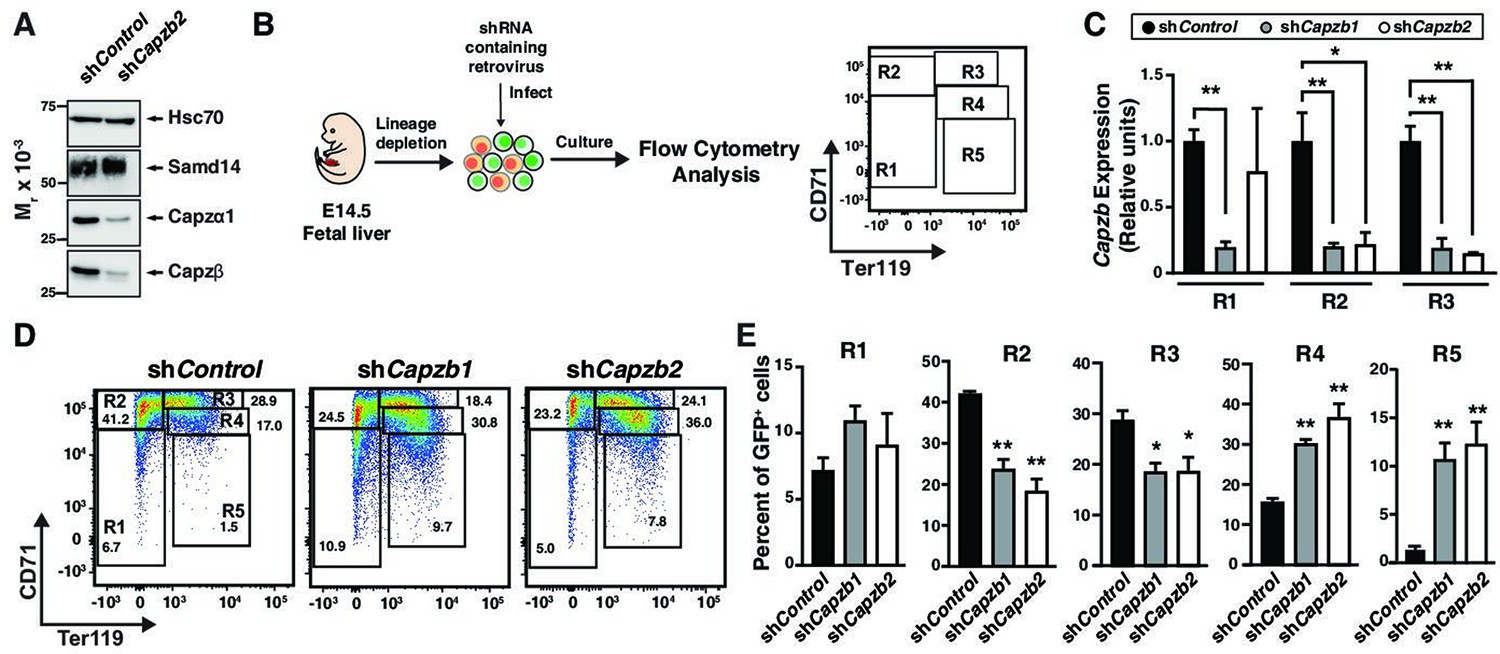
Capzβ restricts erythroid differentiation during fetal liver hematopoiesis/development.
(A) Western blot of wild type (WT) G1E cell lysates after retroviral infection with control shRNA (shControl) or shRNA targeting Capzb mRNA (shCapzb2) stained with anti-sterile alpha motif domain 14 (Samd14), anti-Capzα1, anti-Capzβ, or anti-Hsc70 antibodies. (B) Experimental layout. E14.5 mouse fetal liver progenitors are retrovirally infected with shControl, shCapzb1, or shCapzb2 and cultured 3 days. R1–R5 flow cytometry gating using anti-CD71 and anti-Ter119 antibodies represents progressive stages of erythroid maturation. (C) Quantitation of Capzb mRNA in R1 (CD71lowTer119low), R2 (CD71highTer119low), and R3 (CD71highTer119high) fetal liver progenitors from WT (N=3) mice in control (shControl) and following Capzb knockdown (shCapzb1 and shCapzb2). (D) Representative flow cytometry of E14.5 fetal liver progenitors expressing shControl, shCapzb1, or shCapzb2 using anti-CD71 and anti-Ter119 antibodies. (E) Quantitation of R1–R5 percentages in E14.5 fetal liver progenitors following retroviral infection with shControl, shCapzb1, or shCapzb2 and 3-day culture (N=3). Error bars represent SD. *p<0.05; **p<0.01; ***p<0.001; ****p<0.0001 (two-tailed unpaired Student’s t test).
-
Figure 2—source data 1
Source Western blot images for Figure 2.
- https://cdn.elifesciences.org/articles/76497/elife-76497-fig2-data1-v2.zip
Figure 3 with 1 supplement

Capping protein (CP) complex promotes stress progenitor activity.
(A) Experimental layout of ex vivo spleen retroviral infection and cultures. (B) Relative mRNA expression of sterile alpha motif domain 14 (Samd14), Capzb, Capza1, and Capza2 in control vs phenylhydrazine (PHZ)-treated CD71+Kit+Ter119- spleen cultures. (C) Quantitation of Capzb mRNA in fluorescence-activated cell sorting (FACS)-purified GFP+Kit+CD71+ cells from wild type (WT) mice following retroviral infection with shControl, shCapzb2 after 2-day culture (left); Western blot of primary spleen cultures following Capzβ knockdown (shCapzb2) or shControl stained with anti-Capzβ and β-actin antibodies (right). (D) Quantitation of Samd14 mRNA in FACS-purified GFP+Kit+CD71+ cells from WT mice following retroviral infection with shControl, shCapzb2 after 2-day culture. (E) Quantitation of infected R1–R5 cells in WT PHZ-treated cells following Capzb knockdown. (F) Representative images from Wright-Giemsa stained cells following Capzb knockdown (40 × magnification)(G) Retrovirally-infected spleen progenitors were GFP-purified by FACS and grown for 2 days colony forming unit-erythroid (CFU-E) or 5 days burst forming unit-erythroid (BFU-E) and quantitated (N=9). (H) Representative flow cytometry scatter plot of membrane-impermeable DNA dye (Draq7) and anti-annexin V pacific blue (AnnV). Cells were first segregated on GFP+ and Kit+ gating. Live = Draq7− AnnV−; Early apoptotic (EA)=Draq7−AnnV+; Late apoptotic (LA)=Draq7+AnnV+. (I) Quantitation of percent dead, LA and EA cells in the GFP+Kit+ cells (left) and GFP+CD71+Ter119+ (right). Error bars represent SD. *p<0.05; **p<0.01; ***p<0.001; ****p<0.0001 (two-tailed unpaired Student’s t test).
-
Figure 3—source data 1
Source Western blot images for Figure 3.
- https://cdn.elifesciences.org/articles/76497/elife-76497-fig3-data1-v2.zip
Figure 3—figure supplement 1
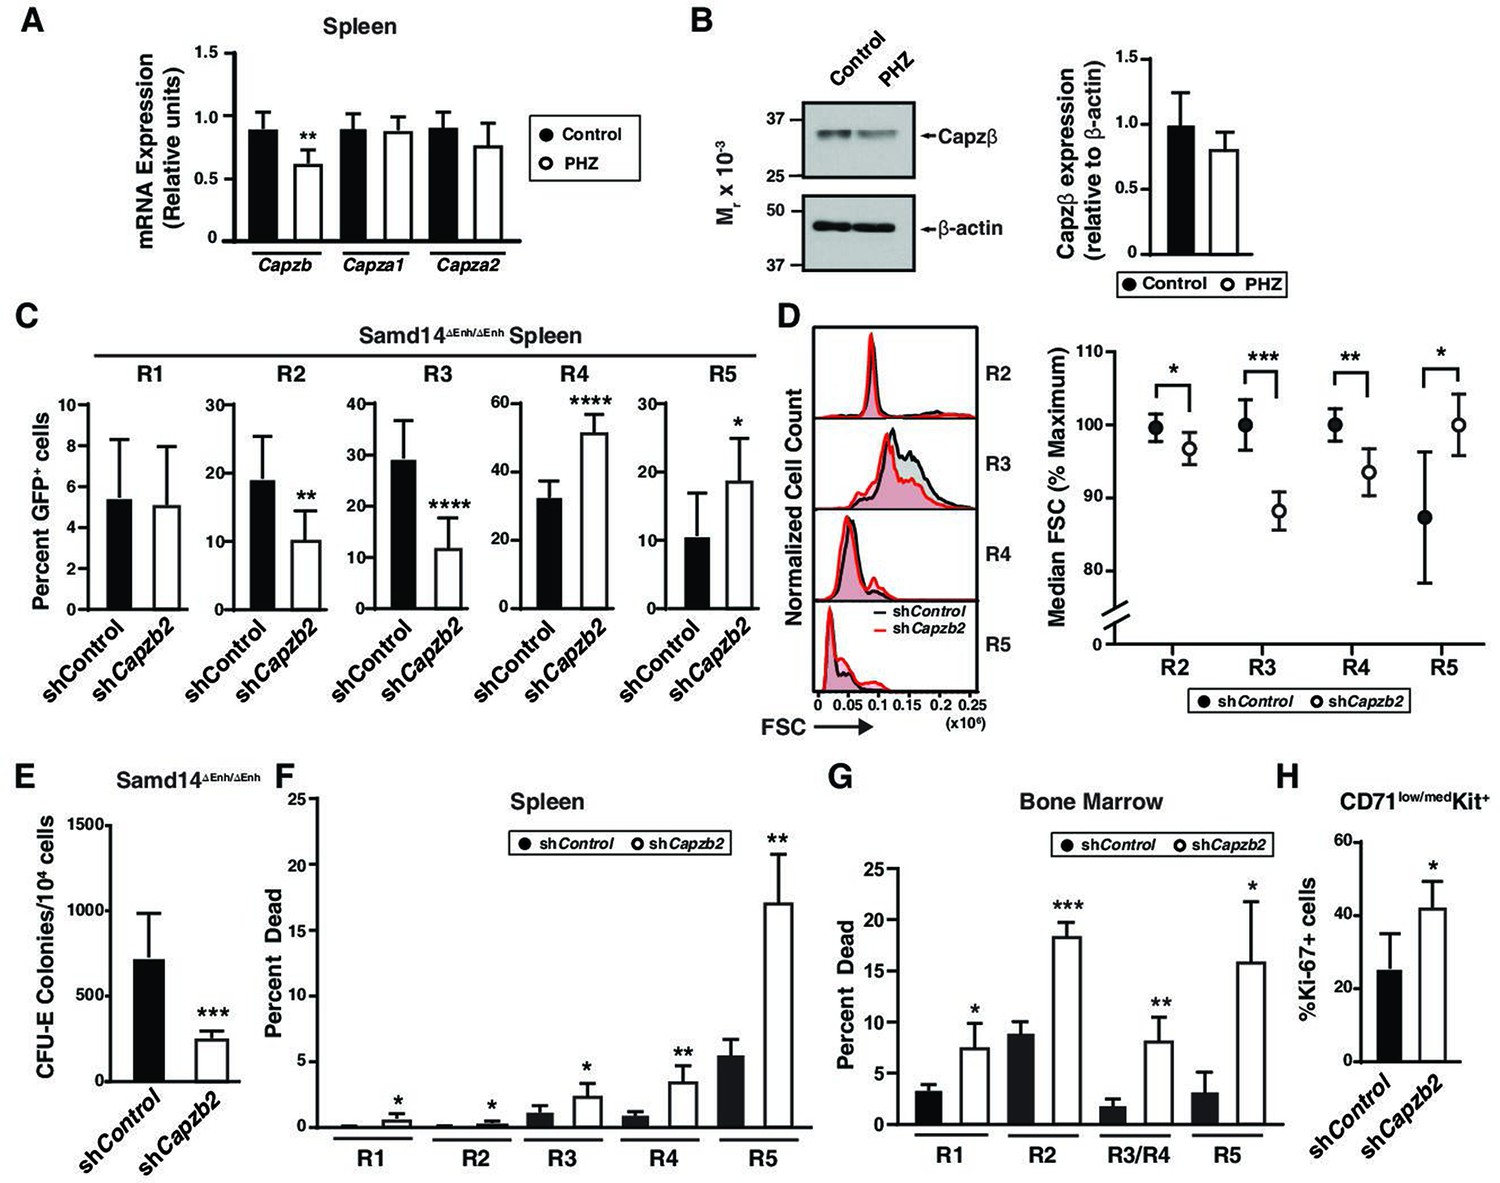
CP complex function in erythropoiesis.
(A) Relative mRNA expression of Capzb, Capza1, and Capza2 in control vs phenylhydrazine (PHZ)-treated spleen. (B) Western blot of control vs PHZ-treated spleens stained with anti-Capzβ and β-actin antibodies (left). Densitometry analysis of relative Capzβ expression in control vs PHZ-treated spleens (N=4) (right). (C) Quantitation of infected R1–R5 cells in sterile alpha motif domain 14-enhancer (Samd14-Enh-/-)PHZ-treated cells following Capzb knockdown (N=9). (D) Representative histogram of forward scatter area (FSC-A) in R2–R5 cells following shZb2 knockdown or shControl (left); Quantitation of median FSC-A in shCapzb2 vs shControl (N=5) (right). (E) Quantitation of colony forming unit-erythroid (CFU-E) colonies in spleen precursors following Capzb knockdown (N=6). (F) Quantitation of percent dead (Draq7+) infected R1–R5 cells in wild type (WT) PHZ-treated spleen cells following Capzb knockdown (N=4). (G) Quantitation of percent dead (DAPI+) in infected R1–R5 cells in untreated WT Lin- bone marrow cells following Capzb knockdown (N=4). (H) Quantitation of the percent of Ki67+ cells within CD71low/medKit+ population following Capzb knockdown (N=4). Error bars represent SD. *p<0.05; **p<0.01; ***p<0.001; ****p<0.0001 (two-tailed unpaired Student’s t test).
-
Figure 3—figure supplement 1—source data 1
Source Western blot images for Figure 3—figure supplement 1.
- https://cdn.elifesciences.org/articles/76497/elife-76497-fig3-figsupp1-data1-v2.zip
Figure 4 with 1 supplement

Capping protein binding (CPB) domain of sterile alpha motif domain 14 (Samd14) promotes stress progenitor activity.
(A) Schematic representation of Samd14 deletion construct location, protein sequence, and sequence alignment with known capping protein interacting (CPI) proteins. (B) Western blot of G1E-ΔEnh cell lysates expressing empty vectore (EV) or hemagglutinin (HA)-tagged Samd14, Samd14- Δ38–54, Samd14-Δ114–124, Samd14-Δ170–180, or Samd14-Δ272–295 constructs immunoprecipitation (IP) with anti-HA beads and stained with anti-HA, anti-Capzβ, anti-Capzα2, anti-Capzα1, or anti-β-actin antibodies. (C) Western blot of Lin- WT phenylhydrazine (PHZ)-treated spleen lysates immunoprecipitated (IPed) with anti-Samd14 or anti-rabbit IgG antibodies and stained with anti-Samd14 or anti-Capzβ antibodies. (D) Quantitation of colony forming unit-erythroid (CFU-E) (day 2 culture) and burst forming unit-erythroid (BFU-E) (day 5 culture) colonies in GFP+ spleen progenitors expressing EV, HA-tagged Samd14, Samd14 ΔSAM, Samd14 ΔCPB, and Samd14 ΔCPBΔSAM constructs (N=6). Error bars represent SD. *p<0.05; **p<0.01; ***p<0.001; ****p<0.0001 (two-tailed unpaired Student’s t test).
-
Figure 4—source data 1
Source Western blot images for Figure 4.
- https://cdn.elifesciences.org/articles/76497/elife-76497-fig4-data1-v2.zip
Figure 4—figure supplement 1
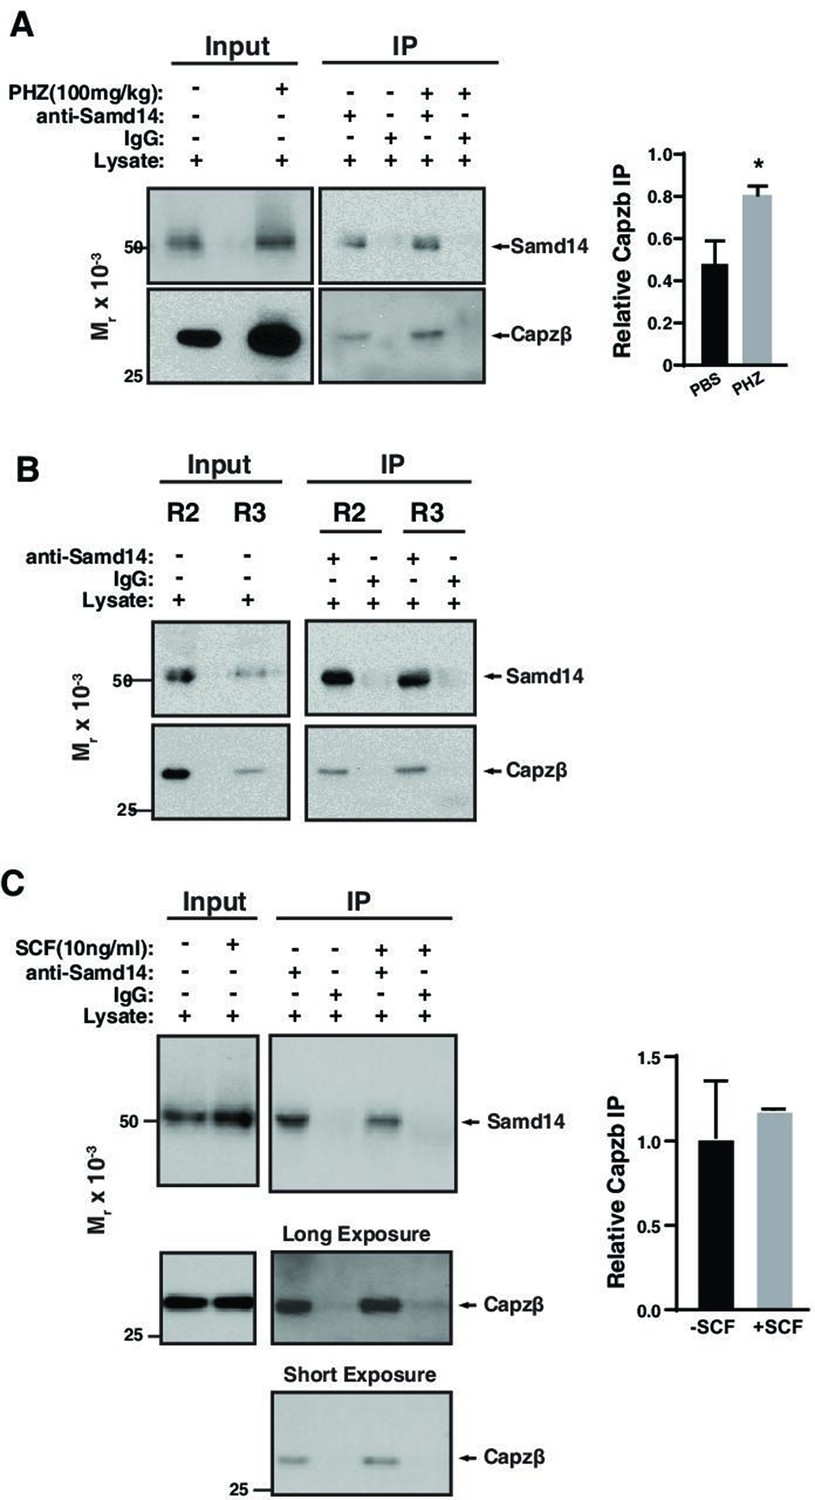
Dynamic regulation of Samd14-CP interaction in PHZ-induced anemia.
(A) Western blot of Lin- wild type (WT) spleen lysates obtained from mice treated with either PBS (control) or phenylhydrazine (PHZ) (100 mg/kg) immunoprecipitated (IPed) with anti-sterile alpha motif domain 14 (Samd14) or anti-rabbit IgG antibodies and stained with anti-Samd14, or anti-Capzβ antibodies (left). Densitometry analysis of the relative CapZβ co-IPed with Samd14 in PBS (control) vs PHZ (right). (B) Western blot of R2 (CD71+Ter119-) and R3 (CD71+Ter119+) cells sorted from WT PHZ-treated spleen lysates IPed with anti-Samd14 or anti-rabbit IgG antibodies and stained with anti-Samd14 or anti-Capzβ antibodies. (C) Western blot of Lin-WT PHZ-treated spleen cells treated with +/-stem cell factor (SCF) (10 ng/ml) for 5 min and IPed with anti-Samd14 or anti-rabbit IgG antibodies and stained with anti-Samd14 or anti-Capzβ antibodies (left). Densitometry analysis of the relative CapZ co-IPed with Samd14 in the presence or absence of SCF (right).
-
Figure 4—figure supplement 1—source data 1
Source Western blot images for Figure 4—figure supplement 1.
- https://cdn.elifesciences.org/articles/76497/elife-76497-fig4-figsupp1-data1-v2.zip
Figure 5 with 1 supplement
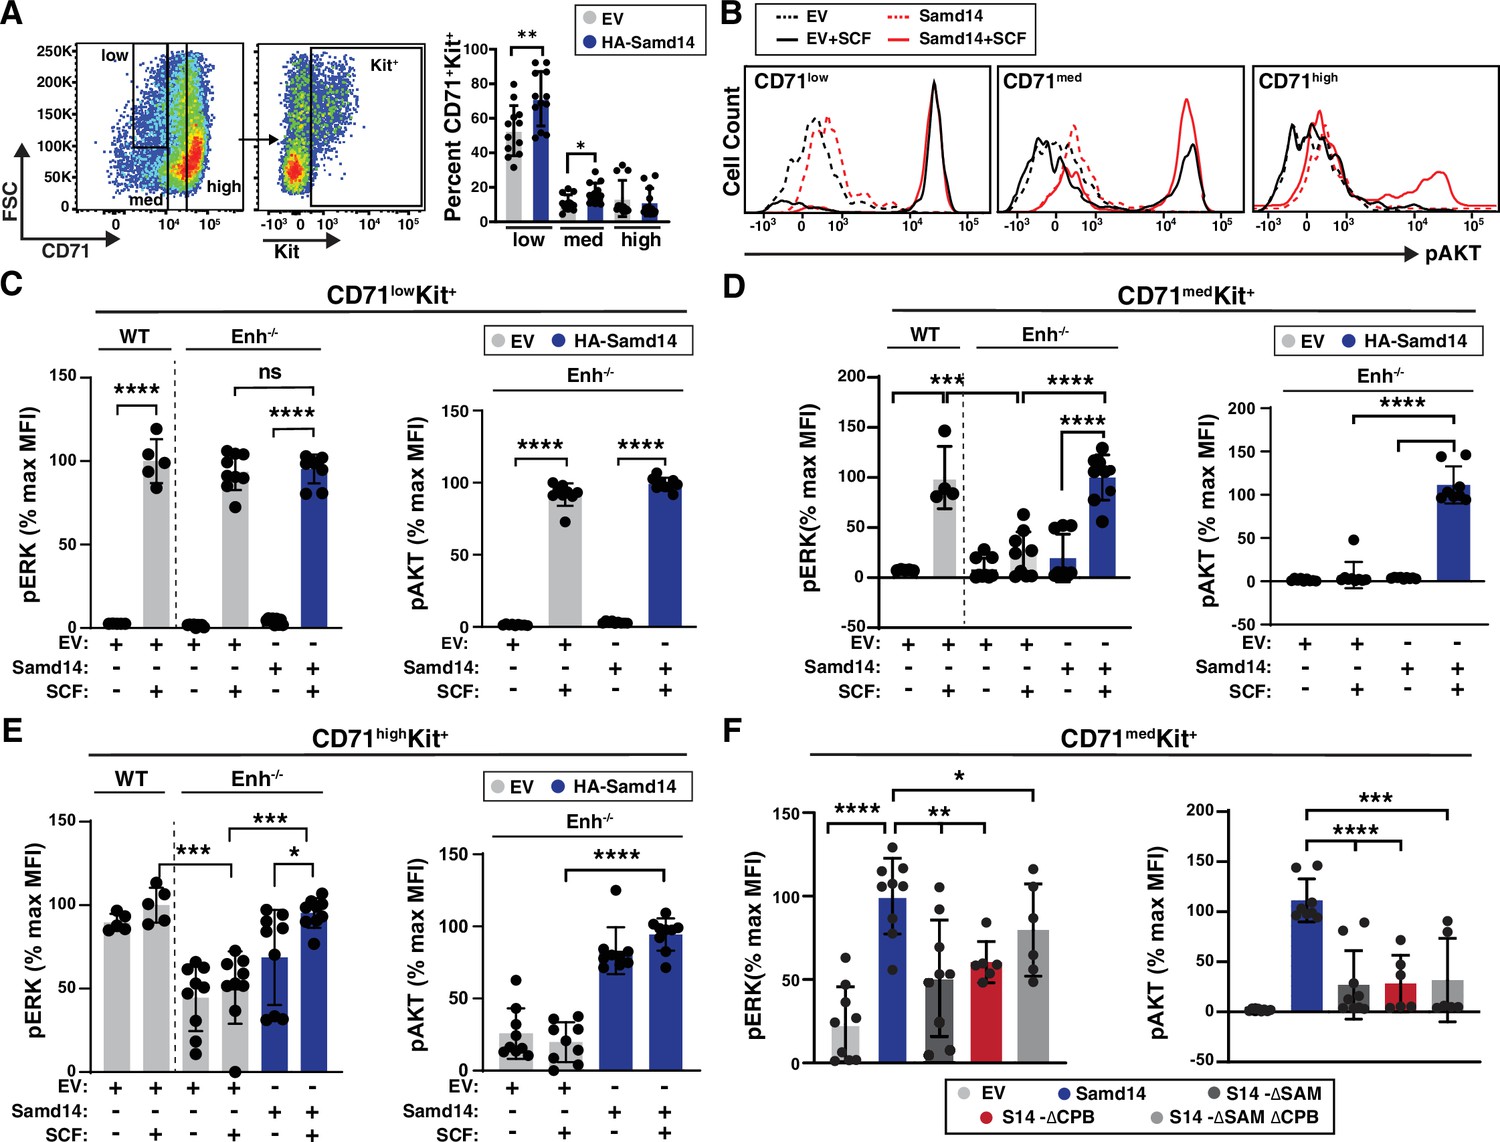
Sterile alpha motif domain 14 (Samd14)-capping protein (CP) enhances stem cell factor (SCF)/Kit signaling in CD71med stress progenitors.
(A) Flow cytometry gating to analyze retrovirally infected (GFP+) cells based CD71low, CD71med and CD71high, and Kit+ (left); Percent GFP+CD71+Kit+ cells in CD71low, CD71med, and CD71high fractions in phenylhydrazine (PHZ)-treated spleens expressing empty vector (EV) or hemagglutinin (HA)-Samd14 (N=9) (right). (B) Histograms depicting pAKT fluorescence in GFP+CD71lowKit+, GFP+CD71medKit+, and GFP+CD71highKit+ erythroid precursors in unstimulated (dotted line) or post-SCF stimulation (5 min, 10 ng/ml) (solid line). (C) Quantitation of pERK1/2 (left) and pAKT (right) median fluorescence intensity (MFI) in GFP+CD71lowKit+ cells from wild type (WT) or Samd14- Samd14ΔEnh/ΔEnh spleen expressing EV or HA-Samd14 at 5 min post-SCF stimulation. (D) Quantitation of pERK1/2 (left) and pAKT (right) MFI in GFP+CD71medKit+ cells from WT or Samd14ΔEnh/ΔEnh spleen expressing EV or HA-Samd14 at 5 min post-SCF stimulation. (E) Quantitation of pERK1/2 (left) and pAKT (right) MFI in GFP+CD71highKit+ cells from WT or Samd14ΔEnh/ΔEnh spleen expressing EV or HA-Samd14 at 5 min post-SCF stimulation. (F) Quantitation of pERK1/2 and pAKT MFI in GFP+CD71medKit+ retrovirally infected spleen cells with EV, HA-tagged Samd14, Samd14 ΔSAM, Samd14 ΔCPB and Samd14 ΔCPBΔSAM (N=6). Error bars represent SD. *p<0.05; **p<0.01; ***p<0.001; ****p<0.0001 (two-tailed unpaired Student’s t test).
Figure 5—figure supplement 1
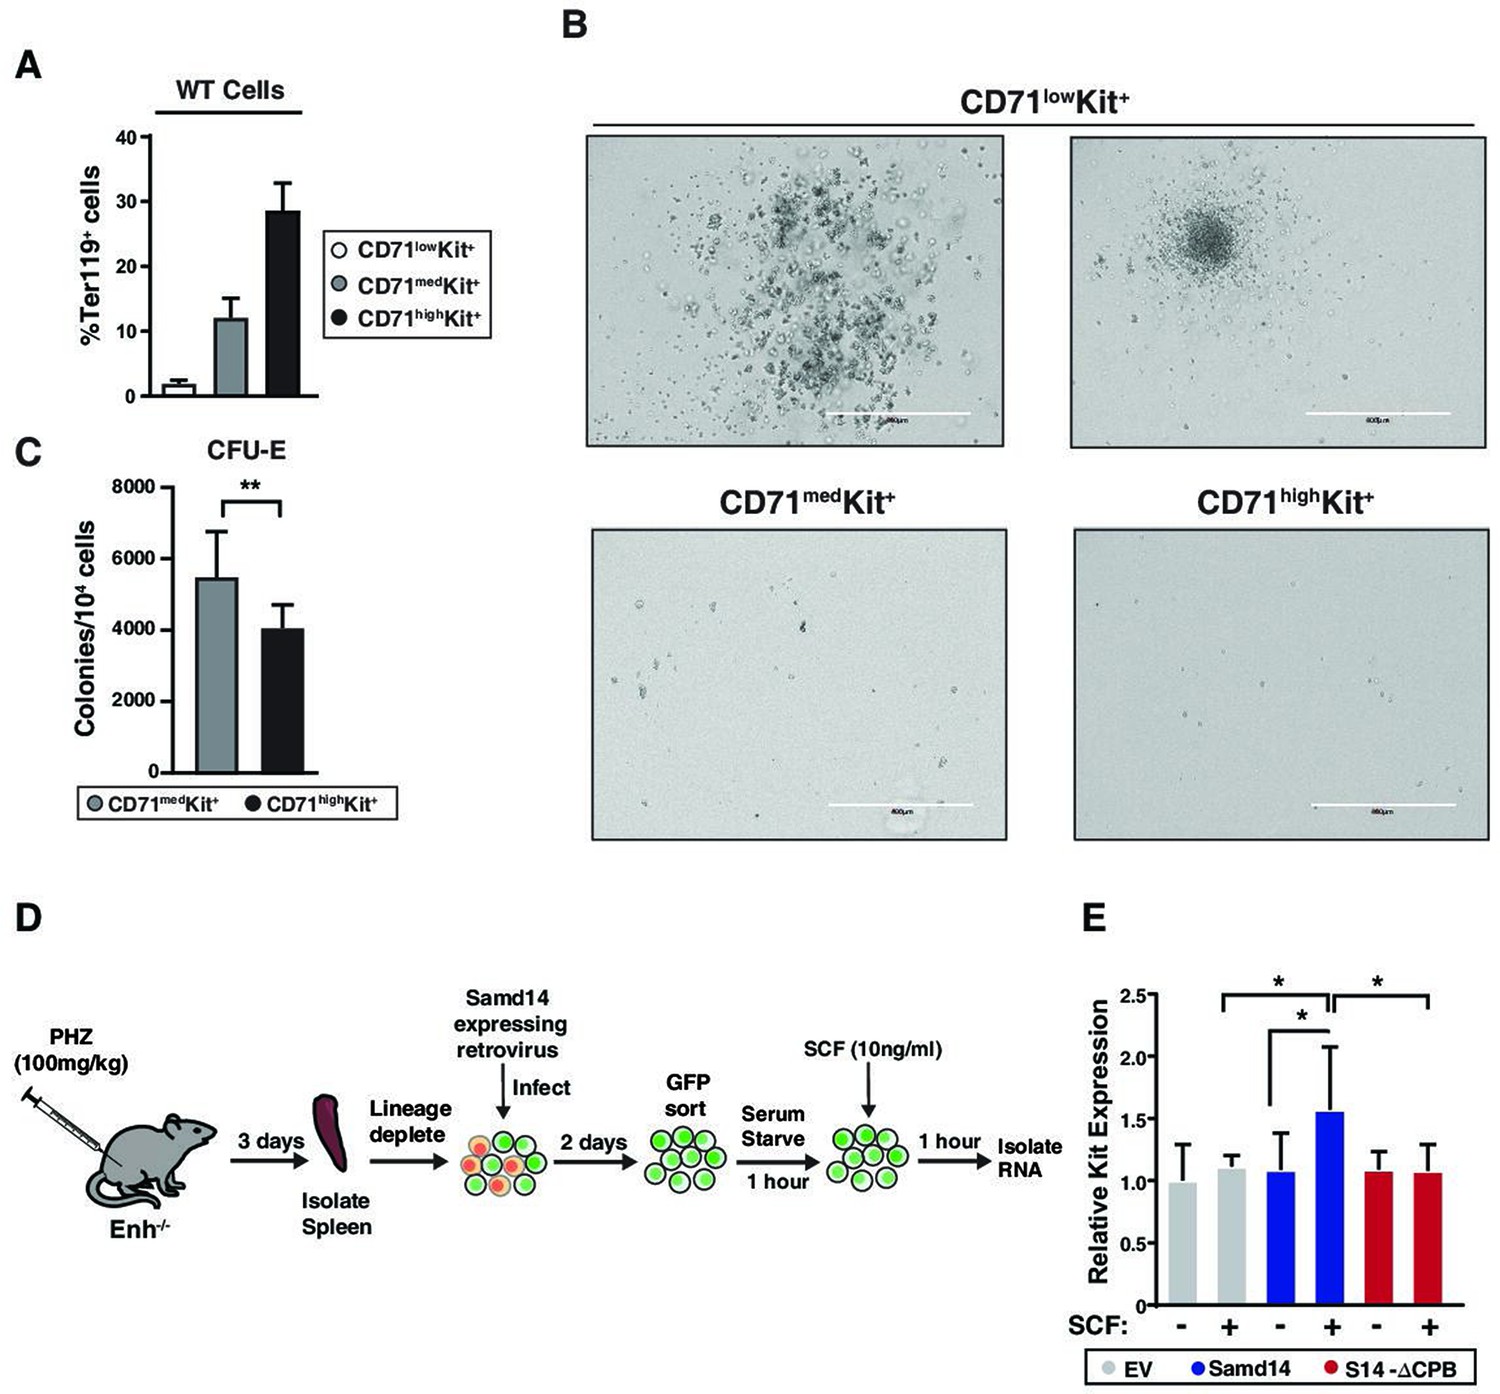
Linking progenitor activity and transcriptional activation in immunophenotypically defined populations.
(A) Quantitation of the percent of Ter119+ cells within CD71low Kit+, CD71medKit+, and CD71highKit+ populations from wild type (WT)-phenylhydrazine (PHZ)-treated spleen cells after 48 hr of culture (N=3). (B) Representative images for burst forming unit-erythroid (BFU-E) and colony forming unit-monocyte/macrophage (CFU-M) colonies formed (day 5 after plating) from CD71low Kit+ cells, and colony forming unit-erythroid (CFU-E) colonies formed (day 2 after plating) from CD71medKit+ and CD71highKit+ cells. (C) Quantitation of CFU-E (day 2 after plating) colonies from CD71medKit+ and CD71highKit+ cells sorted from WT-PHZ-treated spleen cells after 48 hr of culture (N=9). (D) Experimental layout of gene expression analysis on ex vivo PHZ treated Samd14-Enh-/- spleen post-SCF stimulation (1h, 10ng/ml). (E) Quantitation of relative Kit primary transcript levels in the presence and absence of SCF (1h, 10ng/ml) in PHZ-treated Samd14-Enh-/- spleen infected with EV, HA-tagged Samd14, and Samd14 ΔCPB (N=3).
Figure 6
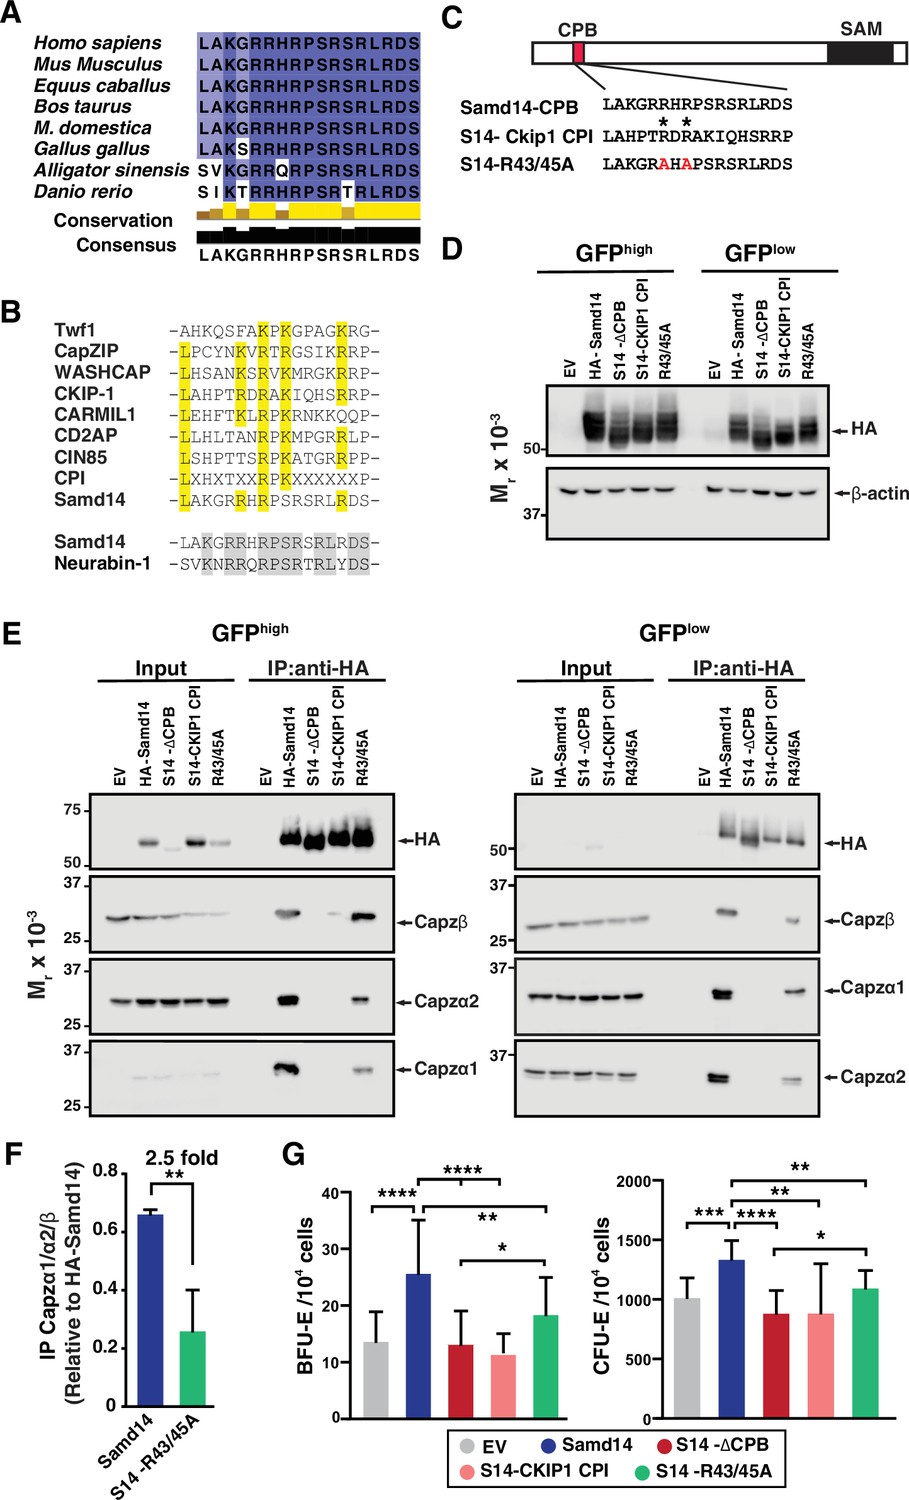
Atypical capping protein interaction (CPI) domain of sterile alpha motif domain 14 (Samd14) conferring stress erythroid precursor activity.
(A) Sequence alignment of the capping protein binding (CPB) domain of Samd14 among vertebrate species. Aligned using Clustal Omega and visualized with JalView. Yellow bars in conservation plot represents evolutionary conservation. (B) Sequence alignment of the capping protein interaction (CPI) motif in other proteins with Samd14 CPB domain. Yellow color indicates conserved residues among the different CPI motifs. (C) Schematic representation of chimeric and mutated CPB domain Samd14 constructs. (D) Western blot of GFP-sorted G1E-ΔEnh cells expressing empty vector (EV), hemagglutinin (HA)-Samd14, Samd14-∆CPB, Samd14(S14)-Ckip1-CPI, or Samd14-R43/45 A stained with anti-HA. HA and β-actin (E) Western blot analysis of Capzα1, Capzα2, and Capzβ co-immunoprecipitated (IPed) following pull-down of EV, HA-tagged Samd14, Samd14-∆CPB, Samd14(S14)-Ckip1-CPI and Samd14-R43/45 A with anti-HA agarose beads from retrovirally infected G1E-ΔEnh cells. (F) Densitometry analysis of the relative CapZ co-IPed with either HA-Samd14 or HA-S14-R43/45 R. (G) Quantitation of GFP+ colony forming unit-erythroid (CFU-E) (N=9) and burst forming unit-erythroid (BFU-E) (N=17) colonies formed in spleen progenitors retrovirally infected with EV, HA-tagged Samd14, Samd14-∆CPB, Samd14(S14)-Ckip1-CPI, and Samd14-R43/45 A. Error bars represent SD. *p<0.05; **p<0.01; ***p<0.001; ****p<0.0001 (two-tailed unpaired Student’s t test).
-
Figure 6—source data 1
Source Western blot images for Figure 6.
- https://cdn.elifesciences.org/articles/76497/elife-76497-fig6-data1-v2.zip
Figure 7 with 1 supplement

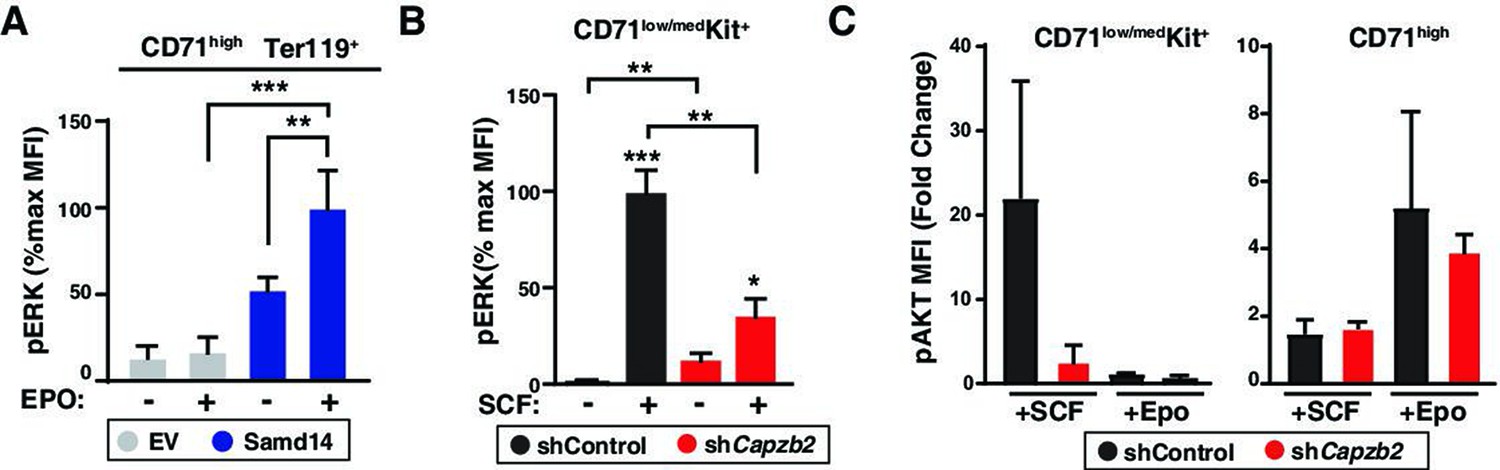
Sterile alpha motif domain 14 (Samd14) increases erythropoietin (Epo) signaling independent of capping protein (CP) complex interaction.
(A) Quantitation of pAKT MFI in GFP+CD71highTer119+ retrovirally infected Samd14ΔEnh/ΔEnh spleen cells expressing empty vector (EV), hemagglutinin (HA)-Samd14 or Samd14-∆CPB at 10 min post-Epo (5 U/ml) stimulation (N=7). (B) Flow cytometry gating to analyze infected (GFP+) phenylhydrazine (PHZ)-treated cells expressing shControl or shCapzb2 based on CD71low/med and CD71high; representative histograms depict pERK1/2 fluorescence in GFP+CD71low/medKit+ cells after stem cell factor (SCF) stimulation (10 ng/ml, 5 min) and GFP+CD71high cells after Epo stimulation (10 min, 5 U/ml). (C) Quantitation of pERK1/2 MFI after SCF (5 min, 10 ng/ml) or Epo (10 min, 5 U/ml) stimulation in GFP+CD71+Kit+ and GFP+CD71high spleen cells expressing shControl or shCapzb2 (N=3). (D) CD71low cells are SCF-responsive but Samd14-insensitive, CD71med are SCF-responsive and Samd14-sensitive, and CD71high cells are unresponsive to SCF. CD71low/med cells responding to SCF do not respond to Epo stimulation, whereas the CD71high cells are Epo dependent and Samd14-sensitive. (E) Samd14-CP interaction promotes burst forming unit-erythroid (BFU-E) colony formation, SCF/Kit and Epo/EpoR signaling by phosphorylating ERK1/2 and AKT in PHZ-treated spleen cells, in the absence of the Samd14-CP interaction PHZ-treated spleen cells fails to promote SCF/Kit signaling, but Epo signaling remains unaffected. Error bars represent SD. *p<0.05; **p<0.01; ***p<0.001; ****p<0.0001 (two-tailed unpaired Student’s t test).
Figure 7—figure supplement 1
Samd14-CP enhances SCF/Kit signaling.
(A) Quantitation of pERK median fluorescence intensity (MFI) in GFP+CD71highTer119+ retrovirally infected Samd14-(deltasymbolEnh/DeltasymbolEnh) spleen cells with either EV or HA-Samd14 at 10 min post-erythropoietin (Epo) (5 U/ml) stimulation (N=3). (B) Quantitation of pERK median fluorescence intensityMFI on SCF (5 mins, 10 ng/ml) in GFP+CD71low/medKit+ retrovirally infected wild type (WT) spleen cells with shControl or shZb2 (N=3). (C) Quantitation of pAKT MFI on SCF (5 mins, 10 ng/ml) or Epo (10 mins, 5 U/ml) stimulation in GFP+CD71low/medKit+ and GFP+CD71high retrovirally infected WT spleen cells with shControl or shCapzb2 (N=3). Error bars represent the standard deviation (SD). *p<0.05; **p<0.01; ***p<0.001 (two-tailed unpaired Student’s t test).
Tables
Key resources table
| Reagent type (species) or resource | Designation | Source or reference | Identifiers | Additional information |
|---|---|---|---|---|
| Gene (Mus musculus) | Samd14 | GenBank | Gene ID: NM_146025.2 | |
| Genetic reagent (Mus musculus) | Wild type (C57BL/6 J) | Jackson Laboratory | Strain #:000664 | |
| Genetic reagent (Mus musculus) | Samd14-Enh-/- | PMID:28787589 | ||
| Cell line (Mus msculus) | G1E | PMID:9032291 | Gift from M. Weiss | |
| Antibody | anti-Samd14 (rabbit polyclonal) | PMID:28787589 | Bresnick lab | WB (1:2000) IP (5 µg) |
| Antibody | anti-HA (rabbit monoclonal) | Cell Signaling Technology | Cat.: #3724; RRID:AB_1549585 | WB (1:2000) |
| Antibody | anti-capzα1 (rabbit polyclonal) | ThermoFisher | Cat.: #PA5-31026 RRID: AB_2548500 | WB (1:1000) |
| Antibody | anti-capzα2 (rabbit polyclonal) | ThermoFisher | Cat.: PA5-29982; RRID: AB_2547456 | WB (1:1000) |
| Antibody | anti-capzβ (mouse monoclonal) | Santa Cruz Biotechnology | Cat.: #sc-136502; RRID:AB_10610091 | WB (1:1000) |
| Antibody | anti-capzβ (rabbit polyclonal) | Bethyl Lab | Cat.: #A304-734A-M | WB (1:1000) |
| Antibody | Mouse anti-Rabbit IgG (Light-Chain Specific) | Cell Signaling Technology | Cat.: #93702; RRID:AB_2800208 | WB (1:500) |
| Antibody | anti-phospho (S473)-AKT (p-AKT) (rabbit monoclonal) | Cell Signaling Technology | Cat.: #4060; RRID:AB_2315049 | FC (1:100) |
| Antibody | anti-phospho (Thr202/Tyr204) p44/42 ERK1/2 (p-ERK) (rabbit monoclonal) | Cell Signaling Technology | Cat.: #9101; RRID:AB_331646 | FC (1:100) |
| Antibody | APC-goat anti rabbit IgG | Jackson ImmunoResearch | Cat.: #111-136-144; RRID:AB_2337987 | FC (1:200) |
| Antibody | PE/Cyanine7(PECy7) anti mouse CD117 (c-Kit) (rat monoclonal) | Biolegend | Cat.: #105,814 | FC (1:200) |
| Antibody | APC anti-mouse Ter119 (rat monoclonal) | Biolegend | Cat.: #116,211 | FC (1:200) |
| Antibody | PE-anti mouse CD71 (rat monoclonal) | Biolegend | Cat.: #113,807 | FC (1:200) |
| Commercial assay/kit | MojoSort Streptavidin Nanobeads | Biolegend | Cat.: #480,016 | FC (1:200) |
| Antibody | APC anti-mouse Ki-67 (rat monoclonal) | Biolegend | Cat.: #652,406 | FC (1:200) |
| Peptide, recombinant protein | Pacific Blue Annexin V | Biolegend | Cat: #640,917 | FC (1:50) |
| Antibody | anti-rabbit IgG isotype | Invitrogen | Cat: #10,500 C | IP (5 µg) |
| Recombinant DNA reagent | pMSCV PIG (plasmid) | Addgene | Plasmid #21654; RRID:Addgene_21654 | |
| Peptide, recombinant protein | Recombinant mouse SCF protein | R&D Systems | Cat.: #455-MC-050 | |
| Chemical compound, drug | Phenylhydrazine | Sigma Aldrich | P26252 | |
| Software, algorithm | Flowjo 10.6.2 | https://www.flowjo.com/solutions/flowjo. | RRID:SCR_008520 | |
| Software, algorithm | Fiji | https://imagej.net/software/fiji/ | ||
| Software, algorithm | GraphPad Prism | https://www.graphpad.com/ | RRID:SCR_002798 |
-
SCF: stem cell factor; Samd14-Enh-/-: sterile alpha motif domain 14-enhancer.
Additional files
-
Transparent reporting form
- https://cdn.elifesciences.org/articles/76497/elife-76497-transrepform1-v2.docx
-
Supplementary file 1
Samd14-interacting proteins.
Mass spectrometry analysis of IP protein in EV and Samd14 conditions (N=3). Spectral count of each protein, as determined by Scaffold. Statistical significance between EV and HA-Samd14 conditions determined by Scaffold.
- https://cdn.elifesciences.org/articles/76497/elife-76497-supp1-v2.xlsx
Download links
A two-part list of links to download the article, or parts of the article, in various formats.
Downloads (link to download the article as PDF)
Open citations (links to open the citations from this article in various online reference manager services)
Cite this article (links to download the citations from this article in formats compatible with various reference manager tools)
Functional requirements for a Samd14-capping protein complex in stress erythropoiesis
eLife 11:e76497.
https://doi.org/10.7554/eLife.76497


